

Ligand-Based Design of Novel Quinoline Derivatives as Potential Anticancer Agents: An In-Silico Virtual Screening Approach
 ,
,  , , , and
Abstract
1. Introduction
2. Results and Discussions
2.1. Molecular Alignment
2.2. Comparative Molecular Field Analysis
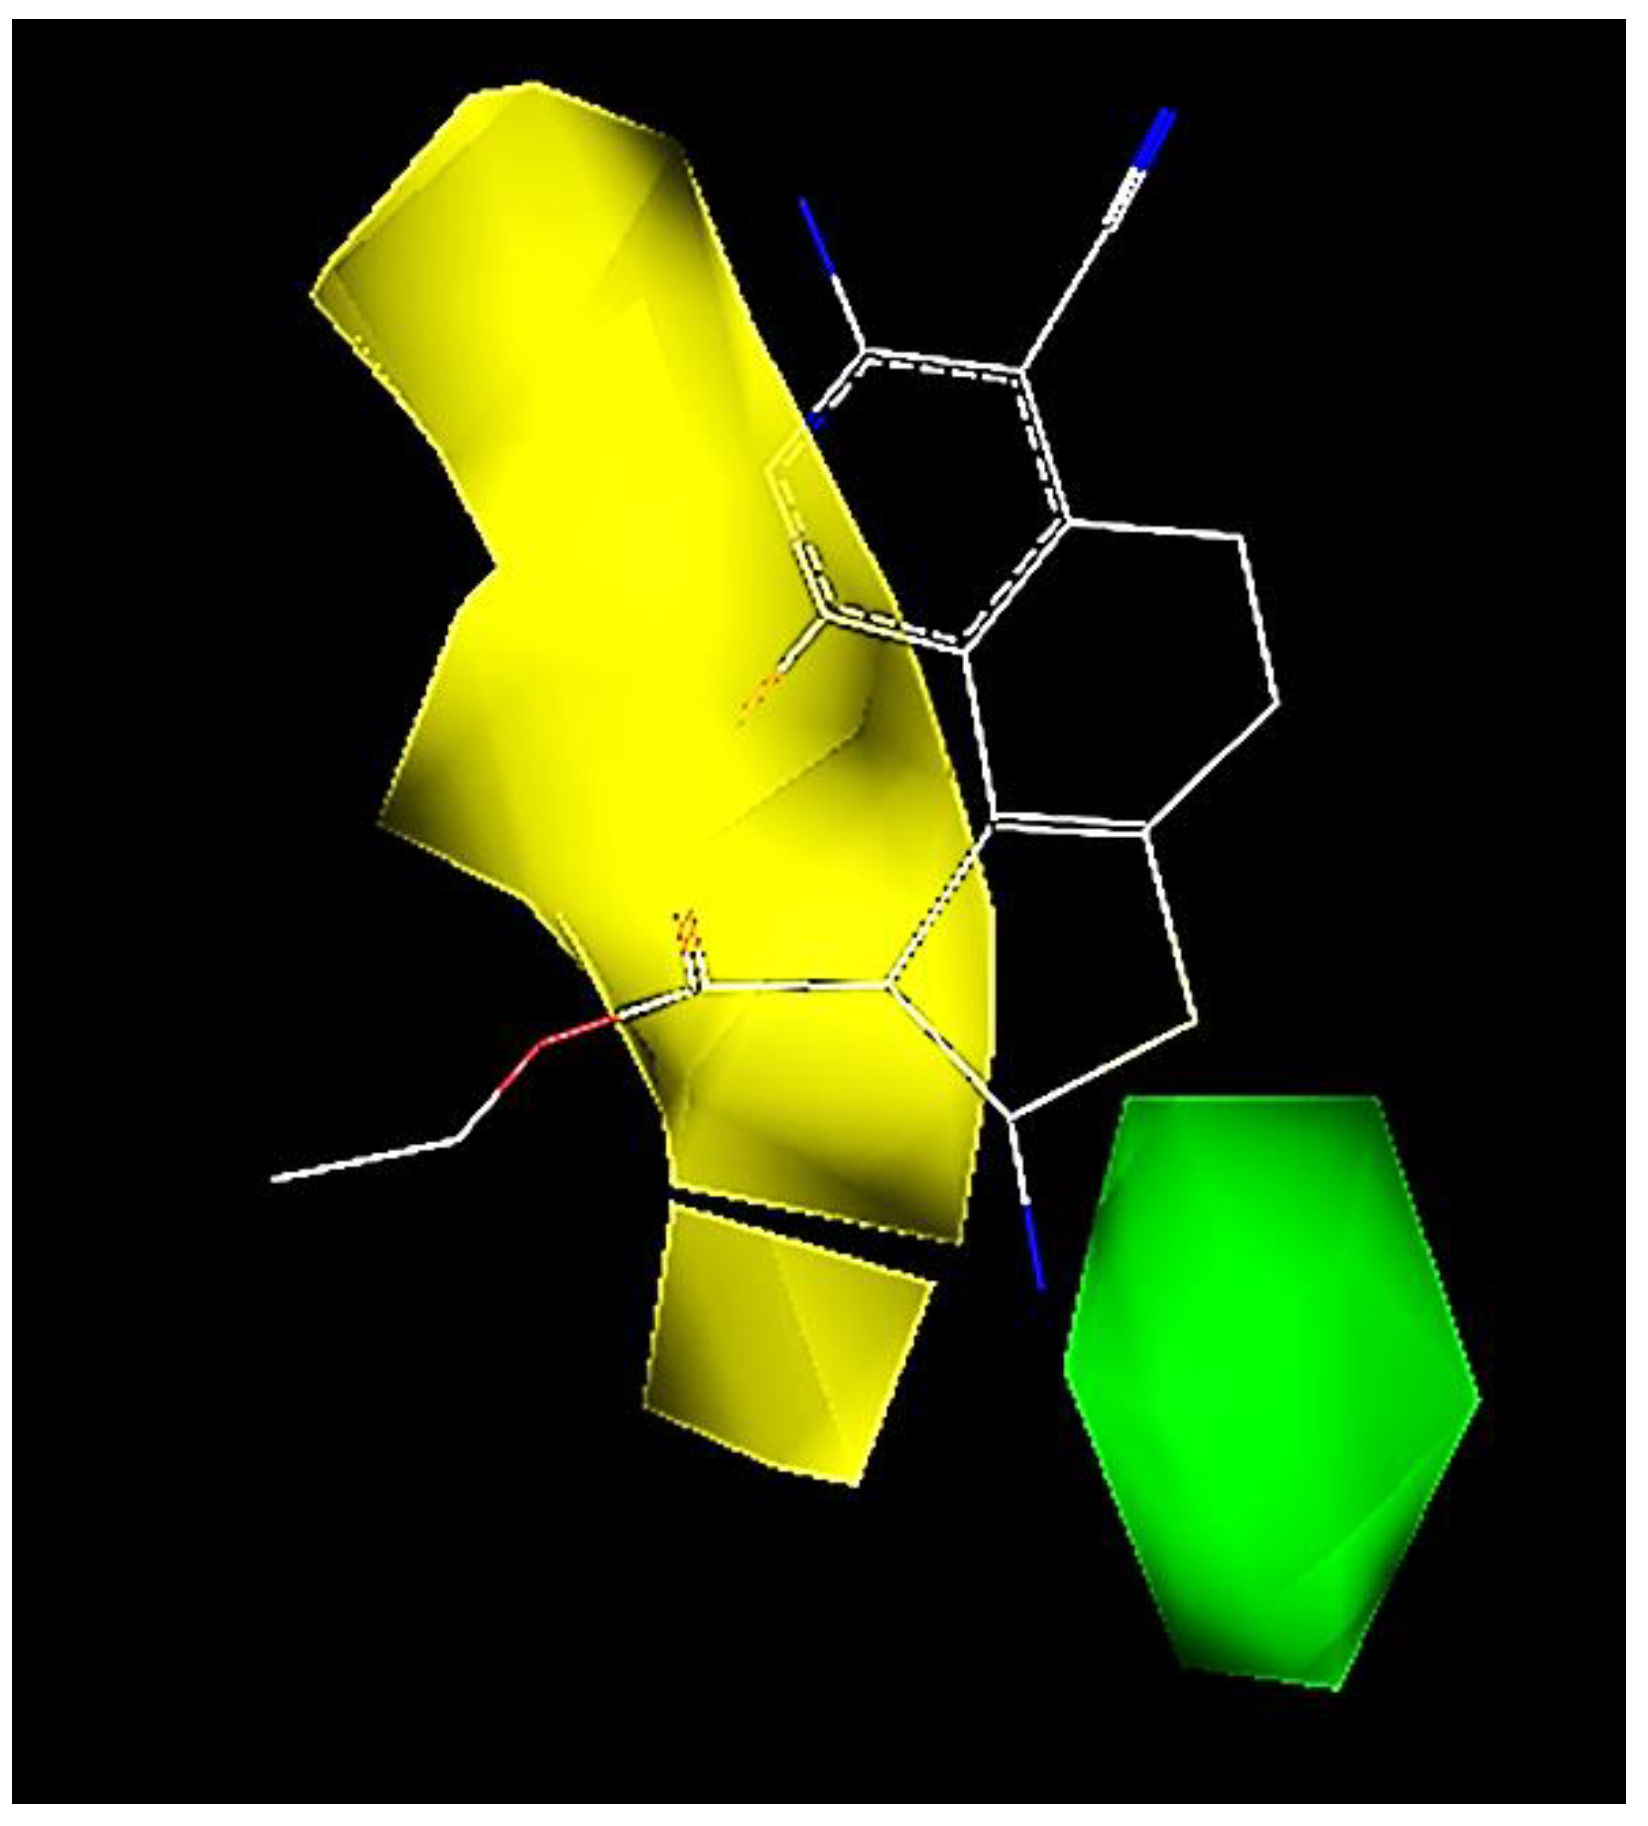
2.3. CoMFA Contour Map Analysis
2.4. Y-Randomization Test
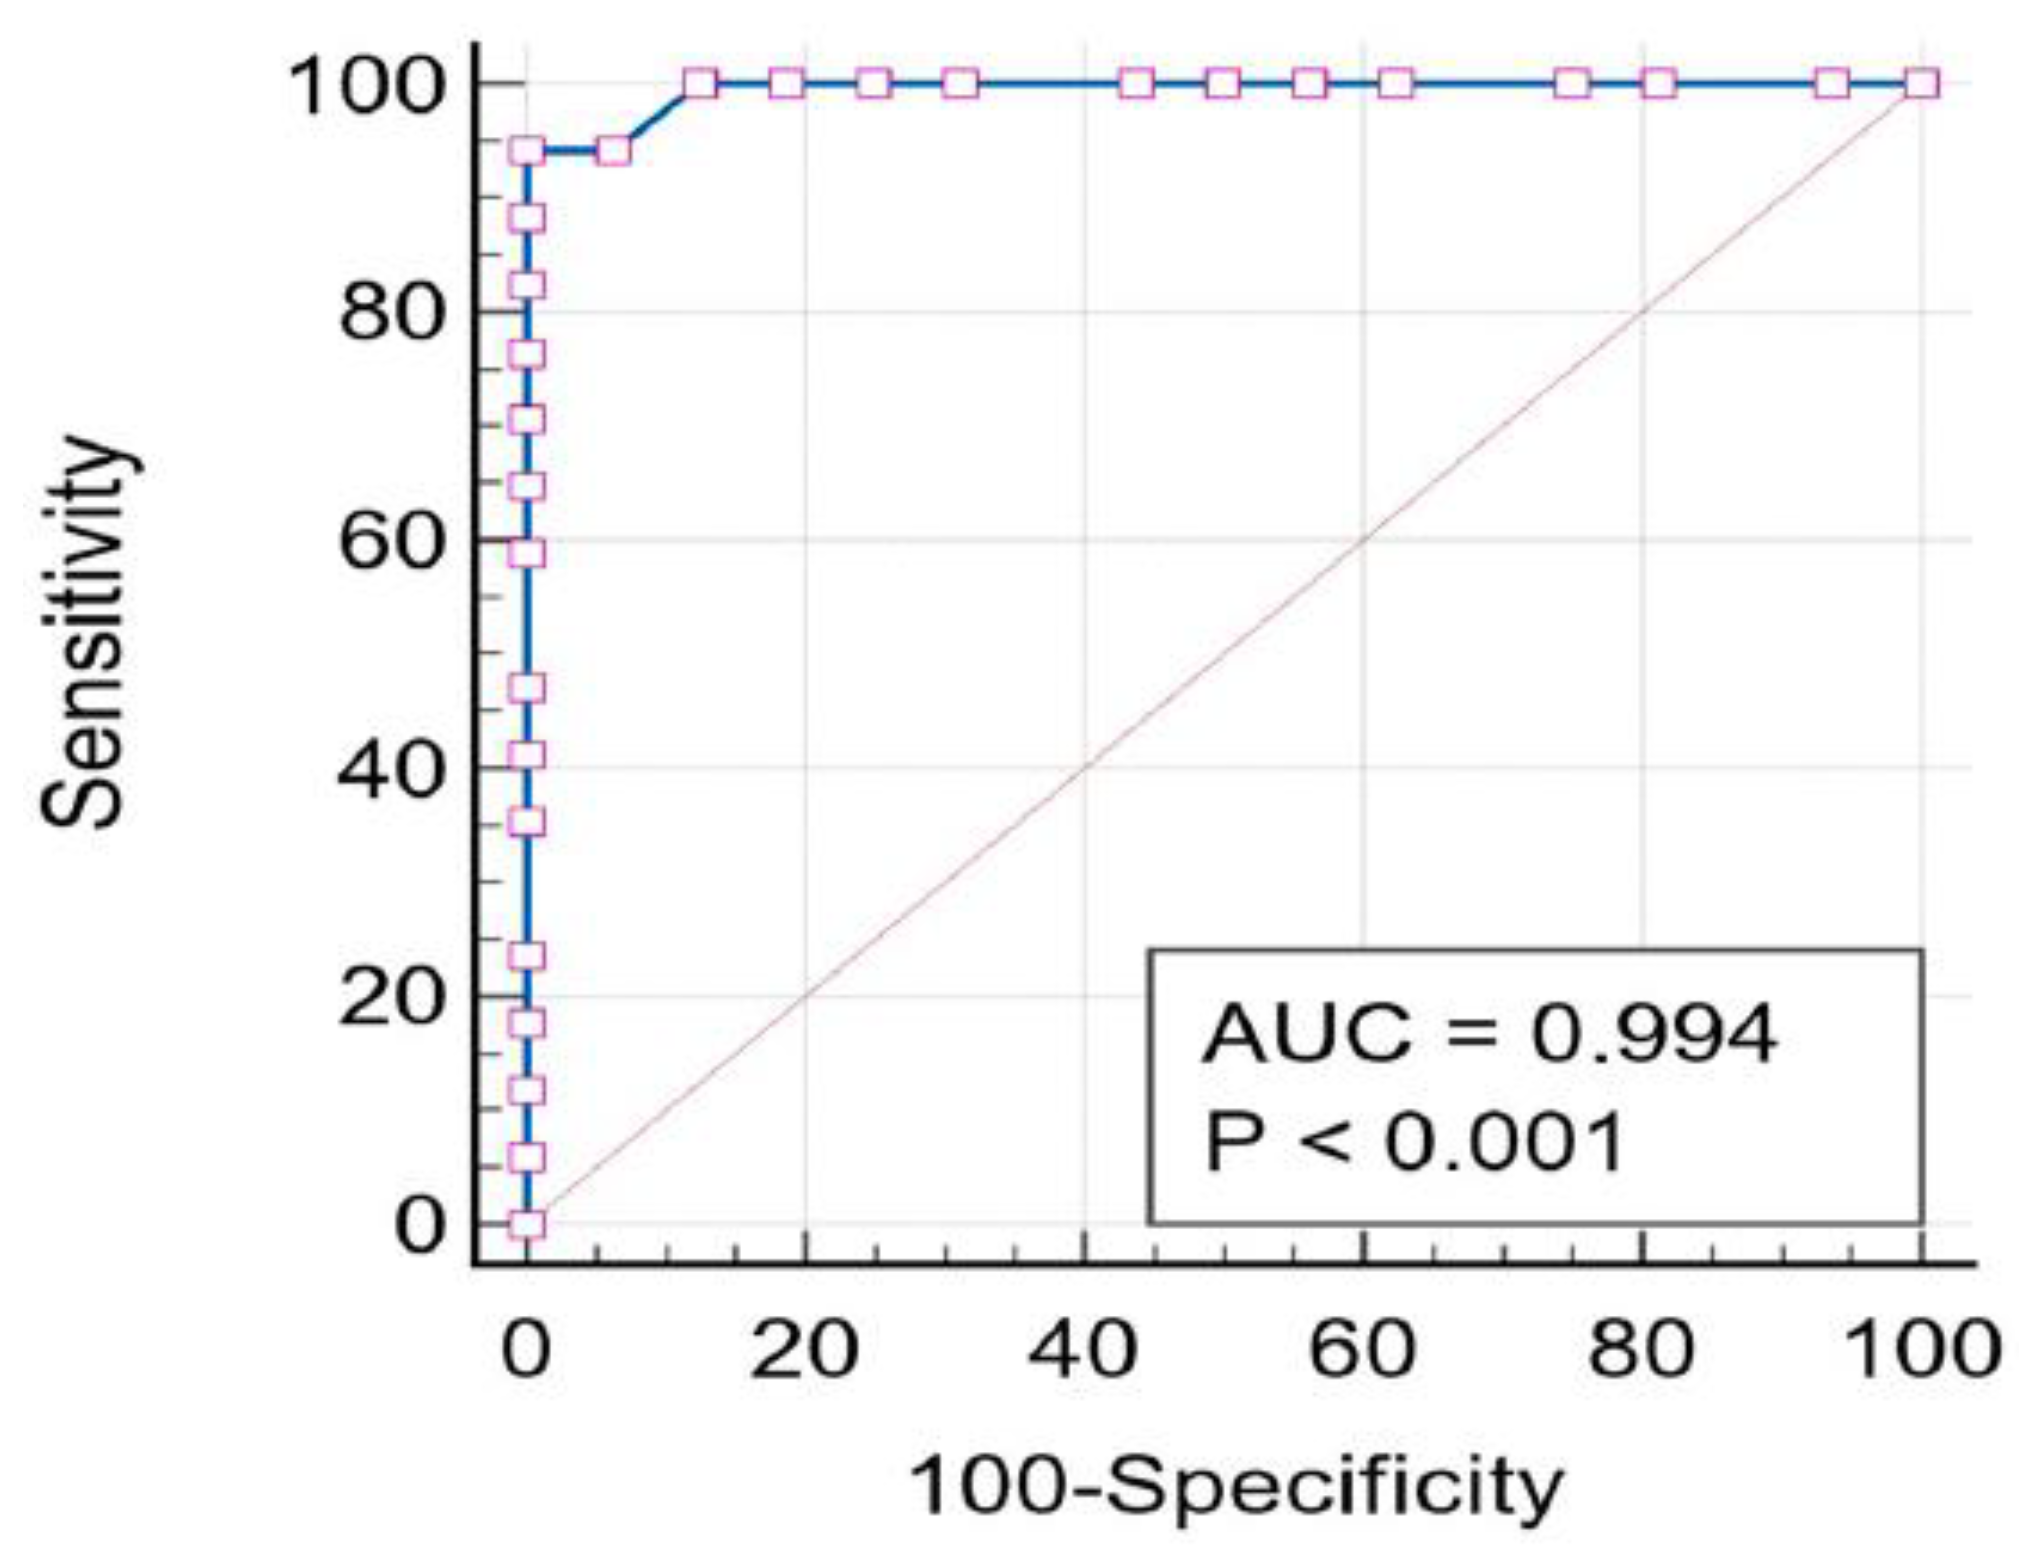
2.5. ROC-AUC Analysis
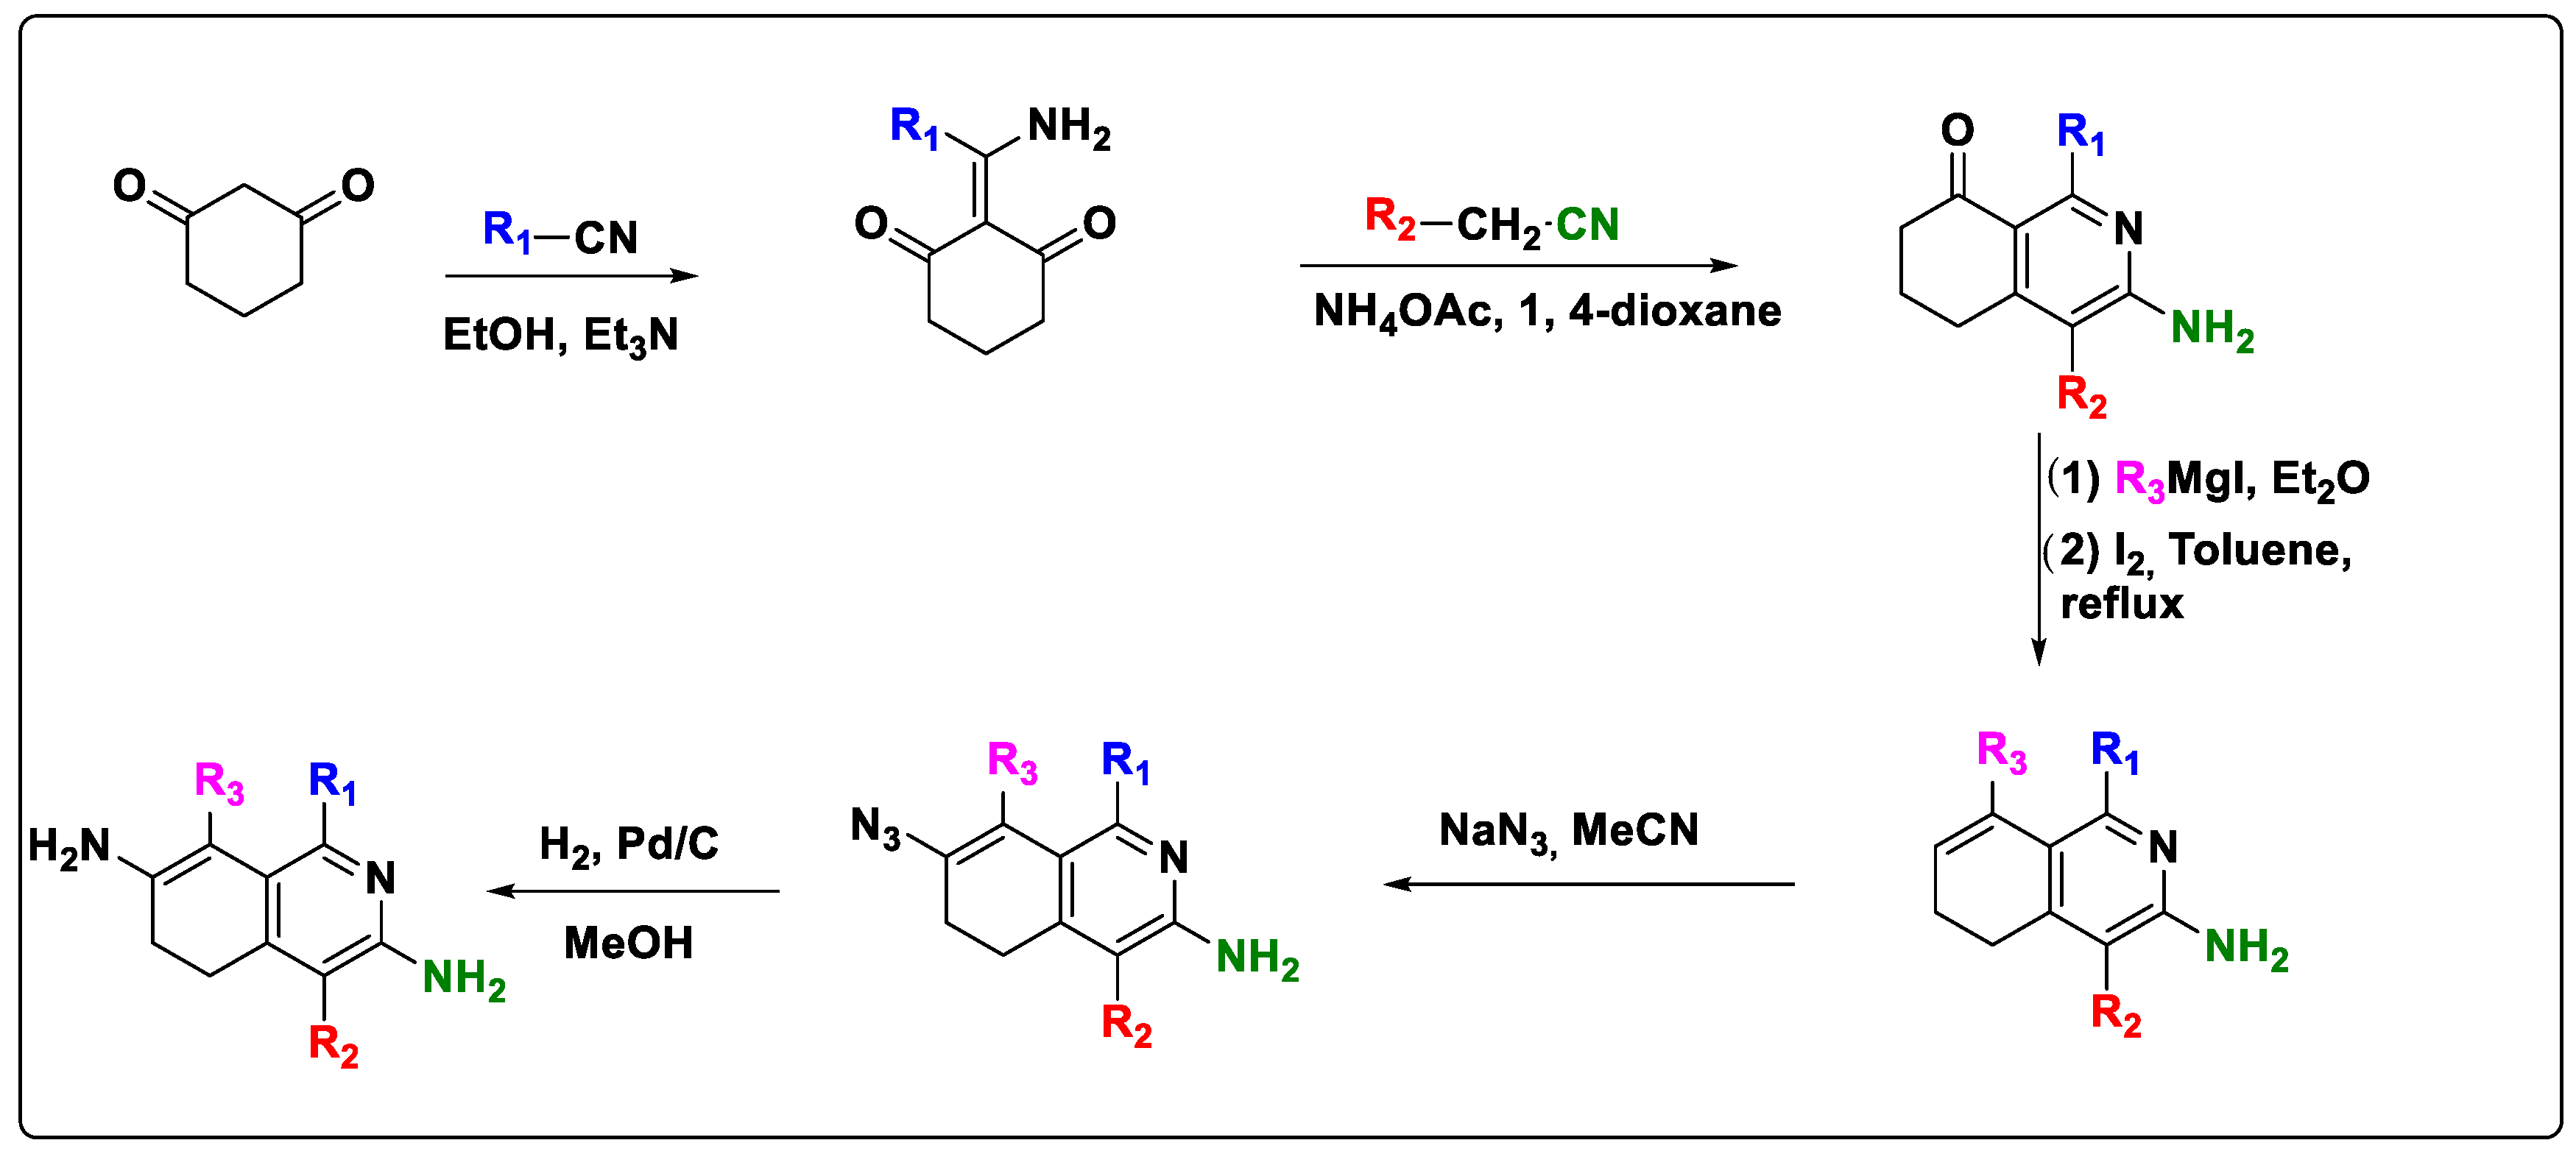
2.6. Design of New Quinoline-Based Ligands
2.7. POM Results
2.8. Molecular Docking Results
2.9. Molecular Dynamics Simulations
2.10. MM/GBSA Free Energy Calculation
3. Materials and Methods
3.1. Focused Chemical Library
3.2. Molecular Modelling
3.3. 3D-QSAR Modeling
3.4. PLS Analysis and Validations
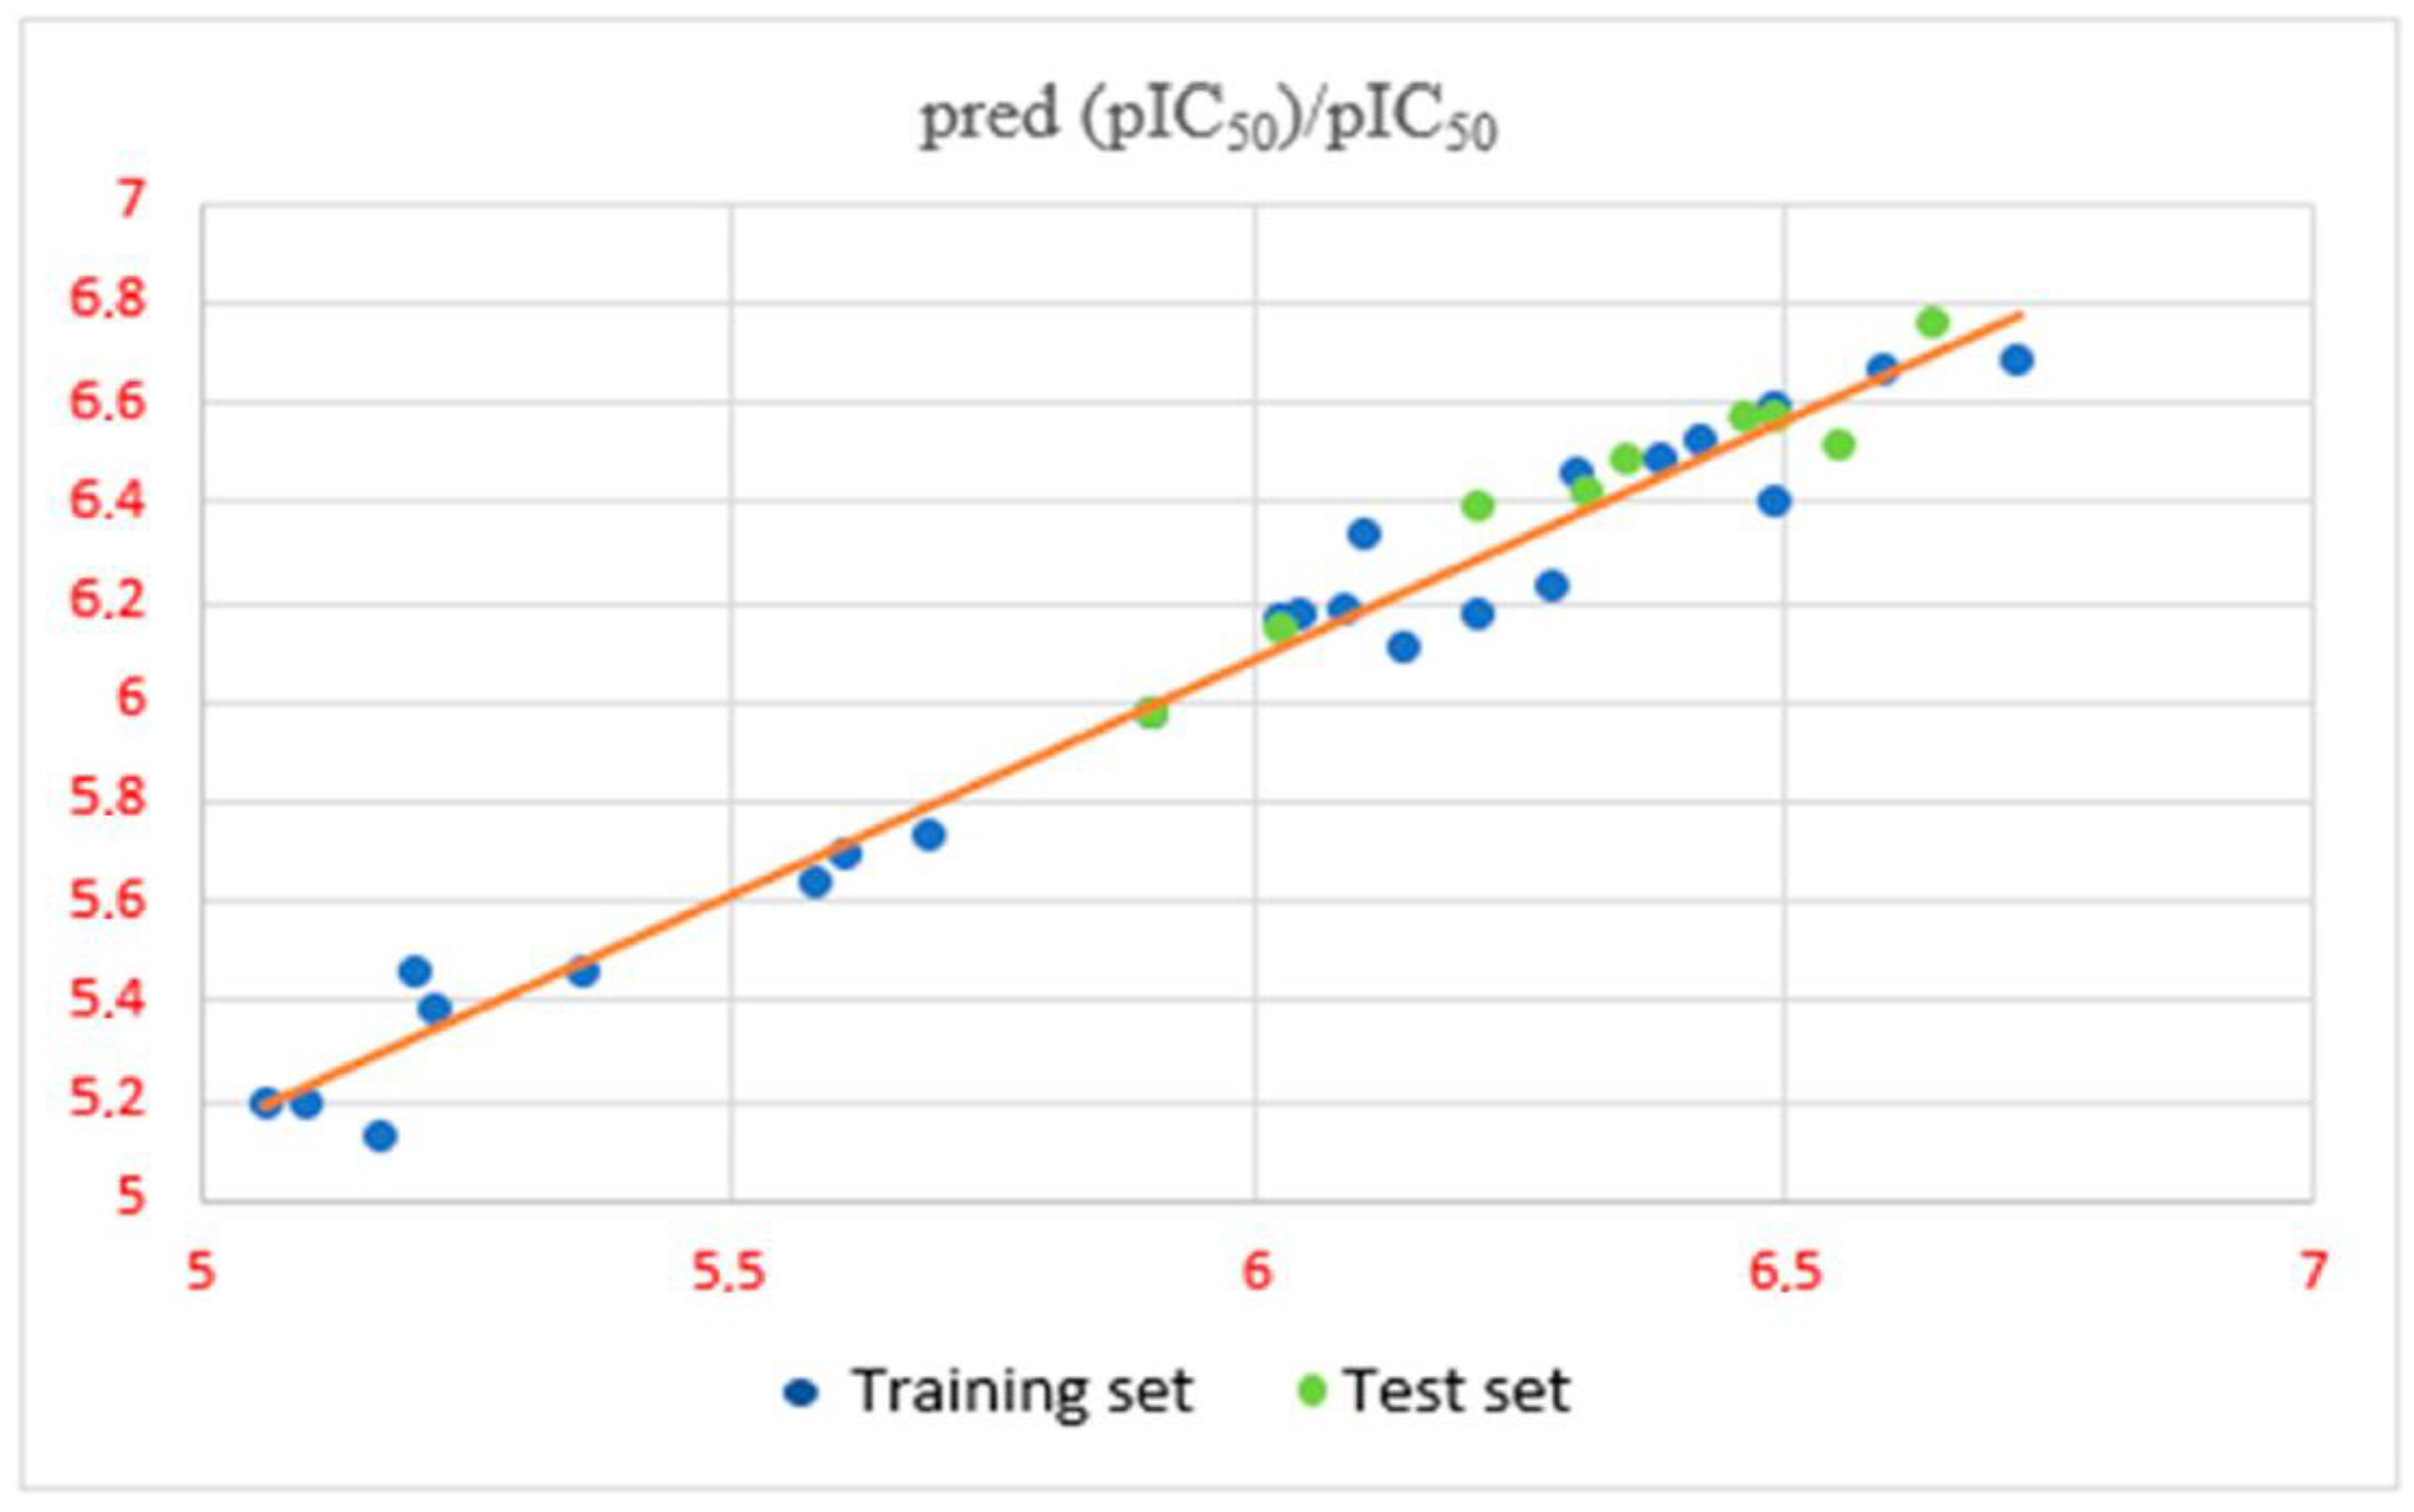
3.5. Validation and Predictive Power of 3D-QSAR Model
3.6. Y-Randomization Test
3.7. ROC-AUC Analysis
3.8. POM Analysis
3.8.1. Petra
3.8.2. Osiris
3.8.3. Molinspiration
3.9. Molecular Docking
3.10. Molecular Dynamic
3.11. Molecular Mechanics-Generalized Born Surface Area (MM-GBSA)
4. Conclusions
Author Contributions
Funding
Institutional Review Board Statement
Data Availability Statement
Acknowledgments
Conflicts of Interest
References
- Daoui, O. QSAR Modeling, Pharmacokinetics and Molecular Docking Investigations of Novel Neocryptolepine Derivatives as Hits against HepG2 Cells. RHAZES Green Appl. Chem. 2022, 16, 46–62. Available online: https://www.researchgate.net/publication/364946307_QSAR_modeling_pharmacokinetics_and_molecular_docking_investigations_of_novel_Neocryptolepine_derivatives_as_Hits_against_HepG2_Cells (accessed on 24 October 2023).
- Mkhayar, K.; Daoui, O.; Elkhattabi, S.; Chtita, S.; Elkhalabi, R. QSAR Study and Molecular Docking Assisted Design of Novel Cyclohexane-1,3-Dione Derivatives as Anticancer Agents for Non-Small Cell Lung Cancer. Biointerface Res. Appl. Chem. 2023, 13, 524. [Google Scholar]
- Mohana Roopan, S.; Sompalle, R. Synthetic Chemistry of Pyrimidines and Fused Pyrimidines: A Review. Synth. Commun. 2016, 46, 645–672. [Google Scholar] [CrossRef]
- Daoui, O.; Mkhayar, K.; Elkhatabi, S.; Chtita, S.; Zgou, H.; Elkhalabi, K. Design of Novel Carbocycle-Fused Quinoline Derivatives as Potential Inhibitors of Lymphoblastic Leukemia Cell Line MOLT-3 Using 2D-QSAR and ADME-Tox Studies. RHAZES Green Appl. Chem. 2022, 14, 36–61. [Google Scholar] [CrossRef]
- Rajesh, Y.B.R.D. Quinoline Heterocycles: Synthesis and Bioactivity; IntechOpen: London, UK, 2018; ISBN 978-1-83880-624-8. [Google Scholar]
- Ferraris, D.; Yang, Z.; Welsbie, D. Dual Leucine Zipper Kinase as a Therapeutic Target for Neurodegenerative Conditions. Future Med. Chem. 2013, 5, 1923–1934. [Google Scholar] [CrossRef]
- Silvestroni, A.; Jewell, K.A.; Lin, W.-J.; Connelly, J.E.; Ivancic, M.M.; Tao, W.A.; Rajagopal, L. Identification of Serine/Threonine Kinase Substrates in the Human Pathogen Group B Streptococcus. J. Proteome Res. 2009, 8, 2563–2574. [Google Scholar] [CrossRef]
- Annunziata, M.C.; Parisi, M.; Esposito, G.; Fabbrocini, G.; Ammendola, R.; Cattaneo, F. Phosphorylation Sites in Protein Kinases and Phosphatases Regulated by Formyl Peptide Receptor 2 Signaling. Int. J. Mol. Sci. 2020, 21, 3818. [Google Scholar] [CrossRef]
- Gully, C.P.; Zhang, F.; Chen, J.; Yeung, J.A.; Velazquez-Torres, G.; Wang, E.; Yeung, S.-C.J.; Lee, M.-H. Antineoplastic effects of an Aurora B kinase inhibitor in breast cancer. Mol. Cancer 2010, 9, 42. Available online: https://molecular-cancer.biomedcentral.com/articles/10.1186/1476-4598-9-42 (accessed on 23 October 2023). [CrossRef]
- El Mchichi, L.; El Aissouq, A.; Kasmi, R.; Belhassan, A.; El-Mernissi, R.; Ouammou, A.; Lakhlifi, T.; Bouachrine, M. In silico design of novel Pyrazole derivatives containing thiourea skeleton as anti-cancer agents using: 3D QSAR, Drug-Likeness studies, ADMET prediction and molecular docking. Mater. Today Proc. 2021, 45, 7661–7674. Available online: https://www.researchgate.net/publication/350529835_In_silico_design_of_novel_Pyrazole_derivatives_containing_thiourea_skeleton_as_anti-cancer_agents_using_3D_QSAR_Drug-Likeness_studies_ADMET_prediction_and_molecular_docking (accessed on 4 November 2022). [CrossRef]
- Mchichi, L.E.; Aouidate, A.; Chokrafi, F.Z.; Ghaleb, A.; Khalil, F.; Lakhlifi, T.; Bouachrine, M. Prediction of Biological Activity of Pyrazolo [3, 4-B] Quinolinyl Acitamide by Qsar Results. RHAZES Green Appl. Chem. 2018, 3, 79–93. [Google Scholar] [CrossRef]
- Cramer, R.D.; Bunce, J.D.; Patterson, D.E.; Frank, I.E. Crossvalidation, Bootstrapping, and Partial Least Squares Compared with Multiple Regression in Conventional QSAR Studies. Quant. Struct. Relatsh. 1988, 7, 18–25. Available online: https://onlinelibrary.wiley.com/doi/10.1002/qsar.19880070105 (accessed on 4 November 2022). [CrossRef]
- Ertl, P.; Rohde, B.; Selzer, P. Fast Calculation of Molecular Polar Surface Area as a Sum of Fragment-Based Contributions and Its Application to the Prediction of Drug Transport Properties. J. Med. Chem. 2000, 43, 3714–3717. [Google Scholar] [CrossRef] [PubMed]
- Roy, K.; Mitra, I. On Various Metrics Used for Validation of Predictive QSAR Models with Applications in Virtual Screening and Focused Library Design. Comb. Chem. High Throughput Screen 2011, 14, 450–474. [Google Scholar] [CrossRef]
- Anderson, B. Schrödinger Release 2017: Protein Preparation Wizard; Epik; Prime, Schrodinger LLC.: New York, NY, USA, 2017. [Google Scholar]
- Uddin, N.; Sirajuddin, M.; Uddin, N.; Tariq, M.; Ullah, H.; Ali, S.; Tirmizi, S.A.; Khan, A.R. Synthesis, spectroscopic characterization, biological screenings, DNA binding study and POM analyses of transition metal carboxylates. Spectrochim. Acta Part A Mol. Biomol. Spectrosc. 2015, 140, 563–574. Available online: https://www.semanticscholar.org/paper/Synthesis%2C-spectroscopic-characterization%2C-DNA-and-Uddin-Sirajuddin/067fde7de2110ae65ad667b3c120fc9fbbe5dd9c (accessed on 9 November 2022). [CrossRef]
- Mohareb, R.M.; Ibrahim, R.A.; Elmetwally, A.M.; Gamaan, M.S. Synthesis of Fused Quinoline Derivatives With Antiproliferative Activities and Tyrosine Kinases, Pim-1 Kinase Inhibitions. Acta Chim. Slov. 2022, 69, 13–29. [Google Scholar] [CrossRef] [PubMed]
- Clark, M.; Cramer III, R.D.; Van Opdenbosch, N. Validation of the General Purpose Tripos 5.2 Force Field. J. Comput. Chem. 1989, 10, 982–1012. [Google Scholar] [CrossRef]
- Daoui, O.; Elkhattabi, S.; Chtita, S. Design and Prediction of ADME/Tox Properties of Novel Magnolol Derivatives as Anticancer Agents for NSCLC Using 3D-QSAR, Molecular Docking, MOLCAD and MM-GBSA Studies. Lett. Drug Des. Discov. 2022, 20, 545–569. [Google Scholar] [CrossRef]
- Aouidate, A. 3D QSAR and Molecular Docking Study of Benzomaide Derivatives as Potent Inhibitors of Btk Kinase. RHAZES Green Appl. Chem. 2018, 1, 77–91. Available online: https://revues.imist.ma/index.php/RHAZES/article/view/16444 (accessed on 7 November 2022).
- Verma, J.; Khedkar, V.M.; Coutinho, E.C. 3D-QSAR in Drug Design—A Review: Ingenta Connect. Curr. Top. Med. Chem. 2010, 10, 95–115. Available online: https://www.ingentaconnect.com/content/ben/ctmc/2010/00000010/00000001/art00009 (accessed on 3 November 2022). [CrossRef]
- Kubinyi, H. Comparative Molecular Field Analysis (CoMFA). Available online: https://onlinelibrary.wiley.com/doi/10.1002/0470845015.cca030 (accessed on 9 September 2023).
- Mkhayar, K.; Haloui, R.; Daoui, O.; Elkhattabi, K.; Chtita, S.; Elkhattabi, S. In Silico Studies of 2-Aryloxy-1,4-Naphthoquinone Derivatives as Antibacterial Agents against Escherichia coli Using 3D-QSAR, ADMET Properties, Molecular Docking, and Molecular Dynamics. Chem. Data Collect. 2023, 47, 101060. [Google Scholar] [CrossRef]
- Bush, B.L.; Nachbar, R.B. Sample-distance partial least squares: PLS optimized for many variables, with application to CoMFA. J. Comput. Mol. Des. 1993, 7, 587–619. Available online: https://link.springer.com/article/10.1007/BF00124364 (accessed on 3 November 2022). [CrossRef] [PubMed]
- Khaldan, A. 3D QSAR Modeling and Molecular Docking Studies on a Series of Quinolone-Triazole Derivatives as Antibacterial Agents. RHAZES Green Appl. Chem. 2019, 6, 11–26. [Google Scholar] [CrossRef]
- Klebe, G.; Abraham, U.; Mietzner, T. Molecular Similarity Indices in a Comparative Analysis (CoMSIA) of Drug Molecules to Correlate and Predict Their Biological Activity. J. Med. Chem. 1994, 37, 4130–4146. [Google Scholar] [CrossRef] [PubMed]
- Rücker, C.; Rücker, G.; Meringer, M. Y-Randomization and Its Variants in QSPR/QSAR. J. Chem. Inf. Model. 2007, 47, 2345–2357. [Google Scholar] [CrossRef] [PubMed]
- Zhang, X.; Mao, J.; Li, W.; Koike, K.; Wang, J. Improved 3D-QSAR Prediction by Multiple-Conformational Alignment: A Case Study on PTP1B Inhibitors. Comput. Biol. Chem. 2019, 83, 107134. [Google Scholar] [CrossRef] [PubMed]
- Bechlem, K.; Aissaoui, M.; Belhani, B.; Rachedi, K.O.; Bouacida, S.; Bahadi, R.; Djouad, S.-E.; Ben Mansour, R.; Bouaziz, M.; Almalki, F.; et al. Synthesis, X-Ray Crystallographic Study and Molecular Docking of New α-Sulfamidophosphonates: POM Analyses of Their Cytotoxic Activity. J. Mol. Struct. 2020, 1210, 127990. [Google Scholar] [CrossRef]
- Mabkhot, Y.N.; Alatibi, F.; El-Sayed, N.N.E.; Al-Showiman, S.; Kheder, N.A.; Wadood, A.; Rauf, A.; Bawazeer, S.; Hadda, T.B. Antimicrobial Activity of Some Novel Armed Thiophene Derivatives and Petra/Osiris/Molinspiration (POM) Analyses. Molecules 2016, 21, 222. [Google Scholar] [CrossRef]
- Sabet, R.; Fassihi, A.; Hemmateenejad, B.; Saghaei, L.; Miri, R.; Gholami, M. Computer-aided design of novel antibacterial 3-hydroxypyridine-4-ones: Application of QSAR methods based on the MOLMAP approach. J. Comput. Mol. Des. 2012, 26, 349–361. Available online: https://link.springer.com/article/10.1007/s10822-012-9561-2 (accessed on 24 October 2023). [CrossRef]
- Molecular Properties Prediction—Osiris Property Explorer. Available online: https://www.organic-chemistry.org/prog/peo/ (accessed on 25 November 2022).
- Molinspiration Cheminformatics. Available online: https://www.molinspiration.com/about.html (accessed on 2 November 2022).
- Verma, A. Lead finding from Phyllanthus debelis with hepatoprotective potentials. Asian Pac. J. Trop. Biomed. 2012, 2, S1735–S1737. Available online: https://www.sciencedirect.com/science/article/abs/pii/S2221169112604869 (accessed on 2 November 2022). [CrossRef]
- Systèmes Dassault. Free Download: BIOVIA Discovery Studio Visualizer. Available online: https://discover.3ds.com/discovery-studio-visualizer-download (accessed on 24 October 2023).
- mgl-admin Homepage. mgltools. Available online: https://ccsb.scripps.edu/mgltools/ (accessed on 20 September 2023).
- Daoui, O.; El Mouhi, R.; Faiçal, B.; Mkhayar, K.; Khattabi, S.; Chtita, S.; Elkhalabi, R.; Benjelloun, A. 3D-QSAR Modeling, Molecular Docking and Drug-like Properties Investigations of Novel Heterocyclic Compounds Derived from Magnolia Officinalis as Hit Compounds against NSCLC. Moroc. J. Chem. 2022, 10, 881–890. [Google Scholar] [CrossRef]
- Mkhayar, K.; El Khattabi, K.; Elkhalabi, R.; Haloui, R.; Daoui, O.; Edache, E.I.; Chtita, S.; Elkhattabi, S. Evaluation of Dimedone-Derived Compounds as Inhibitors against Human Colon Cancer: Insights from 2D-QSAR, ADMET Prediction, Osiris, Molinspiration, and Molecular Modeling. Chin. J. Anal. Chem. 2023, 51, 00330. [Google Scholar] [CrossRef]
- Hollingsworth, S.A.; Dror, R.O. Molecular Dynamics Simulation for All. Neuron 2018, 99, 1129–1143. [Google Scholar] [CrossRef] [PubMed]
- Pang, J.; Gao, S.; Sun, Z.; Yang, G. Discovery of Small Molecule PLpro Inhibitor against COVID-19 Using Structure-Based Virtual Screening, Molecular Dynamics Simulation, and Molecular Mechanics/Generalized Born Surface Area (MM/GBSA) Calculation. Struct. Chem. 2021, 32, 879–886. [Google Scholar] [CrossRef] [PubMed]
- Garg, A.; Shrivastava, S.K.; Paul, A.; Darokar, M.; Khanuja, S.; Khan, D. Novel Loganin Analogues and a Process for the Preparation Thereof. Patent EP1963349B1, 24 October 2012. [Google Scholar]
- Barret, R. Principes Fondamentaux de Chimie Thérapeutique: Médicaments, Propriétés Physico-Chimiques, Prodrogues, Pharmacophore; ISTE Group: London, UK, 2018; ISBN 978-1-78405-481-6. [Google Scholar]
- Hadda, T. Semantic Scholar. Available online: https://www.semanticscholar.org/author/T.-Hadda/3550127 (accessed on 9 November 2022).


| PLS Model | Statistical Parameters | Fractions | |||||
| R2 | Q2 | SEE | N | Rext2 | Ster | Elec | |
| CoMFA | 0.913 | 0.625 | 0.073 | 3 | 0.875 | 0.515 | 0.485 |
| Ligand | pIC50 Observed | pIC50 Predicted | Residuals | Ligand | pIC50 Observed | pIC50 Predicted | Residuals |
|---|---|---|---|---|---|---|---|
| In Vitro | In Silico | In Vitro | In Silico | ||||
| 3a | 5.1 | 5.2 | −0.1 | 21a | 5.69 | 5.73 | −0.04 |
| 3b | 5.61 | 5.7 | −0.09 | 21b * | 6.64 | 6.76 | −0.12 |
| 4a | 5.58 | 5.64 | −0.06 | 21c | 6.38 | 6.49 | −0.11 |
| 4b | 5.06 | 5.2 | −0.14 | 21d | 6.3 | 6.46 | −0.16 |
| 6a | 5.36 | 5.46 | −0,1 | 22a * | 5.9 | 5.98 | −0.08 |
| 6b | 6.6 | 6.49 | −0.14 | 22b | 5.9 | 5.98 | −0.08 |
| 7a | 5.22 | 5.38 | −0.16 | 22c | 6.72 | 6.69 | 0.03 |
| 7b * | 6.49 | 6.57 | −0.08 | 22d * | 6.46 | 6.57 | −0.11 |
| 10 | 5.2 | 5.46 | −0.26 | 24a | 6.02 | 6.17 | −0.15 |
| 12a | 5.17 | 5.13 | 0.04 | 24b | 6.08 | 6.19 | −0.11 |
| 12b * | 6.55 | 6.52 | 0.03 | 24c | 6.1 | 6.34 | −0.24 |
| 14 | 6.59 | 6.67 | −0.08 | 24d | 6.14 | 6.11 | 0.03 |
| 16 | 6.49 | 6.59 | −0.1 | 24e * | 6.21 | 6.39 | −0.18 |
| 18a | 6.04 | 6.18 | −0.14 | 24f | 6.42 | 6.53 | −0.11 |
| 18b * | 6.31 | 6.42 | −0.11 | 24g | 6.21 | 6.18 | 0.03 |
| 20a * | 6.02 | 6.15 | −0.13 | 24h | 6.49 | 6.4 | 0.09 |
| 20b | 6.28 | 6.23 | 0.05 | - | - | - | - |
| Iteration | CoMFA | |
|---|---|---|
| Q2 | r2 | |
| 1 | −0.37 | 0.84 |
| 2 | 0.23 | 0.68 |
| 3 | 0.10 | 0.72 |
| 4 | −0.3 | 0.84 |
| 5 | −0.03 | 0.59 |
| 6 | −0.22 | 0.82 |
| 7 | −0.27 | 0.83 |
| 8 | 0.16 | 0.72 |
| 9 | 0.25 | 0.71 |
| 10 | −0.33 | 0.65 |
| 11 | 0.291 | 0.55 |
| 12 | −0.05 | 0.58 |
| 13 | −0.15 | 0.54 |
| 14 | 0.08 | 0.61 |
| 15 | −0.12 | 0.63 |
 | 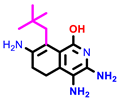 |  | |||
| 1 | pIC50 = 6.98 | 2 | pIC50 = 7.01 | 3 | pIC50 = 6.87 |
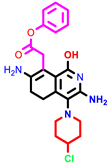 | 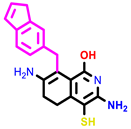 | 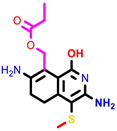 | |||
| 4 | pIC50 = 6.64 | 5 | pIC50 = 7.1 | 6 | pIC50 = 7.04 |
 | |||||
| 7 | pIC50 = 7.23 | ||||
| Ligands | MW | Toxicity Risks | Osiris Calculations | ||||||
|---|---|---|---|---|---|---|---|---|---|
| MUT | TUMO | IRR | REP | c-LogP | Logs | DL | DS | ||
| 1 | 345.0 |  |  |  |  | 2.58 | −4.7 | −2.62 | 0.38 |
| 2 | 262.0 |  |  |  |  | 1.53 | −3.57 | −5.06 | 0.44 |
| 3 | 289.0 |  |  |  |  | 2.19 | −4.18 | −2.61 | 0.42 |
| 4 | 352.0 |  |  |  |  | 1.09 | −3.68 | 2.4 | 0.49 |
| 5 | 337.0 |  |  |  |  | 2.55 | −5.81 | 1.23 | 0.3 |
| 6 | 323 |  |  |  |  | 1.46 | −3.9 | 4.46 | 0.33 |
| 7 | 278 |  |  |  |  | 0.93 | −2.48 | 1.6 | 0.54 |
| Non-toxic |  | ||||||||
| Ligands | Molinspiration Calculations | Drug-Likeness | ||||||||
|---|---|---|---|---|---|---|---|---|---|---|
| TPSA | NONH | NV | VOL | GPCRL | ICM | KI | NRL | PI | EI | |
| 1 | 118.99 | 3 | 1 | 459.83 | −0.42 | −0.71 | −0.65 | −0.71 | −0.48 | −0.14 |
| 2 | 111.19 | 5 | 1 | 254.94 | −0.22 | 0.3 | 0.02 | −0.96 | −0.31 | −0.42 |
| 3 | 59.14 | 3 | 0 | 303.1 | 0.53 | 0.5 | 0.53 | −0.08 | 0.09 | 0.63 |
| 4 | 114.71 | 7 | 0 | 376.35 | −0.03 | −0.08 | −0.00 | −0.74 | −0.12 | −0.2 |
| 5 | 85.17 | 5 | 0 | 299.91 | 0.5 | 0.14 | 0.27 | 0.00 | 0.1 | 0.67 |
| 6 | 111.47 | 5 | 0 | 273.48 | −0.06 | −0.05 | −0.2 | −0.33 | −0.12 | −0.41 |
| 7 | 137.49 | 7 | 1 | 250.08 | 0.04 | 0.01 | 0.11 | −0.94 | 0.03 | 0.45 |
| Ligands | Binding Affinity (Kcal/mol) | Interaction Hydrogen- Binding | Hydrophobic Interaction |
|---|---|---|---|
| 22c | −4.3 | Carbon-Hydrogen bond: Val A294 Arg A139 Conventional H-bond: Glu A290 | π-sigma: Leu A289 alkyl and π-alkyl: Ala A286 |
| 1 | −6.8 | Conventional H-bond: Cys B206, Asp B215, Met B205, Tyr B214 | alkyl and π-alkyl: Ala B218, Met A205 π-sulfur: Cys B206. |
| 2 | −5.1 | Conventional H-bond: Gln A140, Ile A297; | amide stackers: Ser299; Vander wals: Asn A300. |
| 3 | −7.5 | - | alkyl and π-alkyl: Lys B159, Ala B117 π-π stacked: Phe B176 Halogen: Asp B119 |
| 4 | −6.3 | Conventional H-bond: Arg A139, Tyr A92, Gln A140. | alkyl and π-alkyl: Pro A91. |
| 5 | −5.6 | Conventional H-bond: Glu B280, Asn B278 | alkyl and π-alkyl: Pro B279, Ala218 |
| 6 | −5.2 | Conventional H-bond: Asn A300, Tyr A92 | π-anion: Asp A170 |
| 7 | −7.9 | Conventional H-bond: Asn A146, Ser A150, Ala A285, Ser A284, Gln A287. | alkyl and π-alkyl: Ala A286. |
| Complex | ΔGbind (MM-GBSA) | ΔGbind Hbond | ΔGbind VdW |
|---|---|---|---|
| STK10-7 | −20.9293 | −2.9044 | −0.3727 |
| STK10-22c | −13.6075 | −1.1743 | 0.48926 |
 |  |  | 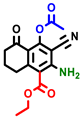 | 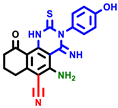 | 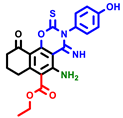 |  | |||||||
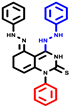
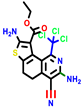
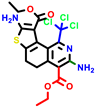
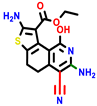
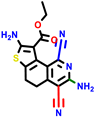
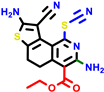
| 3a | pIC50 = 5.1 | 3b | pIC50 = 5.61 | 4a | pIC50 = 5.58 | 4b | pIC50 = 5.06 | 6a | pIC50 = 5.36 | 6b * | pIC50 = 6.35 | 7a | pIC50 = 5.22 |
 |  |  |  |  |  |  | |||||||
| 7b * | pIC50 = 6.49 | 10 | pIC50 = 5.2 | 12a | pIC50 = 5.17 | 12b * | pIC50 = 6.55 | 14 | pIC50 = 6.59 | 16 | pIC50 = 6.49 | 18a | pIC50 = 6.04 |
 |  |  |  |  |  |  | |||||||
| 18b * | pIC50 = 6.31 | 20a * | pIC50 = 6.02 | 20b | pIC50 = 6.02 | 21a | pIC50 = 5.69 | 21b * | pIC50 = 6.64 | 21c | pIC50 = 6.38 | 21d | pIC50 = 6.3 |
 |  |  |  |  |  |  | |||||||
| 22a * | pIC50 = 5.9 | 22b | pIC50 = 5.9 | 22c | pIC50 = 6.72 | 22d * | pIC50 = 6.46 | 24a | pIC50 = 6.02 | 24b | pIC50 = 6.08 | 24c | pIC50 = 6.10 |
 |  |  |  |  | |||||||||
| 24d | pIC50 = 6.14 | 24e * | pIC50 = 6.21 | 24f | pIC50 = 6.24 | 24g | pIC50 = 6.21 | 24h | pIC50 = 6.49 | ||||
Disclaimer/Publisher’s Note: The statements, opinions and data contained in all publications are solely those of the individual author(s) and contributor(s) and not of MDPI and/or the editor(s). MDPI and/or the editor(s) disclaim responsibility for any injury to people or property resulting from any ideas, methods, instructions or products referred to in the content. |
© 2024 by the authors. Licensee MDPI, Basel, Switzerland. This article is an open access article distributed under the terms and conditions of the Creative Commons Attribution (CC BY) license (https://creativecommons.org/licenses/by/4.0/).
Share and Cite
Mkhayar, K.; Daoui, O.; Haloui, R.; Elkhattabi, K.; Elabbouchi, A.; Chtita, S.; Samadi, A.; Elkhattabi, S. Ligand-Based Design of Novel Quinoline Derivatives as Potential Anticancer Agents: An In-Silico Virtual Screening Approach. Molecules 2024, 29, 426. https://doi.org/10.3390/molecules29020426
Mkhayar K, Daoui O, Haloui R, Elkhattabi K, Elabbouchi A, Chtita S, Samadi A, Elkhattabi S. Ligand-Based Design of Novel Quinoline Derivatives as Potential Anticancer Agents: An In-Silico Virtual Screening Approach. Molecules. 2024; 29(2):426. https://doi.org/10.3390/molecules29020426
Chicago/Turabian StyleMkhayar, Khaoula, Ossama Daoui, Rachid Haloui, Kaouakeb Elkhattabi, Abdelmoula Elabbouchi, Samir Chtita, Abdelouahid Samadi, and Souad Elkhattabi. 2024. "Ligand-Based Design of Novel Quinoline Derivatives as Potential Anticancer Agents: An In-Silico Virtual Screening Approach" Molecules 29, no. 2: 426. https://doi.org/10.3390/molecules29020426
APA StyleMkhayar, K., Daoui, O., Haloui, R., Elkhattabi, K., Elabbouchi, A., Chtita, S., Samadi, A., & Elkhattabi, S. (2024). Ligand-Based Design of Novel Quinoline Derivatives as Potential Anticancer Agents: An In-Silico Virtual Screening Approach. Molecules, 29(2), 426. https://doi.org/10.3390/molecules29020426