Article

An Investigation of the Influence of Tyrosine Local Interactions on Electron Hopping in a Model Protein

Department of Chemistry, Simon Fraser University, 8888 University Drive, Burnaby, BC V5A 1S6, Canada
*
Author to whom correspondence should be addressed.
Molecules 2024, 29(2), 350; https://doi.org/10.3390/molecules29020350
Submission received: 15 December 2023 / Revised: 4 January 2024 / Accepted: 5 January 2024 / Published: 10 January 2024
(This article belongs to the Section Inorganic Chemistry)

Abstract

:
Multi-step electron transfer reactions are important to the function of many cellular systems. The ways in which such systems have evolved to direct electrons along specific pathways are largely understood, but less so are the ways in which the reduction–oxidation potentials of individual redox sites are controlled. We prepared a series of three new artificial variants of Pseudomonas aeruginosa azurin where a tyrosine (Tyr109) is situated between the native Cu ion and a Ru(II) photosensitizer tethered to a histidine (His107). Arginine, glutamine, or methionine were introduced as position 122, which is near to Tyr109. We investigated the rate of CuI oxidation by a flash-quench generated Ru(III) oxidant over pH values from 5 to 9. While the identity of the residue at position 122 affects some of the physical properties of Tyr109, the rates of CuI oxidation are only weakly dependent on the identity of the residue at 122. The results highlight that more work is still needed to understand how non-covalent interactions of redox active groups are affected in redox proteins.

Graphical Abstract

1. Introduction

Reduction–oxidation reactions of tyrosine (Tyr) are necessary components of a range of redox proteins, such as photosystem II [1], ribonucleotide reductase [2], and cyclooxygenase enzymes [3]. Even the redox reactivity of aromatic amino acids in well-investigated proteins, such as cytochrome c peroxidase, continue to fascinate researchers [4,5,6,7]. Furthermore, Tyr residues have been proposed to be part of protective redox chains of amino acid residues in metalloproteins [8,9,10]. Most of these examples employ long-range (≥20 Å) electron transfer (ET), highlighting the importance of Tyr in long-range redox reactions. Such ET reactions often involve ≥2 individual ET steps, which is a process called hopping [8,11,12,13]. While many functional hopping systems that employ Tyr are known in biological systems (e.g., those noted above), efforts to describe and understand the features fundamental to their function are ongoing. Here, we use three variants of Pseudomonas aeruginosa azurin to investigate how local interactions of Tyr affect a two-step hopping reaction (Figure 1).
Mechanistic studies of the redox chemistry of Tyr in proteins and in models show that it predominantly reacts via proton-coupled electron transfer (PCET). While Tyr radical cations have been detected using transient techniques [14,15,16], redox reactions of Tyr commonly involve the loss (or gain) of 1 proton and 1 electron (1H+ + 1e). Tyr oxidation to the corresponding neutral radical (Tyr•) typically occurs via one of two mechanisms: concerted transfer of H• from Tyr to a suitable acceptor or sequential proton loss (generating the anionic tyrosinate, Tyr) followed by oxidation of Tyr to Tyr•. In water, the latter mechanism is common [17,18]. As such, the rate of electron hopping can, in principle, be related to the rate at which Tyr is deprotonated to Tyr. This reaction depends on factors such as the solution composition (pH, buffer, ionic strength) and the surrounding protein environment. The azurin variants described here are designed to probe the latter effect on Tyr-mediated hopping.
Figure 1. PyMOL-generated model showing the relative positions of the azurin Cu site, Tyr109, and His107-Ru(2,2’-bipyridyl)2imidazole. The coordinates were generated from the known Ru-labeled coordinates in Reference [19] (PDB ID 4HHG). The black lines indicate where the protein structure is truncated. The double headed arrows show through-bond distances between key groups.
Molecules 29 00350 g001
Protein model systems that probe features of Tyr-mediated hopping have been described. The peptide-based models from Giese use Tyr as the electron donor and probe the importance of different intermediate hopping sites situated between Tyr and an acceptor [20,21,22]. A range of E. coli artificial ribonucleotide reductase enzymes have been produced as mechanistic probes, where redox active Tyr are replaced with unnatural amino acid analogs [23,24,25,26]. There also are two other known azurin-based systems, analogous to those described here. The first used nitrotyrosinate (NO2Tyr) to investigate designed hopping systems that employ pure ET (i.e., no PCET was required) [19]. Interestingly, the NO2Tyr109 system showed distinct behavior where the measured pKa values was small with respect to the related model NO2Tyr122 (i.e., pKa values of 6.0 ± 0.05 and 7.2 ± 0.05, respectively). Likewise, the formal potential (E°′) for NO2Tyr109(•/−) was larger than that of NO2Tyr122(•/−) (i.e., 1.2 V and 1.1 V, respectively). An X-ray diffraction structure shows that Lys122 interacts with NO2Tyr109, which was used to explain its unusual thermochemical properties. Specifically, the cationic Lys was proposed to stabilize the anionic NO2Tyr109, lowering its pKa and raising its reduction potential. The second related system used unmodified Tyr [27]. Tyr109 again showed pKa properties that were the same within experimental error as those for Tyr122 (10.2 ± 0.3 and 10.5 ± 0.1, respectively), and the formal potentials are not reported. The presence of Lys122 was used to explain the differences in the properties of the Tyr109 and Ty122 hopping models. Herein, we systematically vary the identity of the amino acid residue at position 122 to probe how local interactions affect Tyr-mediated hopping.

2. Results and Discussion

Three new azurin variants were produced based on the known “all Phe” azurin scaffold where all of the naturally occurring Tyr and Trp are replaced with Phe (i.e., Trp48Phe, Tyr72Phe, and Tyr108Phe), and additional modifications in this work include His83Gln, Gln107His, and Met109Tyr. The residue at position 122 (Lys in the wild-type protein) was substituted with Glu, Gln, Met, and Arg using standard site-directed mutagenesis protocols. Unfortunately, the Lys122Glu variant, designed to place an anionic group near Tyr109, had very low expression yields and further study was not possible. The proteins were characterized by UV-visible spectroscopy, fluorescence spectroscopy, and mass spectrometry (Figures S1–S6). Full experimental details are available in the Supporting Information. The characteristic charge transfer band of azurin (628 nm) was unchanged by the amino acid substitutions. Likewise, the π–π* band (ca. 280 nm) of Tyr109 is not affected by the identity of the amino acid residue at position 122.
The fluorescence properties of Tyr are sensitive to pH and can also be influenced by local interactions in the protein. The pKa of the Tyr phenolic proton is 10.3 in the ground state and about 4 in the excited state [28]. The free amino acid residue, Tyr, emits at 302 nm in the protonated (phenol) form and at 345 nm for the deprotonated (phenolate) form. We probed the pH dependent emission properties of Tyr109 in each azurin variant between pH 4 and 11 in 50 mM sodium phosphate. The emission maxima are set out in Table 1 and the corresponding spectra are shown in Figure 2 and in the Supporting Information Herein, we cannot assess the degree of proton transfer from the excited state [28]. At pH 4, the presence of Arg122 red shifts the Tyr109 emission by about 4 nm with respect to Met122. For all of the variants, the emission spectra have intensity that depends on pH and generally show decreases in intensity as the pH is increased. For the Gln122 and Arg122 variants, there are small shifts in the peak maxima until pH 11, where the emission maximum shifts to ca. 340 nm, suggesting that Tyr109 is likely deprotonated, at least partially. The spectra for the Met122 variant show a much weaker shift in emission maximum at high pH. In general, the peak shapes are indicative of different mixtures of tyrosine and tyrosinate [29]. The data suggest that the pKa value of Tyr109 is higher in the Met122 variant (with respect to the other variants). However, the stability of azurin at pH > 10 is questionable, so precise determination of pKa values was not possible. Likewise, emission from tyrosinate is usually weaker than for tyrosine [29]. Thus, the increase in emission intensity at pH 11 for the Arg122 variant could be an indication of changes to the protein structure at this high abiological pH. A definitive conclusion is beyond the scope of this work.
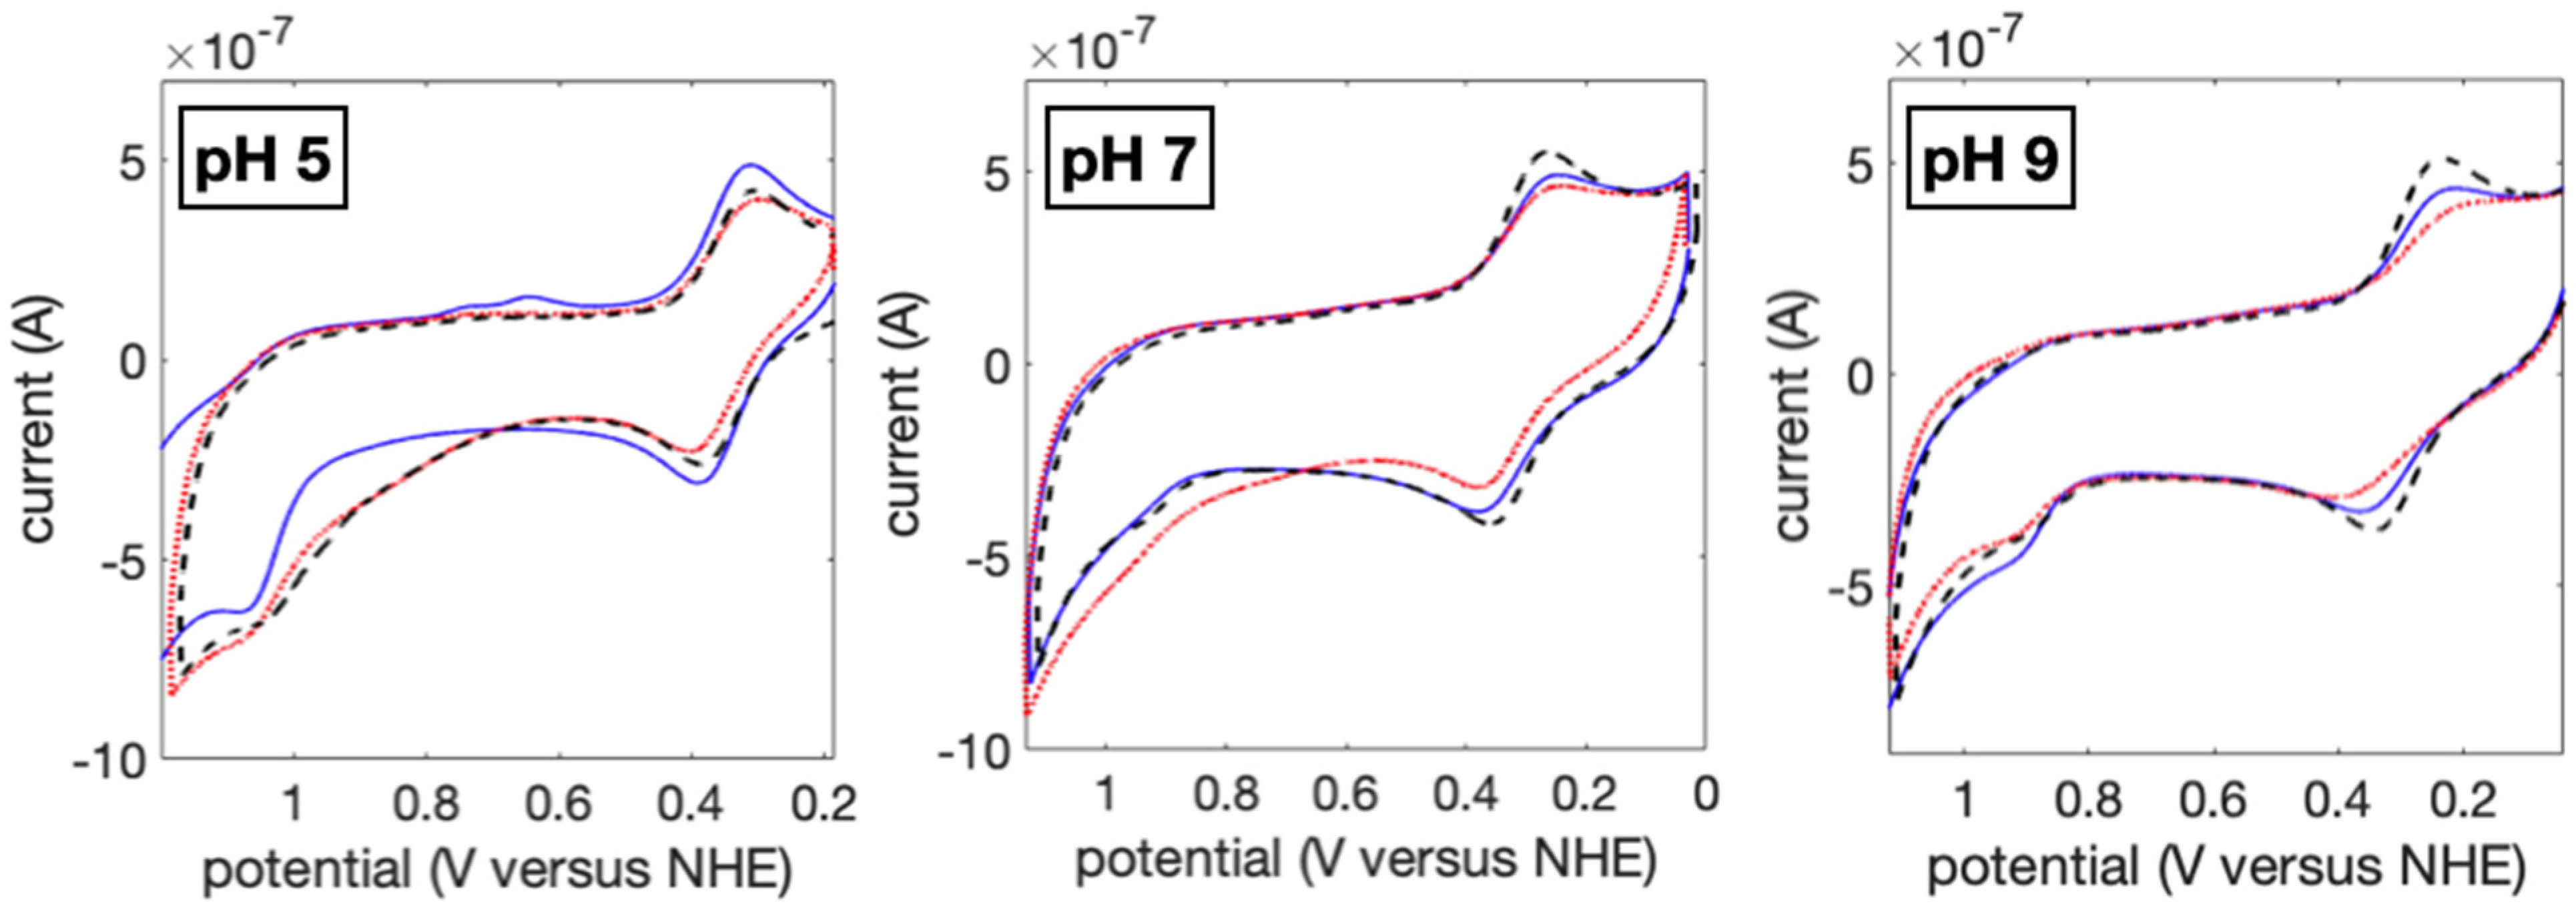
The Tyr reduction potentials were investigated using three voltammetry techniques: cyclic voltammetry (CV), differential pulse voltammetry (DPV), and square wave voltammetry (SWV). Additional data are provided in Figures S7–S9. In all experiments, the characteristic Cu(II/I) wave near 0.3 V versus NHE is observed. The CV experiments (Figure 3) show clear reversibility of this wave, as is expected. Likewise, the Cu(II/I) potentials shift with pH, as has been reported [30,31]. For oxidation of Tyr109, a shoulder is apparent in the CV traces (see Supporting Information), but the wave shows only a weak signal on return, suggesting irreversibility. The DPV waves showed similar intensity in the Cu- and Tyr-based redox events at lower pH values, which can indicate a degree of reversibility. The peak potentials in Table 2 are assigned from the DPV experiment. SWV experiments have been used to generate Pourbaix diagrams for reversible redox reactions of Tyr in model proteins [25,32,33], and we also carried out such experiments. The return wave in the SWV traces for Tyr is weak (see Supporting Information), suggesting irreversibility under the experimental conditions used. Thus, the reported peak potentials for Tyr109 could have error associated with the overall oxidation and degradation reactions. Ultimately, all of the Tyr potentials are within experimental error, in contrast to observations for Tyr fluorescence where the Met122 variant showed more distinct behavior.
The three azurins were modified with Ru(II)(2,2′-bipyridyl)2imidazole at amino acid residue His107 following procedures found in the literature [34,35,36,37]. Full experimental details are provided in the Supporting Information and the UV-vis spectra of the Ru-modified proteins shown in Figure S6. We note that we used the solution conditions (250 mM imidazole + 100 mM NaCl) from Reference [27] for kinetics experiments. Those conditions were shown to minimally affect ET kinetics for time resolved kinetics experiments (in contrast to lower buffer concentrations). Unfortunately, these conditions could not be used for fluorescence and electrochemistry experiments due to interference from the high imidazole concentration. Solution composition is an important consideration in studying PCET reactions (e.g., references [17,18,38]) and further work is needed to benchmark how it affects the redox properties of exposed amino acid residues in proteins.
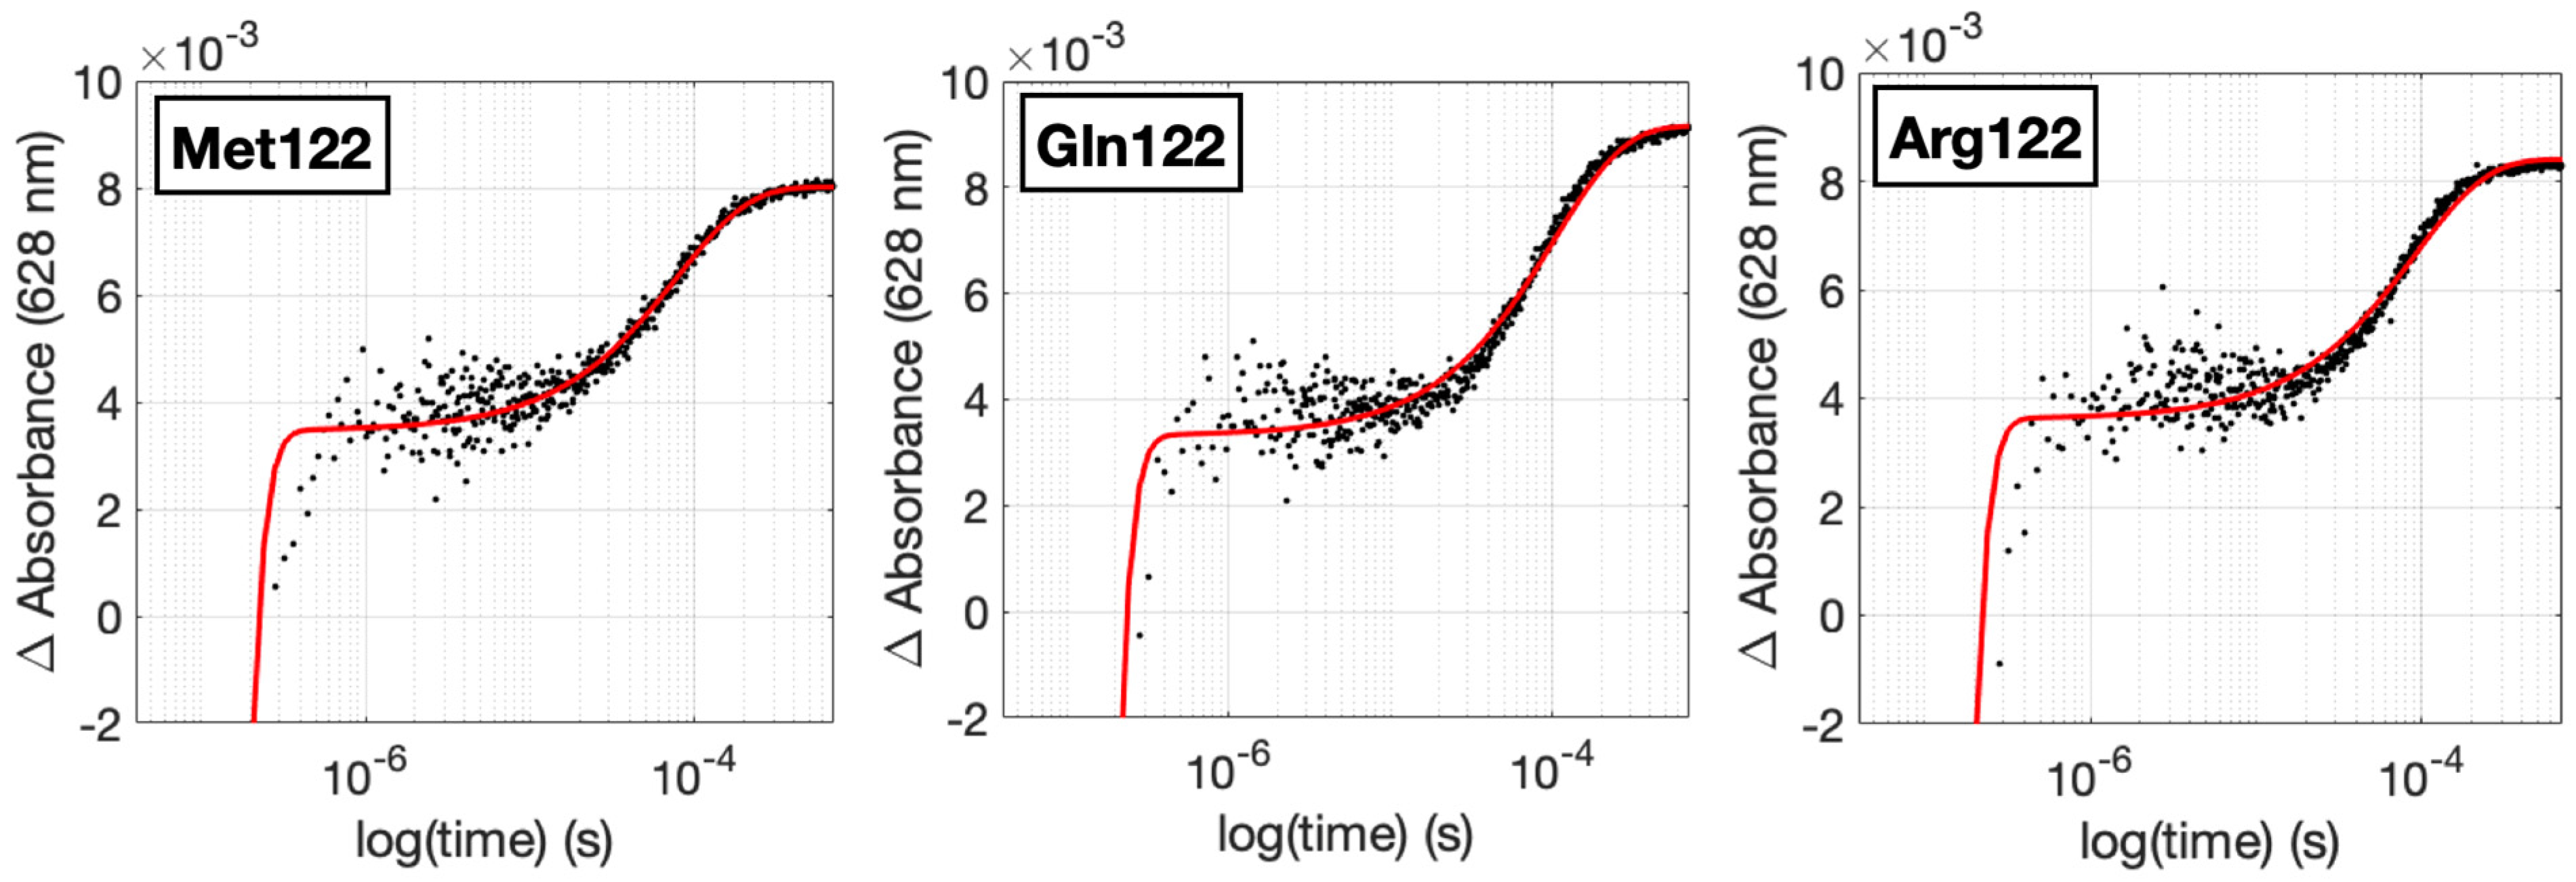
The modified proteins were characterized by mass spectrometry and UV-visible spectroscopy, both of which showed successful Ru attachment at His107. The rates of Cu(I) oxidation were determined using time-resolved laser spectroscopy to monitor the reaction of flash-quench-generated Ru(III) oxidants, as previously described [19,27,34,37,39]. Briefly, the irradiation of the Ru(II) photosensitizer affords an electronically excited state (*Ru(II)) that is oxidized by an added Ru(NH3)63+ electron acceptor to yield the protein-tethered Ru(III) oxidant. Because *Ru(II) is emissive, a bleach in absorbance is observed at short times in the kinetics traces for Cu(I) oxidation as shown in Figure 4 (additional traces are in the Supporting Information, Figures S10–S16). A reaction sequence showing all steps is provided in the Supporting Information (Figure S17). The rate constants for Cu(I) oxidation are set out in Table 3.
The rate constants for CuI oxidation (Table 3) are uniformly larger than reported for single-step ET (2.4 ± 0.5 102 s−1) [34,35], which is consistent with a hopping mechanism. This was previously shown to be the case for His107Tyr109Lys122 azurin [27]. Specifically, the most probable mechanism for Try-mediated hopping was proposed to proceed via deprotonation of Tyr to the corresponding tyrosinate, followed by oxidation by Ru(III). The reaction is completed by Cu(I) oxidation by the Tyr radical. Given the single amino acid variations used here and the close similarity in observed rate constants, it is unlikely that the mechanism is different.
One surprising observation is that there are only small differences in the kobs values at a given pH. The low pH values have somewhat higher associated errors since the rate of Cu(I) oxidation is proposed to be dependent on the rate of deprotonation of Tyr [27]. The one possible exception are the values at pH 9, where the variant with Met122 has about a 40% larger rate constant than the known Lys122 variant. Given the similarity of the observed rate constants, it is unlikely that the local Tyr109-Lys122 interaction plays the only role in changing the physical properties of Tyr109 as they relate to hopping. We note that other small deviations in the fits of the slowest rate constants may also be due to a small degree of recombination between the flash-quench generated Ru(III) label and Ru(II)(NH3)6, though such reactions are slow (0.1 to 1 ms) under our conditions [27]. Our control experiments using a model complex (Ru(bpy)2(imidazole)2(PF6)2) show recombination kinetics occur at timescales longer than 0.5 ms.
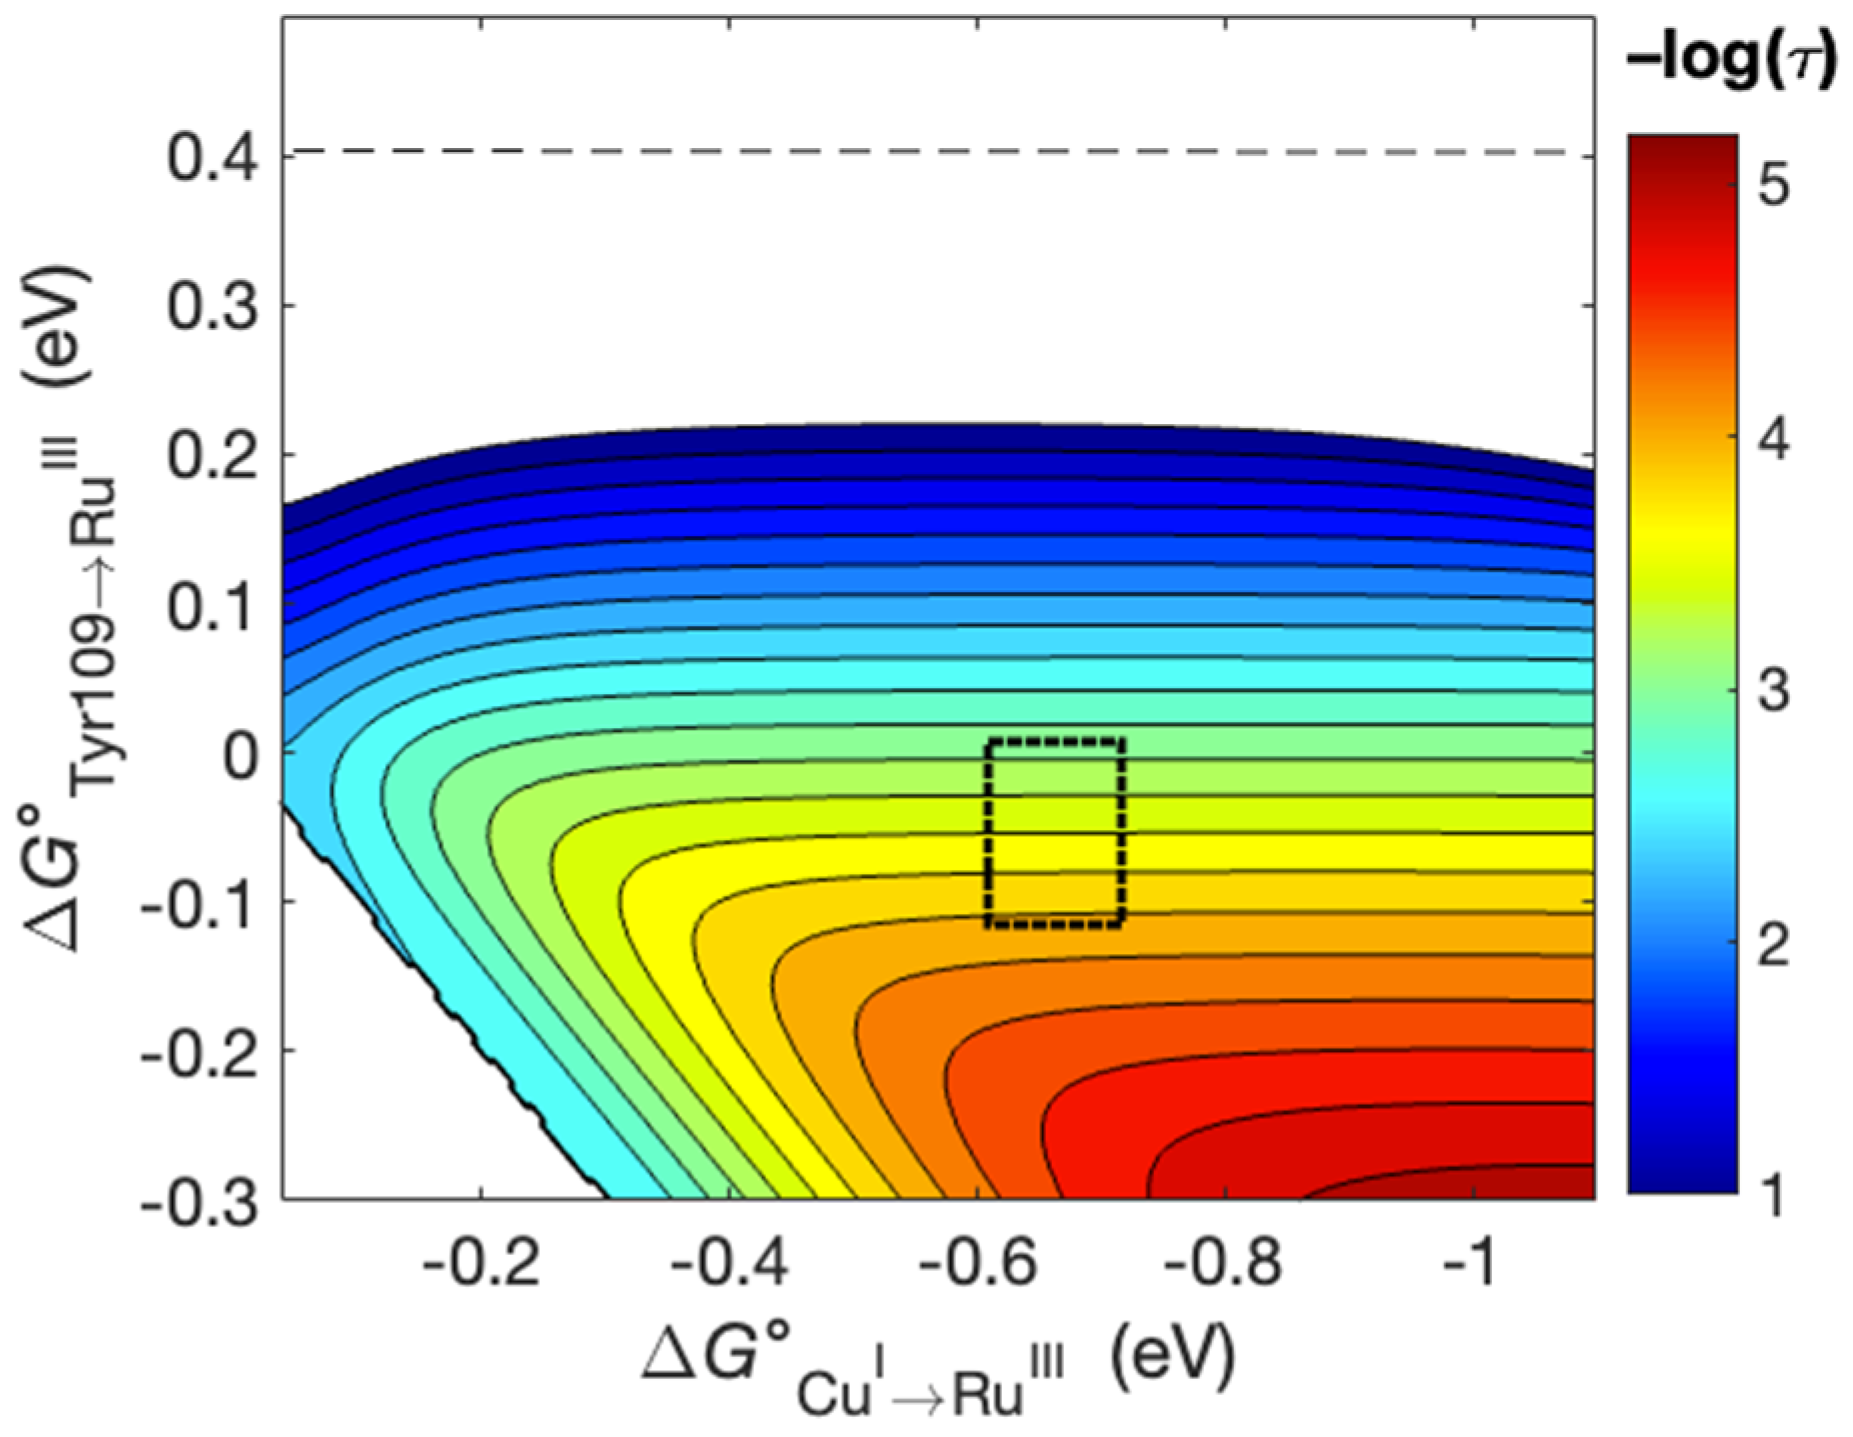
The observed kobs values (Table 3) can be analyzed using semi-classical ET theory as formulated in hopping maps [40,41,42]. A hopping map for the His107Tyr109X122 azurins described here can be constructed from the known coordinates of the known His107-NO2Tyr109 derivative (Figure 1, PDB ID 4HHG) [19]. The map is shown in Figure 5. Using the reduction potentials in Table 2, the reported potential for Ru(II)(2,2′-bipyridyl)2(imidazole)23+/2+ (1.0 V versus NHE, [43]), and a generic hopping system with the metric set out in Figure 5, the calculated ET rate constants are 2.6 × 10³ s−1 (log k = 3.41) for reactions at pH 6 and 8.9 × 10³ s−1 (log k = 3.95) for reactions at pH 9. An alternative hopping map is set out in the Supporting Information (Figure S18). In general, the calculated rate constants are in agreement with experiment within the usual limitations of semi-classical ET theory (i.e., Marcus theory) [9,44]. The change in rate constants (a factor of about 1.2) is well-predicted with this hopping analysis.
The independence of the ET rate on the identity of the residue at position 122 is surprising given the discrepancy in the properties of Tyr109 and Tyr122 in related model proteins [19,27]. In particular, the behavior of the Met122 variant described here seems to be at odds with our other findings, i.e., the small increase in kobs at high pH contrasts with the insensitivity of the fluorescence to pH. We do note that the observed reduction potentials for the Met122 variant depend on pH at about the same degree as the Arg122 and Gln122 variants. In another protein model that we investigated, Met and Leu were placed near Trp in a better-defined protein pocket. There, a shift in +30 mV for the Trp•+/0 was observed for the Leu variant versus the Met variant [45]. Although that was not a hopping system, it does illustrate the Met can influence the potentials of redox-active amino acid residues.
Overall, the changes that the residue at position 122 exert on the physical properties of Tyr109 are small. For example, the largest change in formal Tyr reduction potentials in these azurin variants is 0.02 V. Using predictions from semiclassical ET theory, this corresponds to about a 1.5-fold change in kET. However, it is these small changes that can affect the viability of functional redox systems. Improved model systems would place the redox-active site in a better-defined protein pocket where the environment can be systematically varied. Work from Tommos using artificial peptide-based systems is one excellent example of this idea [32,46,47]. In the end, connections must continue to be built between artificial and natural protein models.

3. Materials and Methods

Full experimental details and additional data are provided in the Supporting Information. All reagents and materials were obtained from Sigma-Aldrich and not purified further unless noted. Luria-Bertani (LB) broth miller was purchased from BioShop Canada and prepared according to the manufacturer. Water used was from a Barnstead EASYpure system (18 MΩ cm−1). Q5 DNA polymerase and DpnI enzyme were purchased from New England Biolabs (NEB)UV-Visible spectrophotometry was carried out using a Cary 100-Bio spectrophotometer. MALDI mass spectrometry was carried out on a Bruker microflex LT MALDI Biotyper mass spectrometer. All laser irradiation was carried out using a home-built spectrometer containing a Continuum Surelite SLI-10 (Nd:YAG) laser, a Continuum Surelite OPO, a 75 W Xe arc lamp, and a home-built detection system.
A plasmid containing Phe mutations for all Trp and Tyr residues within azurin was a gift from Harry B. Gray and John H. Richards (California Institute of Technology, Pasadena, CA, USA). The Phe109Tyr mutation was added followed by Lys122Arg/Met/Glu/Gln so that four distinct protein scaffolds could be expressed (His107Tyr109Arg122, His107Tyr109Met122, His107Tyr109Glu122, and His107Tyr109Gln122). All mutations were introduced using site-directed mutagenic PCR using standard protocols [48]. Sanger sequencing to confirm the mutations was carried out by Eurofins Operon. All azurin variants were expressed and purified using standard literature protocols (see Supporting Information). Protein purities and concentrations were determined spectrophotometrically using reported extinction coefficients (ε(628 nm) = 5600 −1 cm−1) [39,49]. Ruthenium-modified azurins were prepared following protocols found in the literature. Concentrations of each Ru-modified azurin was calculated spectrophotometrically using reported extinction coefficients (ε(628 nm) = 5600 M−1 cm−1 for Cu(II) and ε(500 nm) = 10,000 M−1 cm−1 for Ru(II)).
Fluorescence experiments were carried out using a Horiba Jobin-Yvon Fluorolog spectrophotometer. Protein Samples (65 μM) were prepared in 50 mM NaPi at pH values from 4 to 11. Samples were placed into air-free cuvettes and deoxygenated with 15–20 pump-backfill cycles using N2. Excitation was achieved using 280 nm light and spectra were recorded from 295 to 500 nm to monitor for Tyr and/or TyrO fluorescence. Ten scans were performed per sample and emission maxima were determined by averaging each series.
Electrochemical experiments were carried out using a CH Instruments 6171B potentiostat. A standard three-electrode setup was used containing a basal-plane graphite (BPG) working electrode, a platinum wire counter electrode, and an AgCl/Ag reference electrode with all samples being reported versus NHE. Protein samples (100 μM) were prepared in 100 mM NaOAc at pH values ranging from 5 to 9. The BPG electrode surface were prepared by thoroughly washing with deionized H2O, lightly coating with MicroPolish Powder (CH Instruments), and polishing using an microfiber polishing pad. CV spectra were collected using a 0.02, 0.04, and 0.1 V/s scan rate; however, the 0.02 V/s data are the only scans shown here unless otherwise noted. The scan window for DPV was -0.1 to 1 V at 0.003 V increments with a 0.05 V amplitude. The pulse and sample width were 0.1 and 0.02 s, respectively. The pulse period was 0.5 s.
All laser experiments were carried out with a 480 nm excitation with 6 mJ/pulse energy. Samples were reduced using L-ascorbic acid and then desalted into 250 mM imidazole and 100 mM NaCl at various pH values (5–9) for a final concentration of 35 μM. Sample volumes were 1.5 mL and special air-free cuvettes were custom made by the SFU Glass Shop to allow for deoxygenation. Then, 15-20 pump-backfill cycles using N2 were performed to remove O2 from the sample and cuvette. Prior to TA experiments, time-dependent fluorescence scans were performed, monitoring at 670 nm. The quencher [Ru(NH3)6]Cl3, dissolved in 250 mM imidazole, 100 mM NaCl at the required pH, was added to a final concentration of 10 mM to each sample as an exogenous quencher. A total of 15–20 pump-backfill cycles using N2 were performed again to remove O2 from the sample and cuvette. Fluorescence experiments were repeated to ensure fluorescence quenching. TA was then carried out, monitoring at 490 nm pr 628 nm for Ru(II) reduction and Cu(I) oxidation, respectively. Data were plotted and analyzed using MATLAB and MATLAB’s Curve Fitting Toolbox. Rate constants were determined using a two-exponential fit. The first exponential function describes signal from residual fluorescence due to excited state decay (and quenching) of the Ru photosensitizer and the second function describes the Cu(I) oxidation event. For the 490 nm (Ru traces), the first function is for the excited state decay of *Ru(II) and the second function is for Ru(III).

4. Conclusions

The results described in this report underscore that there is still much to learn about how protein environments tune the properties of redox cofactors. However, we are not the first to note anomalous behavior of hopping systems where there is a Met intermediate between the donor and the acceptor [50]. Consistent with that study, the reduction potential for the Ru(III) oxidant is insufficient of oxidize Met122, which is proposed to have a very high potential (ca. 1.6 V) [51,52]. We note that this present analysis does not consider protein dynamics [53,54,55]. While the ET pathway is not likely to change based on the identity of the residue at position 122, changes in pH can affect the ionization state of surface residues which in turn may influence the solution dynamics of the Ru label and/or Tyr109 [56,57]. While much is understood about tyrosine redox chemistry in models [18,32,58,59,60,61], more work is needed to understand how local interactions and protein dynamics affect the redox properties of amino acids and metal sites in proteins.

Supplementary Materials

The following supporting information can be downloaded at: https://www.mdpi.com/article/10.3390/molecules29020350/s1, Full experimental details. Figure S1: UV-vis spectra or azurins; Figure S2: Tyr fluorescence spectra at additional pH values; Figures S3–S5: MALDI mass-sec of azurins; Figure S6: UV-vis spectra of Ru-modified azurins; Figure S7: Cyclic voltammetry data at additional pH values; Figure S8: Differential pulse voltammetry data at additional pH values; Figure S9: Square wave voltammetry data at selected pH values; Figures S10–S16: additional kinetics data at different pH values; Figure S17: Schematic of an electron hopping mechanism Figure S18: Additional hopping maps.

Author Contributions

Conceptualization, C.A.G. and J.J.W.; methodology, C.A.G., N.G., J.T. and J.J.W.; formal analysis, C.A.G., N.G., J.T. and J.J.W.; investigation, C.A.G., N.G. and J.T.; writing—original draft preparation, C.A.G., N.G., J.T. and J.J.W.; writing—review and editing, C.A.G., N.G., J.T. and J.J.W.; visualization, C.A.G., N.G., J.T. and J.J.W.; supervision, J.J.W.; project administration, J.J.W.; funding acquisition, J.J.W. All authors have read and agreed to the published version of the manuscript.

Funding

The Natural Sciences and Engineering Research Council of Canada (NSERC RGPIN06272 to J.J.W.), the Canada Summer Jobs program, and Simon Fraser University supported this work. J.T. acknowledges support from the NSERC Undergraduate Summer Research Award.

Institutional Review Board Statement

Not applicable.

Informed Consent Statement

Not applicable.

Data Availability Statement

All data are available on request.

Conflicts of Interest

The authors declare no conflicts of interest.

References

  1. Lubitz, W.; Chrysina, M.; Cox, N. Water Oxidation in Photosystem II. Photosynth. Res. 2019, 142, 105–125. [Google Scholar] [CrossRef] [PubMed]
  2. Minnihan, E.C.; Nocera, D.G.; Stubbe, J. Reversible, Long-Range Radical Transfer in E. coli Class Ia Ribonucleotide Reductase. Acc. Chem. Res. 2013, 46, 2524–2535. [Google Scholar] [CrossRef] [PubMed]
  3. Smith, W.L.; Urade, Y.; Jakobsson, P.-J. Enzymes of the Cyclooxygenase Pathways of Prostanoid Biosynthesis. Chem. Rev. 2011, 111, 5821–5865. [Google Scholar] [CrossRef] [PubMed]
  4. Ru, X.; Crane, B.R.; Zhang, P.; Beratan, D.N. Why Do Most Aromatics Fail to Support Hole Hopping in the Cytochrome c Peroxidase–Cytochrome c Complex? J. Phys. Chem. B 2021, 125, 7763–7773. [Google Scholar] [CrossRef] [PubMed]
  5. Yee, E.F.; Dzikovski, B.; Crane, B.R. Tuning Radical Relay Residues by Proton Management Rescues Protein Electron Hopping. J. Am. Chem. Soc. 2019, 141, 17571–17587. [Google Scholar] [CrossRef]
  6. Kathiresan, M.; English, A.M. LC-MS/MS Suggests That Hole Hopping in Cytochrome c Peroxidase Protects Its Heme from Oxidative Modification by Excess H2O2. Chem. Sci. 2017, 8, 1152–1162. [Google Scholar] [CrossRef]
  7. Kathiresan, M.; English, A.M. LC-MS/MS Proteoform Profiling Exposes Cytochrome c Peroxidase Self-Oxidation in Mitochondria and Functionally Important Hole Hopping from Its Heme. J. Am. Chem. Soc. 2018, 140, 12033–12039. [Google Scholar] [CrossRef]
  8. Gray, H.B.; Winkler, J.R. Hole Hopping through Tyrosine/Tryptophan Chains Protects Proteins from Oxidative Damage. Proc. Natl. Acad. Sci. USA 2015, 112, 10920–10925. [Google Scholar] [CrossRef]
  9. Winkler, J.R.; Gray, H.B. Electron Flow through Biological Molecules: Does Hole Hopping Protect Proteins from Oxidative Damage? Q. Rev. Biophys. 2015, 48, 411–420. [Google Scholar] [CrossRef]
  10. Teo, R.D.; Wang, R.; Smithwick, E.R.; Migliore, A.; Therien, M.J.; Beratan, D.N. Mapping Hole Hopping Escape Routes in Proteins. Proc. Natl. Acad. Sci. USA 2019, 116, 15811–15816. [Google Scholar] [CrossRef]
  11. Cordes, M.; Köttgen, A.; Jasper, C.; Jacques, O.; Boudebous, H.; Giese, B. Influence of Amino Acid Side Chains on Long-Distance Electron Transfer in Peptides: Electron Hopping via “Stepping Stones”. Angew. Chem. Int. Ed. 2008, 47, 3461–3463. [Google Scholar] [CrossRef] [PubMed]
  12. Winkler, J.R.; Di Bilio, A.J.; Farrow, N.A.; Richards, J.H.; Gray, H.B. Electron Tunneling in Biological Molecules. Pure Appl. Chem. 1999, 71, 1753–1764. [Google Scholar] [CrossRef]
  13. Cordes, M.; Giese, B. Electron Transfer in Peptides and Proteins. Chem. Soc. Rev. 2009, 38, 892–901. [Google Scholar] [CrossRef] [PubMed]
  14. Nag, L.; Sournia, P.; Myllykallio, H.; Liebl, U.; Vos, M.H. Identification of the TyrOH•+ Radical Cation in the Flavoenzyme TrmFO. J. Am. Chem. Soc. 2017, 139, 11500–11505. [Google Scholar] [CrossRef] [PubMed]
  15. Nag, L.; Sournia, P.; Myllykallio, H.; Liebl, U.; Vos, M.H. Correction to “Identification of the TyrOH●+ Radical Cation in the Flavoenzyme TrmFO”. J. Am. Chem. Soc. 2017, 139, 15554. [Google Scholar] [CrossRef] [PubMed]
  16. Pirisi, K.; Nag, L.; Fekete, Z.; Iuliano, J.N.; Tolentino Collado, J.; Clark, I.P.; Pécsi, I.; Sournia, P.; Liebl, U.; Greetham, G.M.; et al. Identification of the Vibrational Marker of Tyrosine Cation Radical Using Ultrafast Transient Infrared Spectroscopy of Flavoprotein Systems. Photochem. Photobiol. Sci. 2021, 20, 369–378. [Google Scholar] [CrossRef] [PubMed]
  17. Costentin, C.; Louault, C.; Robert, M.; Savéant, J.-M. The Electrochemical Approach to Concerted Proton—Electron Transfers in the Oxidation of Phenols in Water. Proc. Natl. Acad. Sci. USA 2009, 106, 18143–18148. [Google Scholar] [CrossRef]
  18. Bonin, J.; Costentin, C.; Louault, C.; Robert, M.; Routier, M.; Savéant, J.-M. Intrinsic Reactivity and Driving Force Dependence in Concerted Proton–Electron Transfers to Water Illustrated by Phenol Oxidation. Proc. Natl. Acad. Sci. USA 2010, 107, 3367–3372. [Google Scholar] [CrossRef]
  19. Warren, J.J.; Herrera, N.; Hill, M.G.; Winkler, J.R.; Gray, H.B. Electron Flow through Nitrotyrosinate in Pseudomonas aeruginosa Azurin. J. Am. Chem. Soc. 2013, 135, 11151–11158. [Google Scholar] [CrossRef]
  20. Giese, B.; Napp, M.; Jacques, O.; Boudebous, H.; Taylor, A.M.; Wirz, J. Multistep Electron Transfer in Oligopeptides: Direct Observation of Radical Cation Intermediates. Angew. Chem. Int. Ed. 2005, 117, 4141–4143. [Google Scholar] [CrossRef]
  21. Cordes, M.; Jacques, O.; Köttgen, A.; Jasper, C.; Boudebous, H.; Giese, B. Development of a Model System for the Study of Long Distance Electron Transfer in Peptides. Adv. Synth. Catal. 2008, 350, 1053–1062. [Google Scholar] [CrossRef]
  22. Gao, J.; Müller, P.; Wang, M.; Eckhardt, S.; Lauz, M.; Fromm, K.M.; Giese, B. Electron Transfer in Peptides: The Influence of Charged Amino Acids. Angew. Chem. Int. Ed. 2011, 50, 1926–1930. [Google Scholar] [CrossRef] [PubMed]
  23. Lee, W.; Kasanmascheff, M.; Huynh, M.; Quartararo, A.; Costentin, C.; Bejenke, I.; Nocera, D.G.; Bennati, M.; Tommos, C.; Stubbe, J. Properties of Site-Specifically Incorporated 3-Aminotyrosine in Proteins To Study Redox-Active Tyrosines: Escherichia coli Ribonucleotide Reductase as a Paradigm. Biochemistry 2018, 57, 3402–3415. [Google Scholar] [CrossRef] [PubMed]
  24. Minnihan, E.C.; Young, D.D.; Schultz, P.G.; Stubbe, J. Incorporation of Fluorotyrosines into Ribonucleotide Reductase Using an Evolved, Polyspecific Aminoacyl-tRNA Synthetase. J. Am. Chem. Soc. 2011, 133, 15942–15945. [Google Scholar] [CrossRef]
  25. Ravichandran, K.R.; Zong, A.B.; Taguchi, A.T.; Nocera, D.G.; Stubbe, J.; Tommos, C. Formal Reduction Potentials of Difluorotyrosine and Trifluorotyrosine Protein Residues: Defining the Thermodynamics of Multistep Radical Transfer. J. Am. Chem. Soc. 2017, 139, 2994–3004. [Google Scholar] [CrossRef] [PubMed]
  26. Oyala, P.H.; Ravichandran, K.R.; Funk, M.A.; Stucky, P.A.; Stich, T.A.; Drennan, C.L.; Britt, R.D.; Stubbe, J. Biophysical Characterization of Fluorotyrosine Probes Site-Specifically Incorporated into Enzymes: E. coli Ribonucleotide Reductase As an Example. J. Am. Chem. Soc. 2016, 138, 7951–7964. [Google Scholar] [CrossRef]
  27. Warren, J.J.; Shafaat, O.S.; Winkler, J.R.; Gray, H.B. Proton-Coupled Electron Hopping in Ru-Modified P. aeruginosa Azurin. J. Biol. Inorg. Chem. 2016, 21, 113–119. [Google Scholar] [CrossRef] [PubMed]
  28. Rayner, D.M.; Krajcarski, D.T.; Szabo, A.G. Excited State Acid–Base Equilibrium of Tyrosine. Can. J. Chem. 1978, 56, 1238–1245. [Google Scholar] [CrossRef]
  29. Lakowicz, J.R. Principles of Fluoresence Spectroscopy, 2nd ed.; Kleuwer Academic/Plenum: New York, NY, USA, 1999. [Google Scholar]
  30. Pascher, T.; Karlsson, B.G.; Nordling, M.; Malmström, B.G.; Vänngård, T. Reduction Potentials and Their pH Dependence in Site-Directed-Mutant Forms of Azurin from Pseudomonas aeruginosa. Eur. J. Biochem. 1993, 212, 289–296. [Google Scholar] [CrossRef]
  31. St. Clair, C.S.; Ellis, W.R.; Gray, H.B. Spectroelectrochemistry of Blue Copper Proteins: pH and Temperature Dependences of the Reduction Potentials of Five Azurins. Inorg. Chim. Acta 1992, 191, 149–155. [Google Scholar] [CrossRef]
  32. Berry, B.W.; Martinez-Rivera, M.C.; Tommos, C. Reversible Voltammograms and a Pourbaix Diagram for a Protein Tyrosine Radical. Proc. Natl. Acad. Sci. USA 2012, 109, 9739–9743. [Google Scholar] [CrossRef] [PubMed]
  33. Martínez-Rivera, M.C.; Berry, B.W.; Valentine, K.G.; Westerlund, K.; Hay, S.; Tommos, C. Electrochemical and Structural Properties of a Protein System Designed To Generate Tyrosine Pourbaix Diagrams. J. Am Chem. Soc. 2011, 133, 17786–17795. [Google Scholar] [CrossRef] [PubMed]
  34. Langen, R.; Chang, I.-J.; Germanas, J.P.; Richards, J.H.; Winkler, J.R.; Gray, H.B. Electron Tunneling in Proteins: Coupling Through a β Strand. Science 1995, 268, 1733–1735. [Google Scholar] [CrossRef] [PubMed]
  35. Regan, J.J.; Di Bilio, A.J.; Langen, R.; Skov, L.K.; Winkler, J.R.; Gray, H.B.; Onuchic, J.N. Electron Tunneling in Azurin: The Coupling across a β-Sheet. Chem. Biol. 1995, 2, 489–496. [Google Scholar] [CrossRef]
  36. Faham, S.; Day, M.W.; Connick, W.B.; Crane, B.R.; Bilio, A.J.D.; Schaefer, W.P.; Rees, D.C.; Gray, H.B. Structures of Ruthenium-Modified Pseudomonas Aeruginosa Azurin and [Ru(2,2′-Bipyridine)2(Imidazole)2]SO4·10H2O. Acta Crystallogr. D 1999, 55, 379–385. [Google Scholar] [CrossRef] [PubMed]
  37. Chang, I.J.; Gray, H.B.; Winkler, J.R. High-Driving-Force Electron Transfer in Metalloproteins: Intramolecular Oxidation of Ferrocytochrome c by Ru(2,2’-Bpy)2(Im)(His-33)3+. J. Am. Chem. Soc. 1991, 113, 7056–7057. [Google Scholar] [CrossRef]
  38. Krishtalik, L.I. pH-Dependent Redox Potential: How to Use It Correctly in the Activation Energy Analysis. Biochim. Biophys. Acta 2003, 1604, 13–21. [Google Scholar] [CrossRef]
  39. Fedoretz-Maxwell, B.P.; Shin, C.H.; MacNeil, G.A.; Worrall, L.J.; Park, R.; Strynadka, N.C.J.; Walsby, C.J.; Warren, J.J. The Impact of Second Coordination Sphere Methionine-Aromatic Interactions in Copper Proteins. Inorg. Chem. 2022, 61, 5563–5571. [Google Scholar] [CrossRef]
  40. Shih, C.; Museth, A.K.; Abrahamsson, M.; Blanco-Rodriguez, A.M.; Di Bilio, A.J.; Sudhamsu, J.; Crane, B.R.; Ronayne, K.L.; Towrie, M.; Vlcek, A.; et al. Tryptophan-Accelerated Electron Flow Through Proteins. Science 2008, 320, 1760–1762. [Google Scholar] [CrossRef]
  41. Warren, J.J.; Ener, M.E.; Vlček, A.; Winkler, J.R.; Gray, H.B. Electron Hopping through Proteins. Coord. Chem. Rev. 2012, 256, 2478–2487. [Google Scholar] [CrossRef]
  42. Warren, J.J.; Winkler, J.R.; Gray, H.B. Hopping Maps for Photosynthetic Reaction Centers. Coord. Chem. Rev. 2013, 257, 165–170. [Google Scholar] [CrossRef] [PubMed]
  43. Reddy, K.B.; Cho, M.P.; Wishart, J.F.; Emge, T.J.; Isied, S.S. Cis-Bis(Bipyridine)Ruthenium Imidazole Derivatives: A Spectroscopic, Kinetic, and Structural Study. Inorg. Chem. 1996, 35, 7241–7245. [Google Scholar] [CrossRef] [PubMed]
  44. Marcus, R.A.; Sutin, N. Electron Transfers in Chemistry and Biology. Biochim. Biophys. Acta 1985, 811, 265–322. [Google Scholar] [CrossRef]
  45. Gibbs, C.A.; Fedoretz-Maxwell, B.P.; MacNeil, G.A.; Walsby, C.J.; Warren, J.J. Proximal Methionine Amino Acid Residue Affects the Properties of Redox-Active Tryptophan in an Artificial Model Protein. ACS Omega 2023, 8, 19798–19806. [Google Scholar] [CrossRef]
  46. Tommos, C. Insights into the Thermodynamics and Kinetics of Amino-Acid Radicals in Proteins. Annu. Rev. Biophys. 2022, 51, 453–471. [Google Scholar] [CrossRef] [PubMed]
  47. Tommos, C.; Skalicky, J.J.; Pilloud, D.L.; Wand, A.J.; Dutton, P.L. De Novo Proteins as Models of Radical Enzymes. Biochemistry 1999, 38, 9495–9507. [Google Scholar] [CrossRef] [PubMed]
  48. Zheng, L.; Baumann, U.; Reymond, J.-L. An Efficient One-Step Site-Directed and Site-Saturation Mutagenesis Protocol. Nucleic Acids Res. 2004, 32, e115. [Google Scholar] [CrossRef] [PubMed]
  49. Liu, J.; Chakraborty, S.; Hosseinzadeh, P.; Yu, Y.; Tian, S.; Petrik, I.; Bhagi, A.; Lu, Y. Metalloproteins Containing Cytochrome, Iron–Sulfur, or Copper Redox Centers. Chem. Rev. 2014, 114, 4366–4469. [Google Scholar] [CrossRef]
  50. Wang, M.; Gao, J.; Müller, P.; Giese, B. Electron Transfer in Peptides with Cysteine and Methionine as Relay Amino Acids. Angew. Chem. Int. Ed. 2009, 48, 4232–4234. [Google Scholar] [CrossRef]
  51. Brunelle, P.; Rauk, A. One-Electron Oxidation of Methionine in Peptide Environments:  The Effect of Three-Electron Bonding on the Reduction Potential of the Radical Cation. J. Phys. Chem. A 2004, 108, 11032–11041. [Google Scholar] [CrossRef]
  52. Brunelle, P.; Schöneich, C.; Rauk, A. One-Electron Oxidation of Methionine Peptides—Stability of the Three-Electron S—N(Amide) Bond. Can. J. Chem. 2006, 84, 893–904. [Google Scholar] [CrossRef]
  53. Beratan, D.N. Why Are DNA and Protein Electron Transfer So Different? Annu. Rev. Phys. Chem. 2019, 70, 71–97. [Google Scholar] [CrossRef] [PubMed]
  54. Beratan, D.N.; Liu, C.; Migliore, A.; Polizzi, N.F.; Skourtis, S.S.; Zhang, P.; Zhang, Y. Charge Transfer in Dynamical Biosystems, or The Treachery of (Static) Images. Acc. Chem. Res. 2015, 48, 474–481. [Google Scholar] [CrossRef]
  55. Beratan, D.N.; Skourtis, S.S.; Balabin, I.A.; Balaeff, A.; Keinan, S.; Venkatramani, R.; Xiao, D. Steering Electrons on Moving Pathways. Acc. Chem. Res. 2009, 42, 1669–1678. [Google Scholar] [CrossRef] [PubMed]
  56. Zahler, C.T.; Shaw, B.F. What Are We Missing by Not Measuring the Net Charge of Proteins? Chem. Eur. J. 2019, 25, 7581–7590. [Google Scholar] [CrossRef] [PubMed]
  57. Zahler, C.T.; Zhou, H.; Abdolvahabi, A.; Holden, R.L.; Rasouli, S.; Tao, P.; Shaw, B.F. Direct Measurement of Charge Regulation in Metalloprotein Electron Transfer. Angew. Chem. Int. Ed. 2018, 57, 5364–5368. [Google Scholar] [CrossRef] [PubMed]
  58. Markle, T.F.; Tronic, T.A.; DiPasquale, A.G.; Kaminsky, W.; Mayer, J.M. Effect of Basic Site Substituents on Concerted Proton-Electron Transfer in Hydrogen-Bonded Pyridyl-Phenols. J. Phys. Chem. A 2012, 116, 12249–12259. [Google Scholar] [CrossRef]
  59. Markle, T.F.; Tenderholt, A.L.; Mayer, J.M. Probing Quantum and Dynamic Effects in Concerted Proton-Electron Transfer Reactions of Phenol-Base Compounds. J. Phys. Chem. B 2011, 116, 571–584. [Google Scholar] [CrossRef]
  60. Irebo, T.; Reece, S.Y.; Sjoedin, M.; Nocera, D.G.; Hammarström, L. Proton-Coupled Electron Transfer of Tyrosine Oxidation: Buffer Dependence and Parallel Mechanisms. J. Am. Chem. Soc. 2007, 129, 15462–15464. [Google Scholar] [CrossRef]
  61. Wenger, O.S. Proton-Coupled Electron Transfer with Photoexcited Metal Complexes. Acc. Chem. Res. 2013, 46, 1517–1526. [Google Scholar] [CrossRef]
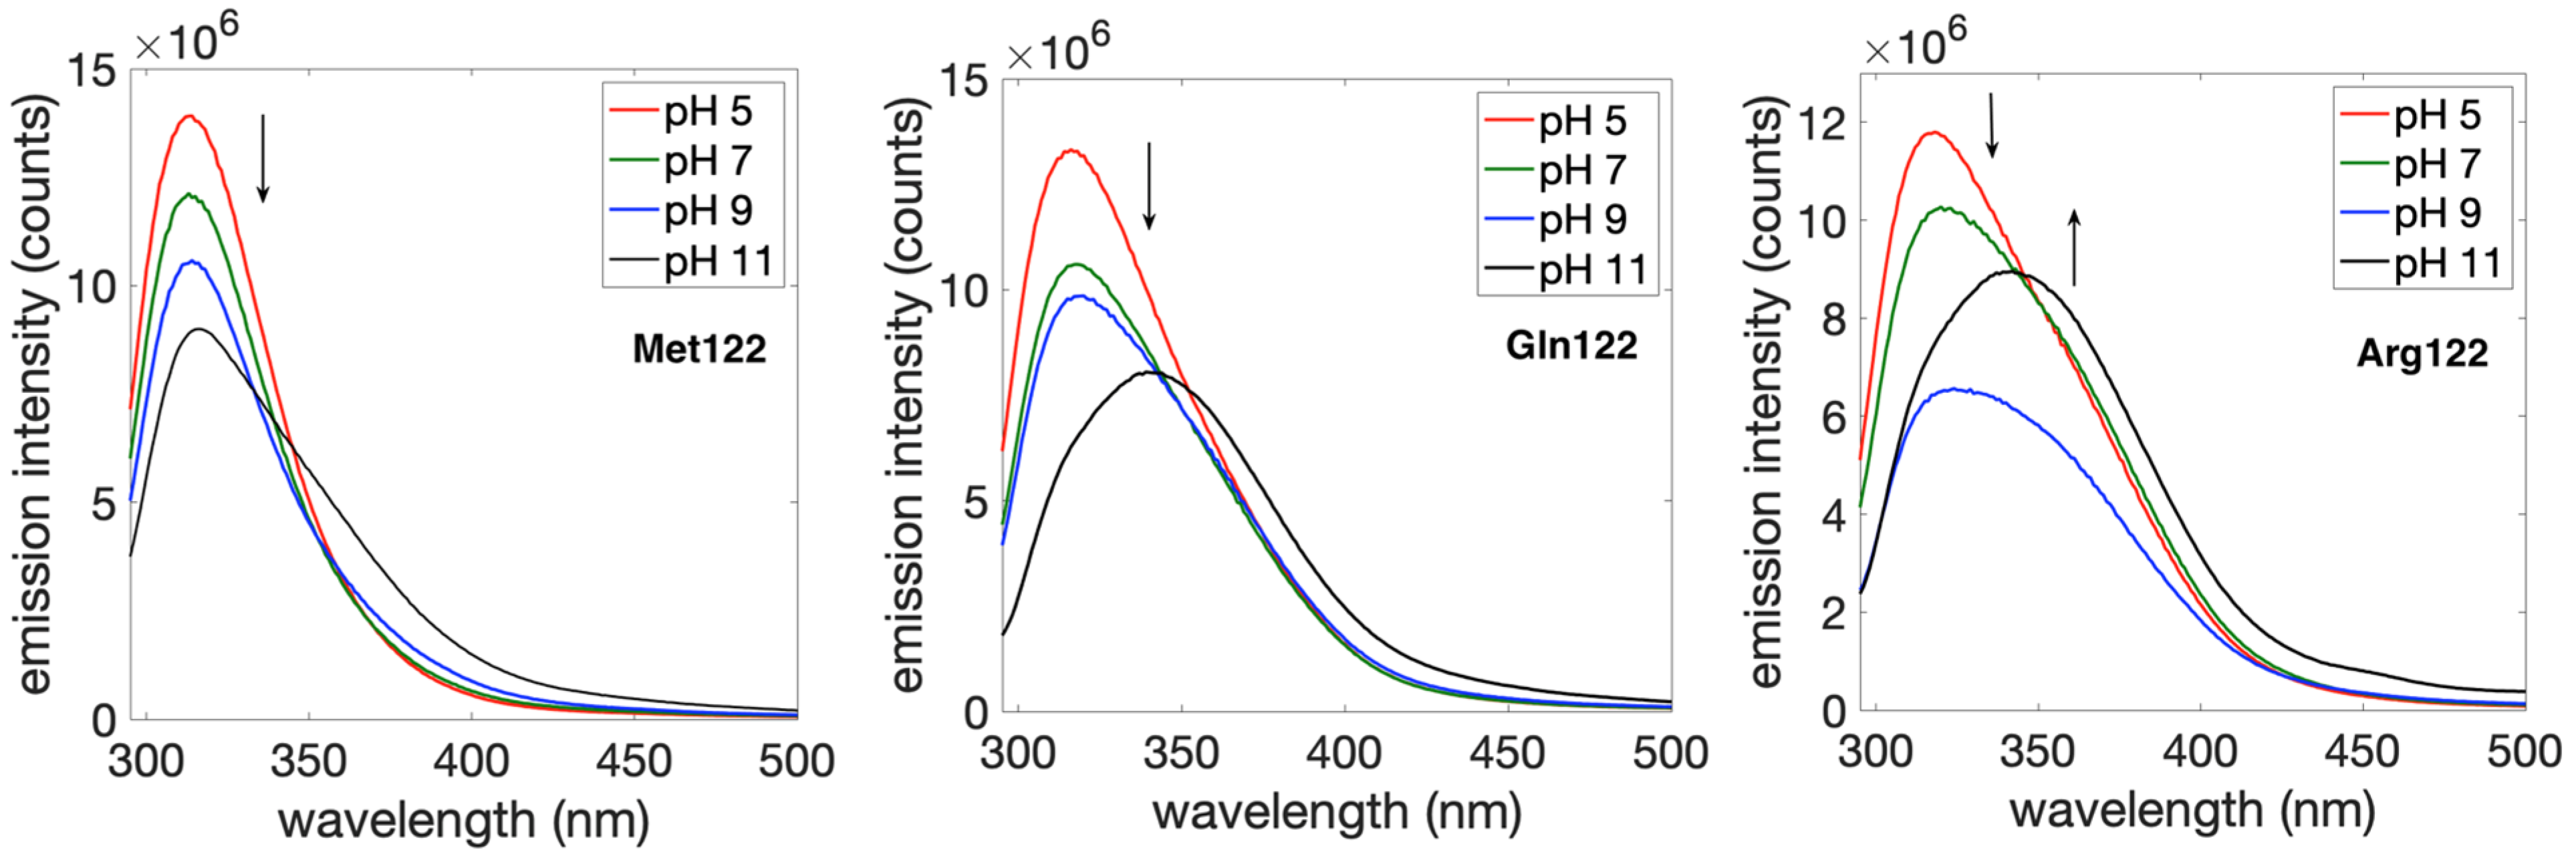
Figure 2. Fluorescence spectra of 60 µM solutions of His107Tyr109(Met/Gln/Arg)122 azurins in 50 mM sodium phosphate buffer at the given pH values. The excitation wavelength was 280 nm. All samples were deoxygenated, and data were collected under a N2 atmosphere. The arrows indicate intensity changes as pH is increased. A figure showing spectra at all pH values is given in the Supporting Information (Figure S2).
Molecules 29 00350 g002
Figure 3. Examples of cyclic voltammograms 60 µM His107Tyr109(Met/Gln/Arg)122 azurins at pH 5, 7, and 9 in 100 mM NaOAc solutions. The blue solid line shows the Met122 variant, the red dotted line shows the Gln122 variant, and the black dashed line shows the Arg122 variant.
Molecules 29 00350 g003
Figure 4. Typical time-resolved laser spectroscopy kinetics traces at 628 nm showing CuI oxidation by flash-quench-generated Ru(III) oxidants. Data are in black dots and fits to a first order kinetics model are in red. Additional kinetics traces are provided in the Supporting Information (Figures S10–S16).
Molecules 29 00350 g004
Figure 5. Hopping map for RuHis107Tyr109X122 azurins. The map was generated using through-bond distances where r(Ru-Tyr109) = 16.5 Å, r(Tyr109-Cu) = 18.3 Å, and r(Ru-Cu) = 34.8 Å. The λ value was 0.8 eV, T = 298K, and the distance decay constant β = 1.1 Å−1. The dashed line at the top shows the driving force for ET from Tyr109 to Ru(III) assuming a potential of 1.4 V for Tyr109•+/0. The dashed rectangle indicates the driving force regime relevant here.
Molecules 29 00350 g005
Table 1. Tyr emission maxima of His107Tyr109(Met/Gln/Arg)122 a.
pH =4567891011
His107Tyr109Met122313313314313314314314315
His107Tyr109Gln122316316316317317318319340
His107Tyr109Arg122317317318319321321324341
a Deoxygenated samples of 65 μM azurin in 50 mM sodium phosphate buffer. Error on all values is estimated to be ±1 nm.
Table 2. Cu(II/I) and Tyr109(•/0) peak potentials in His107Tyr109(Met/Gln/Arg)122 azurins a.
pH =56789
Cu0.3480.3390.3120.2920.288
Tyr109Met1221.040.9750.9300.8770.876
Tyr109Gln1221.020.9620.9270.8980.893
Tyr109Arg1221.020.9800.9120.8800.876
a Potentials reported in V versus NHE. Estimated errors are ±10 mV.
Table 3. Rate constants (kobs) for CuI oxidation by flash-quench generated Ru(III) oxidants a.
pHMet122Gln122Arg122Lys122 b
6(6.8 ± 0.5) × 103
3.83
(6.3 ± 0.6) × 103
3.80
(5.4 ± 1.1) × 103
3.73
(5.7 ± 0.3) × 103
3.76
7(1.2 ± 0.1) × 104
4.09
(1.1 ± 0.1) × 104
4.03
(1.1 ± 0.1) × 104
4.05
(1.2 ± 0.2) × 104
4.08
8(1.8 ± 0.1) × 104
4.26
(1.6 ± 0.1) × 104
4.19
(1.6 ± 0.1) × 104
4.19
(1.7 ± 0.2) × 104
4.23
9(2.6 ± 0.1) × 104
4.42
(2.1 ± 0.1) × 104
4.33
(2.2 ± 0.1) × 104
4.32
(1.8 ± 0.2) × 104
4.26
a Rate constants in s−1. The second value in each column is logkobs. Ru(III) = Ru(III)(2,2′-bipyridyl)(imidazole)(His107). b Data from reference [27].
Disclaimer/Publisher’s Note: The statements, opinions and data contained in all publications are solely those of the individual author(s) and contributor(s) and not of MDPI and/or the editor(s). MDPI and/or the editor(s) disclaim responsibility for any injury to people or property resulting from any ideas, methods, instructions or products referred to in the content.