Abstract
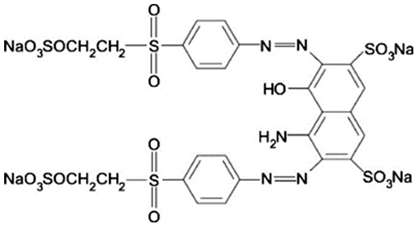
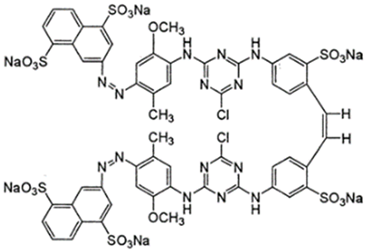
This article presents studies on the sorption of the anionic dyes Reactive Black 5 (RB5) and Reactive Yellow 84 (RY84) from solutions of single dyes and from dye mixtures onto three chitosan sorbents–chitin, chitosan DD75% and chitosan DD95%. In this work, the influence of pH on sorption efficiency, the sorption equilibrium time for the tested anionic dyes and the sorption capacity in relation to the individual dyes and their mixtures were determined. It has been found that the sorption process for both dyes was most effective at pH 3 for chitin and chitosan DD75 and at pH 4 for chitosan DD95%. The obtained results were described by the double Langmuir equation (Langmuir 2). The obtained constants made it possible to determine the affinity of the tested dyes for the three sorbents and the sorption capacity of the sorbents. For RB5, the highest sorption capacity for chitosan DD95% was achieved with sorption from a single solution–of 742 mg/g DM and with sorption from mixed dyes–of 528 mg/g DM. For RY84, the highest efficiency was also achieved for chitosan DD95% and was 760 mg/g DM for a single dye solution and 437 mg/g DM for a mixture of dyes.
1. Introduction
Dyes are defined as chemical compounds of natural or synthetic origin that selectively absorb electromagnetic radiation in the wavelength range of 400–700 nm. These compounds have the ability to give colour to various materials. They are used in the textile, tanning, textile, paper, pharmaceutical, plastics and cosmetics industries [1,2]. The properties of synthetic dyes are determined by their chemical structure. Dyes have chromophore groups that selectively absorb electromagnetic radiation—they cause the production of colour and auxochrome groups that are responsible for the affinity to coloured materials, improve the durability of the colour and give the dyes properties such as solubility in water or organic and mineral solvents [3]. Anionic dyes are compounds that dissociate in aqueous solutions and form a coloured anion. They are characterised by an intensive and permanent colour and very good solubility in water [4]. Among the anionic dyes, there are reactive dyes in the form of organic salts, bases and acids. They are characterised by their ability to form a permanent chemical bond with the dyed material thanks to the presence of active groups in the molecule, e.g., vinyl sulphonic acid. They are used for dyeing cellulose fibres, wool and silk [5].
Among the methods for decolourising coloured wastewater there are the following: biological and physicochemical [6]. Biological methods use reactors with activated sludge or biofilm beds to treat coloured wastewater. The effectiveness of this group of methods depends on the concentration of dyes and the residence time in the system. Biological methods are characterised by low efficiency, which is due to the low susceptibility of the dyes to biodegradation. Biological treatment processes for coloured wastewater are generally lengthy [7]. The toxic effect of some dyes on microorganisms can also contribute to low treatment efficiency.
Physicochemical methods of wastewater decolourisation include coagulation, whose disadvantage is a large amount of sludge formation [8,9]; electrocoagulation, whose main disadvantage is high electricity consumption [10]; membrane methods, whose disadvantage is the high price of membranes, the need to ensure high pressure during the process and high water losses [11]; ozonation, whose disadvantage is the possibility of formation of organic compounds with toxic and carcinogenic effects [12]; and sorption, whose effectiveness depends mainly on the appropriate choice of sorbent. Sorbents can be waste products [9,13] from other industries that can be used in sorption processes to remove contaminants such as dyes, heavy metals or nutrients before final disposal [13,14]. These sorbents include chitosan sorbents. Chitin is a polysaccharide consisting of N-acetylglucosamine and forms a hard biomaterial that occurs everywhere in nature. Chitin is the second most abundant polymer after cellulose. Chitin and cellulose have a similar structural composition, with the exception that the hydroxyl groups attached to the carbon atom in chitin are replaced by an acetamide group. This allows for increased hydrogen bonding between neighbouring polymers. As a result, chitin is characterised by higher strength compared to cellulose [15].
Chitin forms the skeletons of crabs, lobsters and shrimps. It is also found in insects (e.g., ants or beetles) and cephalopods (e.g., squid and octopuses) or in the cell walls of fungi. On an industrial scale, however, chitin is obtained as a waste product during the processing of marine invertebrates such as crabs, shrimps, lobsters and krill [15].
Chitin is characterized by properties such as bioactivity, biodegradability and membrane- and fibre-forming. It also has sorption, chelating and antibacterial properties. Thanks to these properties, chitin has been widely used in medicine, pharmacy, cosmetics, textile and paper, and food industries [15,16,17].
Chitosan is a polysaccharide, a derivative of chitin, which is formed by partial deacetylation. This process involves the exchange of acetamide groups (which form the structure of chitin) for amino groups. The sorption capacity of chitosan changes with the degree of deacetylation (DD) and the number of amino groups.
Due to the presence of primary amino groups in the structure of chitosan, it adsorbs metal ions and many classes of dyes very well. For example, 1 g of properly prepared chitosan can bind 2 g of anionic dyes [18].
Chitosan is used as a sorbent for the decolourisation of coloured wastewater due to its properties such as non-toxicity, biocompatibility, biodegradability, antibacterial activity and high sorption capacity. Chitosan is also used in medicine, the textile and paper industry as well as in the food industry [19].
The form of the chitosan (flakes vs. hydrogel granules) and the degree of deacetylation influence its sorption capacity. Hydrogel granules with a loose structure and easy access to the sorption centres showed higher sorption capacities compared to flakes [1,20].
In post-dye wastewater, dyes are found individually or in two- and multi-component mixtures [20,21,22,23,24,25]. Compared to single dyes, the adsorption of mixtures can be complex, both due to the potential for interactions between the dyes in solution and their ability to compete for active sites on the adsorbent surface. In addition, the adsorption of each individual dye can alter the surface charge of the adsorbent and consequently cause a decrease or increase in the binding efficiency of other dyes present in the mixture.
In this study, the adsorption efficiency of a mixture of reactive dyes Reactive Black 5 (RB5) and Reactive Yellow 84 (RY84), popular in the textile industry, by chitin and chitosan with different degrees of deacetylation was investigated.
2. Results and Discussion
2.1. FTIR Analysis
The FTIR spectra of the tested materials are typical for polysaccharides (Figure 1). The peaks at 1060 cm−1 and 1026 cm−1 indicate the stretching of the C-O bond on the C3 and C6 carbons of the saccharide rings [26]. The peaks at 1150 cm−1 and 1200 cm−1 are attributed to the asymmetric and symmetric stretching of the glycosidic C-O-C bond between the pyranose rings [27]. In contrast, the peaks at 1110 cm−1, 950 cm−1 and 896 cm−1 are attributed to the stretching of the skeletons of the saccharide rings [27,28]. Peaks at 2920 cm−1 and 2876 cm−1 indicate symmetric and asymmetric stretching of the C-H bond in the side chains of chitin and chitosan (-CH2-OH) [27,29] and deformation of CH2 within these chains [30]. A wide absorption band of 3500–3000 cm−1 is attributed to the stretching of the O-H bond of hydroxyl functional groups [26].
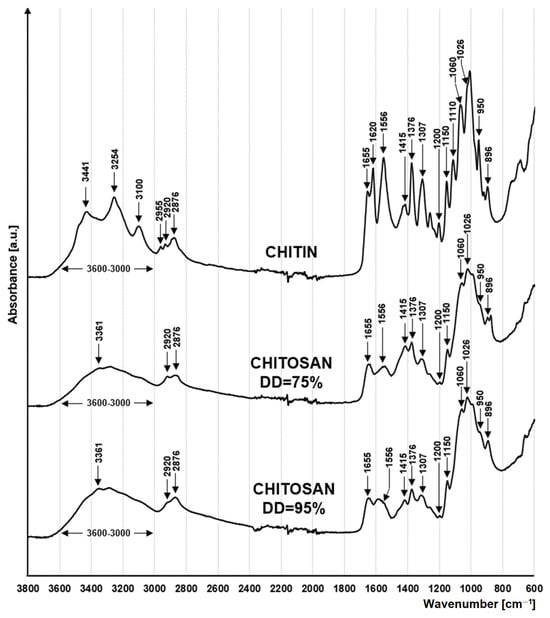
Figure 1.
FTIR spectra for chitin, chitosan DD = 75% and chitosan DD = 95%.
Peaks associated with the presence of the acetamide functional group (-NHCOCH3) are characteristic of the chitin spectrum. These include peaks at 2955 cm−1 and 1376 cm−1 indicating the presence of the -CH3 group [31], peaks at 3254 cm−1, 3100 cm−1 corresponding to the N-H bond of the amide, as well as peaks at 1655 cm−1 and 1620 cm−1 indicating the presence of a C=O bond [32], as well as a peak at 1307 cm−1 indicating the stretching of the C-H bond [33]. Peaks associated with the presence of acetamide groups are much lower in the chitosan spectra or are obscured by neighbouring peaks (Figure 1). The effect obtained is related to the high degree of deacetylation of the tested chitosan (DD = 75%/DD = 90%).
A characteristic feature of chitosan is the primary amino groups that are formed as a result of deacetylation. The presence of -NH2 groups in the material is evidenced by the peak at 3361 cm−1 [34], which is best seen in chitosan with DD = 95%.
2.2. Effect of pH on Sorption Efficiency
The study of the optimal sorption of the dyes RB5 and RY84 by chitin, chitosan DD75 and chitosan DD95% was carried out in a pH range from 2 to 11. The duration of sorption was 180 min. The initial concentration of the two dyes was 50 mg/dm3. The results are shown in Figure 2.
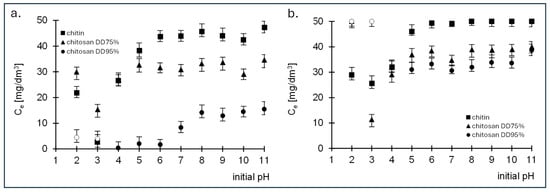
Figure 2.
Effect of pH on the effectiveness of sorption of (a) RB5 and (b) RY84 onto chitin, chitosan DD75% and chitosan DD95% (sorbent dose 1 g/dm3).
The RB5 dye was removed most efficiently at pH 3 with both chitin and chitosan DD75 (Figure 2a). In contrast, chitosan DD95% was found to have the lowest final concentration at pH 4 (Figure 2a). Based on the results obtained, it is clear that the amount of RB5 dye removed decreases with increasing pH, regardless of the sorbent used. The high efficiency of RB5 sorption on the tested sorbents at low pH is the result of a positive charge on the surface of the sorbents. The protonated functional groups of the sorbents electrostatically attract the anionic dye RB5, which increases the sorption efficiency. At high pH values, the surface of the sorbent acquires a negative charge, whereby the anionic dye is repelled and can only be absorbed with difficulty. In case of the second dye tested, RY84, the highest sorption was also observed at pH 3 for chitin and chitosan DD75 and at pH 4 for chitosan DD95% (Figure 2b).
Based on the adsorption results obtained, a pH value of 3 for chitin and chitosan DD75 and a pH value of 4 for chitosan DD95% were assumed for further studies.
Both decreasing the pH to 2.0 and increasing it had a negative effect on the amount of bound dye, regardless of the type of adsorbent.
For chitosan adsorbents, a strongly acidic environment (pH 2) proved to be unfavourable and led to a deterioration in the mechanical properties of the adsorbent, resulting in its destruction.
The binding efficiency of the dyes was related to the protonation of the amino groups of the chitosan according to the following reaction:
R − NH2 + H+ ↔ R − NH3+
At the same time, one molecule of the reactive dye dissociates:
D − SO3Na → D − SO3− Na+
The adsorption process therefore took place through an electrostatic interaction between the two molecules:
R − NH3+ and D − SO3−
R − NH3+ + D − SO3− ↔ R − NH3+ − SO3− − D
Increasing the pH of the solution reduced the electrostatic interaction due to deprotonation of the amino groups. However, chitosan continued to adsorb the dye molecules at pH 6–11, but to a lesser extent. This can be explained by a combination of other interactions such as van der Waals forces and hydrogen bonding. In a strongly alkaline reaction, the hydroxyl groups of chitosan were deprotonated according to the following reaction:
−CH2OH + OH− ↔ CH2O− + H2O.
The binding mechanism of anionic dyes to chitin follows the same reactions. The only difference is that, due to its high degree of acetylation, chitin mainly contains −CO−NH− amide groups, which is not as easily protonated in acidic solutions as the amino groups of chitosan.
Based on the results from the first phase of the study, it can be concluded that the pH value of the aqueous solutions of dyes has a significant influence on sorption efficiency. For both dyes tested, it was observed that the sorption efficiency decreased with the increase in pH. In the article by T. Jóźwiak et al. [1], in which they investigated the effects of the degree of chitosan deacetylation on the sorption of RB5 dye from aqueous solutions, they obtained the highest sorption capacity at a pH of 4, while above this pH the sorption efficiency decreased for all tested sorbents. Moreover, in the article by U. Filipkowska et al. [35], in their study of the sorption efficiency of the dyes RB5 and RY84 using chitin and chitin subjected to the ammonification process as sorbent, they showed that the adsorption of both anionic dyes is most effective at low pH values. For chitin, the pH value is 2–4, while for modified chitin the sorption of dyes was highest at pH 2–3. At higher pH values, a decrease in efficiency was also observed as the pH of the solution increased.
2.3. Determination of the Sorption Equilibrium Time
The effect of time on the removal efficiency of RB5 and RY84 dyes by adsorption on chitin, chitosan DD75 and chitosan DD95% was evaluated by the changes in the concentration of dye remaining in the solution after time t. Sorption was carried out at an optimum pH value, which was pH 3 for chitin and chitosan DD75 and pH = 4 for chitosan DD95%. The initial concentration of the dyes was 50 mg/dm3. The results are shown in Figure 3.
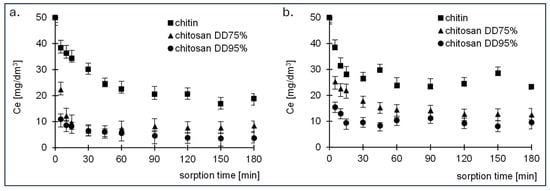
Figure 3.
Changes in (a) RB5 and (b) RY84 dye concentration over time during adsorption onto chitin, chitosan DD75 and chitosan DD95%.
The sorption equilibrium time for both dyes was longer for chitin and was 90 min. For the two tested chitosan samples, equilibrium was reached after a much shorter time of 30 min.
From the test results, it can be concluded that the change in the concentration remaining in the solution in case of chitin has three different zones: The first phase took place between 5–15 min, during which there was immediate adsorption of the dyes (the remaining concentration decreased by about 30%), indicating rapid external diffusion and adsorption on the surface of the adsorbent (Table 2). The second phase lasted between 20 and 85 min, during which the last free active centres were saturated by the dye molecules. After the second phase, the system entered a state of equilibrium.
The literature data confirm that the sorption equilibrium time depends on the type of adsorbent, the adsorbate and the process conditions [5,36,37]. In their study on the use of chitin and chitosan for the removal of the reactive dye Reactive Black 5, P. Szymczyk et al. [38] achieved the sorption equilibrium time after 360 min for chitin and 72 h for chitosan. G. Gibbs et al. [39] showed in their study of the sorption of the dye Acid Green 25 by chitosan that the adsorption process of the dye was completed after 1–2 h. On the other hand, K. Azlan et al. [40] showed in their studies on the sorption of acid dyes using chitosan and chemically modified chitosan as sorbents that the sorption equilibrium time for Acid Red 37 was 100 min.
2.4. Determination of the Kinetics of Dye Sorption onto Tested Sorbents
Experimental data from studies on the kinetics of sorption of RB5 and RY84 to chitin and chitosan (DD75% and DD95%) are described by pseudo-first-order and pseudo-second-order models (Figure 4, Table 1). In each research series, the pseudo-second order model showed better fit to the obtained data, which is a typical result for the sorption of organic dyes on biosorbents.
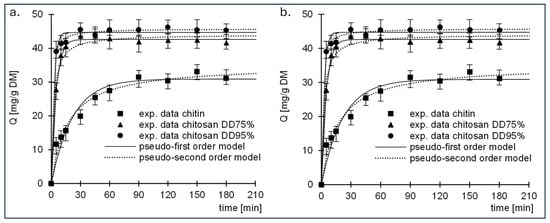
Figure 4.
Sorption kinetics of (a) RB5 and (b) RY84 onto chitin, chitosan DD75 and chitosan DD95.

Table 1.
Kinetic parameters of dye sorption onto chitin, chitosan DD75% and chitosan DD95%.
The data are also described by the intramolecular diffusion model (Figure 5, Table 2). Analysis of the data presented in the graphs shows that sorption of RB5 and RY84 occurred in 2 phases for each tested sorbent.
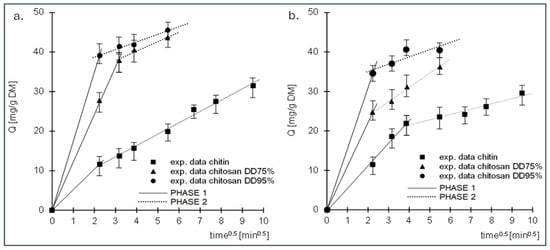
Figure 5.
Intraparticle diffusion model of the sorption of (a) RB5 and (b) RY84 onto chitin, chitosan DD75 and chitosan DD95.

Table 2.
Dye diffusion rate constants determined using the intraparticle diffusion model.
The first phase of sorption was characterised by high intensity but short duration. The dye ions diffused from the solution into the vicinity of the sorbent and then attached to the sorption centres on its surface. When the dye ions had saturated most of the active sites on the surface of the sorbent, the second phase began. Phase two was characterised by a longer duration but lower intensity than phase one. In this phase, the dye ions were bound to the less accessible sorption centres in the deeper layers of the sorbent. Due to the poorer availability of active sites, this phase was characterised by a much lower intensity than the first phase and a longer duration. After the last free active sites available in the sorption structure were saturated, the system reached equilibrium.
The values of qe, (cal.) determined by the pseudo-second-order model and the values of kd1 determined by the intramolecular diffusion model show that the sorption of RB5 and RY84 on the tested sorbents increased in the following order: chitin < chitosan DD75% < chitosan DD95%. The result is due to the increasing number of primary amino groups in this series, which are the most important sorption centres for anionic dyes.
2.5. Determination of the Sorption Capacity of Individual Dyes
The sorption capacity of the tested sorbents was determined at initial concentrations of the colourants RB5 and RY84 of 5–500 mg/dm3 (chitin) and 5–1000 mg/dm3 (chitosan DD75% and DD95%). This study was conducted at a pH and equilibrium time determined in an earlier phase.
The experimental results showing the relationship between the amount of adsorbed dye and the equilibrium concentration, as well as the Langmuir, Langmuir 2 and Freundlich isotherms determined on their basis, are shown in Figure 6, Figure 7 and Figure 8. The constants determined from Equations (5)–(7) for all dyes tested are listed in Table 3, Table 4, Table 5, Table 6, Table 7 and Table 8.
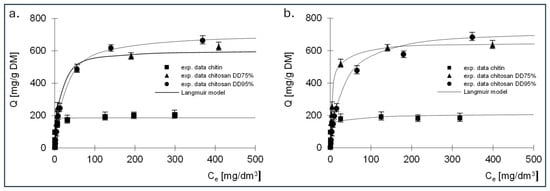
Figure 6.
Isotherms of (a) RB5 and (b) RY84 sorption onto chitin, chitosan DD75 and chitosan DD90 (sorbent dose 1 g/dm3). Langmuir model.
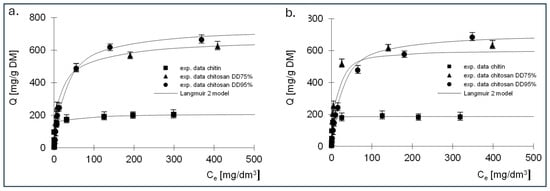
Figure 7.
Isotherms of (a) RB5 and (b) RY84 sorption onto chitin, chitosan DD75 and chitosan DD90 (sorbent dose 1 g/dm3). Langmuir 2 model.
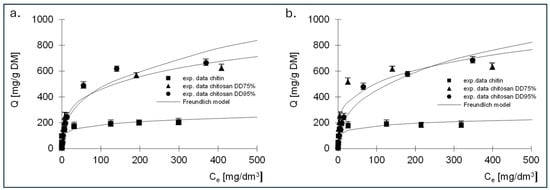
Figure 8.
Isotherms of (a) RB5 and (b) RY84 sorption onto chitin, chitosan DD75 and chitosan DD90 (sorbent dose 1 g/dm3). Freundlich model.

Table 3.
Constants determined from the Langmuir model for RB5—sorption of single dyes.

Table 4.
Constants determined from the Langmuir model for RY84—sorption of single dyes.

Table 5.
Constants determined from the Langmuir 2 model for RB5—sorption of single dyes.

Table 6.
Constants determined from the Langmuir 2 model for RY84—sorption of single dyes.

Table 7.
Constants determined from the Freundlich model for RB5—sorption of single dyes.

Table 8.
Constants determined from the Langmuir 2 model for RY84—sorption of single dyes.
The best fit of the experimental data was obtained for the Langmuir 2 model; therefore, the mechanism of dye sorption was discussed based on this model. The presented data show that, regardless of the dye tested, the adsorption capacity of chitin at 211 mg/g DM for RB5 and 192 mg/g DM for RY84 was three times lower compared to chitosan adsorbents (680–742 mg/g DM for RB5 and 650–760 mg/g DM for RY84).
Analysis of the results of the constants from Langmuir’s Equation (2), shown in Table 5 and Table 6, indicates that there are two types of sorption centres in the tested sorbents.
A different mechanism of dye binding on the three tested adsorbents is evidenced by the values of the K constants describing the affinity of the adsorbate to the adsorbent (Table 4 and Table 6). The K1 constants determined for the active sites of the first type for chitin were high for both dyes and amounted to 6.28 and 3.92 dm3/mg, which could indicate strong binding of the dyes to chitin. The values of the K1 constants for chitosan DD75%, determined using the Langmuir double model, were an order of magnitude lower, ranging from 0.186 dm3/mg for RB5 to 0.23 dm3/mg for RY84. In case of the third sorbent with the highest DD95%, a further decrease in K1 was observed, amounting to 0.022 dm3/mg and 0.13 dm3/mg for RB5 and RY84, respectively.
The values of the K2 constants that describe the affinity for type II active sites were lower than the values of K1 regardless of the type of adsorbent and ranged from 0.017 (RY84, chitosan DD95%) to 0.581 dm3/mg (RY84, chitin). It should be noted that for both dyes, an increase in the degree of deacetylation of the sorbent led to a decrease in the solids content of K1 and K2. This could indicate that the binding to the sorbent with a higher degree of deacetylation is of a different nature than the binding to chitin.
The high affinity of the dye for chitin is due to the ability to bind the tested dyes on a positively charged surface through both electrostatic interactions and hydrogen bonding. This could indicate a stronger binding energy of the dye with chitin and a more chemical nature of the bond. Lower affinity values could indicate a physical bond.
This is confirmed by the sorption capacities determined for two types of active sites. In case of chitin, the b1 values describing the capacities at the active sites of the first type were about three times higher than the b2 values describing the capacities at the active sites of the second type. In case of chitosan DD95%, an inverse relationship was observed. The K2 values were higher than the K1 values and the b2 values were also higher than the b1 values.
The sorption capacities achieved in this study were comparable to or higher than those achieved by other researchers. The amount of bound dye depended on the way the chitin was prepared—flakes, hydrogel beads—and on the type of dye. In their study, Kurnia et al. obtained chitin capacities ranging from 38.21 to 45.87 mg/g [41].
The adsorption and desorption of malachite green with chitosan beads in deep eutectic solvents presented in the work of Sadiq et al. resulted in a capacity of 4.4 mg/g [42]. Tang et al., who investigated the sorption of malachite green, determined an adoption capacity of 29.5 mg/g for chitin hydrogels [43]. The capacities obtained in this study were much higher and amounted to 211 mg/g DM (RB5) and 192 mg/g DM (RY84) for chitin. The removal efficiencies of the two tested dyes on chitosan DD75% and DD95% were also high and were 680 and 650 mg/g DM for chitosan DD75% and 742 and 760 mg/g DM for chitosan DD95% for RB5 and RY84, respectively.
2.6. Determination of the Sorption Capacity of Dyes from Mixtures
In dyeing wastewater, dyes are usually found in two- and multi-component mixtures. Compared to single dyes, the adsorption of mixtures can be complex, both because of the potential for interactions between the dyes in solution and their ability to compete for active sites on the surface of the adsorbent. In addition, the adsorption of each individual dye may alter the surface charge of the adsorbent and consequently cause a decrease or increase in the binding efficiency of the other dyes present in the mixture. The aim of the study was to investigate the possibility of using chitosan sorbents for the sorption of RB5 and RY84 dyes from their mixture of aqueous solutions.
The studies were carried out in two variants—with a constant RY84 concentration of 50 mg/dm3 and a variable RB5 concentration of 5 to 500 mg/dm3 for chitin and 5 to 1000 mg/dm3 for chitosan DD75% and DD95%, and with a constant RB5 concentration of 50 mg/dm3 and a variable RY84 concentration of 5 to 500 mg/dm3 for chitin and 5 to 1000 mg/dm3 for chitosan DD75% and DD95%.
The results of the studies on the sorption of the dye with variable concentration and constants determined using the Langmuir 2 model are shown in Figure 9 and in Table 9 and Table 10.
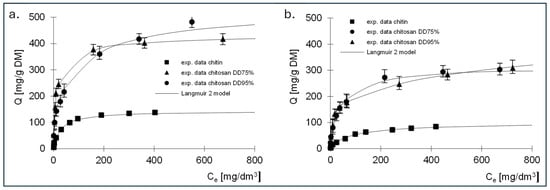
Figure 9.
Isotherms of sorption of (a) RB5 and (b) RY84 from mixture dyes onto a. chitin, b. chitosan DD75% and c. chitosan DD90 (sorbent doze 1 g/dm3) (a. const. conc. RY84–50 mg/dm3, b. const. conc. RY84–50 mg/dm3).

Table 9.
Constants determined from Langmuir 2 model for RB5 dye—sorption of dye mixtures (constant concentration RY84–50 mg/dm3).

Table 10.
Constants determined from Langmuir 2 model for RT84 dye—sorption of dye mixtures (constant concentration RB5–50 mg/dm3).
Based on the obtained results, it can be seen that the sorption mechanism of the two tested dyes has changed. A lower sorption capacity was observed for the three sorbents. A greater decrease in the amount of dye absorbed was observed for RY84, which was 47.7% for chitin, 51% for chitosan DD75% and 42.5% for chitosan DD95%. In case of RB5, the effect of the presence of a second dye was lower and resulted in a decrease in the amount of bound dye by 32% for chitin, 36% for chitosan DD95% and 28.8% for chitosan DD95%.
A decrease in affinity was observed on the first type sites for chitin and chitosan DD75% (constant K1–Table 6). This trend was particularly visible for chitin, where the K1 value decreased from 6.28 to 0.031 dm3/mg for RB5 and from 3.92 to 0.009 dm3/mg for RY84. This could indicate that the presence of a second dye changed the nature of the binding from chemical to physical. No such phenomenon was observed in case of chitosan DD95%. Already in the sorption of dyes from single solutions, the obtained values of K1 and K2 solids indicated a more physical nature of sorption compared to chitin and chitosan DD95%.
In addition, the sorption capacities at the active sites of the second type were higher than at the sites of the first type, just as in the sorption of dyes from simple solutions.
Thus, increasing the degree of deacetylation of chitosan not only increased the overall sorption capacity, but also the binding method of the dyes tested.
Figure 10 and Figure 11 show the amount of dye removed that was present in the mixtures at a constant initial concentration of 50 mg/dm3. The test number indicates the consecutive concentration for which the values in Figure 8 and Figure 9 were determined.
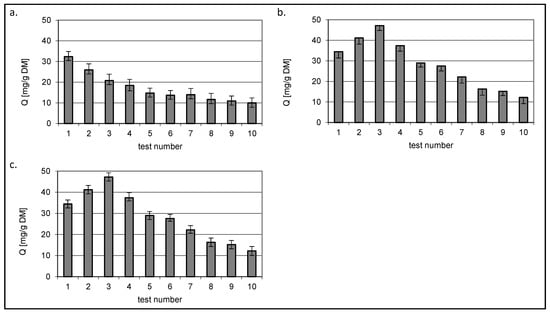
Figure 10.
Isotherms of RB5 sorption from mixture dyes onto (a) chitin, (b) chitosan DD75% and (c) chitosan DD95% at constant RB5 concentration 50 mg/dm3 (sorbent dose 1 g/dm3).
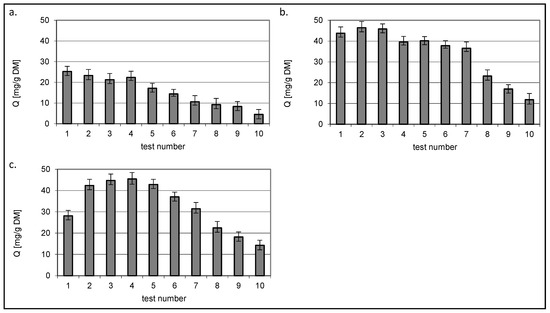
Figure 11.
Isotherms of RY84 sorption from mixture dyes onto (a) chitin, (b) chitosan DD75% and (c) chitosan DD95% at constant RY84 concentration 50 mg/dm3 (sorbent dose 1 g/dm3).
Regardless of the sorbed colourant, a decrease in the Q value was observed for chitin with increasing concentration of the second dye present in the mixture.
A different relationship was observed for the two chitin sorbents DD75% and DD95%. The amount of bound dye in constant concentration mixtures reached the highest value in the third test where the variable concentration dye was present at a concentration of 50 mg/dm3, i.e., when the concentrations of both dyes were equal.
In the dyeing processes in the industries that use dyes, especially in the textile industry, a variety of dyes are used, which can be found in wastewater in the form of mixtures. The combination of different dyes in a mixture can affect the removal efficiency and make the removal process a challenge. The main reason for this is the presence of different functional groups in different dye classes. The amount of dye removed is also influenced by other factors such as pH or equilibrium time. Therefore, all parameters should be considered in the removal process. In the literature, studies on the removal of dye mixtures are not as commonly described as studies on the removal of dyes from single solutions. This may be caused by much more complicated and time-consuming research, but also by the need to describe the obtained results with a suitable model.
In this study, the double Langmuir model was used to describe the sorption of RB5 and RY84. The R2 coefficient values showed a very good fit of the Langmuir 2 isotherm, both in the case of sorption of dyes from single solutions and from their mixtures. Yu et al. [44] also showed that the adsorption amount and the equilibrium amount of the single dye system and the mixed system were consistent with the Langmuir model and the extended Langmuir isotherm.
Studies by Mavinkattimath et al. [45], Regti [22] and Giwa et al. [46] have also shown that the pH at which the sorption process is most effective depends on the type of sorbent and dye but is analogous for individual dyes and their mixtures. The same results were obtained in this study. This is very important when planning the use of sorption for the removal of dyes under real conditions, where we are mostly dealing with dye mixtures.
The adsorption capacity when sorbed from solutions of single dyes is always higher than the amount of removed dye when sorbed from the mixture. The reason for this is the competition of the dyes present in the mixture for the active sites of the sorbent. However, the total amount of dye removed is comparable to or higher than when sorbed from single solutions. The competition is also due to the fact that the tests were performed for dyes of the same type—cationic or anionic. This is justified because in practice one type of dye is used for colouring during a process.
Şahin [47] investigated the sorption of mixtures of reactive dyes on wool, Regti et al. [22] investigated the sorption of basic dyes on two types of activated carbon, Giwa et al. [46] researched competitive biosorptive removal of a basic dye from a ternary dye mixture using sawdust, and Mavinkattimath et al. [45] explored the simultaneous adsorption of Remazol brilliant blue and Disperse orange dyes on red mud.
3. Materials
3.1. Dyes
The dyes used in the study, Reactive Black 5 (RB5) and Reactive Yellow 84 (RY84), are anionic dyes produced by the dye factory ZPB “Boruta” SA in Zgierz (Table 11).

Table 11.
Characteristics of Reactive Black 5 and Reactive Yellow 84.
3.2. Sorbents
Chitin in the form of flakes with a degree of deacetylation DD = 35% and chitosan (DD 75 and DD95) from Heppe Medical Chitosan GmbH in Halle were used for this study. The source of the raw material was crab shells. Chitosan was characterised by a viscosity of 100 mPas, ash content ≤ 1%, a dry matter content > 85% and a heavy metal content Hg ≤ 0.2 ppm and Cd- ≤ 0.5 ppm.
4. Methodology
4.1. Investigation of the Influence of the pH Value on the Efficiency of the Sorption of Dyes
This study began with the preparation of RB5 and RY84 working solutions at a concentration of 50 mg/dm3. An amount of 25 mg of each dye was weighed into beakers with a capacity of 1000 cm3 and then 500 cm3 of water with an appropriate pH was added. The pH ranged from 2 to pH 11. The 0.1 and 0.01 M NaOH (pH increase) or 0.1 and 0.01 M HCl (pH decrease) solutions were used to correct the pH.
Quantities of 0.1 g of chitin, chitosan DD75% and chitosan DD95% and 100 cm3 of the working solution of the tested dye with a pH of 2–11 were weighed into conical Erlenmeyer flasks with a capacity of 250 cm3. The flasks were then placed on a multistage magnetic stirrer MS-53M (JEIO TECH, Daejeon, Republic of Korea) with a mixing speed of 220 rpm. The concentration of the dye in the solution before and after sorption was measured using the spectrophotometric method. The UV-3100PC spectrophotometer (VWR spectrophotometers, VWR Interna-tional LLC., Mississauga, ON, Canada) was used to measure the absorbance of all samples at a wavelength of 600 nm for RB5 and 361 nm for RY84. Table 12 shows the parameters of the studies to determine the influence of pH on the sorption efficiency of the dyes.

Table 12.
Parameters of this study to determine the effect of pH on the efficiency of sorption of dyes.
4.2. Studies on the Influence of Time on the Effectiveness of Dyes
Six beakers with a capacity of 1000 cm3 were weighed with 50 mg of a given dye, then 1000 cm3 of water with the optimum pH determined for each dye and sorbent in the previous phase of this study and 1 g of sorbent were added. Table 13 shows the parameters of the tests to determine the sorption equilibrium time for the sorbents and dyes tested.

Table 13.
Parameters of research on the determination of the sorption equilibrium time.
4.3. Testing the Efficiency of Sorption Capacity against Single Dyes
This study began with the preparation of a stock solution. For this purpose, 1 g of the dyes RB5 and RY84 were weighed out in powder form. Each dye was then quantitatively transferred to 1000 cm3 volumetric flasks to which distilled water was added at a pH determined for each dye and sorbent. The concentration of the dye in the solution was 1000 mg/dm3. Working solutions with an optimum pH value were then prepared from the stock solutions in PP containers (100 cm3). The concentrations of the dyes in the working solutions ranged from 5 to 500 mg/dm3 for chitin and from 5 to 1000 mg/dm3 for chitosan DD75% and chitosan DD95%. Before starting sorption, the initial concentration of each sample was measured with a spectrophotometer at a wavelength of 600 nm for RB5 and 361 nm for RY84.
Then, 0.1 g of chitin, chitosan DD75% and chitosan DD95% were weighed into 250 cm3 conical Erlenmeyer flasks and the prepared dye solutions were added at the appropriate concentrations. The flasks were placed on a magnetic stirrer for a specific sorption equilibrium time. At the end of the sorption process, the concentration of dyes remaining in the solution was determined. Table 14 shows the parameters of the tests to determine the sorption capacity of the sorbents tested.

Table 14.
Parameters of research on the sorption capacity of sorbents.
4.4. Testing the Sorption Capacity of Dye Mixtures
The next phase of this study began with the preparation of basic dye solutions with a concentration of 2000 mg/dm3. For this purpose, 2 g each of the dyes RB5 and RY84 were weighed on an analytical balance, quantitatively transferred to volumetric flasks with a capacity of 1000 cm3, and water with the corresponding pH value was added.
Then, 50 cm3 of the working solution with concentrations from 10 to 1000 mg/dm3 (chitin) and from 10 to 2000 mg/dm3 (chitosan DD75% and DD95%) were placed in PP containers. Then, 50 and 100 cm3 of the stock solutions were measured into 1000 cm3 beakers, andwater with the appropriate pH was added. The next step was to add the solutions of a particular dye at a constant concentration to the solutions prepared in 50 cm3 PP containers. After mixing the solutions of the two dyes, the initial concentration of the dye mixture was read at wavelengths of 600 nm and 361 nm. For each combination of dye concentrations, a conversion factor was determined to convert the absorbance reading to the value of the concentration remaining after sorption. Table 15 shows the parameters of the tests to determine the sorption capacity in relation to the dye mixture.

Table 15.
Parameters of research on the sorption capacity of sorbents in relation to the mixture of dyes.
The 0.1 g of chitin, chitosan DD75% and DD95% were weighed into 250 cm3 Erlenmeyer flasks and 100 cm3 of prepared solutions of a dye mixture with variable concentration of one of the dyes was added. The samples were placed on a magnetic stirrer. After the sorption process, samples were taken to measure the concentration of dye remaining in the solution. The concentrations were read at two wavelengths using a spectrophotometer.
4.5. FTIR Analysis
FTIR analysis of the sorbents tested was performed using the FT/IR-4700LE spectrometer with a single reflective diamond crystal ATR attachment (JASCO International, Tokyo, Japan). The scanning range of the samples ranged from 4000 to 400 cm−1. The resolution of the individual spectra was 1 cm−1. A total of 64 spectra were recorded for each sample and the results were then averaged. Before each measurement, the diamond crystal in the ATR was thoroughly cleaned with acetone and dried with a paper towel, after which a baseline correction was performed.
4.6. Calculation Methods
The amount of adsorbed dye was calculated from the relation (1):
QS—mass of adsorbed dye [mg/dm3];
CO—initial concentration of dye [mg/dm3];
CS—concentration of dye after sorption [mg/dm3];
m—mass of sorbent [g DM].
The kinetics of dye sorption onto tested sorbents was described using pseudo-first-order (2), pseudo-second-order (3) and intraparticle diffusion (4) models:
q—instantaneous value of sorbed dye [mg/g];
qe—the amount of dye sorbed at the equilibrium state [mg/g];
t—time of sorption [min];
k1—pseudo-first order adsorption rate constant [1/min];
k2—pseudo-second order adsorption rate constant [g/(mg × min)];
kid—intraparticular diffusion model adsorption rate constant [mg/(g × min0.5)].
The equation was used to determine the maximum adsorption capacity of the tested sorbents:
Langmuir’s isotherm (5):
Qe—equilibrium amount of sorbed dye [mg/g DM];
b—maximum sorption capacity [mg/g DM];
K—constant used in the Langmuir equation [dm3/mg];
Ce—concentration of dye remaining in the solution [mg/dm3].
Double Langmuir isotherm (6):
Qe—mass of sorbed dye [mg/g DM];
b1—maximum sorption capacity of the sorbent (type I active sites) [mg/g DM];
b2—maximum sorption capacity of the sorbent (type II active sites) [mg/g DM];
K1, K2—constants in Langmuir’s equation 2 [dm3/mg];
Ce—concentration of dye remaining in the solution [mg/dm3].
Freundlich isotherm (7):
Qe—actual sorption of sorbate on the sorbent [mg/g DM];
k—sorption equilibrium constant used in Freundlich’s model;
Ce—concentration of dye remaining in the solution [mg/dm3];
n—heterogeneity parameter.
5. Conclusions
Studies on the sorption of dye mixtures, especially using chitosan sorbents, are of key importance due to the environmental impact of textile dyes in wastewater. Understanding the factors that influence sorption yield, such as the form and degree of deacetylation of chitosan, could lead to the development of more effective methods for removing dyes from aqueous solutions.
A research problem that should be considered at the same time is the fact that impurities such as dyes usually occur as mixtures. Studies on the sorption of dye mixtures are important for the development of models to predict rate constants, equilibrium time, sorption rate or sorption capacity based on factors such as pH, sorbent dose or dye concentration.
In this study, the efficiency of anionic adsorption of the dyes Reactive Black 5 and Reactive Yellow 84 and their mixtures from aqueous solutions was investigated. The sorbents used in this study were chitin, chitosan DD75% and chitosan DD95%.
- –
- The efficiency of sorption of dyes onto chitosan sorbents depends on the pH value of the solution. The adsorption of the dyes RB5 and RY84 was most effective at a pH value of 3 for chitin and chitosan DD75% and at a pH value of 4 for chitosan DD95%.
- –
- The investigations carried out allow for the conclusion that the chitosan sorbents used are efficient biosorbents regarding anionic dyes.
- –
- The chitosan sorbents used in this study showed comparable sorption efficiency for both dyes, both in the sorption of single dyes and in the sorption of mixtures. The sorption efficiency depended much more on the type of sorbent than on the type of dye.
- –
- The use of the Langmuir 2 model to describe the maximum sorption capacity results indicates the presence of two types of active sites in the structure of the sorbents used.
- –
- The maximum sorption capacity of the used sorbents increased with increasing deacetylation rate in case of chitin to 211 and 192 mg/g DM for RB5 and RY84, respectively, for chitosan DD75% to 680 and 650 mg/g DM for RB5 and RY84, and for chitosan DD95% to 742 and 760 mg/d DM for RB5 and RY84, respectively.
- –
- The sorption studies of the dye mixture indicate that the tested dyes, RB5 and RY84, compete for the active sites of the chitosan sorbents. The sorption capacity determined for the dyes during sorption and mixing was lower than for sorption from single solutions.
Author Contributions
Conceptualization, U.F.; Methodology, U.F.; Software, T.J.; Formal analysis, U.F. and T.J.; Investigation, U.F. and T.J.; Resources, U.F. and T.J.; Data curation, U.F.; Writing—original draft, U.F. and T.J.; Writing—review & editing, U.F. and T.J.; Visualization, T.J.; Supervision, U.F. and T.J. All authors have read and agreed to the published version of the manuscript.
Funding
This study was financed under Project No. 29.610.023-110 of the University of Warmia and Mazury in Olsztyn, Poland.
Institutional Review Board Statement
Not applicable.
Informed Consent Statement
Not applicable.
Data Availability Statement
The data presented in this study are available on request from the corresponding authors.
Conflicts of Interest
The authors declare no conflicts of interest.
References
- Jóźwiak, T.; Filipkowska, U.; Szymczyk, P.; Zyśk, M. Effect of the Form and Deacetylation Degree of Chitosan Sorbents on Sorption Effectiveness of Reactive Black 5 from Aqueous Solutions. Int. J. Biol. Macromol. 2017, 95, 1169–1178. [Google Scholar] [CrossRef]
- Wang, X.; Jiang, J.; Gao, W. Reviewing Textile Wastewater Produced by Industries: Characteristics, Environmental Impacts, and Treatment Strategies. Water Sci. Technol. 2022, 85, 2076–2096. [Google Scholar] [CrossRef]
- Allen, S.; Koumanova, B. Decolourisation of Water/Wastewater Using Adsorption (Review). J. Univ. Chem. Technol. Metall. 2005, 40, 175–192. [Google Scholar]
- Bu, R.; Chen, F.; Li, J.; Li, W.; Yang, F. Adsorption Capability for Anionic Dyes on 2-Hydroxyethylammonium Acetate-Intercalated Layered Double Hydroxide. Colloids Surf. A Physicochem. Eng. Asp. 2016, 511, 312–319. [Google Scholar] [CrossRef]
- Wawrzkiewicz, M.; Hubicki, Z. Anion Exchange Resins as Effective Sorbents for Removal of Acid, Reactive, and Direct Dyes from Textile Wastewaters. In Ion Exchange—Studies and Applications; IntechOpen: Rijeka, Croatia, 2015. [Google Scholar]
- Gupta, V.K.; Khamparia, S.; Tyagi, I.; Jaspal, D.; Malviya, A. Decolorization of Mixture of Dyes: A Critical Review. Glob. J. Environ. Sci. Manag. 2015, 1, 71–94. [Google Scholar] [CrossRef]
- Lazaridis, N.K.; Karapantsios, T.D.; Georgantas, D. Kinetic Analysis for the Removal of a Reactive Dye from Aqueous Solution onto Hydrotalcite by Adsorption. Water Res. 2003, 37, 3023–3033. [Google Scholar] [CrossRef]
- Klimiuk, E.; Filipkowska, U.; Korzeniowska, A. Effects of PH and Coagulant Dosage on Effectiveness of Coagulation of Reactive Dyes from Model Wastewater by Polyaluminium Chloride (PAC). Pol. J. Environ. Stud. 1999, 8, 73–80. [Google Scholar]
- Luo, X.; Liang, C.; Hu, Y. Comparison of Different Enhanced Coagulation Methods for Azo Dye Removal from Wastewater. Sustainability 2019, 11, 4760. [Google Scholar] [CrossRef]
- Daneshvar, N.; Oladegaragoze, A.; Djafarzadeh, N. Decolorization of Basic Dye Solutions by Electrocoagulation: An Investigation of the Effect of Operational Parameters. J. Hazard. Mater. 2006, 129, 116–122. [Google Scholar] [CrossRef]
- Jankowska, K.; Su, Z.; Zdarta, J.; Jesionowski, T.; Pinelo, M. Synergistic Action of Laccase Treatment and Membrane Filtration during Removal of Azo Dyes in an Enzymatic Membrane Reactor Upgraded with Electrospun Fibers. J. Hazard. Mater. 2022, 435, 129071. [Google Scholar] [CrossRef]
- Kannaujiya, M.C.; Kumar, R.; Mandal, T.; Mondal, M.K. Experimental Investigations of Hazardous Leather Industry Dye (Acid Yellow 2GL) Removal from Simulated Wastewater Using a Promising Integrated Approach. Process Saf. Environ. Prot. 2021, 155, 444–454. [Google Scholar] [CrossRef]
- Kua, T.L.; Kooh, M.R.R.; Dahri, M.K.; Zaidi, N.A.H.M.; Lu, Y.; Lim, L.B.L. Aquatic Plant, Ipomoea Aquatica, as a Potential Low-Cost Adsorbent for the Effective Removal of Toxic Methyl Violet 2B Dye. Appl. Water Sci. 2020, 10, 243. [Google Scholar] [CrossRef]
- Strebel, A.; Behringer, M.; Hilbig, H.; Machner, A.; Helmreich, B. Anionic Azo Dyes and Their Removal from Textile Wastewater through Adsorption by Various Adsorbents: A Critical Review. Front. Environ. Eng. 2024, 3, 1347981. [Google Scholar] [CrossRef]
- Liu, S. Bioprocess Engineering: Kinetics, Sustainability, and Reactor Desig, 2nd ed.; Elsevier: Amsterdam, The Netherlands, 2016; ISBN 0444637834. [Google Scholar]
- Yang, Y.; Shen, H.; Wang, X.; Qiu, J. Preparation of Nanolignocellulose/Chitin Composites with Superior Mechanical Property and Thermal Stability. J. Bioresour. Bioprod. 2019, 4, 251–259. [Google Scholar] [CrossRef]
- Demehin, O.; Attjioui, M.; Goñi, O.; O’Connell, S. Chitosan from Mushroom Improves Drought Stress Tolerance in Tomatoes. Plants 2024, 13, 1038. [Google Scholar] [CrossRef] [PubMed]
- Theerakarunwong, C.D.; Boontong, D. Removal and Recyclable Chitosan Nanowires: Application to Water Soluble Dyes. Results Chem. 2020, 2, 100024. [Google Scholar] [CrossRef]
- Zielińska, K.; Chostenko, A.; Truszkowski, S. Adsorption of Cadmium Ions on Chitosan Membranes: Kinetics and Equilibrium Studies. Prog. Chem. Appl. Chitin Deriv. 2010, 15, 73–78. [Google Scholar]
- Gonçalves, J.O.; Duarte, D.A.; Dotto, G.L.; Pinto, L.A.A. Use of Chitosan with Different Deacetylation Degrees for the Adsorption of Food Dyes in a Binary System. Clean 2013, 42, 767–774. [Google Scholar] [CrossRef]
- Filho, E.D.S.; Cavalcante, C.D.M.; Brizola, V.Y.; Pereira, M.R.; Fonseca, J.L.C. A Facile Method for Studying Competitive Sorption from Binary Mixtures of Dyes. Colloids Surf. C Environ. Asp. 2023, 1, 100006. [Google Scholar] [CrossRef]
- Regti, A.; El Kassimi, M.; Laamari, A.; El-Haddad, M. Competitive Adsorption and Optimization of Binary Mixture of Textile Dyes: A Factorial Design Analysis. J. Assoc. Arab. Univ. Basic. Appl. Sci. 2017, 24, 1–9. [Google Scholar] [CrossRef]
- Meevasana, K.; Pavasant, P. Quantitative Measurement Techniques for Binary Dye Mixtures: A Case Study in an Adsorption System. ScienceAsia 2008, 34, 390–394. [Google Scholar] [CrossRef]
- Grigoraș, C.G.; Simion, A.I.; Favier, L.; Drob, C.; Gavrilă, L. Performance of Dye Removal from Single and Binary Component Systems by Adsorption on Composite Hydrogel Beads Derived from Fruits Wastes Entrapped in Natural Polymeric Matrix. Gels 2022, 8, 795. [Google Scholar] [CrossRef] [PubMed]
- Mehdi, S.U.; Balamirtham, H.; Aravamudan, K. Optimal Adsorption of a Binary Dye Mixture of Basic Yellow 2 and Rhodamine B Using Mixture-Process Variable Design, Ridge Analysis and Multi-Objective Optimization. Environ. Adv. 2024, 15, 100490. [Google Scholar] [CrossRef]
- Mekahlia, S.; Bouzid, B. Chitosan-Copper (II) Complex as Antibacterial Agent: Synthesis, Characterization and Coordinating Bond- Activity Correlation Study. Phys. Procedia 2009, 2, 1045–1053. [Google Scholar] [CrossRef]
- Kaya, M.; Sargin, I.; Aylanc, V.; Tomruk, M.N.; Gevrek, S.; Karatoprak, I.; Colak, N.; Sak, Y.G.; Bulut, E. Comparison of Bovine Serum Albumin Adsorption Capacities of α-Chitin Isolated from an Insect and β-Chitin from Cuttlebone. J. Ind. Eng. Chem. 2016, 38, 146–156. [Google Scholar] [CrossRef]
- Bhavsar, P.S.; Fontana, G.D.; Zoccola, M. Sustainable Superheated Water Hydrolysis of Black Soldier Fly Exuviae for Chitin Extraction and Use of the Obtained Chitosan in the Textile Field. ACS Omega 2021, 6, 8727–9318. [Google Scholar] [CrossRef] [PubMed]
- Varun, K.T.; Senani, S.; Kumar, N.; Gautam, M.; Gupta, R.; Gupta, M. Extraction and Characterization of Chitin, Chitosan and Chitooligosaccharidesfrom Crab Shell Waste. Indian. J. Anim. Res. 2017, 51, 1066–1072. [Google Scholar] [CrossRef]
- Eddya, M.; Tbib, B.; El-Hami, K. A Comparison of Chitosan Properties after Extraction from Shrimp Shells by Diluted and Concentrated Acids. Heliyon 2020, 27, e03486. [Google Scholar] [CrossRef] [PubMed] [PubMed Central]
- Demir, D.; Öfkeli, F.; Bölgen, K. Extraction and Characterization of Chitin and Chitosan from Blue Crab and Synthesis of Chitosan Cryogel Scaffolds. J. Turk. Chem. Soc. Sect. A Chem. 2016, 3, 131–144. [Google Scholar] [CrossRef]
- Zvezdova, D.; Stoeva, S. Isolation and Characterization of Chitin from Marine Sources in Black Sea. Annu. Assen Zlatarov Univ. Burgas 2010, 39, 37–41. [Google Scholar]
- Dahmane, E.; Taourirte, M.; Eladlani, N.; Rhazi, M. Extraction and Characterization of Chitin and Chitosan from Parapenaeus Longirostris from Moroccan Local Sources. Int. J. Polym. Anal. Charact. 2014, 19, 342–351. [Google Scholar] [CrossRef]
- Kaya, M.; Seyyar, O.; Baran, T.; Turkes, T. Bat Guano as New and Attractive Chitin and Chitosan Source. Front. Zool. 2014, 11, 59. [Google Scholar] [CrossRef]
- Filipkowska, U.; Jóźwiak, T.; Bugajska, P.; Kuczajowska-Zadrożna, M. The Influence of Chitin Amination on the Effectiveness of RB5 and RY84 Dye Sorption. Prog. Chem. Appl. Chitin Deriv. 2018, 23, 66–75. [Google Scholar] [CrossRef]
- Chung, W.-Y.; Ong, S.-T. Effective Removal of Reactive Brown 10 from Aqueous Solution by Using Chitosan Beads: Batch and Experimental Design Studies. J. Phys. Sci. 2021, 32, 91. [Google Scholar] [CrossRef]
- Kurniawati, D.; Bahrizal; Sari, T.K.; Adella, F.; Sy, S. Effect of Contact Time Adsorption of Rhodamine B, Methyl Orange and Methylene Blue Colours on Langsat Shell with Batch Methods. J. Phys. Conf. Ser. 2021, 1788, 012008. [Google Scholar] [CrossRef]
- Szymczyk, P.; Filipkowska, U.; Jóźwiak, T.; Kuczajowska-Zadrożna, M. The Use of Chitin and Chitosan for the Removal of Reactive Black 5 Dye. Prog. Chem. Appl. Chitin Deriv. 2015, 20, 260–272. [Google Scholar] [CrossRef]
- Gibbs, G.; Tobin, J.M.; Guibal, E. Sorption of Acid Green 25 on Chitosan: Influence of Experimental Parameters on Uptake Kinetics and Sorption Isotherms. J. Appl. Polym. Sci. 2023, 90, 1073–1080. [Google Scholar] [CrossRef]
- Azlan, K.; Wan Saime, W.N.; Lai Ken, L. Chitosan and Chemically Modified Chitosan Beads for Acid Dyes Sorption. J. Environ. Sci. 2009, 21, 296–302. [Google Scholar] [CrossRef] [PubMed]
- Kurnia, K.A.; Rahayu, A.P.; Islami, A.F.; Kusumawati, Y.; Wenten, I.G.; Ur Rahmah, A.; Saepurahman; Wellia, D.V.; Saefumillah, A. Insight into the Adsorption of Dyes onto Chitin in Aqueous Solution: An Experimental and Computational Study. Arab. J. Chem. 2022, 15, 104293. [Google Scholar] [CrossRef]
- Sadiq, A.C.; Rahim, N.Y.; Suah, F.B.M. Adsorption and Desorption of Malachite Green by Using Chitosan-Deep Eutectic Solvents Beads. Int. J. Biol. Macromol. 2020, 164, 3965–3973. [Google Scholar] [CrossRef]
- Tang, H.; Weijie, Z.; Zhang, L. Adsorption Isotherms and Kinetics Studies of Malachite Green on Chitin Hydrogels. J. Hazard. Mater. 2012, 209–210, 218–225. [Google Scholar] [CrossRef] [PubMed]
- Yu, J.; Zou, A.; He, W.; Liu, B. Adsorption of Mixed Dye System with Cetyltrimethylammonium Bromide Modified. Water 2020, 12, 981–995. [Google Scholar] [CrossRef]
- Mavinkattimath, R.G.; Kodialbail, V.S.; Govindan, S.; Gadigayya, M.R.; Kodialbail, S.V.; Govindan, S. Simultaneous Adsorption of Remazol Brilliant Blue and Disperse Orange Dyes on Red Mud and Isotherms for the Mixed Dye System. Environ. Sci. Pollut. Res. 2017, 24, 18912–18925. [Google Scholar] [CrossRef] [PubMed]
- Giwa, A.-R.; Abdulsalam, K.; Wewers, F.; Aderibigbe, D. Competitive Biosorptive Removal of a Basic Dye From Ternary Dye Mixture Using Sawdust. Int. J. Appl. Eng. Res. 2018, 13, 14282–14290. [Google Scholar]
- Şahin, E. Interpretation of Sorption Kinetics for Mixtures of Reactive Dyes on Wool. Turk. J. Chem. 2005, 29, 617–625. [Google Scholar]
Disclaimer/Publisher’s Note: The statements, opinions and data contained in all publications are solely those of the individual author(s) and contributor(s) and not of MDPI and/or the editor(s). MDPI and/or the editor(s) disclaim responsibility for any injury to people or property resulting from any ideas, methods, instructions or products referred to in the content. |
© 2024 by the authors. Licensee MDPI, Basel, Switzerland. This article is an open access article distributed under the terms and conditions of the Creative Commons Attribution (CC BY) license (https://creativecommons.org/licenses/by/4.0/).
