Article

Ti3C2Tx Coated with TiO2 Nanosheets for the Simultaneous Detection of Ascorbic Acid, Dopamine and Uric Acid

by
Dengzhou Jia
1,
Tao Yang
1,2,*,
Kang Wang
1,
Hongyang Wang
3,*,
Enhui Wang
1,2,
Kuo-Chih Chou
1 and
Xinmei Hou
1,2,4,*
1
Institute for Carbon Neutrality, University of Science and Technology Beijing, Beijing 100083, China
2
Institute of Steel Sustainable Technology, Liaoning Academy of Materials, Shenyang 110167, China
3
State Key Laboratory of Environmental Criteria and Risk Assessment, Chinese Research Academy of Environmental Sciences, Beijing 100012, China
4
Beijing Advanced Innovation Center for Materials Genome Engineering, University of Science and Technology Beijing, Beijing 100083, China
*
Authors to whom correspondence should be addressed.
Molecules 2024, 29(12), 2915; https://doi.org/10.3390/molecules29122915
Submission received: 1 May 2024 / Revised: 13 June 2024 / Accepted: 16 June 2024 / Published: 19 June 2024

Abstract

:
Two-dimensional MXenes have become an important material for electrochemical sensing of biomolecules due to their excellent electric properties, large surface area and hydrophilicity. However, the simultaneous detection of multiple biomolecules using MXene-based electrodes is still a challenge. Here, a simple solvothermal process was used to synthesis the Ti3C2Tx coated with TiO2 nanosheets (Ti3C2Tx@TiO2 NSs). The surface modification of TiO2 NSs on Ti3C2Tx can effectively reduce the self-accumulation of Ti3C2Tx and improve stability. Glassy carbon electrode was modified by Ti3C2Tx@TiO2 NSs (Ti3C2Tx@TiO2 NSs/GCE) and was able simultaneously to detect dopamine (DA), ascorbic acid (AA) and uric acid (UA). Under concentrations ranging from 200 to 1000 μM, 40 to 300 μM and 50 to 400 μM, the limit of detection (LOD) is 2.91 μM, 0.19 μM and 0.25 μM for AA, DA and UA, respectively. Furthermore, Ti3C2Tx@TiO2 NSs/GCE demonstrated remarkable stability and reliable reproducibility for the detection of AA/DA/UA.

Graphical Abstract

1. Introduction

MXene, a type of two-dimensional (2D) material, is characterized by the formula Mn+1XnT. In this formula, M represents transition metals, X could be either carbon or nitrogen, while T refers to surface functional groups like =O, –F, and –OH [1,2], and it attracts attention as a promising material for electrochemical modification [3,4]. In particular, the abundant functional groups, high specific surface area and excellent electrical properties of MXene provide promising applications for the electrochemical detection of various biomolecules, especially for dopamine (DA), ascorbic acid (Vitamin C or AA) and uric acid (UA). The stability of physiological functions can be influenced by these three important substances which coexist in body fluids [5]. As a poly-hydroxyl molecule, AA plays a dual role in promoting antibody production and neutralizing the harmful impact of free radicals [6]. DA, a catecholamine neurotransmitter, contributes to nervous system regulation [7]. UA serves as a purine metabolite, commonly present in living organisms [8]. Several common diseases are attributed to fluctuations in the concentrations of these biomolecules, including mental illness, AIDS, Parkinson’s disease, skin rashes and gout [9,10]. Thus, it is important to discover an appropriate approach for swiftly and precisely identifying AA, DA and UA.
Recently, the use of MXene as a modified electrode material has been shown to enable accurate detection of AA, DA and UA [11,12]. However, two factors limit the application of MXene: On the one hand, the unstable multilayer structure of MXene is prone to self-accumulation, which reduces the active sites and lowers the electron transfer rate [13]. On the other hand, the functional groups on the surface of MXene caused by wet etching are unable to form covalent bonds with the biomolecules, thus reducing the detection sensitivity [14]. Therefore, several strategies have been developed to resolve the above problems, such as the use of intercalating agents and surface modification/functionalization [15,16]. Notably, the preparation of composites (or heterojunctions) by introducing other active materials into MXenes is considered to be the best strategy. For instance, a novel MXene/DNA/Pd/Pt material was synthesized by Zheng et al., and the sensor exhibited high selectivity against AA and H2O2 [17]. Amara et al. fabricated a graphitic pencil which is modified by perylene diimide/MXene (Ti3C2Tx), realizing the specific detection of DA [18]. However, the performance of MXene-based materials in simultaneously detecting AA/DA/UA remains unsatisfactory due to the significant concentration differences among different biomolecules [19], their similar oxidation potentials [20] and the strong electrostatic repulsion [21]. TiO2 is recognized for its considerable potential for use in the biological sector, thanks to its affordability, customizable attributes, lack of toxicity, simple preparation process, consistent quality and improved durability [22,23].
Furthermore, the nanocomposite of MXene@TiO2 prevents the aggregation of MXene, and it improves the stability of the electrochemical sensor and achieves reliable reproducibility [24]. So far, different forms of TiO2 have been synthesized, including nanoparticles, thin films structures, nanorods and so on [25,26]. In our previous work [27], it was mentioned that materials that have a high specific surface area can enable the precise detection of AA/DA/UA because of the presence of numerous active sites. Therefore, the growth of TiO2 nanosheets on the MXene surface can be used as a means to effectively realize the simultaneous detection of biological small molecules.
Here, Ti3C2Tx coated with TiO2 nanosheets (Ti3C2Tx@TiO2 NSs) is synthesized through a simple solvothermal process. By incorporating TiO2 nanosheets, Ti3C2Tx@TiO2 NSs, modified glassy carbon electrode (Ti3C2Tx@TiO2 NSs/GCE) enables detection of AA/DA/UA individually and simultaneously. Additionally, Ti3C2Tx@TiO2 NSs/GCE demonstrates outstanding stability and reliable reproducibility.

2. Result and Discussion

2.1. Microstructural Characterizations of Ti3C2Tx@TiO2 NSs Samples

As shown in Figure S1, comparing the standard cards (JCPDS Card No. 52-0875), it can be seen that the black curves show peaks at 19.1°, 34°, 36.77°, 38.94°, 41.7°, 48.3° and 60.14° corresponding to the (004), (101), (103), (104), (105), (107) and (110) crystalline facet characteristic peaks of Ti3AlC2. The red curve shows the peaks at 9.0°, 18.6°, 27.9° and 61.1°, which correspond to the (002), (006), (008) and (110) facets of Ti3C2Tx [28]. Notably, the characteristic peak at 39.3° disappears, indicating the etching of the Al element [29]. Upon etching of the Al element, TiO2 grows on the MXene surface due to oxidation, where peaks at 36.9°, 37.8° and 38.6° (corresponding to the (103), (004) and (112) crystal planes of TiO2) align with characteristic peaks of the (103) crystal planes of Ti3C2Tx, leading to widened peaks at 35°–40°. Prior to annealing (blue curve), the shift of the (002) peak toward lower angles suggests further delamination of Ti3C2Tx. Additionally, comparing the standard cards (JCPDS card NO. 21-1272), two faint peaks at 38.6° and 44.1° emerge, corresponding to the (112) and (200) planes of anatase TiO2. Following annealing (green curve), another peak appears at position 23.5°, corresponding to the (101) planes of anatase TiO2. After solvothermal treatment, the results show that the lamellae structure of Ti3C2Tx remains stable, while a crystallized phase of anatase TiO2 has emerged.
Figure S2a depicts the closely aligned layered structure of the pristine Ti3AlC2. As shown in Figure S2b, the Ti3C2Tx exhibits a layered accordion-like structure following treatment with HF (24 h), with each lamella measuring around 20 nm thick and a layer spacing of approximately 300 nm. Figure 1a–c illustrate the comparison of samples with varying amounts of TiCl3. When the TiCl3 concentration is low (Ti3C2Tx@TiO2 NSs(0.6), Figure 1a), sparse NSs can be observed on the surface of Ti3C2Tx lamellae. As the amount of TiCl3 increases (Ti3C2Tx@TiO2 NSs(0.8), Figure 1b), the density of TiO2 NSs on the surface of Ti3C2Tx lamellae gradually increases. At the maximum TiCl3 concentration (Ti3C2Tx@TiO2 NSs(1.0), Figure 1c), highly dense NSs, and even nanospheres composed of NSs, are formed on the surface of Ti3C2Tx lamellae, indicating an excess of TiCl3. After annealing, the morphology remains relatively unchanged (Figure 1d–f). The TEM images of Ti3C2Tx@TiO2 NSs(0.8) are presented in Figure 1g,h. Figure 1g shows abundant NSs growing on the surface of Ti3C2Tx lamellae, with lengths of 30–100 nm and thicknesses of 3–5 nm. A facet spacing of 0.253 nm wide can be observed in the edge portion of the material, corresponding to the (002) crystallographic facet of Ti3C2Tx. The lattice stripe spacing (0.352 nm) of the NSs is correlated to the (101) crystal plane of anatase TiO2 [30] (Figure 1h). The SAED image of Ti3C2Tx@TiO2 NSs is demonstrated in Figure 1i (red). The diffraction circle diameters in the SAED plots are the same as those diffracted from the (101) and (103) crystal surfaces of anatase TiO2, while the six bright and sharp spots exhibit a six-fold symmetry, representing the crystal planes (0 1 ¯ 1 ¯ 0), ( 1 0 1 ¯ 0) and ( 1 1 ¯ 00) of Ti3C2Tx (Figure 1i, inset).
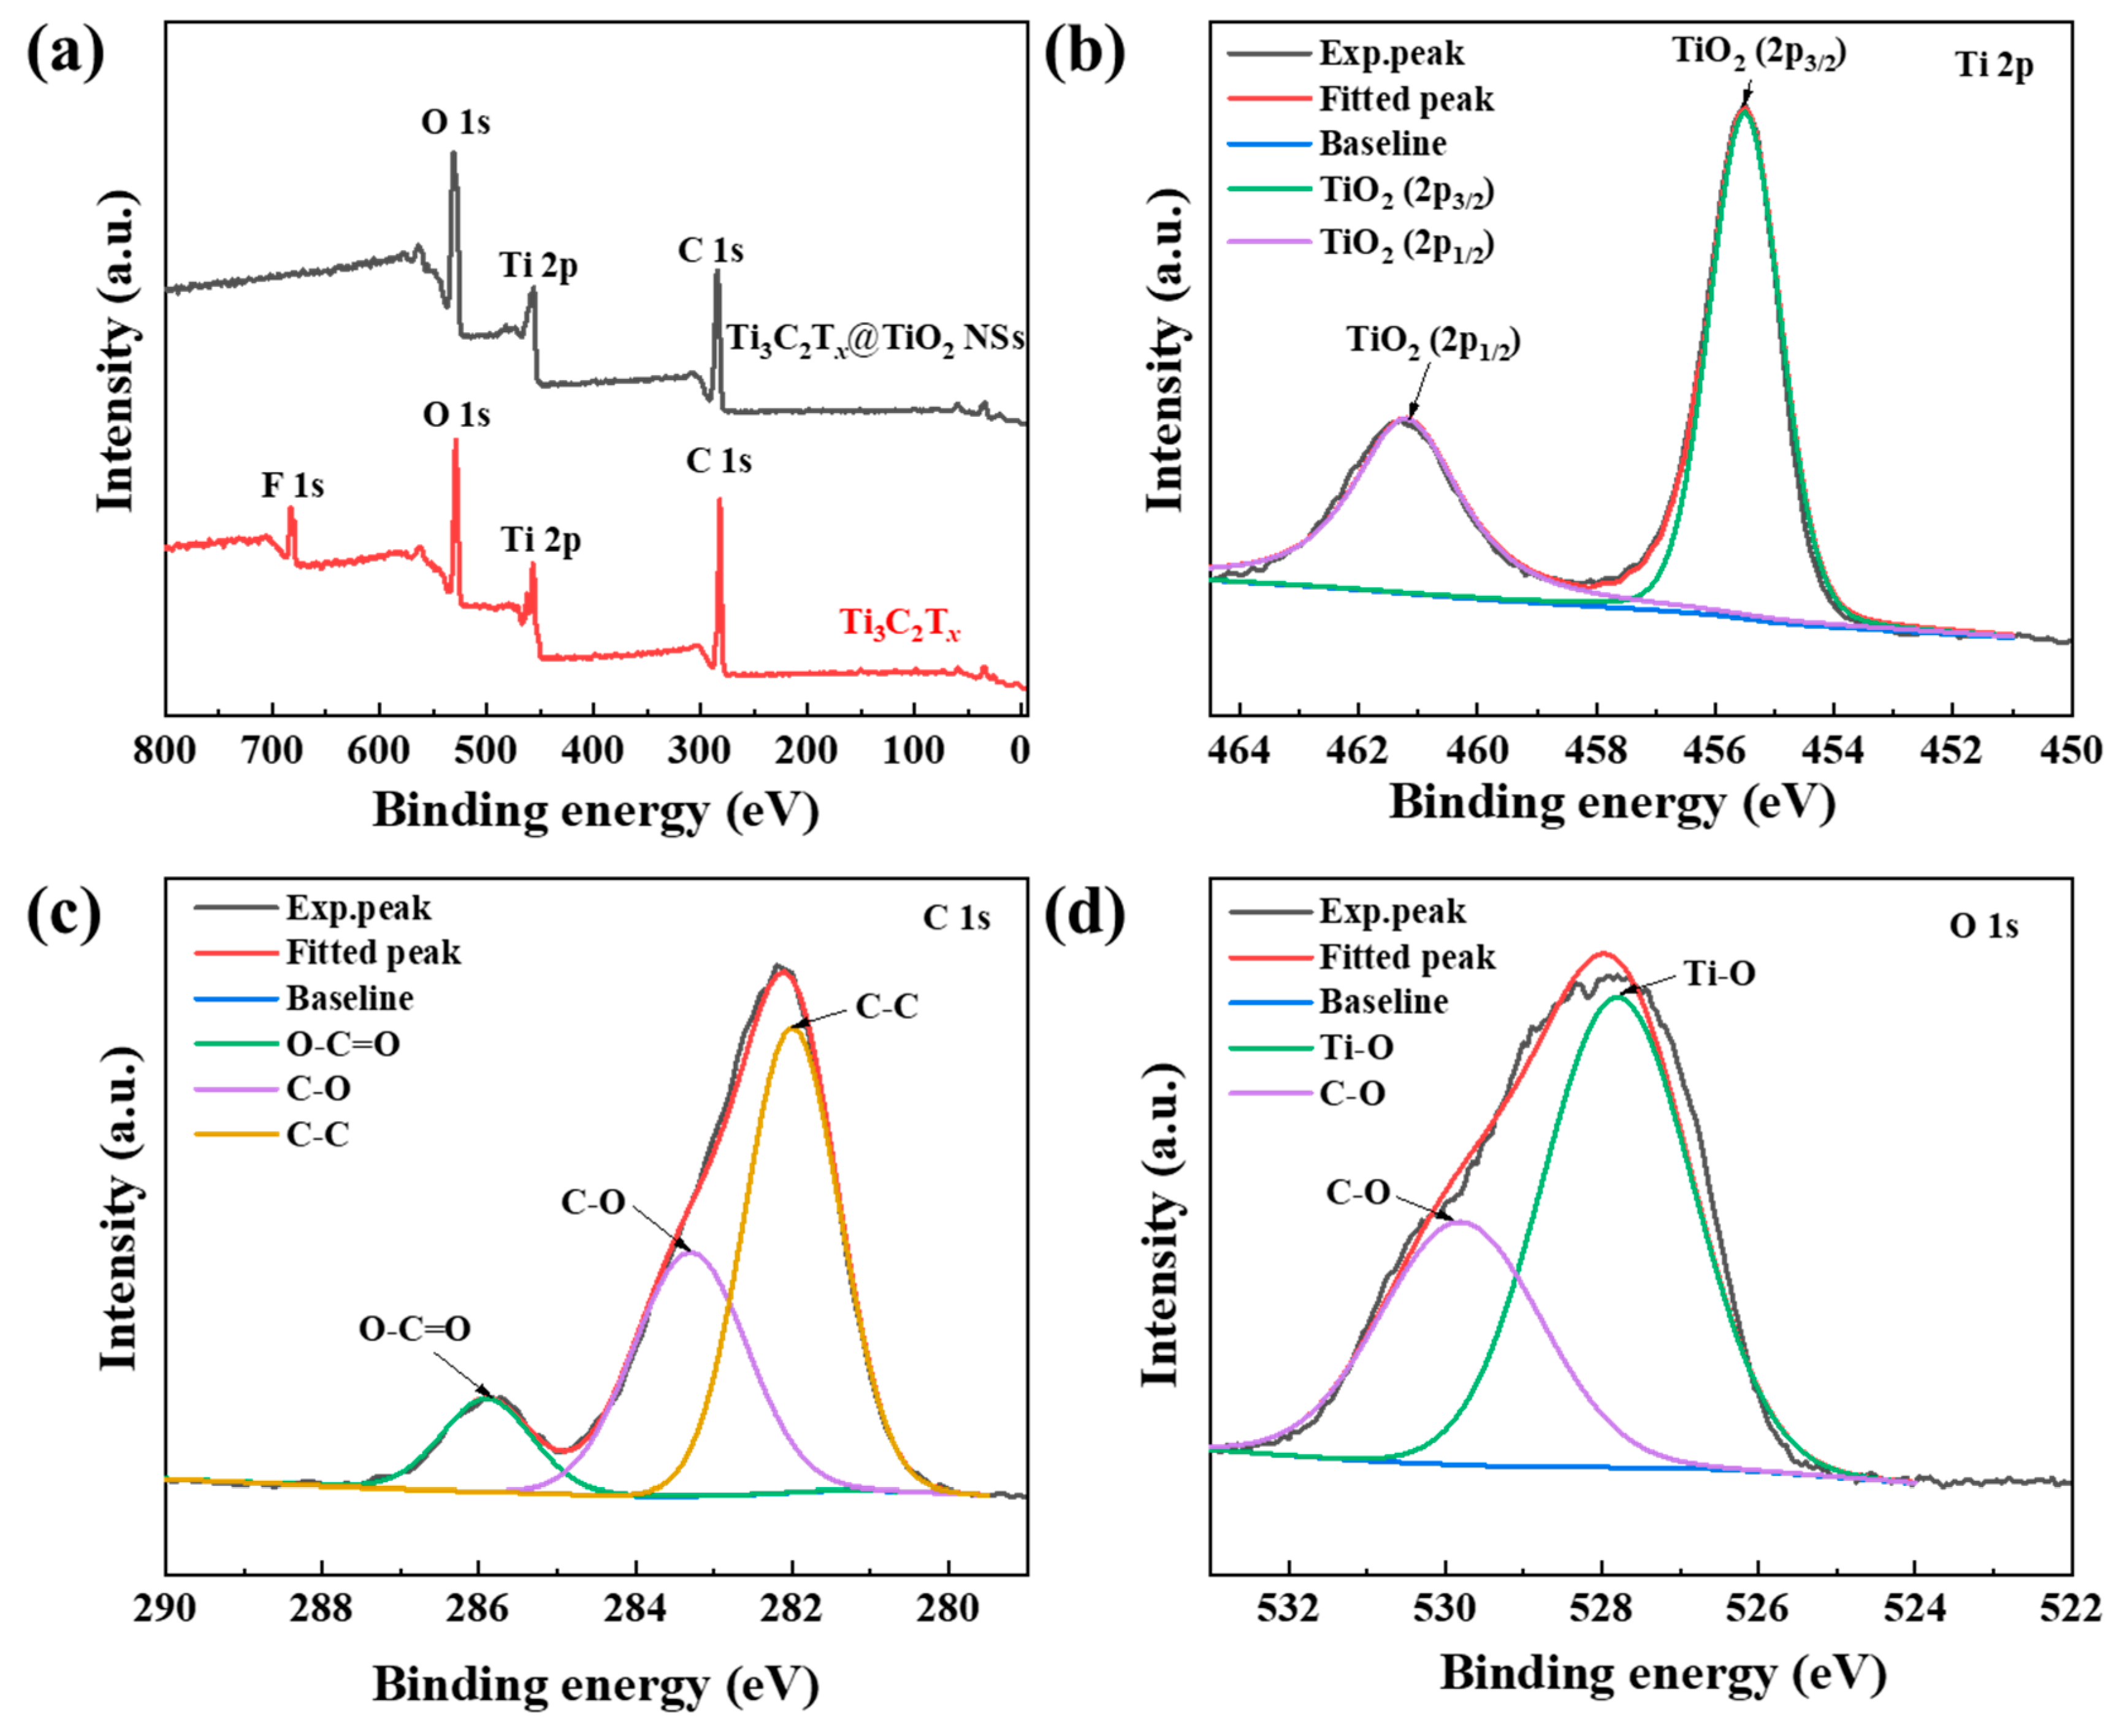
Figure 2a shows the full XPS spectra of Ti3C2Tx and Ti3C2Tx@TiO2 NSs. The red curve in Figure 2a represents Ti3C2Tx, exhibiting characteristic peaks for C 1s, Ti 2p, O 1s and F 1s at 282 eV, 457 eV, 529 eV and 683 eV, respectively. The black curve in Figure 2a corresponds to Ti3C2Tx@TiO2 NSs, where the characteristic peak at 682 eV for F 1s is absent. This observation suggests that the Ti3+ of TiCl3 has replaced the –F functional groups. The Ti 2p profile (Figure 2b) reveals the energy levels of 461.2 and 457.2 eV, corresponding to Ti 2p1/2 and Ti 2p3/2, which indicate the formation of anatase TiO2. Concerning the C 1s profile (Figure 2c), characteristic peaks occur at 285.8, 283.2 and 281.7 eV, corresponding to O-C=O, C–O, and C–C, respectively. Furthermore, the O 1s profile (Figure 2d) shows peaks at 529.5 and 527.3 eV that represent C–O and Ti–O bonds in TiO2, respectively. These findings provide evidence for the disappearance of –F functional groups and the concomitant generation of TiO2 on the surface of Ti3C2Tx.
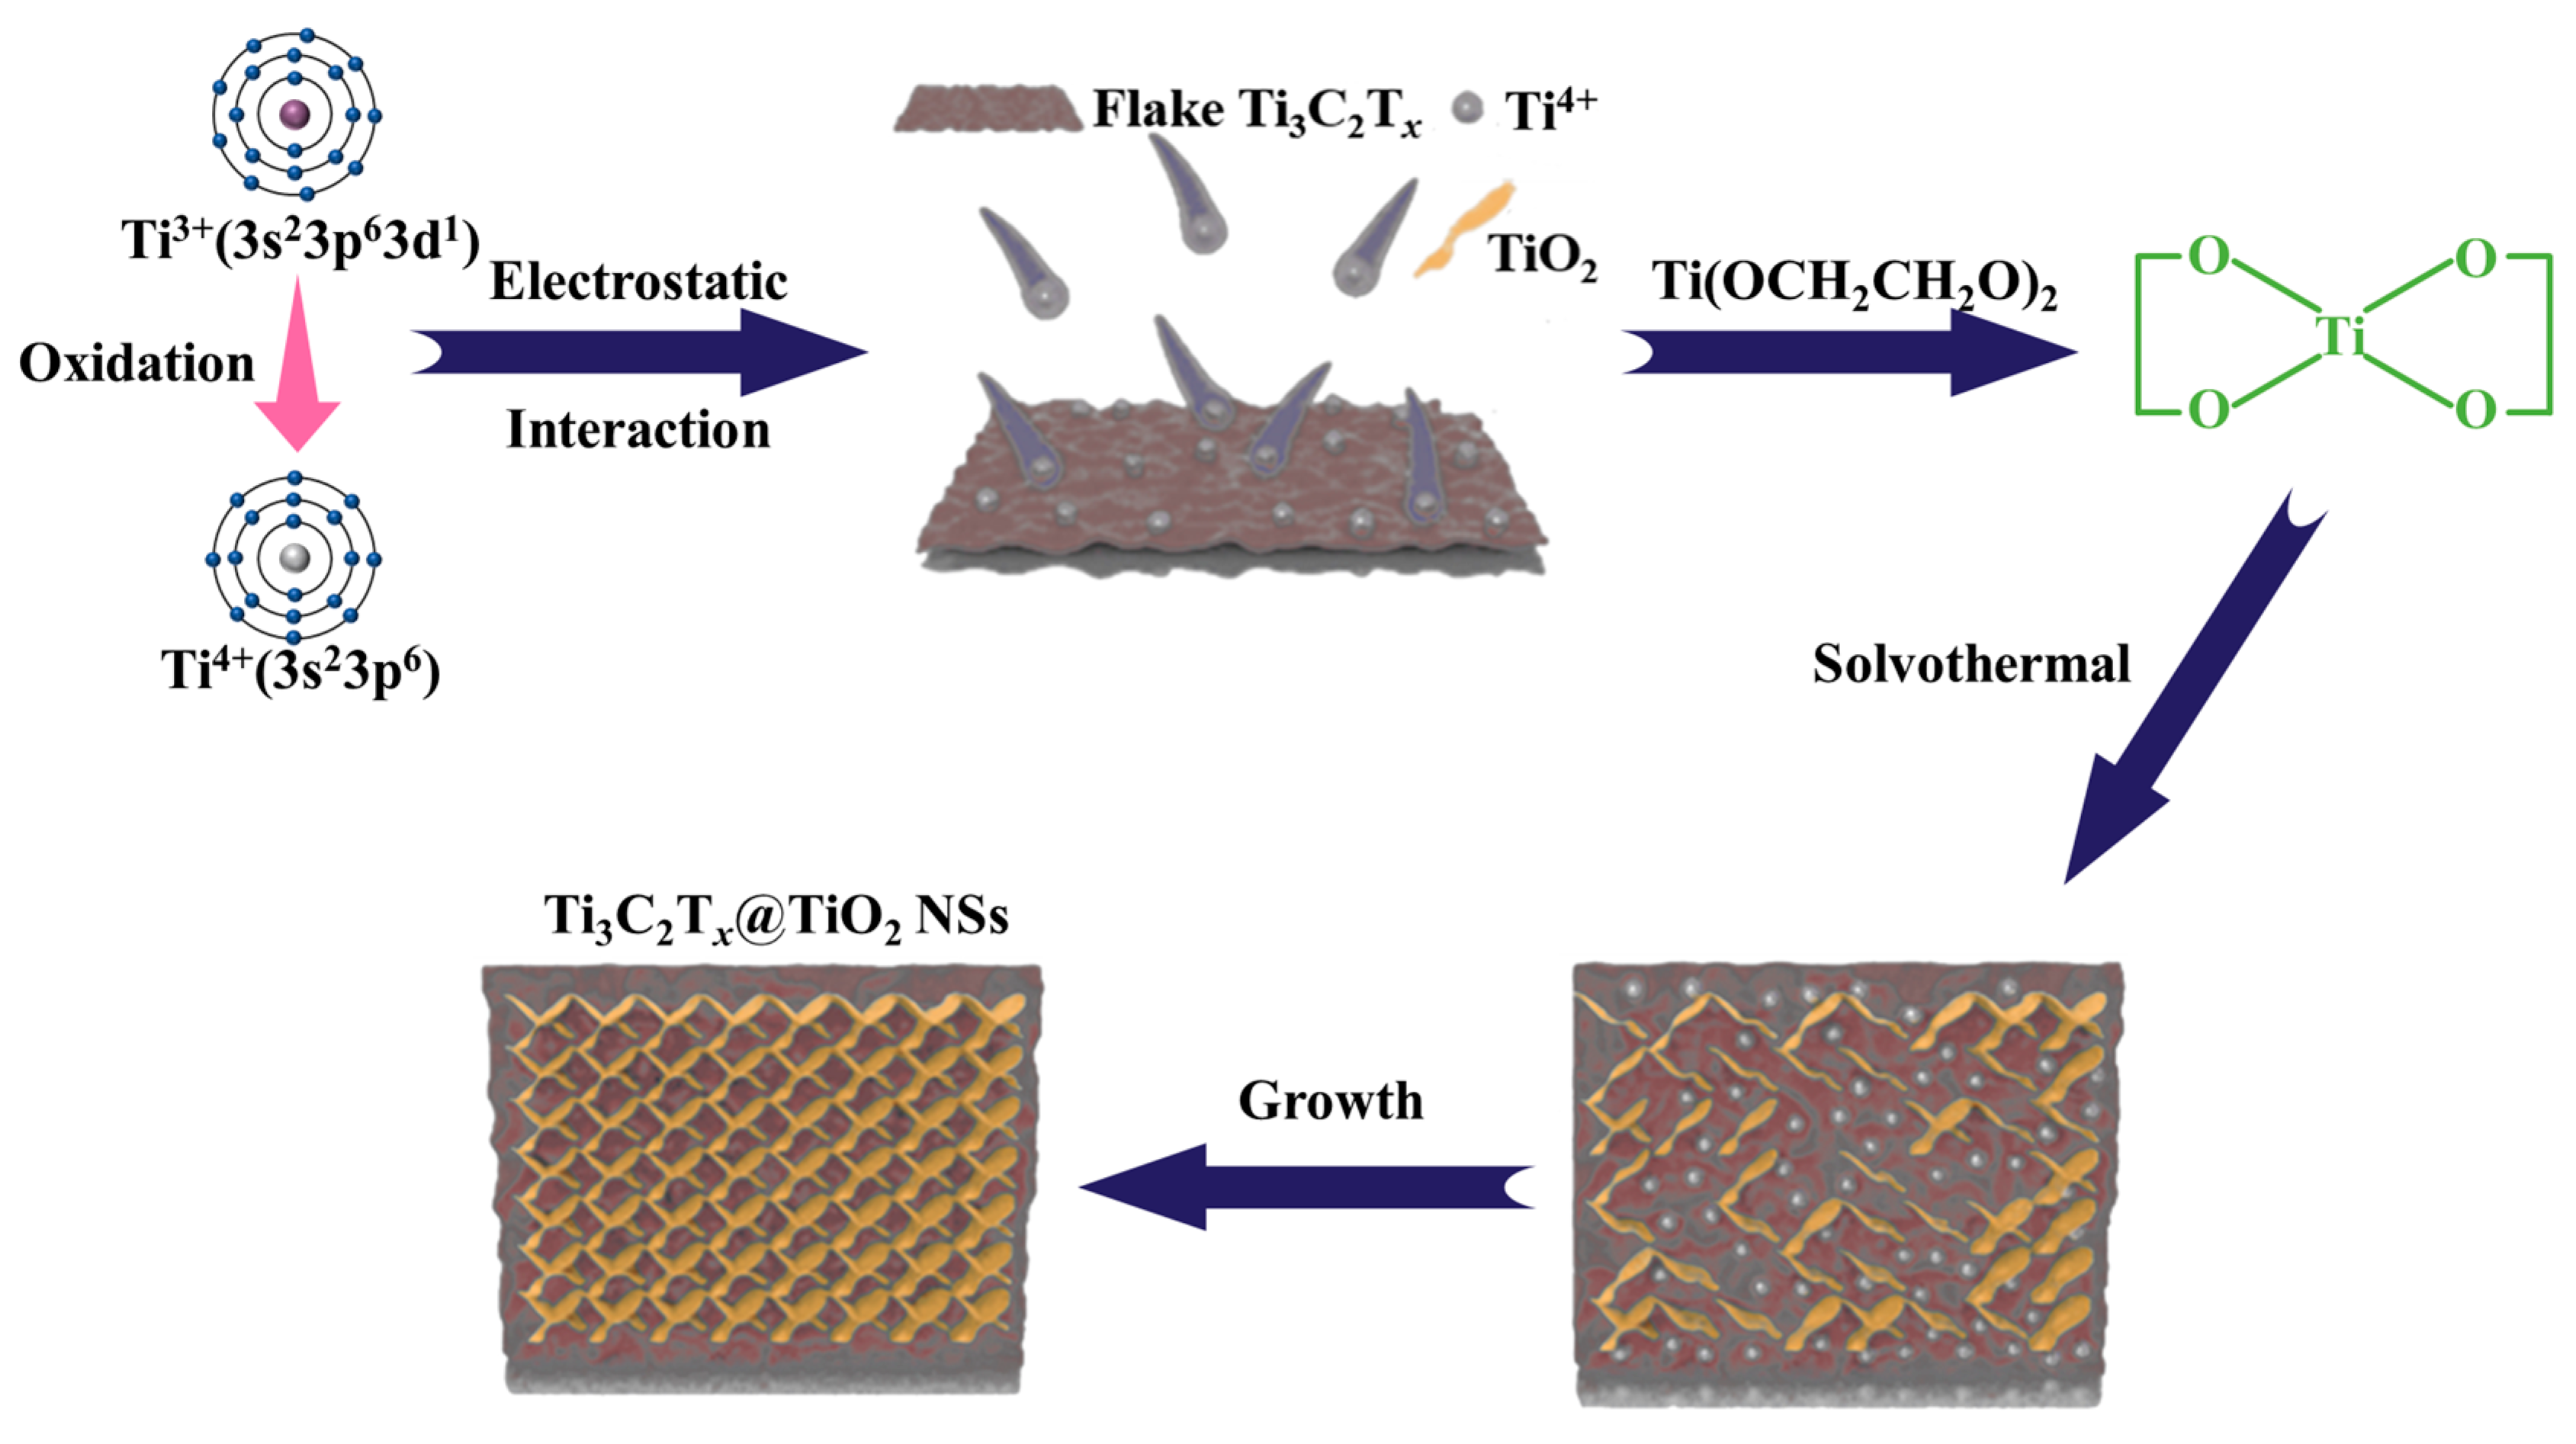
The process of morphological evolution involved in the fabrication of Ti3C2Tx @TiO2 NSs is illustrated in Figure 3. Initially, Ti4+ ions are generated through the reaction of Ti3+ of TiCl3 with dissolved oxygen in the solution [31,32] (Equations (S1) and (S2)). Subsequently, these positively charged Ti4+ ions uniformly adhere to the negatively charged surface of Ti3C2Tx. Concurrently, Ti4+ ions react with ethylene glycol to form titanium glycolate crystal nucleuses (Ti(OCH2CH2O)2) [33] (Equation (S3)). As the solvothermal process proceeds, a portion of Ti(OCH2CH2O)2 undergoes hydrolysis, leading to the development of a small quantity of anatase TiO2 on the surface of Ti3C2Tx. In the final annealing step, the remaining unreacted Ti(OCH2CH2O)2 is completely transformed into anatase TiO2, while the carbon-containing species are entirely eliminated (Equation (S4)).

2.2. Electrochemical Behaviors of Ti3C2Tx@TiO2 NSs

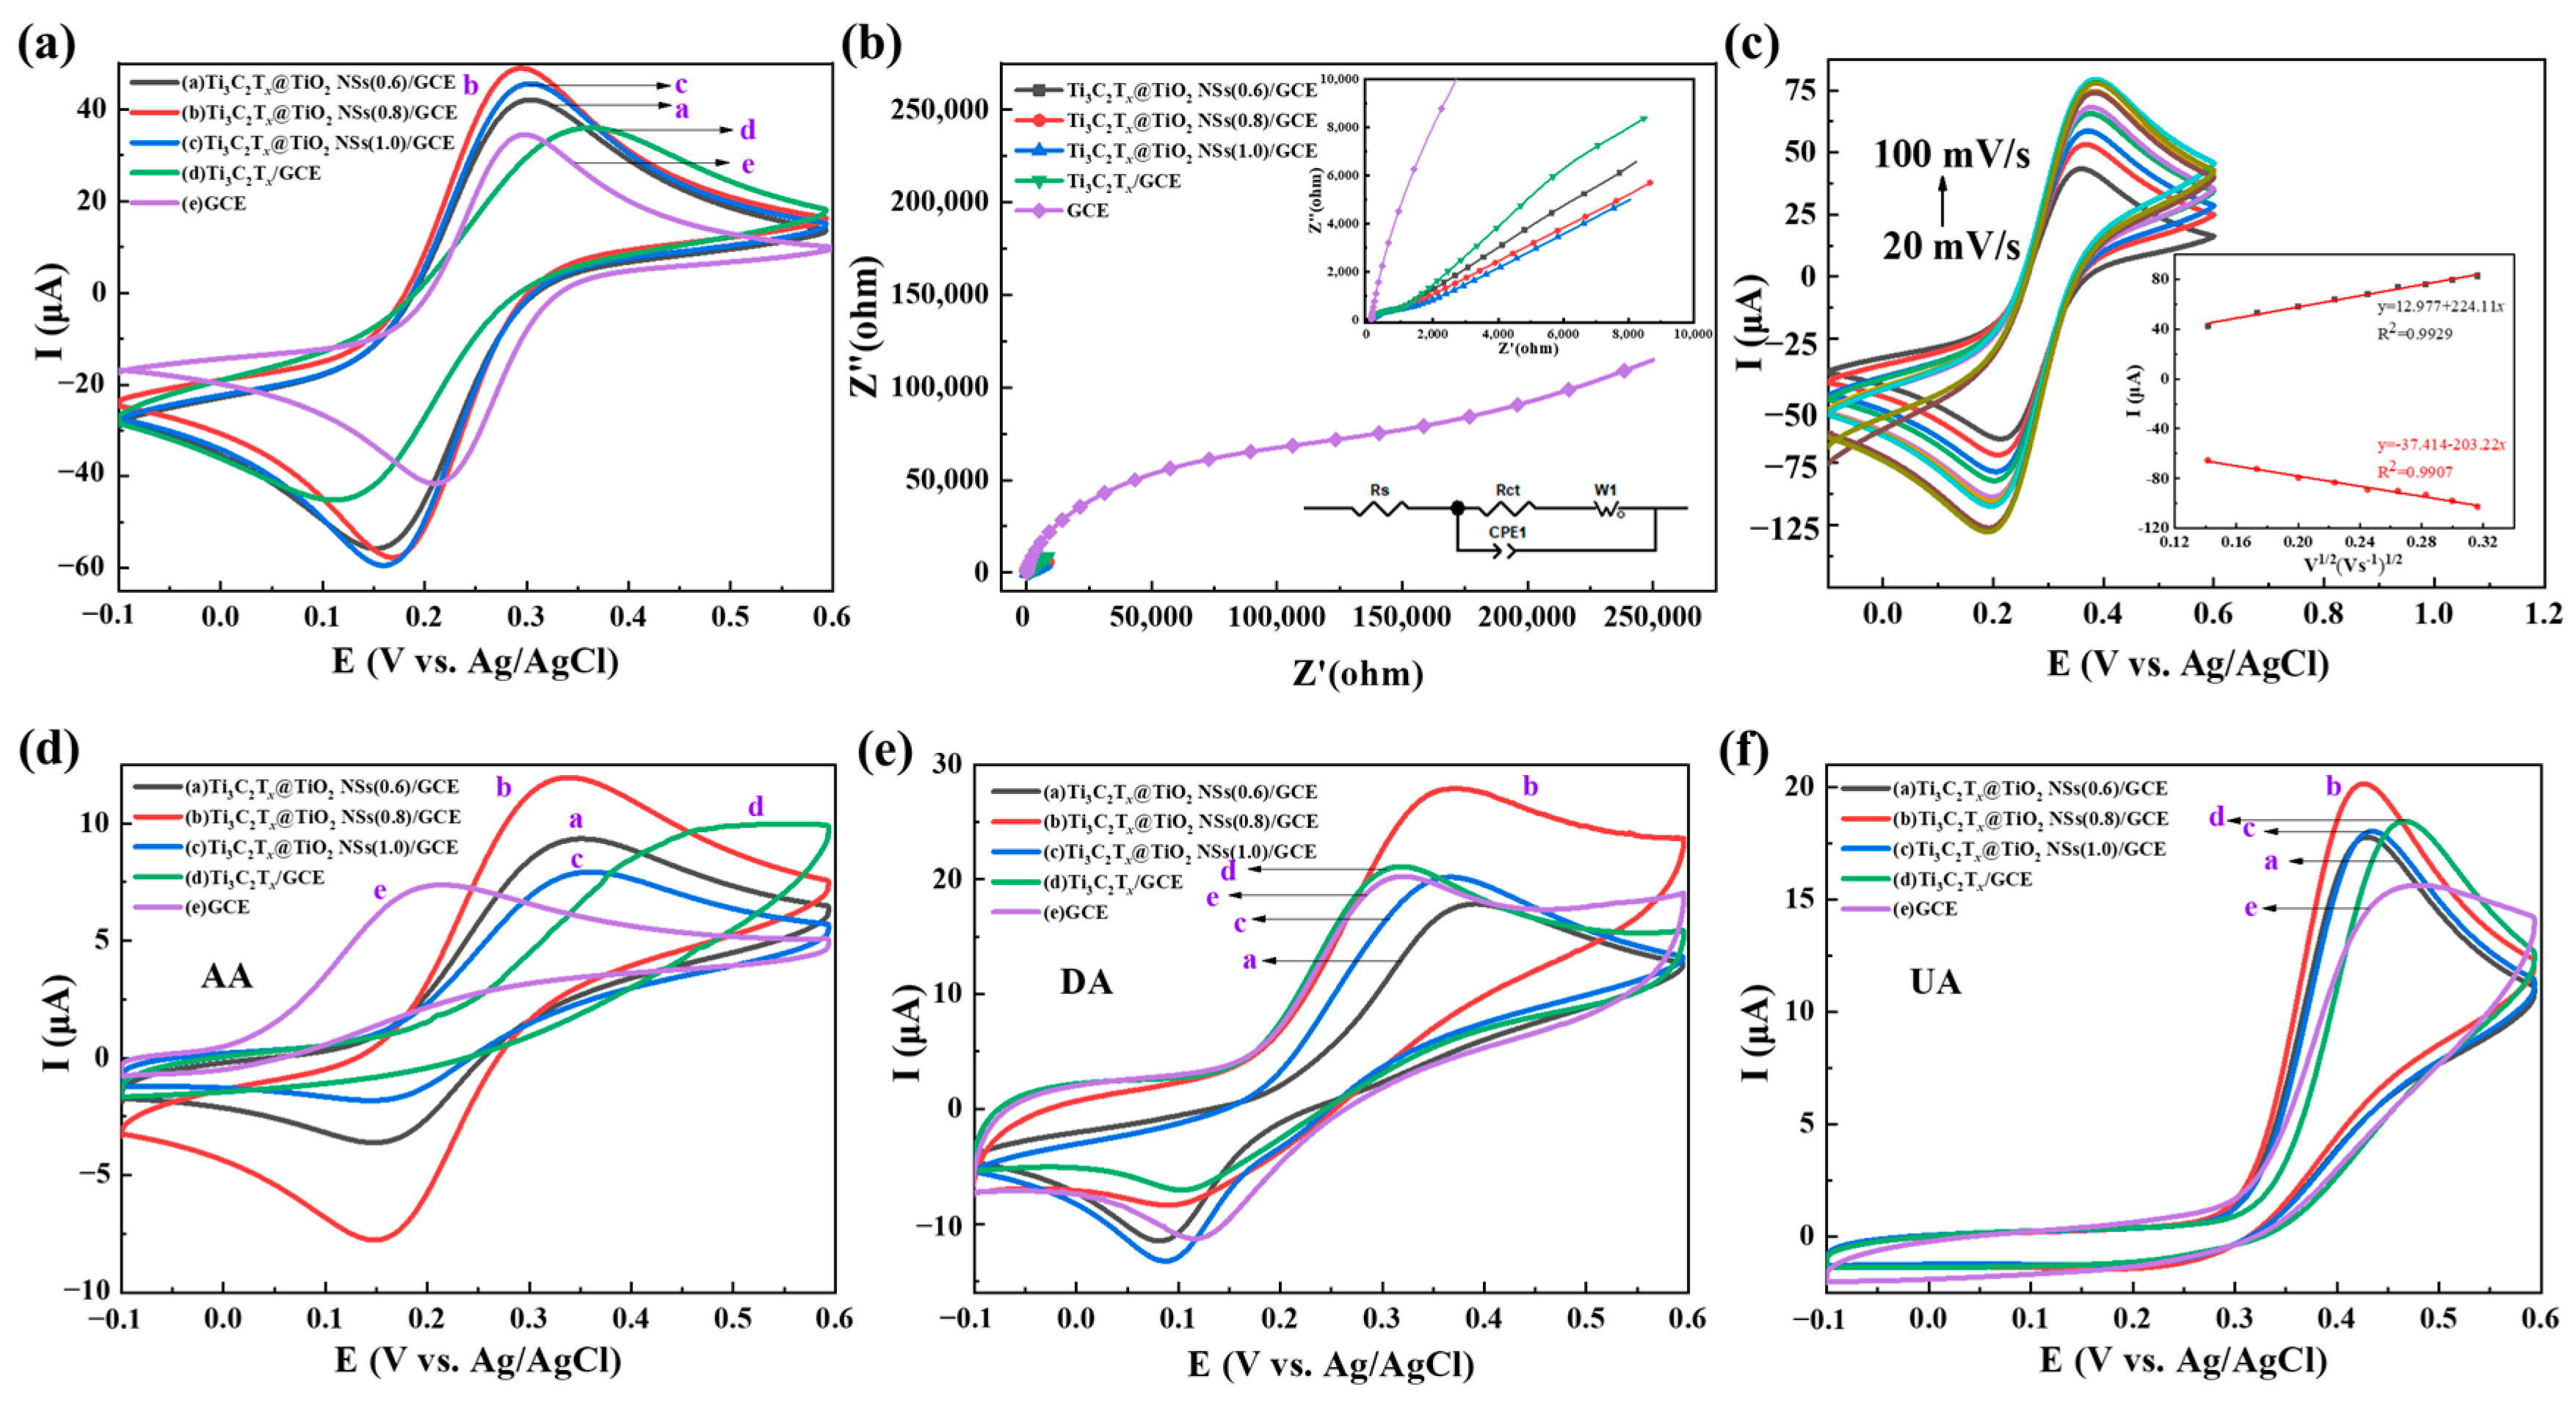
Figure 4a shows the electrochemical performance of Ti3C2Tx@TiO2 NSs/GCE, Ti3C2Tx/GCE and GCE using CV curves in 0.1 M KCl solution with 0.5 mM K3[Fe (CN)6]. The relative peak currents, listed in decreasing order, are as follows: Ti3C2Tx@TiO2 NSs(0.8)/GCE > Ti3C2Tx@TiO2 NSs(1.0)/GCE > Ti3C2Tx@TiO2 NSs(0.6)/GCE > Ti3C2Tx/GCE > GCE. As shown in Figure 4b, the impedance of the different electrodes was obtained by EIS (voltage amplitude of 10 mV, 10−2–106 Hz). The electron transfer process occurring at the electrode surface was indicated by the semicircular arc observed at higher frequencies. The charge transfer resistance (Rct) of the electrodes can be represented by the semicircular arc diameter of the fitted plot line. Based on the Randles equivalent circuit (Figure 4b, inset), Ti3C2Tx@TiO2 NSs(0.8)/GCE exhibits the lowest charge transfer impedance (Rct = 531 Ω), followed by Ti3C2Tx/GCE (868.7 Ω), Ti3C2Tx@TiO2 NSs(0.6)/GCE (608.7 Ω) and Ti3C2Tx@TiO2 NSs(1.0)/GCE (1183 Ω).
As shown in Figure 4c, which displays the CV curves, the peak current of Ti3C2Tx@TiO2 NSs(0.8)/GCE rises in a linear fashion as the scan rate increases (20–100 mV/s). Furthermore, the redox peaks of the electrodes display a good linear relationship with the square root of scan rate (the inset of Figure 4c). The active surface area of Ti3C2Tx@TiO2 NSs/GCE was calculated using the Randles–Sevcik equation:
I p = 2.69 × 10 5 × n 3 / 2 × A C * × D 1 / 2 × ʋ 1 / 2
where Ip represents the peak oxidation current, n is the number of electron transfers (n = 1), A is the active surface area, D is the diffusion coefficient (7.6 × 10⁻⁶ cm2 s−1 for [Fe(CN)6]4+), C* is the concentration of [Fe(CN)6]4+ and ʋ is the scanning rate. The active surface area of Ti3C2Tx@TiO2 NSs(0.8)/GCE was calculated as approximately 0.74 cm2, which is nine times greater than that of bare GCE (0.08 cm2). The TiO2 NSs grown on the surface of Ti3C2Tx effectively increased the area of catalytic activity. As shown in Figure 4d, the reaction peak could not be detected by Ti3C2Tx/GCE. The oxidation peak of AA is shifted to a lower reaction potential when Ti3C2Tx@TiO2 NSs/GCE is employed. The peak current, listed in descending order, is as follows: Ti3C2Tx@TiO2 NSs(0.8)/GCE > Ti3C2Tx@TiO2 NSs(0.6)/GCE > Ti3C2Tx@TiO2 NSs(1.0)/GCE > GCE. As shown in Figure 4e, all five electrodes can detect the oxidation peak of DA, with the peak current ordered as follows: Ti3C2Tx@TiO2 NSs(0.8)/GCE > Ti3C2Tx/GCE > GCE > Ti3C2Tx@TiO2 NSs(1.0)/GCE > Ti3C2Tx@TiO2 NSs(0.6)/GCE. The five oxidation peaks of UA are clearly distinguished, with the peak current ordered as follows: Ti3C2Tx@TiO2 NSs(0.8)/GCE > Ti3C2Tx/GCE > Ti3C2Tx@TiO2 NSs(1.0)/GCE > Ti3C2Tx@TiO2 NSs(0.6)/GCE > GCE (Figure 4f). Since Ti3C2Tx@TiO2 NSs(0.8)/GCE showed excellent electrochemical detection capability, it was used as the modified electrode material for the additional experiments.
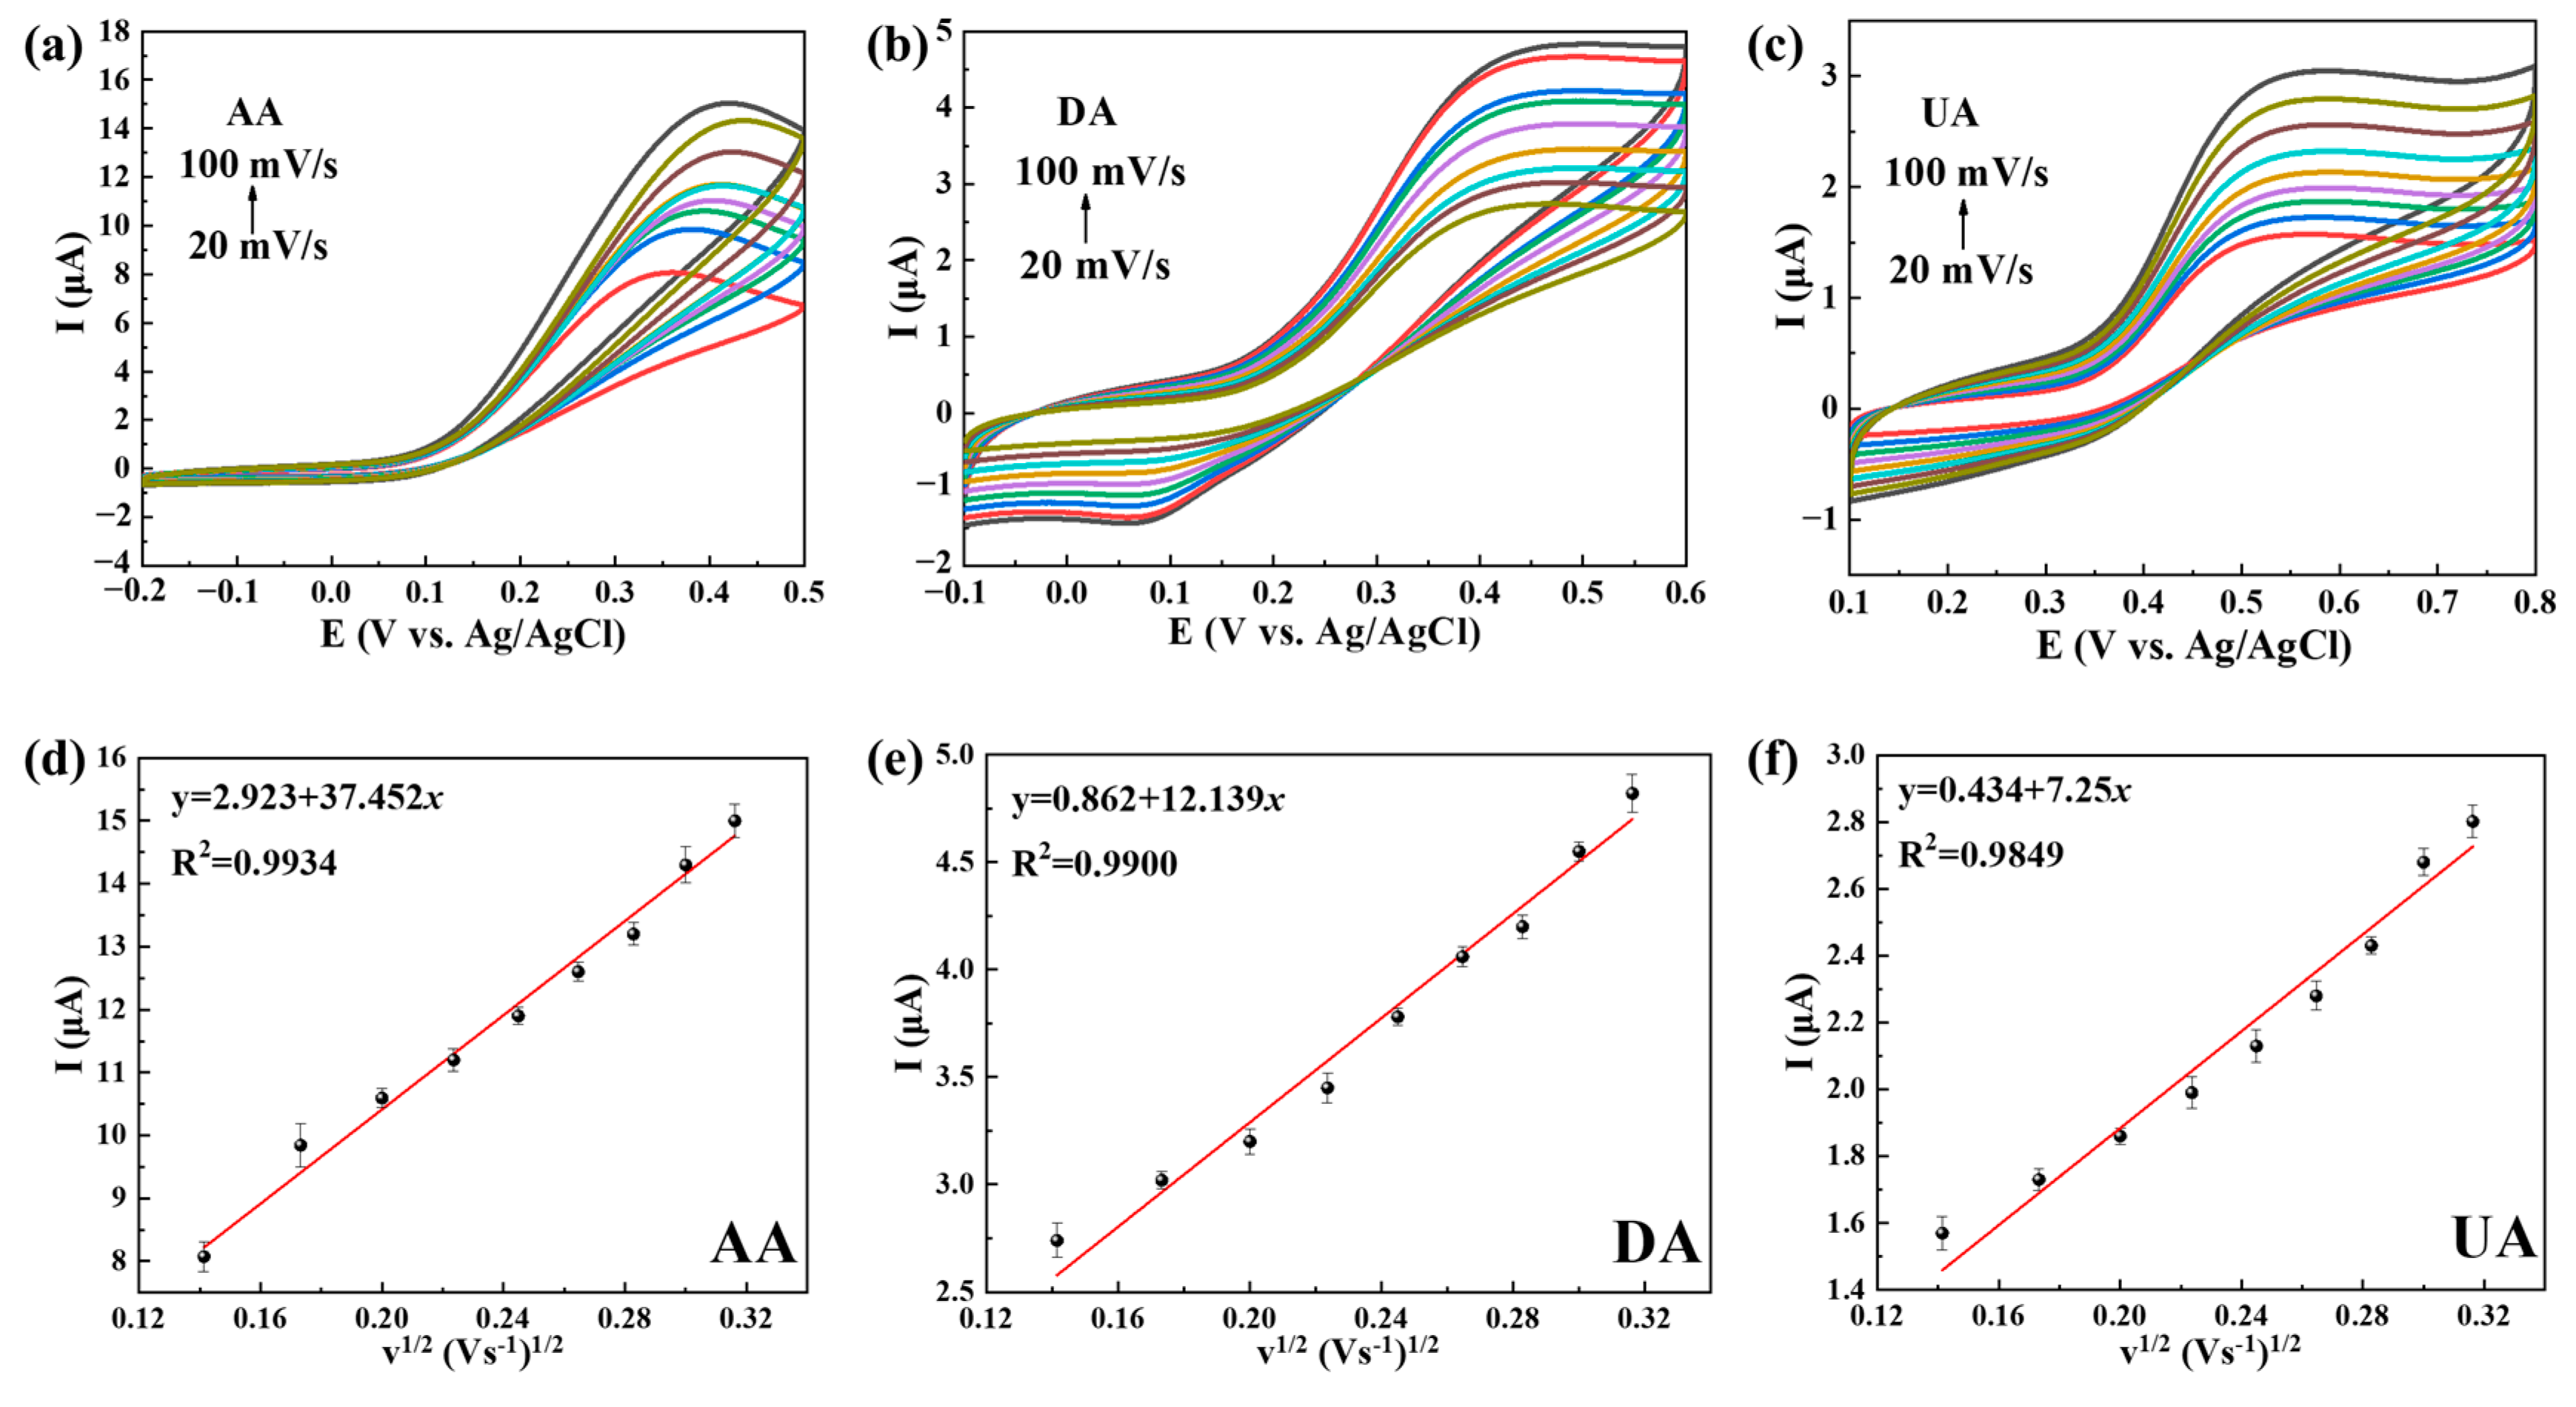
The oxidation kinetics of AA, DA and UA on the Ti3C2Tx@TiO2 NSs/GCE electrode were studied using CV (pH 7.4) under various scan rates (20 mV/s–100 mV/s). The peak currents of AA, DA and UA show strong linear correlation with the scan rate (Figure 5a–c), while the peak potentials are gradually biased toward large overpotentials, indicating kinetic limitations in the reaction [34]. As shown in Figure 5d–f, the linear correlation coefficient (R2) between the oxidation current and square root of the scan rate was determined to be 0.9868, 0.9801 and 0.9700 for AA, DA and UA. Hence, it can be confirmed that the oxidation reaction of AA, DA and UA on Ti3C2Tx@TiO2 NSs/GCE was controlled by a diffusion process [35].

2.3. The Use of Ti3C2Tx@TiO2 NSs/GCE for Separate and Simultaneous Detection of AA, DA and UA

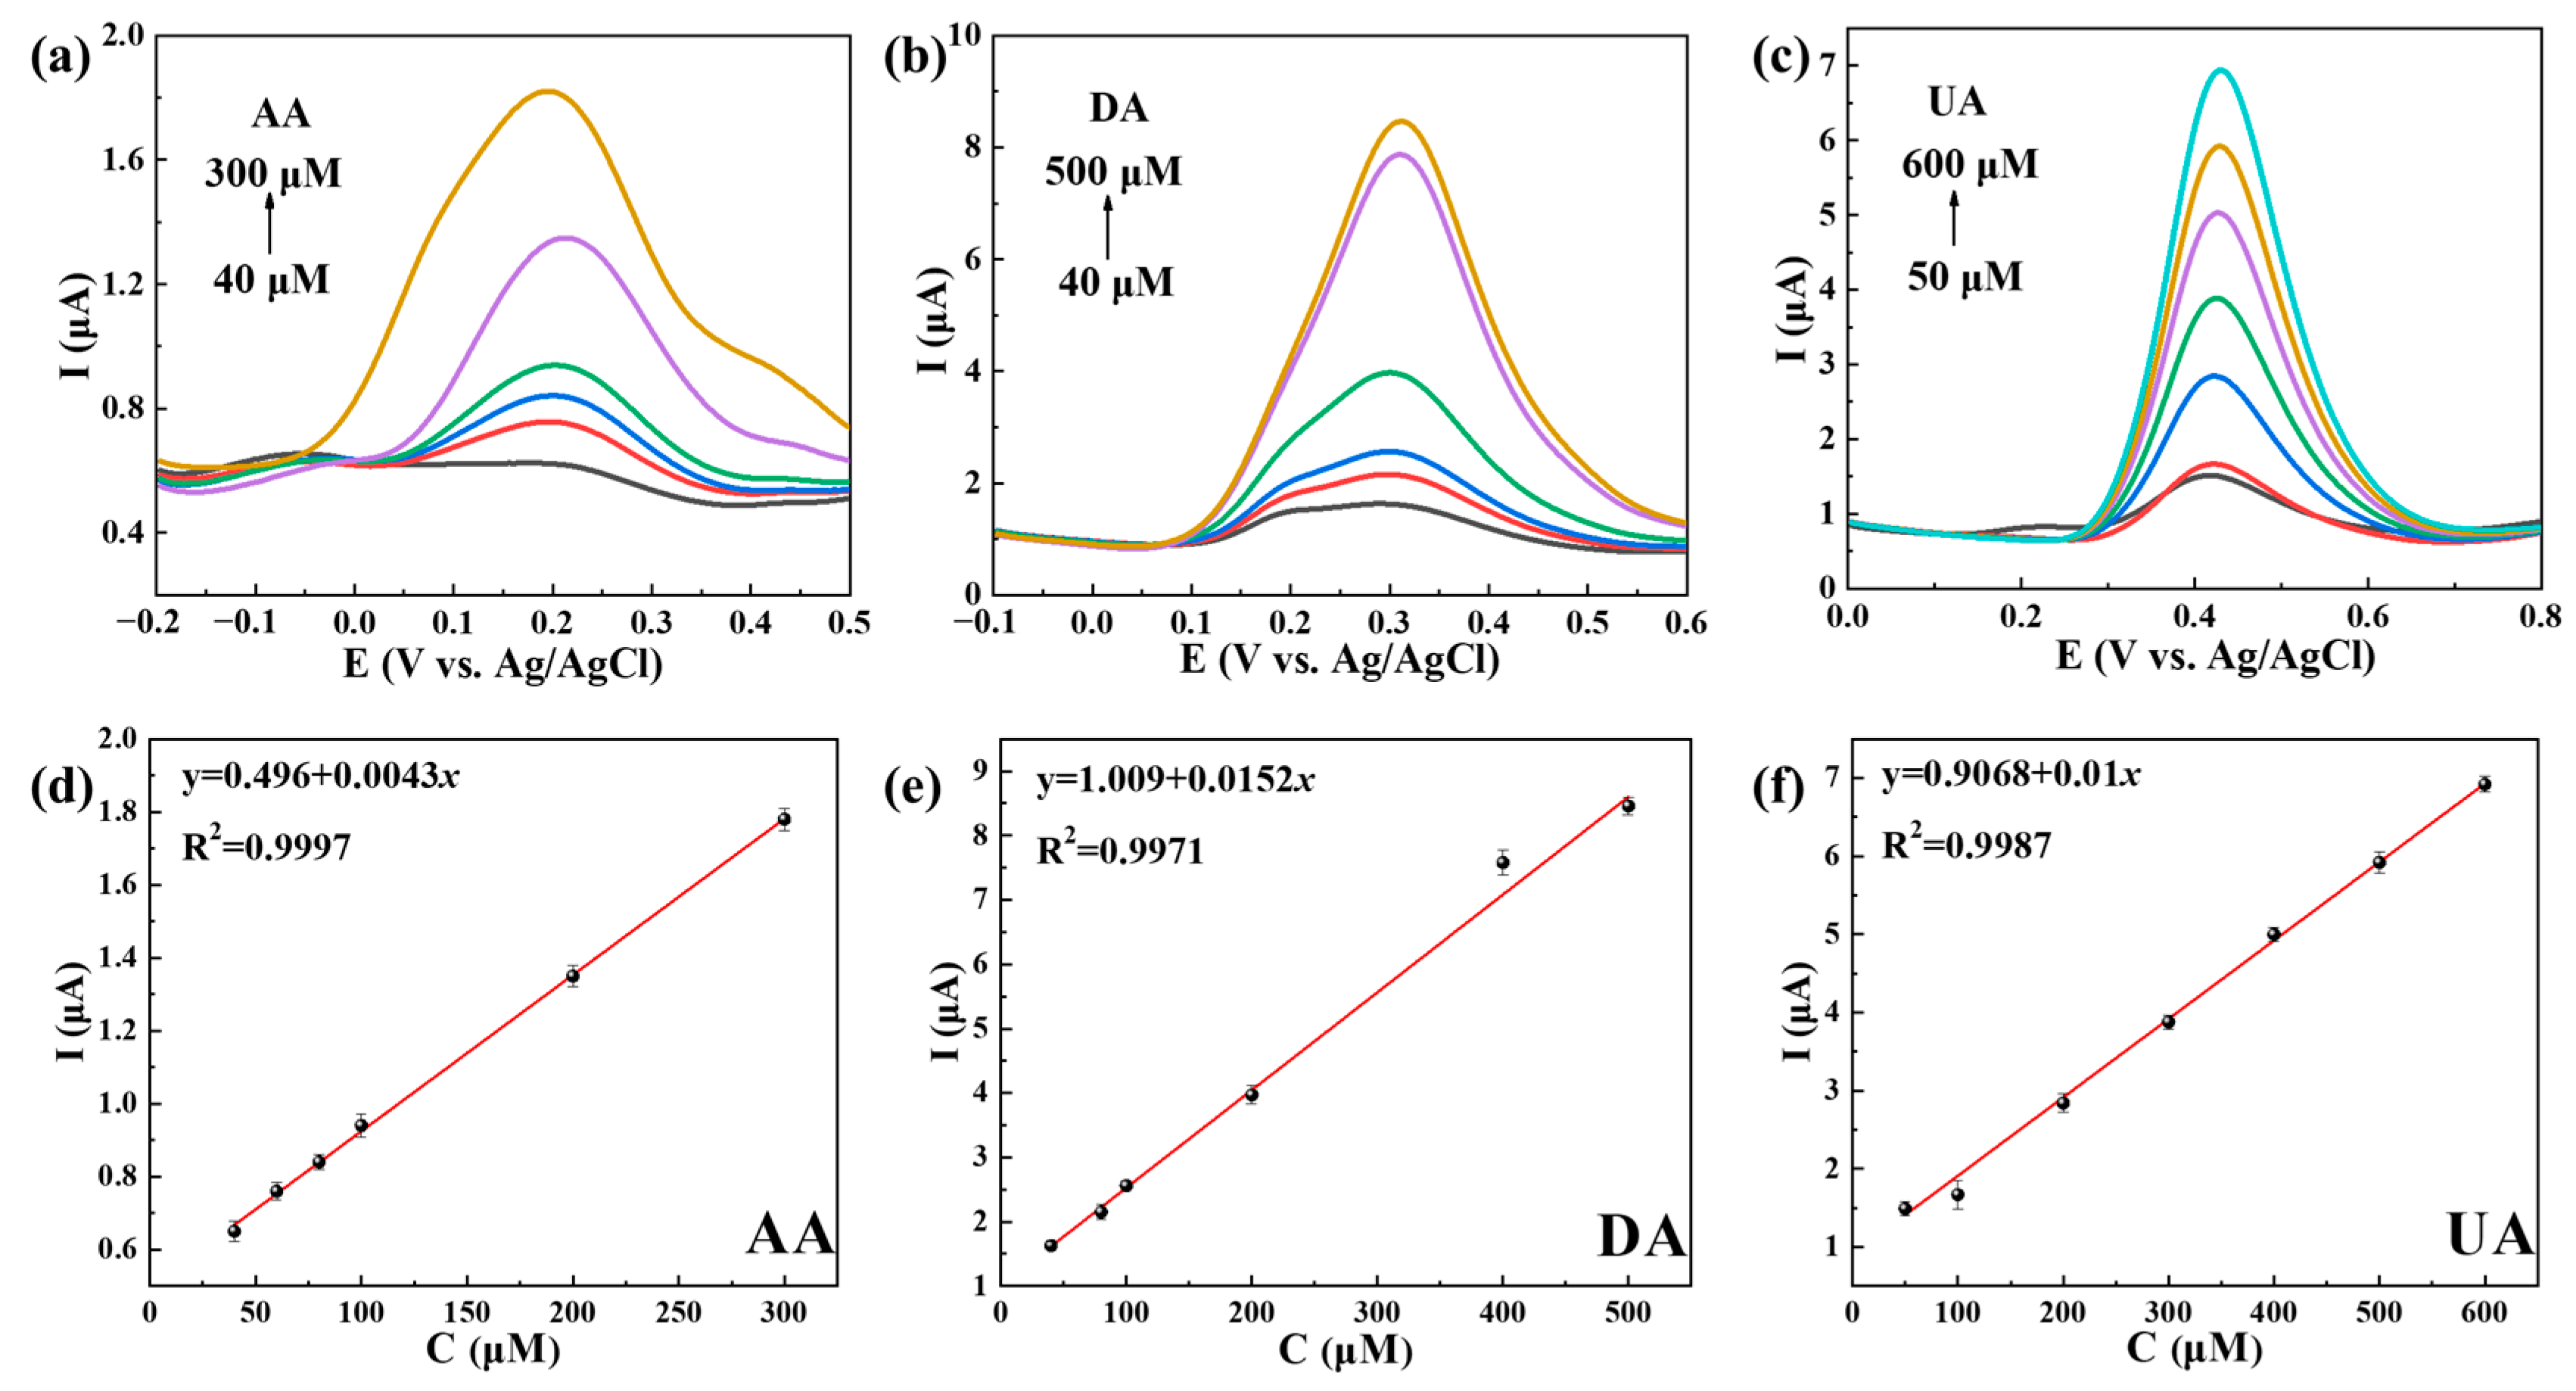
Figure 6 demonstrates the separate detection of AA, DA and UA on Ti3C2Tx@TiO2 NSs/GCE in 0.1 M PBS (pH 7.4) through the use of DPV. Figure 6a–c show thatTi3C2Tx@TiO2 NSs/GCE exhibits the individual detection of AA, DA and UA under concentrations ranging from 40 to 300 μM, 40 to 500 μM and 50 to 600 μM, respectively. Figure 6d–f show the R2a of AA, DA and UA as 0.9994, 0.9941 and 0.9975, respectively. The LOD for AA, DA and UA was determined to be 1.12 μM, 0.35 μM and 0.47 μM, respectively.
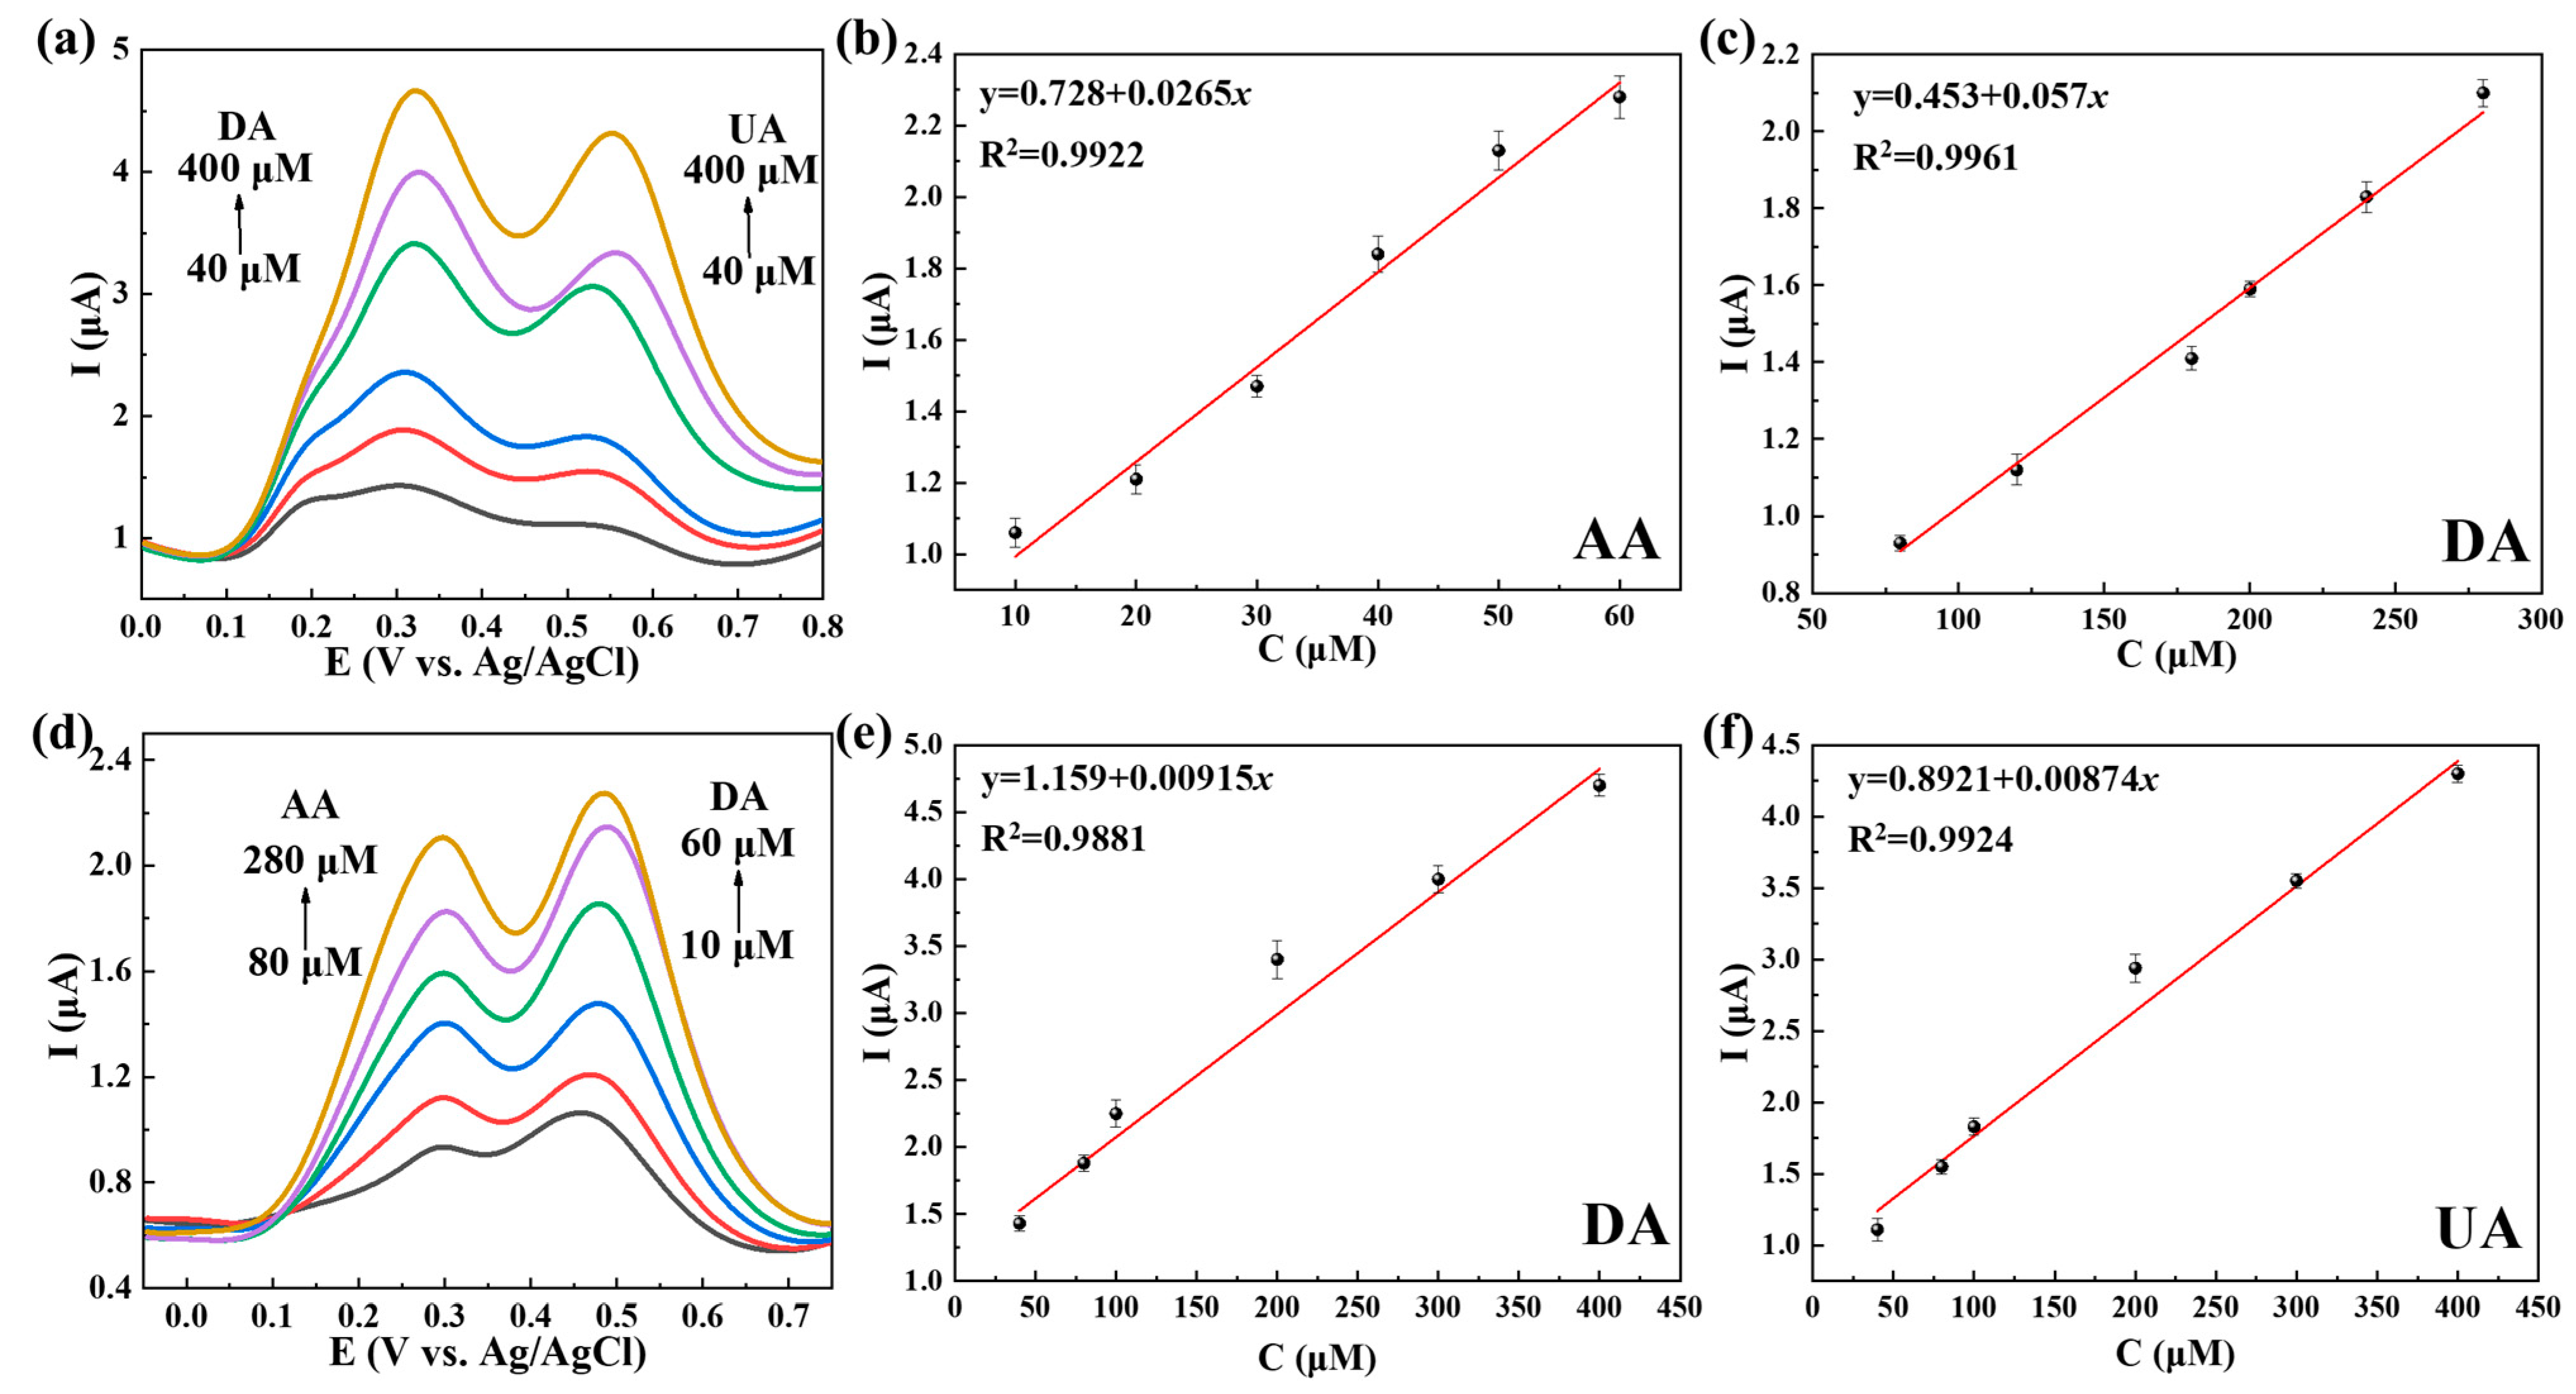
Figure 7a demonstrates the simultaneous determination of AA and DA through DPV on Ti3C2Tx@TiO2 NSs/GCE. A noticeable difference was observed in the peak potentials of AA (0.27 V) and DA (0.46 V). For AA (80–280 μM) and DA (10–60 μM), a direct correlation was identified between peak currents and concentrations, resulting in R2 values of 0.9845 and 0.9922, respectively (Figure 7b,c). Similarly, Figure 7d illustrates the distinct separation of DA (0.33 V) and UA (0.54 V) oxidation peak potentials. As shown in Figure 7e,f, a linear response was observed for DA (40–400 μM) and UA (40–400 μM) with R2 values of 0.9764 and 0.9841, respectively. Meanwhile, it can be observed that altering the concentration of a single solute resulted in a corresponding linear change in the detection current of the AA–UA (Figures S3 and S4). These results serve as evidence for the dependable detection sensitivity exhibited by Ti3C2Tx@TiO2 NSs/GCE.
It should be noted that when AA and UA coexisted in solution, no discernible peak splitting phenomenon was observed (Figure S5a–c). At the same time, the oxidation potential was shifted higher upon the addition of AA or UA. This phenomenon is attributed to the close oxidation potential of AA and UA; the offset of the AA and UA peaks is due to the catalytic oxidation of UA by AA [36].
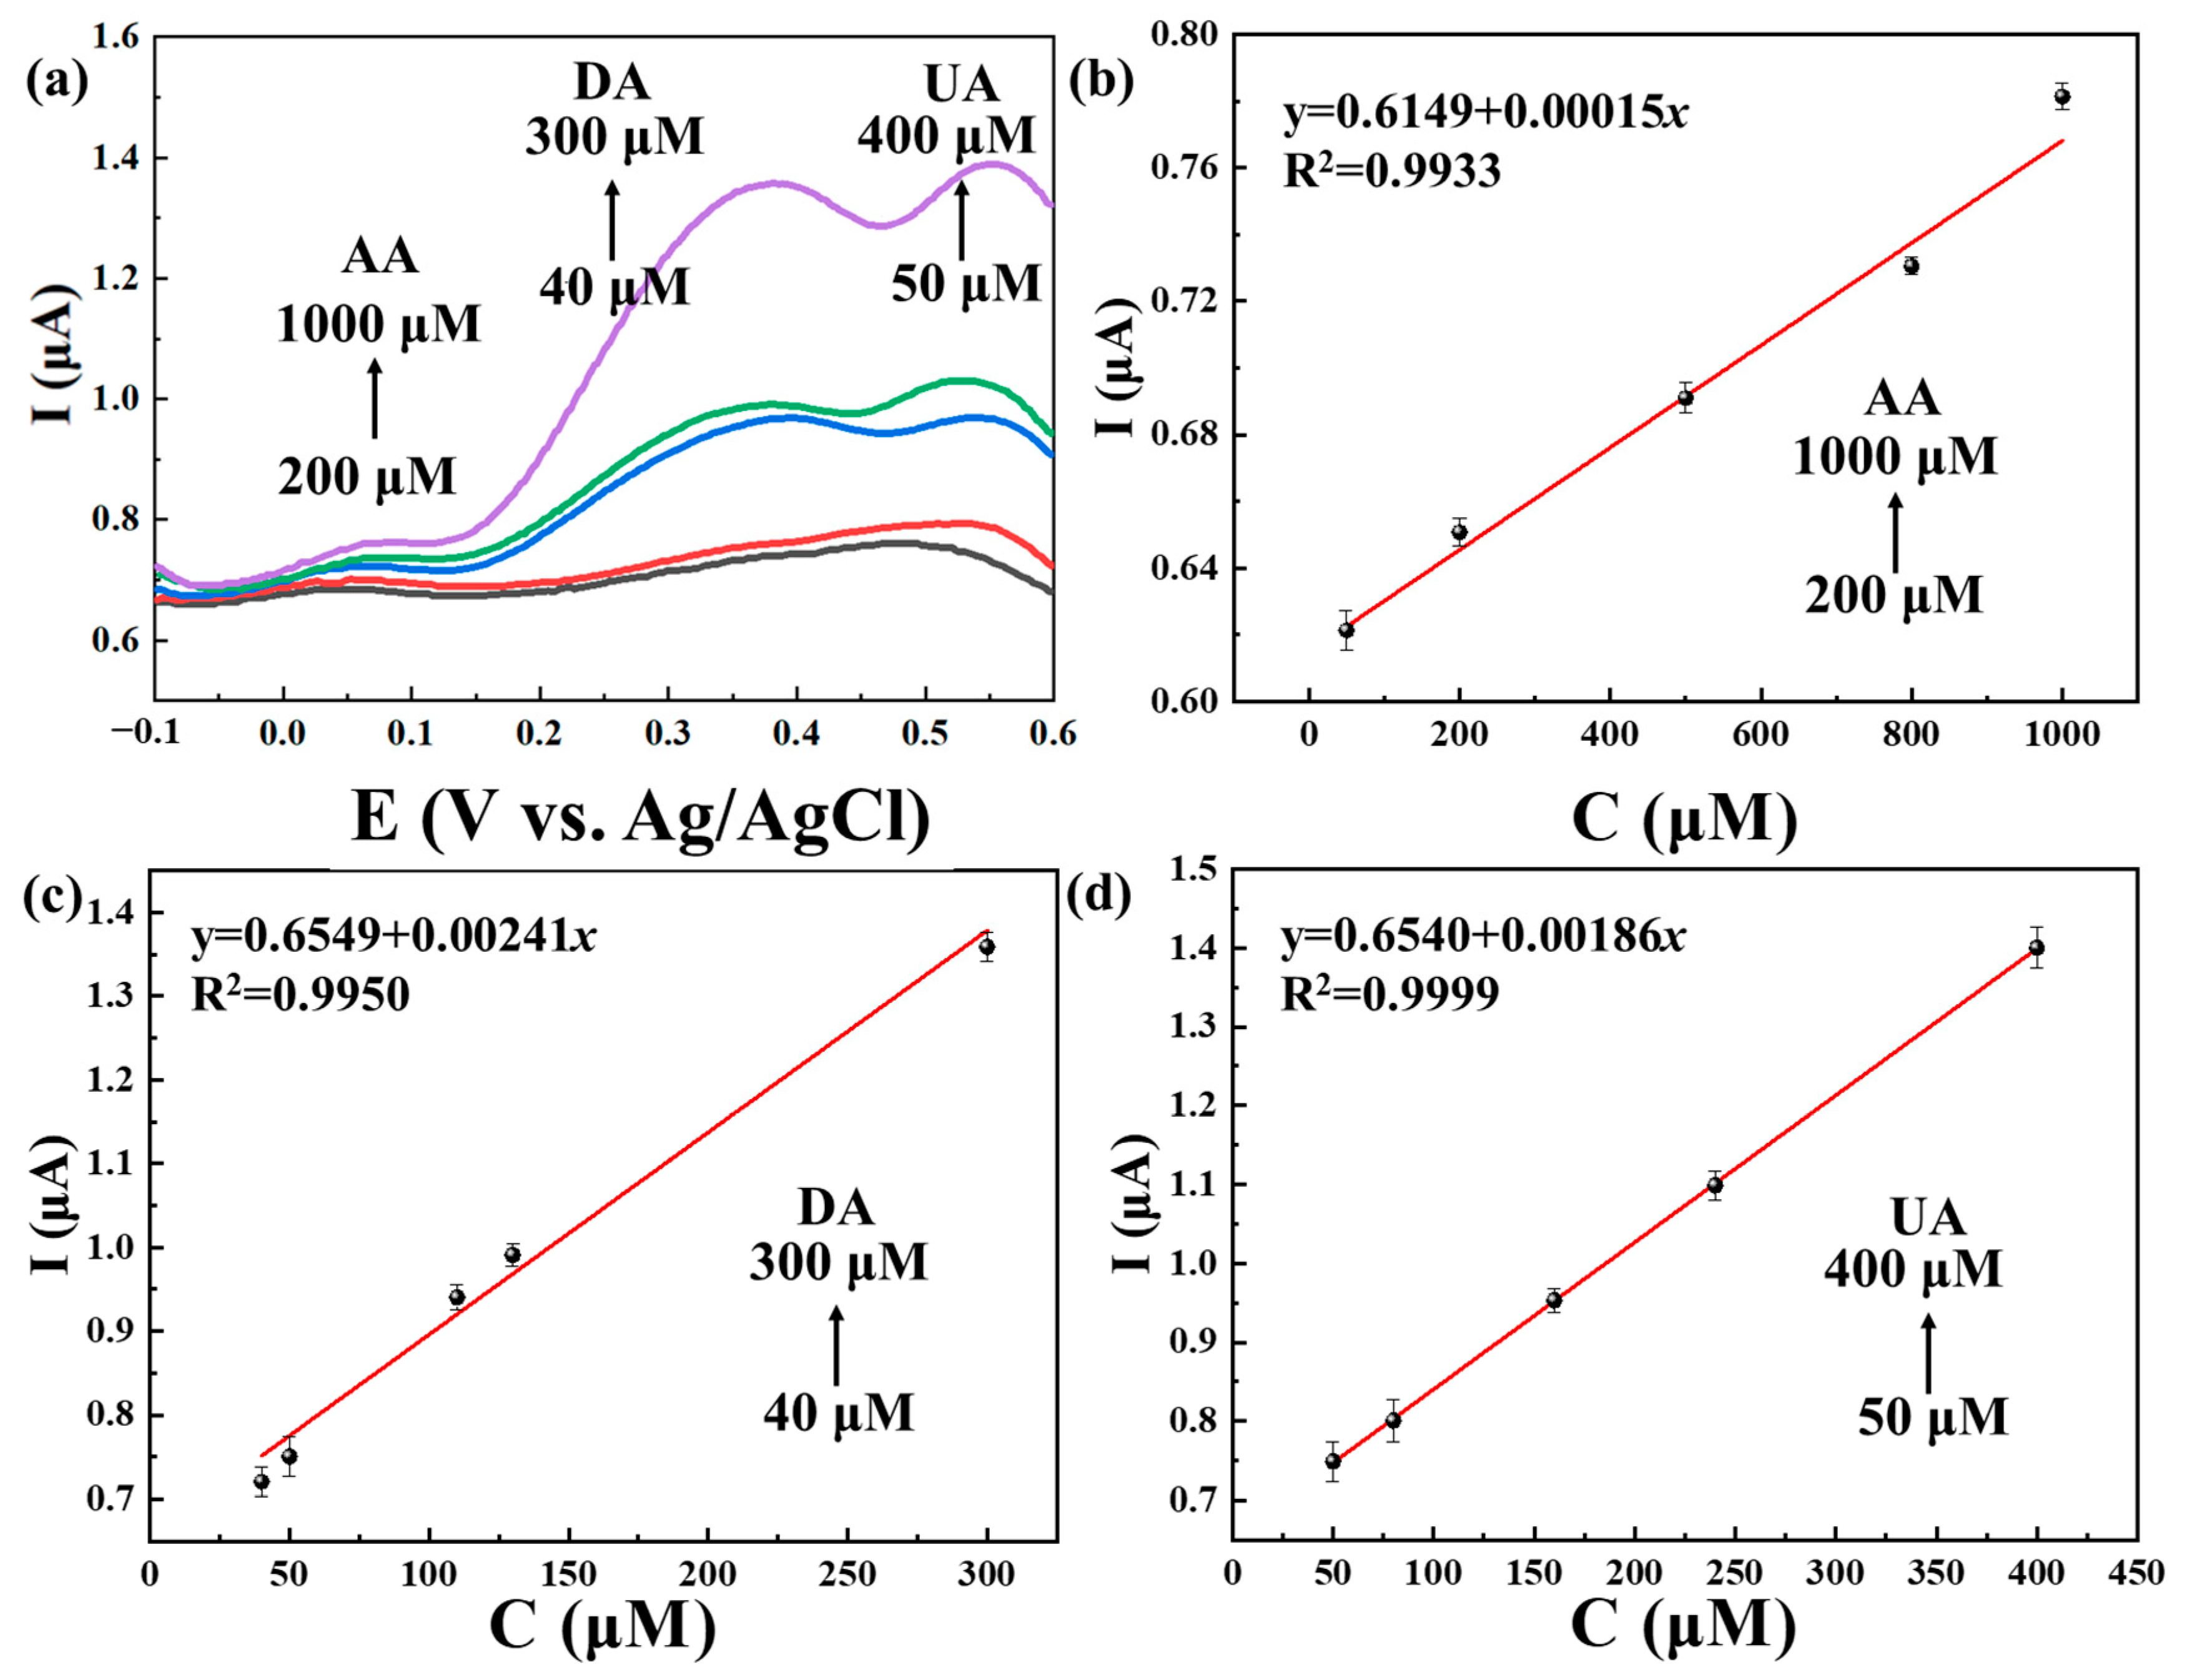
The DPV curves of the simultaneous determination of AA, DA and UA using Ti3C2Tx@TiO2 NSs/GCE are shown in Figure 8. As depicted in Figure 8a, the oxidation peak potentials of AA, DA and UA were observed to be 0.06 V, 0.37 V and 0.55 V, respectively. Additionally, Figure 8b–d highlight the linear relationship between peak currents and concentrations, with observed ranges of 200–1000 μM (R2 = 0.9875) for AA, 40–300 μM (R2 = 0.9875) for DA and 50–400 μM (R2 = 0.9991) for UA. The LOD was determined to be 2.91 μM, 0.19 μM and 0.25 μM for AA, DA and UA, respectively. Subsequently, this work was compared with previous work on electrochemical sensors (Table 1). There are several key advantages in our work: Firstly, our synthesis method is simple, and the preparation conditions are gentle, in contrast to the complex synthesis processes and high-temperature preparation conditions commonly found in the existing literature [37,38,39]. Secondly, our use of non-precious metals is more cost-effective than the use of precious metals; even though precious metals can enhance material sensitivity, they also escalate manufacturing costs [40,41]. Materials such as MXene and TiO2 present a promising low-cost alternative. Lastly, our work demonstrates a lower Limit of Detection (LOD) for AA when using MXene-based materials. While the negative electronegativity of the MXene surface traditionally hinders AA detection, the TiO2 synthesized via the solvothermal method effectively optimizes the surface charge of MXene, enabling the simultaneous detection of AA, DA and UA, with a particularly noteworthy LOD of 2.9 μM for AA.
It is noteworthy that the inclusion of DA exhibited an ability to separate the overlapping peaks of AA and UA. The oxidation products of AA and UA absorb or electropolymerize on the electrodes and reduce their detection sensitivity [42,43]. When DA is added, the oxidation products of DA react with AA, thereby mitigating electrode contamination. Additionally, DA is recognized as a catalyst for both AA and UA [44,45]. Upon the addition of DA, it underwent reactions with AA and UA to generate intermediate complexation products, effectively lowering the activation energy of AA and increasing the activation energy of UA. Consequently, the peaks corresponding to AA and UA resurfaced during simultaneous detection.
Table 1. The performance of sensors for the electrochemical simultaneous detection of AA, DA and UA has been reported recently.
ElectrodeLinear Range (μM)LOD (μM)Refs.
AADAUAAADAUA
FGP10–18001–3005–8004.20.422.2[46]
P-4-ABA/GCE20–8005–1001–805.01.00.5[47]
HNP-PtTi200–10004–500100–100024.23.25.3[48]
p-TA/nano-Au/GCE2.1–50.10.6–3401.6–11014.80.050.1[49]
Fe3O4/Co3O4/mc@g-C3N4/GCE500–80001–705–10012.550.210.18[50]
SPGNE4–45000.5–20000.8–25000.950.120.20[8]
PG/GCE9–23145–7106–13306.452.004.82[51]
Pt@g-C3N4/N-CNTs/GCE2–20005–1001–11029.440.212.99[52]
Co/MoSe2/PPy@CNF30–32121.2–53610–10716.320.450.81[37]
Ti3C2Tx/TiO2 NSs200–100040–30050–4002.90.190.25This work
FGP—Few-layer graphene/Pt; GCE—glassy carbon electrode; HNP—hierarchical nanoporous; P-4-ABA—Poly (4-aminobutyric acid); p-TA/nano-Au—gold nanoparticles on poly (3-amino-5-mercapto-1,2,4-triazole) film; Fe3O4—iron oxide; Co3O4—cobalt oxide; SPGNE—screen-printed graphene electrode; g-C3N4—graphitic carbon nitride; N-CNTs—N-doped carbon nanotubes; PG—pristine graphene; and Co/MoSe2/PPy@CNF—cobalt-doped 2D-MoSe2/polypyrrole hybrid-based carbon nanofibers.
Based on previous studies [40,41], simultaneous detection of AA/DA/UA faces significant challenges due to mutual interference, such as strong electrostatic interactions and overlapping oxidation potentials [36,38,53]. Through the solvothermal process, Ti3C2Tx@TiO2 NSs exhibit two distinct advantages that enhance their ability to detect these molecules simultaneously. First, the replacement of –F by additional Ti3+ ions significantly changes the surface charge of Ti3C2Tx, reducing the mutual repulsion of the analytes. Secondly, a considerable number of TiO2 NSs are grown on the Ti3C2Tx lamellae surface, which decreases the ion diffusion length [54] and increases the specific surface area of the Ti3C2Tx@TiO2 NSs. Finally, the formation of Ti3C2Tx and TiO2 heterojunctions facilitates the transport of charge carriers [39]. As a result, the integration of Ti3C2Tx and TiO2 allows for the creation of a highly precise and sensitive sensor capable of detecting biological small molecules with high resolution.

2.4. Reproducibility, Interference Immunity Testing and Stability Analysis

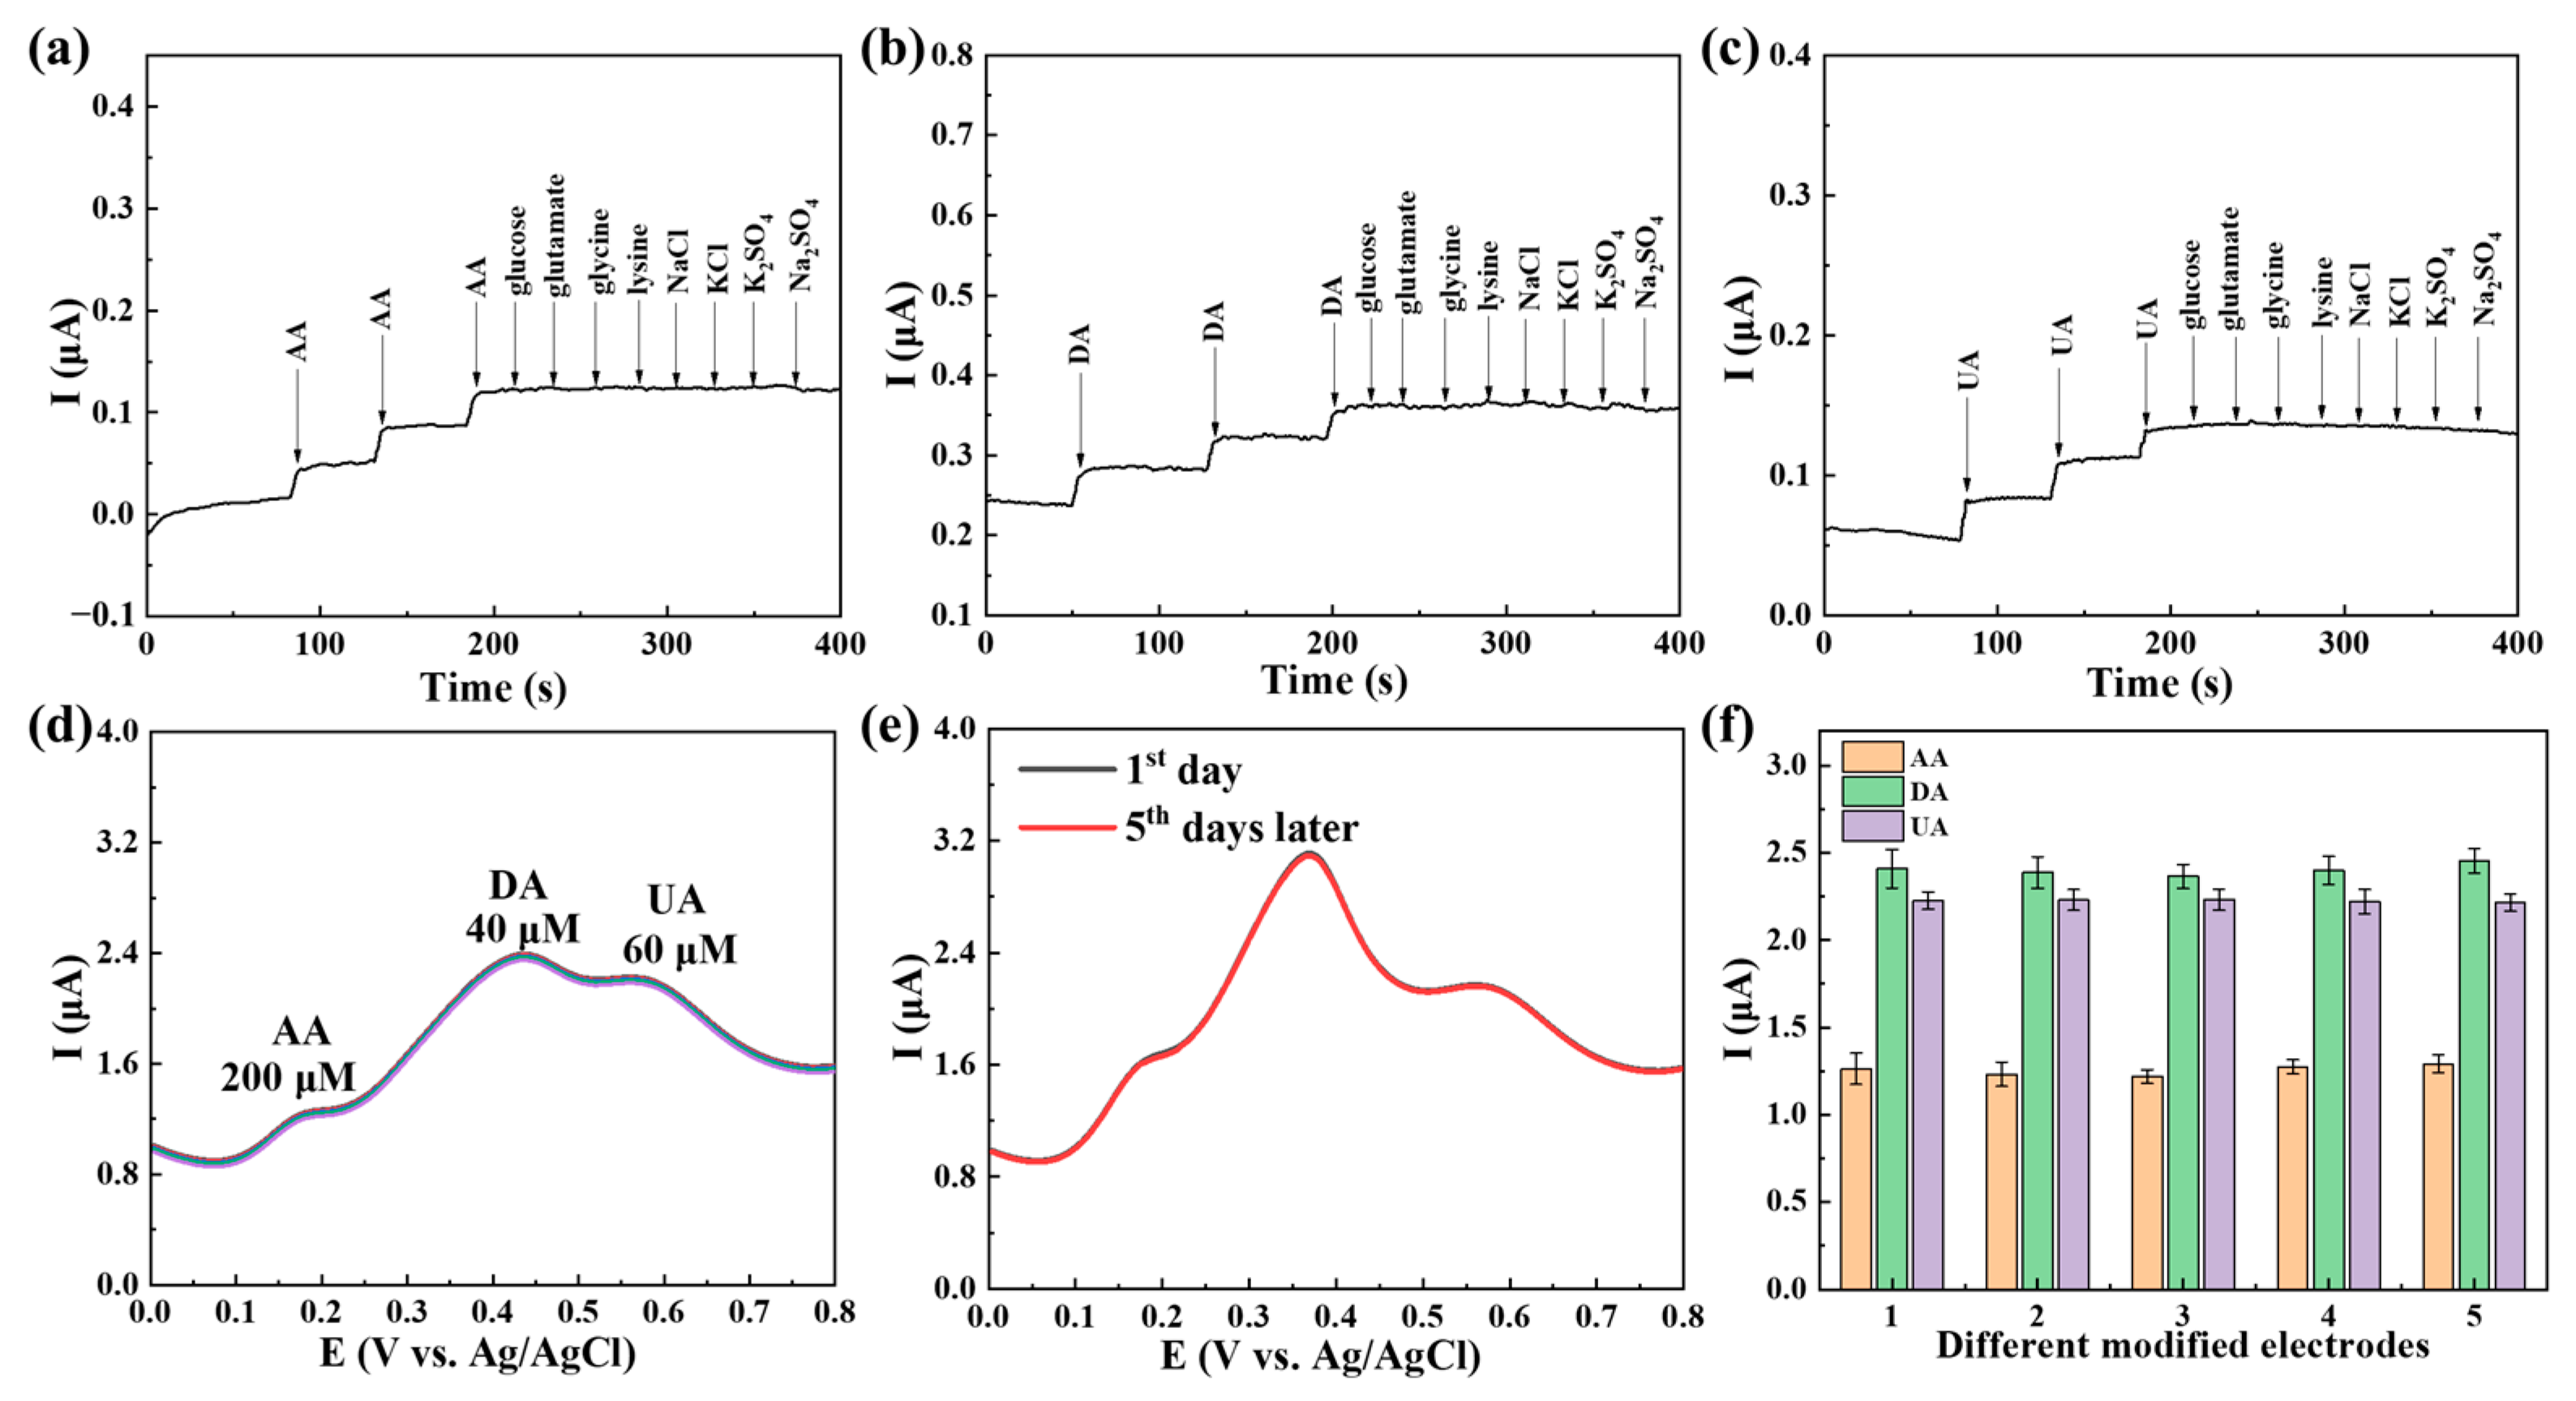
Several potential coexisting substances were detected using the amperometric method to verify the interference resistance of Ti3C2Tx@TiO2 NSs/GCE (Figure 9a–c). The continuous addition of the interfering substance did not affect the detection current of the AA/DA/UA. Therefore, Ti3C2Tx@TiO2 NSs/GCE demonstrated excellent anti-interference capability for detecting AA, DA and UA. Five consecutive measurements were conducted in the solution containing 200 μM AA, 60 μM DA and 40 μM UA, investigating the stability of Ti3C2Tx@TiO2 NSs/GCE. The results shown in Figure 9d indicate that the peaks of the five consecutive measurements remained almost unchanged, with a calculated RSD of 0.54%. This suggests that Ti3C2Tx@TiO2 NSs/GCE exhibits good stability under testing conditions. Furthermore, a DPV test was performed after the electrode was exposed to air for 5 days to evaluate the environmental stability of Ti3C2Tx@TiO2 NSs/GCE (Figure 9e). The peak currents remained nearly constant, indicating the excellent environmental stability of Ti3C2Tx@TiO2 NSs/GCE. As shown in Figure 9f, the simultaneous detection of AA/DA/UA was utilized on five different Ti3C2Tx@TiO2 NSs/GCE electrodes in 0.1 M PBS using DPV. The oxidation peak currents of AA (200 M), DA (40 M) and UA (60 M) were not significantly altered.

3. Experimental Section

3.1. Chemicals

Kaixi Materials Co., Ltd. In Shandong, China supplied Ti3AlC2 powder (94 wt%, ~300 mesh). Sinopharm Chemical Reagent Co., Ltd. in Beijing, China provided potassium chloride (KCl), ethyl alcohol (99.9%), titanium trichloride (TiCl3), hydrofluoric acid (40 wt% HF), acetone, potassium ferricyanide (K3[Fe (CN)6]), ethylene glycol (EG), ascorbic acid, dopamine, uric acid, dibasic sodium phosphate (Na2HPO4) and potassium dihydrogen phosphate (KH2PO4). Praxair Gas Co., Ltd. supplied nitrogen (N2) and argon gas (Ar). Yue Ci Electronic Technology Co., Ltd. in Shanghai, China provided aluminum oxide powder (1.0, 0.3 and 0.05 μm). Analytical grade chemicals were employed in this work without additional purification.

3.2. Apparatus

An electrochemical workstation was used to obtain the electrochemical properties of the modified electrode. The model of the electrochemical workstation is CHI, 660E (Dalian, China). The surface morphology of the material was obtained by scanning electron microscopy (SEM) using the Nova 230, FEI (Hillsboro, OR, USA) model. The ultrastructure of the material was obtained by transmission electron microscopy, model Tecnai G2 F30 S-TWIN, FEI (USA). The high-resolution electron microscopy was obtained using JEM-2010 (HRTEM, JEOL Japan Electronics Co., Ltd, Akishima-shi in Japan). The structure and phase of the materials were analyzed using X-ray powder diffraction (XRD), model TTRIII, Rigaku (Tokyo, Japan) with Cu Kα radiation (λ = 1.5406 Å) and X-ray photoelectron spectroscopy (XPS), using the VG Multilab 2009 (Manchester, UK) model.

3.3. Synthesis of Ti3C2Tx@TiO2 NSs

Scheme 1 shows the preparation process of Ti3C2Tx@TiO2 NSs. Ti3C2Tx was obtained by the one-step wet etching method [55]. The Ti3AlC2 powder (1 g) was added gradually to a solution of HF (40 mL, 40 wt%) and allowed to react at 35 °C for 24 h with stirring at a speed of 500 rpm. The etched substance was rinsed with deionized water (DI) until the pH reached above 6.0. High-speed centrifugation (300 rpm, 3 min) allows the powder to be separated from the DI. Finally, the gelatinous Ti3C2Tx was dehydrated under vacuum freezing conditions (−80 °C, 2 h). A solution was prepared by mixing 30 mL of EG with an equal volume (k mL) of TiCl3 and DI (k = 0.6, 0.8, 1.0) and stirring it for approximately 30 min. Subsequently, 20 mg of as-prepared Ti3C2Tx was added to the solution and sonicated for 30 min to create a homogeneous suspension. The suspension was moved to a stainless steel autoclave and subjected to heat treatment at 150 °C for 12 h before being cooled to room temperature. The precipitates were washed with ethyl alcohol, and dried for 2 days. Finally, the precipitates were annealed at 350 °C in flowing Ar for 2 h. The obtained granular powders were marked as Ti3C2Tx@TiO2 NSs(0.6), Ti3C2Tx@TiO2 NSs(0.8), and Ti3C2Tx@TiO2 NSs(1.0), respectively.

3.4. Fabrication of the Ti3C2Tx@TiO2 NSs Electrode

Aluminum oxide powder with particle sizes of 1.0, 0.3 and 0.05 μm was first placed on a nylon cloth for polishing the glassy carbon electrode (GCE). The electrodes were then washed continuously for 5 min using acetone, ethanol and deionized water (DI), respectively, until it was ensured that a smooth electrode surface was obtained. Then, 10 mg of Ti3C2Tx@TiO2 NSs was dispersed in 10 mL of DI using the ultrasonic method. Next, 3 μL of the aforementioned Ti3C2Tx@TiO2 NSs solution was dropped on the GCE surface and allowed to dry under nitrogen atmosphere to form a flat film. For comparison, the preparation process of the remaining electrodes was performed in a similar way.

3.5. Electrochemical Measurement

The main purpose of this work is to discuss the electrochemical detection performance of modified electrodes for AA/DA/UA in human physiological situations. Therefore, pH 7.4 was chosen as the detection solution condition in this work. The pH of the solution was regulated by PBS. GCE or Ti3C2Tx/GCE or Ti3C2Tx@TiO2 NSs/GCE served as the working electrode. Ag/AgCl was used as the reference electrode. Platinum (Pt) served as the counter electrode. The electrochemical detection capability was evaluated using differential pulse voltammetry (DPV). Furthermore, the time-amperometric method was used to assess the ability to resist interferences. The interferents included NaCl, KCl, K2SO4, Na2SO4, glucose, glutamate, glycine and lysine.

4. Conclusions

In this work, Ti3C2Tx coated with TiO2 nanosheets was synthesized using a simple solvothermal process. The Ti3C2Tx@TiO2 NSs-modified GCE has been proven to enable the simultaneous detection of AA at concentrations ranging from 200 to 1000 μM, DA at concentrations ranging from 40 to 300 μM, and UA at concentrations ranging from 50 to 400 μM. The LOD achieved for these analytes is 2.91 μM (AA), 0.19 μM (DA) and 0.25 μM (UA). Furthermore, the Ti3C2Tx@TiO2/GCE exhibits excellent resistance to interference, good repeatability and high selectivity. Two key advantages of the Ti3C2Tx@TiO2 are demonstrated to enhance their capability for simultaneous detection. Firstly, the substitution of –F ions with additional Ti3+ ions leading to a negative to neutral surface charge change of Ti3C2Tx, thereby reducing electrostatic repulsion. Secondly, the growth of a mass of TiO2 nanosheets on the surface of Ti3C2Tx significantly increases the specific surface area and charge transport properties of the composite material. This work provides a novel approach for AA, DA and UA recognition in MXene-based composites. In future electrochemical detection, researchers may utilize targeted nanomaterial modifications between MXene lamellae to achieve precise detection of various analytes. This approach not only mitigates the self-accumulation of MXene but also increase the specific active sites, which is conducive to improving the selectivity and sensitivity of MXene-based materials.

Supplementary Materials

The following supporting information can be downloaded at: https://www.mdpi.com/article/10.3390/molecules29122915/s1. Figure S1. XRD patterns of Ti3AlC2, Ti3C2Tx and Ti3C2Tx@TiO2 NSs. Figure S2. SEM images of (a) Ti3AlC2, (b)Ti3C2Tx. Figure S3. (a) DPV results in the presence of 1 mM AA at different concentrations of DA (80–500 μM) (b) the relationship between the corresponding oxidation peak current value and concentration of DA (c) DPV results in the presence of 20 μM DA at different concentrations of AA (150–400 μM), (d) the relationship between the corresponding oxidation peak current value and concentration of AA. Figure S4. (a) DPV results in the presence of 150 μM UA at different concentrations of DA (50–400 μM) (b) the relationship between the corresponding oxidation peak current value and concentration of DA (c) DPV results in the presence of 100 μM DA at different concentrations of UA (150–400 μM), (d) the relationship between the corresponding oxidation peak current value and concentration of DA. Figure S5. (a) DPV results in the presence of different concentrations of AA (200–700 μM) and UA (100–350 μM), (b) DPV results in the presence of 500 μM AA at different concentrations of UA (40–100 μM), (c) DPV results in the presence of 100 μM UA at different concentrations of AA (40–500 μM).

Author Contributions

Conceptualization: T.Y. and X.H.; methodology: D.J. and K.W.; writing—original draft: D.J. and T.Y.; writing—review and editing: T.Y. and H.W.; investigation: K.W., H.W. and E.W.; funding acquisition: T.Y., E.W. and X.H.; resources: K.-C.C.; supervision: K.-C.C. and X.H.; project administration: X.H. All authors have read and agreed to the published version of the manuscript.

Funding

This work was supported by the National Science Fund for Distinguished Young Scholars (No. 52025041), the National Natural Science Foundation of China (No. 51902020, 51974021, 52250091), the Fundamental Research Funds for the Central Universities No. FRF-TP-20-02C2, Guangxi Key Laboratory of Processing for Non-Ferrous Metals and Featured Materials (Grant No. 2021GXYSOF12) and the Interdisciplinary Research Project for Young Teachers of USTB (Fundamental Research Funds for the Central Universities) (No. FRF-IDRY-21-028).

Institutional Review Board Statement

Not applicable.

Informed Consent Statement

Not applicable.

Data Availability Statement

Date will be made available on request.

Conflicts of Interest

The authors declare no conflicts of interest.

References

  1. Jiang, Q.; Kurra, N.; Alhabeb, M.; Gogotsi, Y.; Alshareef, H.N. All pseudocapacitive MXene-RuO2 asymmetric supercapacitors. Adv. Energy Mater. 2018, 8, 1703043. [Google Scholar] [CrossRef]
  2. Wang, Z.; Xu, Z.; Huang, H.; Chu, X.; Xie, Y.; Xiong, D.; Yan, C.; Zhao, H.; Zhang, H.; Yang, W. Unraveling and regulating self-discharge behavior of Ti3C2Tx MXene-based supercapacitors. ACS Nano 2020, 14, 4916–4924. [Google Scholar] [CrossRef]
  3. Xie, H.; Li, P.; Shao, J.; Huang, H.; Chen, Y.; Jiang, Z.; Chu, P.K.; Yu, X.F. Electrostatic self-assembly of Ti3C2Tx MXene and gold nanorods as an efficient surface-enhanced raman scattering platform for reliable and high-sensitivity determination of organic pollutants. ACS Sens. 2019, 4, 2303–2310. [Google Scholar] [CrossRef]
  4. Song, D.; Jiang, X.; Li, Y.; Lu, X.; Luan, S.; Wang, Y.; Li, Y.; Gao, F. Metal-organic frameworks-derived MnO2/Mn3O4 microcuboids with hierarchically ordered nanosheets and Ti3C2 MXene/Au NPs composites for electrochemical pesticide detection. J. Hazard. Mater. 2019, 373, 367–376. [Google Scholar] [CrossRef]
  5. Zhang, W.; Liu, L.; Li, Y.; Wang, D.; Ma, H.; Ren, H.; Shi, Y.; Han, Y.; Ye, B.C. Electrochemical sensing platform based on the biomass-derived microporous carbons for simultaneous determination of ascorbic acid, dopamine, and uric acid. Biosens. Bioelectron. 2018, 121, 96–103. [Google Scholar] [CrossRef]
  6. Sabatier, M.; Rytz, A.; Husny, J.; Dubascoux, S.; Nicolas, M.; Dave, A.; Singh, H.; Bodis, M.; Glahn, R.P. Impact of ascorbic acid on the In vitro iron bioavailability of a casein-based iron fortificant. Nutrients 2020, 12, 2776. [Google Scholar] [CrossRef]
  7. Zhang, X.; Chen, X.; Kai, S.; Wang, H.Y.; Yang, J.; Wu, F.G.; Chen, Z. Highly sensitive and selective detection of dopamine using one-pot synthesized highly photoluminescent silicon nanoparticles. Anal. Chem. 2015, 87, 3360–3365. [Google Scholar] [CrossRef]
  8. Ping, J.; Wu, J.; Wang, Y.; Ying, Y. Simultaneous determination of ascorbic acid, dopamine and uric acid using high-performance screen-printed graphene electrode. Biosens. Bioelectron. 2012, 34, 70–76. [Google Scholar] [CrossRef]
  9. Shang, N.G.; Papakonstantinou, P.; McMullan, M.; Chu, M.; Stamboulis, A.; Potenza, A.; Dhesi, S.S.; Marchetto, H. Catalyst-free efficient growth, orientation and biosensing properties of multilayer graphene nanoflake films with sharp edge planes. Adv. Funct. Mater. 2008, 18, 3506–3514. [Google Scholar] [CrossRef]
  10. Habibi, B.; Pournaghi-Azar, M.H. Simultaneous determination of ascorbic acid, dopamine and uric acid by use of a MWCNT modified carbon-ceramic electrode and differential pulse voltammetry. Electrochim. Acta 2010, 55, 5492–5498. [Google Scholar] [CrossRef]
  11. You, Q.; Guo, Z.; Zhang, R.; Chang, Z.; Ge, M.; Mei, Q.; Dong, W.F. Simultaneous recognition of dopamine and uric acid in the presence of ascorbic acid via an intercalated MXene/PPy nanocomposite. Sensors 2021, 21, 3069. [Google Scholar] [CrossRef]
  12. Xue, Y.; Zheng, Y.; Wang, E.; Yang, T.; Wang, H.; Hou, X. Ti3C2Tx (MXene)/Pt nanoparticle electrode for the accurate detection of DA coexisting with AA and UA. Dalton Trans. 2022, 51, 4549–4559. [Google Scholar] [CrossRef]
  13. Song, F.; Li, G.; Zhu, Y.; Wu, Z.; Xie, X.; Zhang, N. Rising from the horizon: Three-dimensional functional architectures assembled with MXene nanosheets. J. Mater. Chem. A 2020, 8, 18538–18559. [Google Scholar] [CrossRef]
  14. Schultz, T.; Frey, N.C.; Hantanasirisakul, K.; Park, S.; May, S.J.; Shenoy, V.B.; Gogotsi, Y.; Koch, N. Surface termination dependent work function and electronic properties of Ti3C2Tx MXene. Chem. Mater. 2019, 31, 6590–6597. [Google Scholar] [CrossRef]
  15. Rizwan, K.; Rahdar, A.; Bilal, M.; Iqbal, H.M.N. MXene-based electrochemical and biosensing platforms to detect toxic elements and pesticides pollutants from environmental matrices. Chemosphere 2022, 291, 132820. [Google Scholar] [CrossRef]
  16. Huang, H.; Dong, C.; Feng, W.; Wang, Y.; Huang, B.; Chen, Y. Biomedical engineering of two-dimensional MXenes. Adv. Drug Deliv. Rev. 2022, 184, 114178. [Google Scholar] [CrossRef]
  17. Zheng, J.; Wang, B.; Ding, A.; Weng, B.; Chen, J. Synthesis of MXene/DNA/Pd/Pt nanocomposite for sensitive detection of dopamine. J. Electroanal. Chem. 2018, 816, 189–194. [Google Scholar] [CrossRef]
  18. Amara, U.; Mehran, M.T.; Sarfaraz, B.; Mahmood, K.; Hayat, A.; Nasir, M.; Riaz, S.; Nawaz, M.H. Perylene diimide/MXene-modified graphitic pencil electrode-based electrochemical sensor for dopamine detection. Mikrochim. Acta 2021, 188, 230. [Google Scholar] [CrossRef]
  19. Zhou, R.; Tu, B.; Xia, D.; He, H.; Cai, Z.; Gao, N.; Chang, G.; He, Y. High-performance Pt/Ti3C2Tx MXene based graphene electrochemical transistor for selective detection of dopamine. Anal. Chim. Acta 2022, 1201, 339653. [Google Scholar] [CrossRef]
  20. Murugan, N.; Jerome, R.; Preethika, M.; Sundaramurthy, A.; Sundramoorthy, A.K. 2D-titanium carbide (MXene) based selective electrochemical sensor for simultaneous detection of ascorbic acid, dopamine and uric acid. J. Mater. Sci. Technol. 2021, 72, 122–131. [Google Scholar] [CrossRef]
  21. Xu, Y.; Wang, S.; Yang, J.; Han, B.; Nie, R.; Wang, J.; Wang, J.; Jing, H. In-situ grown nanocrystal TiO2 on 2D Ti3C2 nanosheets for artificial photosynthesis of chemical fuels. Nano Energy 2018, 51, 442–450. [Google Scholar] [CrossRef]
  22. Yang, H.; Cao, G.; Huang, Y.; Lin, Y.; Zheng, F.; Lin, L.; Liu, F.; Li, S. Nitrogen-doped carbon@TiO2 double-shelled hollow spheres as an electrochemical sensor for simultaneous determination of dopamine and paracetamol in human serum and saliva. J. Pharm. Anal. 2022, 12, 436–445. [Google Scholar] [CrossRef]
  23. da Silva, E.P.; Araujo, M.D.S.; Kunita, M.H.; Matos, R.; Medeiros, R.A. Electrochemical sensor based on multi-walled carbon nanotubes and N-doped TiO2 nanoparticles for voltametric simultaneous determination of benserazide and levodopa. Molecules 2022, 27, 8614. [Google Scholar] [CrossRef]
  24. Xu, Z.; Sun, Y.; Zhuang, Y.; Jing, W.; Ye, H.; Cui, Z. Assembly of 2D MXene nanosheets and TiO2 nanoparticles for fabricating mesoporous TiO2-MXene membranes. J. Membr. Sci. 2018, 564, 35–43. [Google Scholar] [CrossRef]
  25. Ono, K.; Kimura, K.; Kato, T.; Hayashi, K.; Rajapakse, R.M.G.; Shimomura, M. Epitaxial growth of a homogeneous anatase TiO2 thin film on LaAlO3 (0 0 1) using a solvothermal method with anticorrosive ligands. Chem. Eng. J. 2023, 451, 138893. [Google Scholar] [CrossRef]
  26. Liu, L.; Du, Y.-E.; Niu, X.; Li, W.; Li, J.; Yang, X.; Feng, Q. Synthesis, transformation mechanism and photocatalytic properties of various morphologies anatase TiO2 nanocrystals derived from tetratitanate nanobelts. ChemistrySelect 2018, 3, 9953–9959. [Google Scholar] [CrossRef]
  27. Li, Q.; Huo, C.; Yi, K.; Zhou, L.; Su, L.; Hou, X. Preparation of flake hexagonal BN and its application in electrochemical detection of ascorbic acid, dopamine and uric acid. Sens. Actuators B Chem. 2018, 260, 346–356. [Google Scholar] [CrossRef]
  28. Gao, L.; Li, C.; Huang, W.; Mei, S.; Lin, H.; Ou, Q.; Zhang, Y.; Guo, J.; Zhang, F.; Xu, S.; et al. MXene/polymer membranes: Synthesis, properties, and emerging applications. Chem. Mater. 2020, 32, 1703–1747. [Google Scholar] [CrossRef]
  29. Wang, Y.; Wang, J.; Han, G.; Du, C.; Deng, Q.; Gao, Y.; Yin, G.; Song, Y. Pt decorated Ti3C2 MXene for enhanced methanol oxidation reaction. Ceram. Int. 2019, 45, 2411–2417. [Google Scholar] [CrossRef]
  30. Cao, M.; Wang, F.; Wang, L.; Wu, W.; Lv, W.; Zhu, J. Room temperature oxidation of Ti3C2MXene for supercapacitor electrodes. J. Electrochem. Soc. 2017, 164, A3933–A3942. [Google Scholar] [CrossRef]
  31. O’Regan, L.K.B. Preparation of TiO, (anatase) films on electrodes by anodic oxidative hydrolysis of TiCl3. J. Electroanal. Chem. 1993, 346, 291–307. [Google Scholar] [CrossRef]
  32. Matsumoto, Y.; Ishikawa, Y.; Nishida, M.; Ii, S. A new electrochemical method to prepare mesoporous titanium(IV) oxide photocatalyst fixed on alumite substrate. J. Phys. Chem. B 2000, 104, 4204–4209. [Google Scholar] [CrossRef]
  33. Froschl, T.; Hormann, U.; Kubiak, P.; Kucerova, G.; Pfanzelt, M.; Weiss, C.K.; Behm, R.J.; Husing, N.; Kaiser, U.; Landfester, K.; et al. High surface area crystalline titanium dioxide: Potential and limits in electrochemical energy storage and catalysis. Chem. Soc. Rev. 2012, 41, 5313–5360. [Google Scholar] [CrossRef]
  34. Zhao, L.; Li, H.; Gao, S.; Li, M.; Xu, S.; Li, C.; Guo, W.; Qu, C.; Yang, B. MgO nanobelt-modified graphene-tantalum wire electrode for the simultaneous determination of ascorbic acid, dopamine and uric acid. Electrochim. Acta 2015, 168, 191–198. [Google Scholar] [CrossRef]
  35. Sudhakara, S.M.; Kotresh, H.M.N.; Devendrachari, M.C.; Khan, F. Synthesis and electrochemical investigation of tetra amino cobalt (II) phthalocyanine functionalized polyaniline nanofiber for the selective detection of dopamine. Electroanalysis 2020, 32, 1807–1817. [Google Scholar] [CrossRef]
  36. Demirkan, B.; Bozkurt, S.; Cellat, K.; Arikan, K.; Yilmaz, M.; Savk, A.; Calimli, M.H.; Nas, M.S.; Atalar, M.N.; Alma, M.H.; et al. Palladium supported on polypyrrole/reduced graphene oxide nanoparticles for simultaneous biosensing application of ascorbic acid, dopamine, and uric acid. Sci. Rep. 2020, 10, 2946. [Google Scholar] [CrossRef]
  37. Cogal, G.C.; Cogal, S.; Machata, P.; Oksuz, A.U.; Omastová, M. Electrospun cobalt-doped 2D-MoSe2/polypyrrole hybrid-based carbon nanofibers as electrochemical sensing platforms. Microchimica. Acta 2024, 191, 75. [Google Scholar] [CrossRef]
  38. Yan, J.; Liu, S.; Zhang, Z.; He, G.; Zhou, P.; Liang, H.; Tian, L.; Zhou, X.; Jiang, H. Simultaneous electrochemical detection of ascorbic acid, dopamine and uric acid based on graphene anchored with Pd-Pt nanoparticles. Colloids Surf. B 2013, 111, 392–397. [Google Scholar] [CrossRef]
  39. Peng, C.; Yang, X.; Li, Y.; Yu, H.; Wang, H.; Peng, F. Hybrids of two-dimensional Ti3C2 and TiO2 exposing 001 facets toward enhanced photocatalytic activity. ACS Appl. Mater. Interfaces 2016, 8, 6051–6060. [Google Scholar] [CrossRef]
  40. Li, H.; Zhou, K.; Cao, J.; Wei, Q.; Lin, C.-T.; Pei, S.E.; Ma, L.; Hu, N.; Guo, Y.; Deng, Z.; et al. A novel modification to boron-doped diamond electrode for enhanced, selective detection of dopamine in human serum. Carbon 2021, 171, 16–28. [Google Scholar] [CrossRef]
  41. Blom, L.B.; Morrison, G.M.; Roux, M.S.; Mills, G.; Greenwood, R. Metal diffusion properties of a Nafion-coated porous membrane in an aquatic passive sampler system. J. Environ. Monit. 2003, 5, 404–409. [Google Scholar] [CrossRef]
  42. Tan, C.K.; Loh, K.P.; John, T.T. Direct amperometric detection of glucose on a multiple-branching carbon nanotube forest. Analyst 2008, 133, 448–451. [Google Scholar] [CrossRef]
  43. Zhang, M.; Gong, K.; Zhang, H.; Mao, L. Layer-by-layer assembled carbon nanotubes for selective determination of dopamine in the presence of ascorbic acid. Biosens. Bioelectron. 2005, 20, 1270–1276. [Google Scholar] [CrossRef]
  44. Lin, X.; Zhang, Y.; Chen, W.; Wu, P. Electrocatalytic oxidation and determination of dopamine in the presence of ascorbic acid and uric acid at a poly (p-nitrobenzenazo resorcinol) modified glassy carbon electrode. Sens. Actuators B Chem. 2007, 122, 309–314. [Google Scholar] [CrossRef]
  45. Alwarappan, S.; Liu, G.; Li, C.Z. Simultaneous detection of dopamine, ascorbic acid, and uric acid at electrochemically pretreated carbon nanotube biosensors. Nanomedicine 2010, 6, 52–57. [Google Scholar] [CrossRef]
  46. Dung, N.Q.; Toan, T.Q.; Chuyen, P.H.; Nang, L.V.; Dang, N.V.; Hien, T.N.; Anh, L.P.; Thanh, D.V. Straightforward method for the electrochemical identification of dopamine in the presence of uric acid and ascorbic acid. Meas. Sci. Technol. 2024, 35, 055114. [Google Scholar] [CrossRef]
  47. Zheng, X.; Zhou, X.; Ji, X.; Lin, R.; Lin, W. Simultaneous determination of ascorbic acid, dopamine and uric acid using poly(4-aminobutyric acid) modified glassy carbon electrode. Sens. Actuators B Chem. 2013, 178, 359–365. [Google Scholar] [CrossRef]
  48. Zhao, D.; Yu, G.; Tian, K.; Xu, C. A highly sensitive and stable electrochemical sensor for simultaneous detection towards ascorbic acid, dopamine, and uric acid based on the hierarchical nanoporous PtTi alloy. Biosens. Bioelectron. 2016, 82, 119–126. [Google Scholar] [CrossRef]
  49. Wang, C.; Yuan, R.; Chai, Y.; Zhang, Y.; Hu, F.; Zhang, M. Au-nanoclusters incorporated 3-amino-5-mercapto-1,2,4-triazole film modified electrode for the simultaneous determination of ascorbic acid, dopamine, uric acid and nitrite. Biosens. Bioelectron. 2011, 30, 315–319. [Google Scholar] [CrossRef]
  50. Hu, B.; Liu, Y.; Wang, Z.-W.; Song, Y.; Wang, M.; Zhang, Z.; Liu, C.-S. Bimetallic-organic framework derived porous Co3O4/Fe3O4/C-loaded g-C3N4 nanocomposites as non-enzymic electrocatalysis oxidization toward ascorbic acid, dopamine acid, and uric acid. Appl. Surf. Sci. 2018, 441, 694–707. [Google Scholar] [CrossRef]
  51. Qi, S.; Zhao, B.; Tang, H.; Jiang, X. Determination of ascorbic acid, dopamine, and uric acid by a novel electrochemical sensor based on pristine graphene. Electrochim. Acta 2015, 161, 395–402. [Google Scholar] [CrossRef]
  52. Zhang, L.; Yu, L.; Peng, J.; Hou, X.; Du, H. Highly sensitive and simultaneous detection of ascorbic acid, dopamine, and uric acid using Pt@g-C3N4/N-CNTs nanocomposites. iScience 2024, 27, 109241. [Google Scholar] [CrossRef]
  53. Patel, B.R.; Imran, S.; Ye, W.; Weng, H.; Noroozifar, M.; Kerman, K. Simultaneous voltammetric detection of six biomolecules using a nanocomposite of titanium dioxide nanorods with multi-walled carbon nanotubes. Electrochim. Acta 2020, 362, 137094. [Google Scholar] [CrossRef]
  54. Sun, L.; Li, H.; Li, M.; Li, P.; Li, C.; Yangb, B. Simultaneous determination of small biomolecules and nitrite using an Au/TiO2/Carbon nanotube composite-modified electrode. J. Electrochem. Soc. 2016, 163, 567–572. [Google Scholar] [CrossRef]
  55. Ding, L.; Wei, Y.; Li, L.; Zhang, T.; Wang, H.; Xue, J.; Ding, L.X.; Wang, S.; Caro, J.; Gogotsi, Y. MXene molecular sieving membranes for highly efficient gas separation. Nat. Commun. 2018, 9, 155. [Google Scholar] [CrossRef]
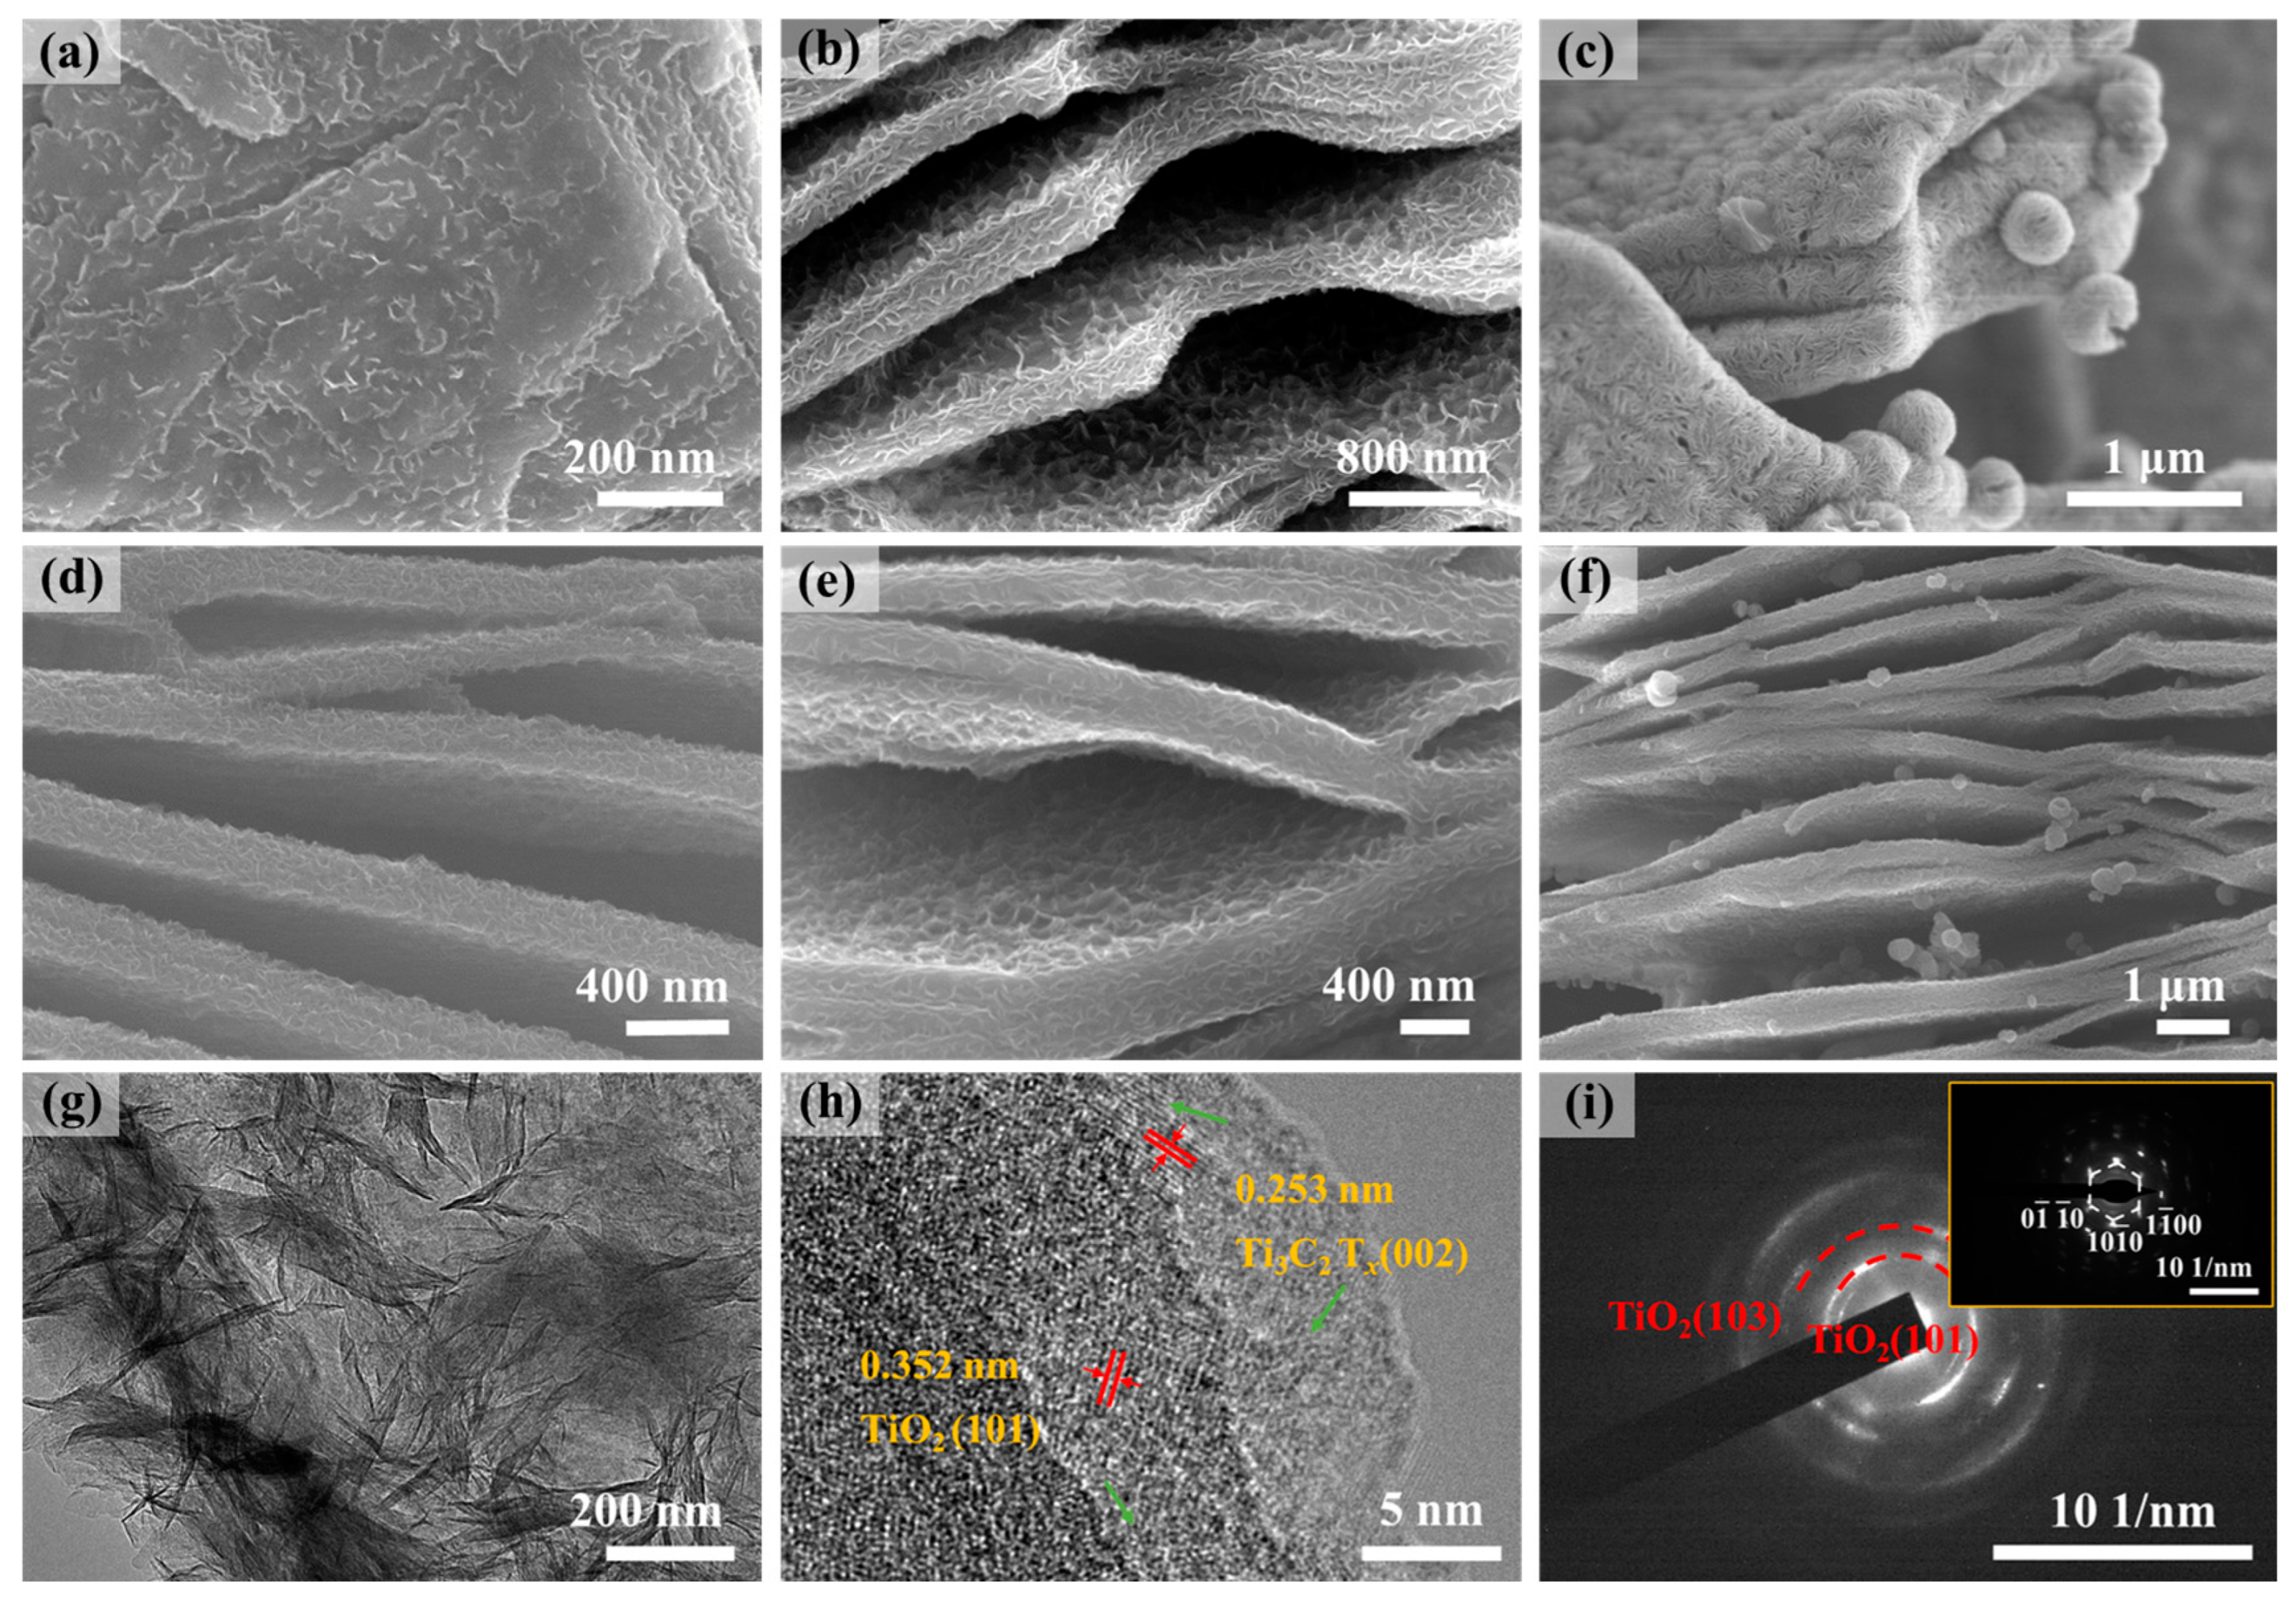
Figure 1. SEM images of Ti3C2Tx@TiO2 NSs(0.6): (a) Ti3C2Tx@TiO2 NSs(0.8), (b) Ti3C2Tx@TiO2 NSs(1.0), (c) SEM images of Ti3C2Tx@TiO2 NSs(0.6), (d) Ti3C2Tx@TiO2 NSs(0.8), (e) Ti3C2Tx@TiO2 NSs(1.0), (f) after annealed at 350 °C, (g) TEM image, (h) HR-TEM and (i) SAED image of Ti3C2Tx@TiO2 NSs(0.8).
Molecules 29 02915 g001
Figure 2. XPS spectra of the (a) survey, (bd) Ti 2p, C 1s and O 1s for the Ti3C2Tx@TiO2 NSs.
Molecules 29 02915 g002
Figure 3. Growth mechanism of TiO2 nanosheet on Ti3C2Tx surface.
Molecules 29 02915 g003
Figure 4. (a) CV curves and (b) EIS curve of Ti3C2Tx@TiO2 NSs/GCE, Ti3C2Tx/GCE and GCE; (c) CV curves of Ti3C2Tx@TiO2 NSs(0.8)/GCE with different scanning rates. The CV curves of Ti3C2Tx@TiO2 NSs/GCE, Ti3C2Tx/GCE and GCE are detected in (d) 100 μMAA, (e) 100 μM DA and (f) 100 μM UA solutions. In all the experiments, detection was in 0.1 M KCl solution with 0.5 mM K3[Fe (CN)6].
Molecules 29 02915 g004
Figure 5. CV curves recorded in (a) 100 μM AA, (b) 100 μM DA and (c) 100 μM UA, with increasing scan rates on Ti3C2Tx@TiO2 NSs/GCE. (df) The square root of the scan rates vs. peak current of AA/DA/UA. Error bars based on S/N = 3.
Molecules 29 02915 g005
Figure 6. DPV curves of (a) AA, (b) DA and (c) UA, separately detected on Ti3C2Tx@TiO2 NSs/GCE, and the corresponding oxidation concentration vs. peak current. (df). Error bars based on S/N = 3.
Molecules 29 02915 g006
Figure 7. DPV curves based on different concentrations when detecting (a) AA and DA and (d) DA and UA on Ti3C2Tx@TiO2 NSs/GCE in 0.1 M PBS (pH 7.4). (b,c) Calibration curves for the current vs. concentrations of AA and UA, (e,f) calibration curves for the current vs. concentrations of DA and UA. Error bars based on S/N = 3.
Molecules 29 02915 g007
Figure 8. (a) DPVs recorded for Ti3C2Tx@TiO2 NSs/GCE for different concentrations of AA (200–1000 μM), DA (40–300μM) and UA (50–400μM). (bd) Linear calibration curves for the oxidation peak currents vs. concentrations of AA, DA and UA. Error bars based on S/N = 3.
Molecules 29 02915 g008
Figure 9. Amperometric responses of the mixture upon addition of 10 μM (a) AA, (b) DA, (c) UA and 1000 μM other chemicals on Ti3C2Tx@TiO2 NSs/GCE; (d) DPV curves detected 5 consecutive times on Ti3C2Tx@TiO2 NSs/GCE for AA, DA and UA; (e) DPV curve change of Ti3C2Tx@TiO2 NSs/GCE containing 200 μM AA, 40 μM DA and 60 μM UA (5 days) in 0.1 M PBS; (f) peak current using five different Ti3C2Tx@TiO2 NSs/GCE electrodes at fixed concentrations of AA (200 μM), DA (40 μM) and UA (60 μM) in PBS. Error bars based on S/N = 3.
Molecules 29 02915 g009
Scheme 1. The synthesis process of Ti3C2Tx@TiO2 NSs.
Molecules 29 02915 sch001
Disclaimer/Publisher’s Note: The statements, opinions and data contained in all publications are solely those of the individual author(s) and contributor(s) and not of MDPI and/or the editor(s). MDPI and/or the editor(s) disclaim responsibility for any injury to people or property resulting from any ideas, methods, instructions or products referred to in the content.