Abstract
DFT and TD-DFT were used in this article to investigate the effects of different substitutions at multiple sites on the photophysical mechanism of bis-HBX in the gas phase. Four different substitution modes were selected, denoted as A1 (X=Me, Y=S), A2 (X=OMe, Y=S), B1 (X=Me, Y=NH), and C1 (X=Me, Y=O). The geometric parameters proved that the IHBs enhanced after photoexcitation, which was conducive to promote the ESIPT process. Combining the analysis of the PECs, it was revealed that the bis-HBX molecule underwent the ESIPT process, and the ease of the ESIPT process was in the order of A1 > A2> B1 > C1. In particular, the TICT process in A1 and B1 promoted the occurrence of the ESIPT process. In addition, the IC process was identified, particularly in C1. Meanwhile, the calculation of fluorescence lifetime and fluorescence rate further confirmed that A1 was the most effective fluorescent probe molecule. This theoretical research provides an innovative theoretical reference for regulating ESIPT reactions and optimizing fluorescent probe molecules.
1. Introduction
The excited-state intramolecular proton transfer (ESIPT) process is a photo-induced enol-keto tautomerization process [1,2,3] accompanied by strong intramolecular hydrogen bonds (IHBs) [4,5], which allows proton H from specific amino or hydroxyl atoms to transfer to carbonyl oxygen or azo nitrogen atoms after photoexcitation. As shown in Scheme 1, the integral ESIPT reaction is essentially a four-level photo-cycle process. Firstly, the enol form in the ground state is photoexcited to the Franck–Condon point of the S1 state, generating the enol* form simultaneously. Secondly, the enol* form undergoes the ESIPT process to produce a tautomer keto (keto*) form. Thirdly, the keto* form relaxes back to the ground-state keto structure via releasing the fluorescence or non-radiative transition. Eventually, the keto form is converted to the initial thermodynamically stable enol form achieved by the reverse proton transfer (RPT) process. Generally speaking, the ESIPT system tends to exhibit a large Stokes shift and dual fluorescence [6,7,8]. In the 1950s, Weller first observed the double fluorescence phenomenon during an experimental study on the dynamic characteristics of methyl salicylate and attributed it to the ESIPT reaction [9]. Since then, the mechanism of the ESIPT reaction has attracted the attention of extensive researchers, most of whom have studied it experimentally and theoretically [10,11,12,13].
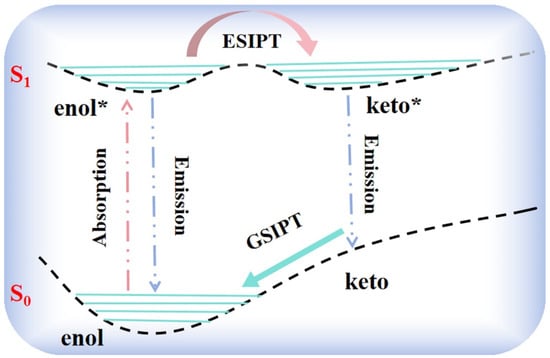
Scheme 1.
Schematic diagram of ESIPT reaction.
2-(2′-hydroxyphenyl) benzazole (HBX) derivatives with ESIPT properties are typically characterized by high yield and low synthesis complexity [14]. This distinctive nature makes them widely used in laser dyes [15], chemical sensors [16,17], molecular switches [18], light-emitting diode devices [19], and fluorescent probes for use in biological systems [20,21]. Previous reports have shown that modifying the molecular structure can effectively regulate the ESIPT process of HBX derivatives. In 2017, Manojai et al. [22] investigated the effect of heteroatom substitution (X=NH, O, and S) on the photophysical properties of HBX derivatives. They proved that NH substitution increased the probability of the ESIPT process in HBT, resulting in redshift emission fluorescence. In 2020, yang et al. [23] probed the effects of -NH2 group substitutions at different positions on the ESIPT mechanism. They revealed that the para-substitution of the -NH2 group promoted the occurrence of the ESIPT process. In 2022, Zhang et al. [24] designed four molecules (BPN, BPNS, BPS, and BPSN) to explore the effects of different electron groups on the ESIPT process in depth. They believed that introducing electron-withdrawing groups accelerates the ESIPT process, while the electron-donating groups do the opposite. It should not be ignored that in previous studies on HBX derivatives, researchers mainly focused on the effects of substitutions on the mono-HBX [22,23,24,25]. Recently, Lee et al. [26] designed and synthesized bis 2-(2′-hydroxyphenyl) benzazole (bis-HBX) fluorescent probe molecules based on two HBX moieties. The bis-HBX had extra proton-binding sites and was more effective for the detection of alkaline pH than mono-HBX [26,27]. However, the internal mechanism of the effects of different substitutions at multiple sites on the fluorescence properties of bis-HBX was still deficient, and the fluorescence probe molecules with the strongest luminous efficiency were screened, which merits further attention. Therefore, a thorough theoretical investigation was urgently needed to better understand the ESIPT process and the effects of different substitutions at multiple sites on the fluorescence properties of bis-HBX.
In this study, we simultaneously adjusted two key parameters, namely the extension group of central phenol (X: Me or OMe) and the properties of heteroatoms (Y: S, O, N) (as shown in Scheme 2). Using DFT and TD-DFT methods, the effects of different substitutions at multiple sites on the photophysical mechanism and the ESIPT process in bis-HBX were rationally researched. Our research not only provides a new idea and method for improving the efficiency of the ESIPT process but also has an important reference value for designing and optimizing fluorescent probe molecules with high fluorescence efficiency.
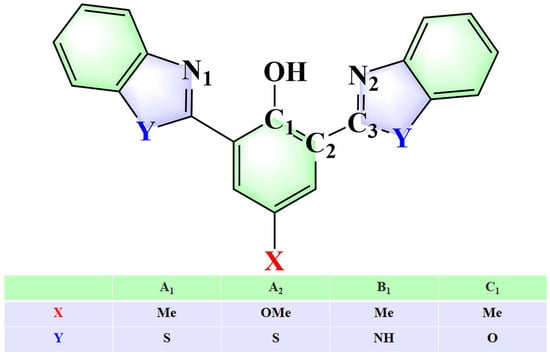
Scheme 2.
Chemical configuration diagram of bis-HBX.
2. Results and Discussion
2.1. Geometric Parameters of Bis-HBX
All the geometric configurations of different states of bis-HBX (see Figure 1 and Figure S1) were optimized completely by the B3LYP-D3/6-31G+(d,p) method without any restrictions on bond lengths or bond angles. In the excited state, we labeled the enol* structure as the S1 state and the keto* structure as the S1′ state. Some of the significant geometric parameters are displayed in Table 1, including bond lengths and bond angles.
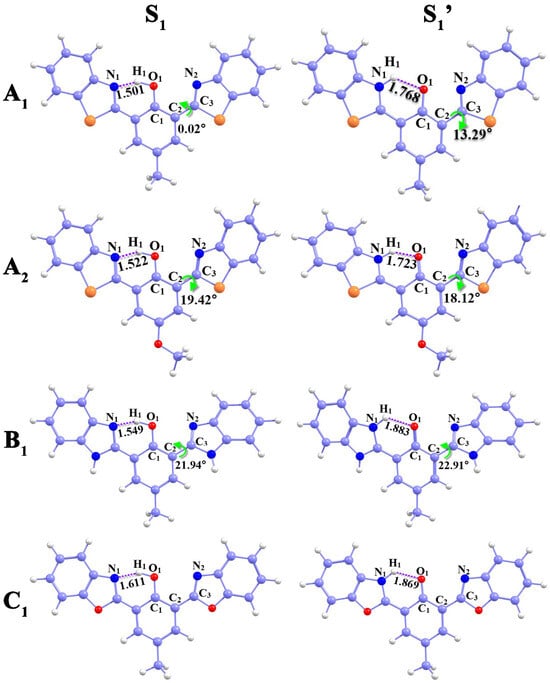
Figure 1.
Optimized geometry of bis-HBX in different states.

Table 1.
Calculated bond lengths (Å), bond angles (°), and dihedral angles (°) of bis-HBX in different states in the gas phase.
The intramolecular hydrogen bonding (IHB) parameters of bis-HBX from the S0 to the S1 state followed the similar varying tendency recorded in Table 1. We chose A1 as a representative for ease of expounding and fully discussing the changing trend in IHB intensity upon photoexcitation. The bond length (O1–H1) of the A1 molecule was elongated from 0.994 Å (S0) to 1.058 Å (S1), and N1-H1 was decreased from 1.720 Å (S0) to 1.501 Å (S1). Furthermore, the bond angle δ (O1-H1-N1) was increased from 147.14° to 153.08°. It has been validated that the IHB (O1-H1…N1) intensity is enhanced in the S1 state, which is conducive to the ESIPT process [28,29,30]. In addition, in the S1′ state, we obtained tautomer configuration, and a new IHB (N1-H1…O1) was formed with a bond length of 1.036 Å. The bis-HBX molecule underwent the ESIPT process, which was proved by the above-calculated results.
It is noteworthy that, in contrast to C1, the dihedral angle δ (C1–C2–C3–N2) of A1, A2, and B1 existed a torsion between the central benzene ring and the right five-membered ring. The δ (C1–C2–C3–N2) of A1, called the dihedral angle, enlarged from 47.02°(S0) to 13.29° (S1′), with a torsion of 60.31°. Similarly, both the A2 and B1 molecules underwent torsions of 28.16° and 24.69°, respectively. All the alterations indicated that A1, A2, and B1 underwent the ESIPT process with distortions in molecular configuration.
2.2. Infrared (IR) Vibrational Spectra
Due to the IR vibrational spectra providing direct evidence for the formation and fracture of hydrogen bonds (HBs) during the ESIPT process [31], we simulated the IR vibrational spectra of four probes in different electronic states.
From the simulated IR spectra (Figure 2), we found that the stretching vibration frequencies of O1-H1 in A1, A2, B1, and C1 were separately redshifted from 3244 cm−1, 3279 cm−1, 3193 cm−1, and 3322 cm−1 in the S0 state to 2148 cm−1, 2266 cm−1, 2359 cm−1, and 2654 cm−1 in the S1 state, accompanied with redshifts of 1096 cm−1, 1013 cm−1, 798 cm−1, and 668 cm−1, respectively. The above data indicated that the redshift value followed the order: A1 > A2 > B1 > C1, as we all know the weakening and strengthening of the IHB can be explained by the blue- and redshifts in the IR vibrational frequencies of the O-H bond [32,33,34], respectively, so we can infer that the ESIPT process was more prone to occur in A1. Meanwhile, in the S1′ state, a new vibrational peak was observed, corresponding to the stretching vibration frequency of N1–H1, which was located around 3225 cm−1 (A1), 3125 cm−1 (A2), 3425 cm−1 (B1), and 3374 cm−1 (C1). The above discussion confirmed that the four probe molecules underwent the ESIPT process after photoexcitation.
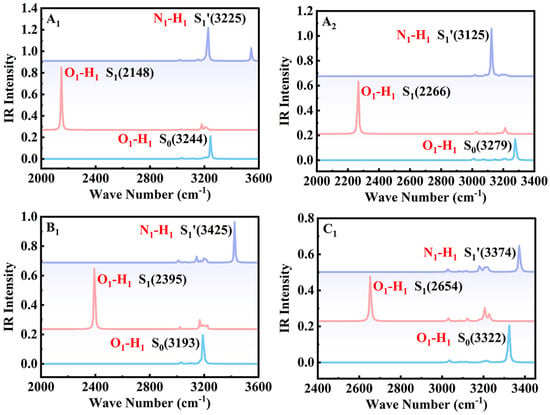
Figure 2.
Simulated IR spectra of O1–H1 and N1–H1 stretching vibration frequencies of bis-HBX in different electronic states in the gas phase.
2.3. RDG Scatter Plot and Topological Analyses
Considering that using the scatter plot of RDG versus Sign(I2)r can effectively reveal IHB interactions in real space [35], and Lu et al. recently proposed the IRI isosurface based on RDG versus Sign(I2)r, the expression of RDG function was as shown in Equation (1) [36,37]:
The obtained electron density matrix equation was Equation (2):
As clarified in Figures S2 and S3, the blue section of the color level corresponds to the HB effect, and the intensity of HB gradually increased with the deepening of the color. In addition, the spatial interactions and van der Waals forces were represented by the red and green areas, respectively. Through analyzing the RDG versus Sign(I2)r scatter plot, the relationship of IHB intensity in A1, A2, B1, and C1 was clear-cut and unambiguous. As shown in Figure 3, with the substitution modes of C1, B1, A2, and A1, the Sign(I2)r values became more and more negative, unveiling that the strength of IHB in different surroundings obeys the order of A1 > A2 > B1 > C1. In the S0 state, the prong peaks of A1, A2, B1, and C1 were located at −0.050, −0.049, −0.050, and −0.044, respectively. After photoexcitation, the prong peaks of A1, A2, B1, and C1 shifted to the more negative region (−0.087, −0.081, −0.075, and −0.063, respectively). The interaction type was judged to be an IHB interaction, corresponding to O1–H1…N1. The IHB intensity of the four compounds was enhanced after photoexcitation, as indicated by the above-mentioned data, which is conducive to the ESIPT process. Moreover, comparison of the left-shifted peak positions in the four compounds revealed that the strength of IHB followed the order of A1 > A2 > B1 > C1 in the S1 state. This was consistent with our previous analysis conclusion, revealing that different substitutions at multiple sites did affect the ESIPT process.
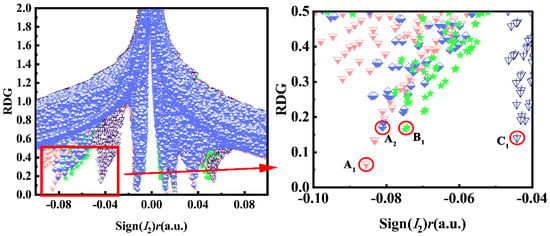
Figure 3.
Sign(I2)r scatter plots versus reduced density gradient (RDG) in bis-HBX in the S1 state.
Topological analysis, first proposed by Bader [38], is also one of the most common methods for measuring the strength of HBs [39]. The obvious bond paths and bond critical points (BCPs) [40] in the IHB region are captured in Figure S4, and we have listed the relevant parameters in Table 2. As is known to all, ρ(r) and ν(r) can gauge the intensity of IHBs with advantages, while the larger ρ(r) is and the more negative ν(r) is, the stronger IHB intensity will be. It could clearly be seen that the IHBs of the four molecules were all enhanced in the S1 state. Moreover, a horizontal comparison of the absolute values of EHB in bis-HBX showed that the EHB values followed the order of EHB(BCP2) > EHB(BCP4) > EHB(BCP6) > EHB(BCP8), indicating that the IHB intensity of A1 was the strongest of the four molecules in the S1 state. It is well known that the stronger the IHB intensity is, the more favorable the ESIPT process is. Therefore, through the analysis of the above methods, we believe that the stronger the IHBs interaction, the easier the ESIPT process.

Table 2.
Calculated BCP parameters of bis-HBX. a: density of all electrons; b: potential energy density; c: Laplacian of electron density; d: Lagrangian kinetic energy; e: energy density; f: hydrogen bond energy HB = V(r)/2.
2.4. Fluorescence Attribution and Mechanism Analysis
We performed electron–hole analysis on bis-HBX molecules in the S1 state, as shown in Figure 4. Furthermore, they were intuitively analyzed by utilizing the inter-fragment charge transfer (IFCT) method. During the emission process, from the right side to the central benzene ring direction, 0.776 electrons, 0.691 electrons, 0.675 electrons, and 0.188 electrons were transmitted, respectively. Moreover, the characteristics of hole and electron distribution indexes are included in Table 3. It was well known that for analogs, the lower the Sr index and the more positive the t index, the more complete the separation of electrons and holes. In the light of the t and Sr indexes, a significant separation of holes and electrons was implied through the S0→S1 transition in A1 and B1, which proved that A1 and B1 had significant ICT (intramolecular charge transfer) characteristics. Furthermore, combined with the configuration of bis-HBX, the dihedral angles δ (C1–C2–C3–N2) of A1 and B1 had abnormal twists of 47 degrees and 24.69 degrees, respectively, during photoexcitation. Perspicuously, it can be confirmed that the typical twisted intramolecular charge transfer (TICT) [41,42] process existed in A1 and B1. From the above analysis results, it can be seen that A1 and B1 first underwent the TICT process in the S1 state, and then underwent the ESIPT process. Thus, we know that the TICT process in A1 and B1 facilitated the ESIPT process.

Figure 4.
Hole–electron analysis in the S1′ state of bis-HBX (the blue isosurface represents the distribution of electrons, and the pink isosurface represents the distribution of holes).

Table 3.
Indexes illustrating the distribution of holes and electrons in bis-HBX. Sr: the extent of hole-and-electron overlap; t: the separation of electrons and holes.
In order to gain a deeper understanding of the effects of different substitutions at multiple sites on photophysical properties in bis-HBX, we simulated the absorption and fluorescence spectra of bis-HBX (see Figure 5), which were obtained based on the optimized S0, S1, and S1′ configurations. As shown in Table 4, the relevant photophysical parameters were recorded, and the absorption peak, oscillator strength, and corresponding orbital transition contributions were also included.
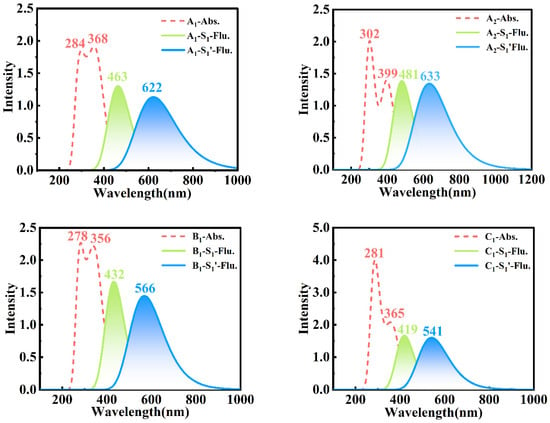
Figure 5.
Simulations of the absorption and fluorescence spectra of bis-HBX (in the gas phase) via the B3LYP-D3/6-31+G (d, p) method.

Table 4.
Calculated absorption peak (λ), oscillator intensity (ƒ), and orbital contribution (%) of bis-HBX in the gas phase.
The bis-HBX had double absorption peaks that could be distinctly observed from the data listed in Table S1, in which the calculated maximum absorption peak was very consistent with the experimental value, proving the feasibility of our method [26]. In addition, as shown in Figure 5, the short-wavelength emission peaks of A2, A1, B1, and C1 were 481 nm, 463 nm, 432 nm, and 419 nm, showing a blueshift from A2 to C1, respectively. The proton transfer tautomers in A2, A1, B1, and C1 corresponding to the longer wavelength fluorescence peaks were 633 nm, 622 nm, 566 nm, and 541 nm, respectively. Obviously, with the introduction of different substitution forms, the significant redshift was produced in the longer wavelength emission peaks of A2, A1, B1, and C1, and the degree of redshift followed the order of A1 > A2 > B1 > C1. However, only one short-wavelength fluorescence was observed in A1 in accord with the emission peak in the experiment; thus, we attributed it to the S1 (TICT) state.
Moreover, in order to study the fluorescence properties in bis-HBX more comprehensively, we used Equations (3) and (4) [36,37]:
We calculated the fluorescence lifetime and rate in the bis-HBX and listed them in Table 5. In the formula, represents the oscillator strength and delegates the wavenumber. It can be observed that A1 exhibited the greatest fluorescence lifetime, which may be due to its lower oscillation intensity. Similarly, a larger fluorescence lifetime resulted in a lower fluorescence rate, with A1 exhibiting the lowest fluorescence rate. All the above analyses indicated that A1 was the fluorescence probe molecule with the strongest luminous efficiently in bis-HBX, and we were also able to confirm that different substitutions at multiple sites did affect the spectral characteristics of bis-HBX.

Table 5.
Photophysical parameters of bis-HBX. represents fluorescence lifetime (ns); represents fluorescence rate (×10−8).
Finally, we conducted a detailed analysis of the excited-state decay process in bis-HBX. We have provided a diagrammatic sketch of the excitation and emission processes in bis-HBX (Figure 6) according to Table 4. Perspicuously, from the oscillator strength in Table 3, the excited states of A1, A2, and B1 were separated from each other. It was interesting that the excited states of S1 (0.4634) and S5 (0.4930) in C1 were coupled together and formed an intersection point where the internal conversion (IC) took place. The vertical transition S1→S0 that occurred at the Franck–Condon region of A1, A2, B1, and C1 was accompanied by shorter wavelength fluorescence measurements of 463 nm, 481 nm, 432 nm, and 419 nm, respectively. Subsequently, in the S1 state, from the higher vibration level to the lowest vibration level, a vibration relaxation process occurred in which A1, A2, B1, and C1 recovered from the tautomer structure to the S0 state, while at 622 nm, 633 nm, 566 nm, and 541 nm, respectively, they emitted long-wavelength fluorescence.
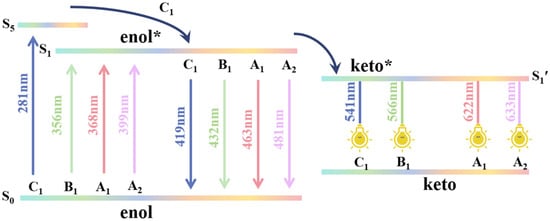
Figure 6.
Abridged sketch of the excitation process in bis-HBX.
2.5. Frontier Molecular Orbitals and NBO Population
It is particularly acknowledged that frontier molecular orbitals (FMOs) are an effective means to reflect charge distribution and recombination [43]. Since the first single transition of the target compound is mainly related to the highest occupied orbital (HOMO) and the lowest unoccupied orbital (LUMO), Figure 7 only renders these two orbitals. During the photoexcitation process, the electronic clouds on the O1 and N1 atoms were drastically reduced and increased, respectively. This result indicated that there was a strong binding ability between the N1 atom and the H1 proton, which provided the driving force for the ESIPT process. For the purpose of studying the changes in electron density distribution on O1 and N1 quantitatively, the NBO charge distributions of bis-HBX are recorded in Table 6. The negative charges on the O1 shrank from −0.693 a. u., −0.707 a. u., −0.693 a. u., and −0.696 a. u. in the ground state to −0.677 a. u., −0.685 a. u., −0.684 a. u., and −0.676 a. u. in the excited state, while that of the N1 atom was enlarged during the photo-absorption process, which was confirmed by the analytical results of the FMOs.
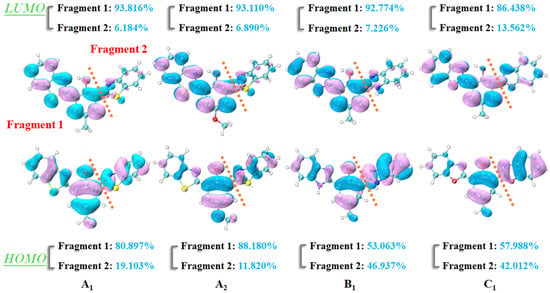
Figure 7.
Frontier molecular orbitals of bis-HBX in the gas phase.

Table 6.
NBO charge allotments (a. u.) of the O1 and N1 in bis-HBX in different states.
In addition, we used the Hirshfeld method to calculate the electron density components in Fragment 1 and Fragment 2 in bis-HBX (see Figure 7). In Fragment 1, the electron density components of A1, A2, and B1 increased from 80.897%, 88.180%, 53.063%, and 57.988% in HOMO to 93.816%, 93.110%, 92.774%, and 86.433% in LUMO, respectively. Regarding Fragment 2, the electron density components were 19.103%, 11.820%, 46.937%, and 42.012% in HOMO, while they separately decreased to 6.184%, 6.890%, 7.226%, and 13.562% in LUMO. Meanwhile, as mentioned in the geometric parameters, the obtained dihedral angles δ (C1–C2–C3–N2) of A1, A2, B1, and C1 underwent torsions of 47°, 28.16°, 24.69°, and 0°, respectively, which demonstrated that A1 has obvious TICT characteristics.
2.6. Potential Energy Curves (PECs)
With the aim of uncovering the mechanism of the ESIPT process with different substitutions at multiple sites more intuitively, the potential energy curves (PECs) in bis-HBX were scanned via prolonging the O1–H1 bond length from 0.9 Å to 1.9 Å in increments of 0.1 Å based on the optimized structures in the gas phase [44].
As shown in Figure 8, the PECs of the four probe molecules showed an ascending trend in the S0 state. This demonstrates that it was difficult for the proton transfer (PT) process to occur. After photoexcitation, the energy barriers in the four probe molecules were diminished to 0.24 kcal/mol (A1), 0.55 kcal/mol (A2), 0.67 kcal/mol (B1), and 1.15 kcal/mol (C1), respectively. It is obvious that it was more possible for the four probe molecules to undergo the PT process in the S1 state. It is a remarkable fact that the order of energy barriers in bis-HBX followed the order of A1 < A2 < B1 < C1, which verified that A1 can occur the ESIPT process more easily. Although the B3LYP/6-31+G (d,p) can provide qualitative descriptions of the hypersurface, it may underestimate some of the energy differences and energy barriers. We recalculated the PECs using Cam-B3LYP/TZVP [45,46] theory (see Figure 8; the blue font is the corrected energy barrier), taking the corrected results as the reference. It was very clear and concise that the energy barriers calculated using Cam-B3LYP/TZVP theory were consistent with the order of A1 < A2 < B1 < C1. In addition, to further confirm the ESIPT process mechanism, we also performed transition-state (TS) calculations and obtained the intrinsic reaction coordinate (IRC) to validate the reasonableness and accuracy. Meanwhile, we have listed the ESIPT barriers via the IRC paths for bis-HBX in Table 7, which is consistent with the simulation results of the PECs. We further confirmed that A1 can cause the ESIPT process to occur more easily. To date, we have explained the effects of different substitutions at multiple sites in the ESIPT process of bis-HBX molecules and reasonably elucidated the whole kinetic process of the studied molecules. This provides important reference values for the application of fluorescent probe molecules.
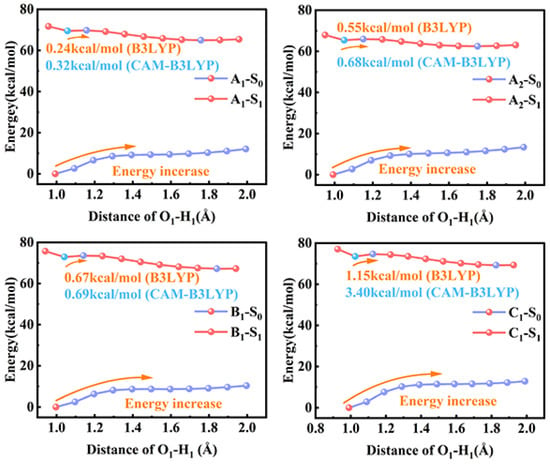
Figure 8.
The PECs of bis-HBX in different states.

Table 7.
Theoretical PT barriers (kcal/mol) calculated from the PECs (B3LYP and Cam-B3LYP) and from IRCs (S1 state) for bis-HBX.
3. Calculation Details
In the gas phase, the geometric structures of different electronic states of bis-HBX were fully optimized by DFT [46,47,48,49,50,51] and TD-DFT [52,53,54,55] based on B3LYP-D3/6-31+g (d, p) [47,48] levels. We chose six different functionals to calculate the absorption spectra of bis-HBX, and the results are listed in Table 8. The calculated values of B3LYP-D3 (295 nm and 368 nm) were compatible with the experiment values (290 nm and 363 nm) [26]. Therefore, it was reasonable to use the B3LYP-D3 functional to evaluate the excited-state properties of the system. Based on the optimized geometric configurations, we calculated the infrared (IR) [56] vibration spectra and confirmed that all the local minima had no virtual frequency. For the purpose of probing into the study of the ESIPT mechanism in bis-HBX, the PECs (potential energy curves) of bis-HBX were scanned by setting O1-H1 from 0.9 Å to 1.9 Å in steps of 0.1 Å. The transition-state (TS) structure was located by the Berny algorithm to obtain a more accurate barrier height [57]. In addition, the RDG scatter plot [35], electron–hole, and frontier molecular orbitals (FMOs) [58,59] were analyzed by using the Multiwfn program and visualized by the VMD 1.9.4 software [60,61]. All calculation details of the system were carried out by the Gaussian program [62].

Table 8.
Using six functionals, we calculated absorption peaks (nm) in bis-HBX. (Exp. was the experimental value.)
4. Conclusions
In summary, the DFT/TDDFT theoretical method was used to systematically investigate the effects of different substitutions at multiple sites on the photophysical properties of bis-HBX. Relying on the results of IR vibration spectra, RDG scatter plots, and topological structure, it was demonstrated that the IHBs of bis-HBX were enhanced in the S1 state and underwent the ESIPT process in the S1′ state. Significantly, upon analyzing the energy barrier height of bis-HBX, we noticed that the ease of the ESIPT process followed the order of A1 > A2 > B1 > C1. Furthermore, combining molecular configuration and electron–hole analysis, it was demonstrated that A1 and B1 underwent severe twisting (TICT state), which promoted the ESIPT process. Meanwhile, the internal conversion process was verified in C1. Finally, it was verified that A1 is the most suitable fluorescence probe molecule for detecting alkaline pH values when combined with the calculated fluorescence lifetime and fluorescence rate. Herein, the above research not only proposed the photophysical mechanism of bis-HBX, but also provided the effects of different substitutions at multiple sites on the ESIPT process in bis-HBX. Our work has provided strong support for the experiment, and in the meantime, we are sincerely anxious for this work to shed some light on regulating the photophysical behaviors and ESIPT reactions of developing and designing fluorescence probe molecules at the theoretical level.
Supplementary Materials
The following supporting information can be downloaded at: https://www.mdpi.com/article/10.3390/molecules29112692/s1, Figure S1: Optimized geometry of bis-HBX in ground state; Table S1: Experimental and theoretical values of absorption and fluorescence peaks of bis-HBX; Figure S2: Sign(I2)r scatter plots versus reduced density gradient (RDG) in A1 and A2 in the different states; Figure S3: Sign(I2)r scatter plots versus reduced density gradient (RDG) in B1 and C1 in the different states; Figure S4: Topological diagrams of bis-HBX. Ground state optimized Cartesian coordinates.
Author Contributions
M.Y.: writing—original draft preparation, data curation, conceptualization, writing—review and editing. H.M.: writing—review and editing, software. J.G.: software. Q.Z.: validation. X.W.: methodology. X.G.: investigation. H.L.: funding acquisition, supervision, writing—review and editing. B.L.: supervision. All authors have read and agreed to the published version of the manuscript.
Funding
This work was supported financially by the Science and Technology Department of Jilin Province (YDZJ202301ZYTS386).
Institutional Review Board Statement
Not applicable.
Informed Consent Statement
Not applicable.
Data Availability Statement
The original contributions presented in the study are included in the article and Supplementary Material.
Conflicts of Interest
The authors declare no conflict of interest.
References
- Yang, X.; Yang, Z.; Li, H.; Yang, X.; Zhang, Y. Effect of Pyridyl Position on Constructing Acid-Base Dual-Responsive Fluorophores with ESIPT and AIE Characteristics. Dyes Pigment. 2023, 214, 111215. [Google Scholar] [CrossRef]
- Stoerkler, T.; Laurent, A.D.; Ulrich, G.; Jacquemin, D.; Massue, J. Influence of Ethynyl Extension on the Dual-State Emission Properties of Pyridinium-Substituted ESIPT Fluorophores. Dyes Pigment. 2023, 208, 110872. [Google Scholar] [CrossRef]
- Pan, Q.; Jia, D.; Zhang, Y.; Ding, Y. A Butterfly-Shaped ESIPT Dye for Pattern Recognition of Metal Ions. Dyes Pigment. 2023, 218, 111506. [Google Scholar] [CrossRef]
- Zahid Nasim, S.; Sarfaraz, S.; Jan, F.; Yar, M.; Ur Rehaman, A. Computational Insights of Excited State Intramolecular Proton Transfer (ESIPT) Based Fluorescent Detection and Imaging of γ-Glutam-ytranspeptidase Activity. Spectrochim. Acta A Mol. Biomol. Spectrosc. 2023, 299, 122814. [Google Scholar] [CrossRef]
- Pang, H.; Lilla, E.A.; Zhang, P.; Zhang, D.; Shields, T.P.; Scott, L.G.; Yang, W.; Yokoyama, K. Mechanism of Rate Acceleration of Radical C-C Bond Formation Reaction by a Radical SAM GTP 3′,8-Cyclase. J. Am. Chem. Soc. 2020, 142, 9314–9326. [Google Scholar] [CrossRef]
- Mu, H.; Sun, Y.; Gao, J.; Xin, C.; Zhao, H.; Jin, G.; Li, H. Switching the ESIPT and TICT Process of DP-HPPI via Intermolecular Hydrogen Bonding. J. Mol. Struct. 2023, 1277, 134800. [Google Scholar] [CrossRef]
- Li, H.; Mu, H.; Xin, C.; Cai, J.; Yuan, B.; Jin, G. Turning ON/OFF the Fluorescence of the ESIPT State by Changing the Hydrogen Bond Distance and Orientation in Quinoline-Pyrazole Derivatives. J. Mol. Struct. 2022, 1252, 132146. [Google Scholar] [CrossRef]
- Gao, J.; Mu, H.; Zhen, Q.; Guan, X.; Li, H. Accelerating the Concerted Double Proton Transfer Process of 2,2′-Bipyridine-3,3′-Diol-5,5′-Dicarboxylate Acid Ethyl Ester (BPDC) Molecule by Centrosymmetric Dual Intermolecular Hydrogen Bonds. J. Mol. Struct. 2023, 1294, 136406. [Google Scholar] [CrossRef]
- Pariat, T.; Munch, M.; Durko-Maciag, M.; Mysliwiec, J.; Retailleau, P.; Vérité, P.M.; Jacquemin, D.; Massue, J.; Ulrich, G. Impact of Heteroatom Substitution on Dual-State Emissive Rigidified 2-(2′-hydroxyphenyl)Ben-zazole Dyes: Towards Ultra-Bright ESIPT Fluoro-phores. Chem.-Eur. J. 2021, 27, 3483–3495. [Google Scholar] [CrossRef] [PubMed]
- Ren, A.; Yao, W.; Zhu, D. A Mitochondrion-Targeted Fluorescent Probe Based on ESIPT Phthalimide for the Detection of Hg 2+ with Large Stokes Shift. Analyst 2023, 148, 5882–5888. [Google Scholar] [CrossRef] [PubMed]
- Naskar, R.; Gharami, S.; Mandal, S.; Mondal, T.K. A New Chromone-Based Fluorescent Probe for Ratiometric Detection of Pd2+. New J. Chem. 2022, 46, 17912–17917. [Google Scholar] [CrossRef]
- Imran, K.; Pandey, D.; Kaur, J.; Naqvi, S.; Sharma, A. An ESIPT Solvatochromic Fluorescent and Colorimetric Probe for Sensitive and Selective Detection of Copper Ions in Environmental Samples and Cell Lines. Analyst 2023, 148, 4513–4524. [Google Scholar] [CrossRef]
- Zhou, Q.; Wang, H.; Song, P. Theoretical Study of the Direction of the Excited-State Intramolecular Proton Transfer of the HBS Molecule. New J. Chem. 2023, 47, 16059–16065. [Google Scholar] [CrossRef]
- Li, Y.; Dahal, D.; Abeywickrama, C.S.; Pang, Y. Progress in Tuning Emission of the Excited-State Intramolecular Proton Transfer (ESIPT)-Based Fluorescent Probes. ACS Omega 2021, 6, 6547–6553. [Google Scholar] [CrossRef]
- Chipem, F.A.S.; Krishnamoorthy, G. Temperature Effect on Dual Fluorescence of 2-(2′-Hydroxyphenyl)Benzimidazole and Its Nitrogen Substituted Analogues. J. Phys. Chem. B 2013, 117, 14079–14088. [Google Scholar] [CrossRef]
- Cheng, J.; Liu, D.; Li, W.; Bao, L.; Han, K. Comprehensive Studies on Excited-State Proton Transfer of a Series of 2-(2′-Hydroxyphenyl)Benzo-thiazole Derivatives: Synthesis, Optical Properties, and Theoretical Calculations. J. Phys. Chem. C 2015, 119, 4242–4251. [Google Scholar] [CrossRef]
- Li, C.; Yang, Y.; Ma, C.; Liu, Y. Effect of Amino Group on the Excited-State Intramolecular Proton Transfer (ESIPT) Mechanisms of 2-(2′-Hydroxyphenyl)Benzoxazole and Its Amino Derivatives. RSC Adv. 2016, 6, 5134–5140. [Google Scholar] [CrossRef]
- Abou-Zied, O.K. Spectroscopy of Hydroxyphenyl Benzazoles in Solution and Human Serum Albumin: Detecting Flexibility, Specificity and High Affinity of the Warfarin Drug Binding Site. RSC Adv. 2013, 3, 8747. [Google Scholar] [CrossRef]
- Alarcos, N.; Gutiérrez, M.; Liras, M.; Sánchez, F.; Moreno, M.; Douhal, A. Direct Observation of Breaking of the Intramolecular H-Bond, and Slowing down of the Proton Motion and Tuning Its Mechanism in an HBO Derivative. Phys. Chem. Chem. Phys. 2015, 17, 14569–14581. [Google Scholar] [CrossRef]
- Chipem, F.A.S.; Dash, N.; Krishnamoorthy, G. Role of Nitrogen Substitution in Phenyl Ring on Excited State Intramolecular Proton Transfer and Rotamerism of 2-(2′-Hydroxyphenyl)Benzimidazole: A Theoretical Study. J. Chem. Phys. 2011, 134, 104308. [Google Scholar] [CrossRef]
- Weigend, F. Accurate Coulomb-Fitting Basis Sets for H to Rn. Phys. Chem. Chem. Phys. 2006, 8, 1057. [Google Scholar] [CrossRef]
- Manojai, N.; Daengngern, R.; Kerdpol, K.; Ngaojampa, C.; Kungwan, N. Heteroatom Effect on Photophysical Properties of 2-(2′-Hydroxy-phenyl)Benzimidazole and Its Derivatives as Fluorescent Dyes: A TD-DFT Study. J. Lumin. 2017, 188, 275–282. [Google Scholar] [CrossRef]
- Yang, Y. The Effects of Amino Group Meta- and Para-Substitution on ESIPT Mechanisms of Amino 2-(2′-Hydroxyphenyl) Benzazole Derivatives. J. Lumin. 2020, 218, 116836. [Google Scholar] [CrossRef]
- Zhang, Y.; Shang, C.; Cao, Y.; Ma, M.; Sun, C. Insights into the Photophysical Properties of 2-(2′-Hydroxyphenyl) Benzazoles Derivatives: Application of ESIPT Mechanism on UV Absorbers. Spectrochim. Acta A Mol. Biomol. Spectrosc. 2022, 280, 121559. [Google Scholar] [CrossRef]
- Zhao, J.; Chen, J.; Liu, J.; Hoffmann, M.R. Competitive Excited-State Single or Double Proton Transfer Mechanisms for Bis-2,5-(2-Benzoxazolyl)-Hydroquinone and Its Derivatives. Phys. Chem. Chem. Phys. 2015, 17, 11990–11999. [Google Scholar] [CrossRef]
- Lee, H.; Lee, S.; Han, M.S. Turn-On Fluorescent pH Probes for Monitoring Alkaline pHs Using Bis[2-(2′-Hydroxyphenyl)Benzazole] Derivatives. Sensors 2023, 23, 2044. [Google Scholar] [CrossRef]
- Goswami, S.; Das, S.; Aich, K.; Pakhira, B.; Panja, S.; Mukherjee, S.K.; Sarkar, S. A Chemodosimeter for the Ratiometric Detection of Hydrazine Based on Return of ESIPT and Its Application in Live-Cell Imaging. Org. Lett. 2013, 15, 5412–5415. [Google Scholar] [CrossRef]
- Liu, Z.-Y.; Hu, J.-W.; Chen, C.-L.; Chen, Y.-A.; Chen, K.-Y.; Chou, P.-T. Correlation among Hydrogen Bond, Excited-State Intramolecular Proton-Transfer Kinetics and Thermodynamics for -OH Type Proton-Donor Molecules. J. Phys. Chem. C 2018, 122, 21833–21840. [Google Scholar] [CrossRef]
- Zhang, H.; Li, Z.; Liu, J.; Wang, Y. Effect of Intermolecular Hydrogen Bonds on the Proton Transfer and Fluorescence Characteristics of 1′-Hydroxy-2′-Acetonaphthone. J. Mol. Liq. 2022, 361, 119555. [Google Scholar] [CrossRef]
- Wang, J.; Liu, Q.; Yang, D. Theoretical Insights into Excited-State Hydrogen Bonding Effects and Intramolecular Proton Transfer (ESIPT) Mechanism for BTS System. Sci. Rep. 2020, 10, 5119. [Google Scholar] [CrossRef]
- Santos, G.C.; Rocha, I.O.; Stefanello, F.S.; Copetti, J.P.P.; Tisoco, I.; Martins, M.A.P.; Zanatta, N.; Frizzo, C.P.; Iglesias, B.A.; Bonacorso, H.G. Investigating ESIPT and Donor-Acceptor Substituent Effects on the Photophysical and Electrochemical Properties of Fluorescent 3,5-Diaryl-Substituted 1-Phenyl-2-Pyrazolines. Spectrochim. Acta A Mol. Biomol. Spectrosc. 2022, 269, 120768. [Google Scholar] [CrossRef]
- Zhao, G.; Han, K. Time-dependent Density Functional Theory Study on Hydrogen-bonded Intramolecular Charge-transfer Excited State of 4-dimethylamino-benzonitrile in Methanol. J. Comput. Chem. 2008, 29, 2010–2017. [Google Scholar] [CrossRef]
- Zhao, G.-J.; Han, K.-L. Hydrogen Bonding in the Electronic Excited State. Acc. Chem. Res. 2012, 45, 404–413. [Google Scholar] [CrossRef]
- Zhang, M.; Guo, Y.; Feng, X.; Yu, X.; Jin, X.; Qiu, L.; Zhao, G. Theoretical Modeling of the Hydrated Serotonin in Solution: Insight into Intermolecular Hydrogen Bonding Dynamics and Spectral Shift in the Electronic Excited States. J. Mol. Liq. 2019, 288, 111093. [Google Scholar] [CrossRef]
- Contreras-Garcia, J.; Johnson, E.R.; Keinan, S.; Chaudret, R.; Piquemal, J.P.; Beratan, D.N.; Yang, W. NCIPLOT: A program for plotting non-covalent interaction regions. J. Chem. Theory Comput. 2011, 7, 625. [Google Scholar] [CrossRef]
- Ren, P.; Sun, C.; Shi, Y.; Song, P.; Yang, Y.; Li, Y. Global performance evaluation of solar cells using two models: From charge-transfer and recombination mechanisms to photoelectric properties. J. Mater. Chem. C 2019, 7, 1934–1947. [Google Scholar] [CrossRef]
- Dai, Y.; Zhang, M.; Zhang, M.; Sun, L.; Meng, J.; Song, P. Intramolecular Hydrogen Bonding Promoted Excited State Double Proton Transfer Mechanism Based on a Typical Molecule: Porphycene. Spectrochim. Acta A Mol. Biomol. Spectrosc. 2018, 200, 345–350. [Google Scholar] [CrossRef]
- Bader, R.F.W. A Quantum Theory of Molecular Structure and Its Applications. Chem. Rev. 1991, 91, 893–928. [Google Scholar] [CrossRef]
- Emamian, S.; Lu, T.; Kruse, H.; Emamian, H. Exploring Nature and Predicting Strength of Hydrogen Bonds: A Correlation Analysis Between Atoms-in-Molecules Descriptors, Binding Energies, and Energy Components of Symmetry-Adapted Perturbation Theory. J. Comput. Chem. 2019, 40, 2868–2881. [Google Scholar] [CrossRef]
- Luo, X.; Yang, Y.; Li, Y. Theoretical Insights into ESIPT Mechanism of the Two Protons System BH-BA in Dichloromethane Solution. J. Mol. Liq. 2020, 319, 114145. [Google Scholar] [CrossRef]
- Chen, C.; Fang, C. Fluorescence Modulation by Amines: Mechanistic Insights into Twisted Intramolecular Charge Transfer (TICT) and Beyond. Chemosensors 2023, 11, 87. [Google Scholar] [CrossRef]
- Fan, Y.; Wang, F.; Hou, F.; Wei, L.; Zhu, G.; Zhao, D.; Hu, Q.; Lei, T.; Yang, L.; Wang, P.; et al. A Novel TICT-Based near-Infrared Fluorescent Probe for Light-up Sensing and Imaging of Human Serum Albumin in Real Samples. Chin. Chem. Lett. 2023, 34, 107557. [Google Scholar] [CrossRef]
- Miertuš, S.; Scrocco, E.; Tomasi, J. Electrostatic interaction of a solute with a continuum: A direct utilizaion of AB initio molecular potentials for the prevision of solvent effects. Chem. Phys. 1981, 55, 117–129. [Google Scholar] [CrossRef]
- Zhang, Q.; Yang, Y.; Liu, Y. Theoretical Insights into Luminescence Mechanism of Naphthyridine-Based Thermally Activated Delayed Fluorescence Emitter with Aggregation-Induced Emission. Chem. Phys. Lett. 2023, 817, 140407. [Google Scholar] [CrossRef]
- Feller, D. The role of databases in support computational chemistry calculations. J. Comput. Chem. 1996, 17, 1571–1586. [Google Scholar] [CrossRef]
- Becke, A. Density-functional thermochemistry. III. The role of exact exchange. J. Chem. Phys. 1993, 98, 5648–5652. [Google Scholar] [CrossRef]
- Grimme, S.; Ehrlich, S.; Goerigk, L. Effect of the Damping Function in Dispersion Corrected Density Functional Theory. J. Comput. Chem. 2011, 32, 1456–1465. [Google Scholar] [CrossRef]
- Lin, Y.D.; Ke, B.Y.; Chang, Y.J.; Chou, P.T.; Liau, K.L.; Liu, C.Y.; Chow, T.J. Pyridomethene-BF2 complex/phenothiazine hybrid sensitizer with high molar extinction coefficient for efficient, sensitized solar cells. J. Mater. Chem. A 2015, 3, 16831–16842. [Google Scholar] [CrossRef]
- Wang, D.; Zhou, Q.; Wei, Q.; Song, P. Effects of π-Conjugation-Substitution on ESIPT Process for Oxazoline-Substituted Hydroxy-fluorenes. Chin. Phys. B 2023, 32, 028201. [Google Scholar] [CrossRef]
- Lin, S.; Peng, D.; Yang, W.; Gu, F.L.; Lan, Z. Theoretical Studies on Triplet-State Driven Dissociation of Formaldehyde by Quasi-Classical Molecular Dynamics Simulation on Machine-Learning Potential Energy Surface. J. Chem. Phys. 2021, 155, 214105. [Google Scholar] [CrossRef]
- Cohen, A.J.; Mori-Sánchez, P.; Yang, W. Insights into Current Limitations of Density Functional Theory. Science 2008, 321, 792–794. [Google Scholar] [CrossRef]
- Zhang, P.; Yang, W. Toward a General Neural Network Force Field for Protein Simulations: Refining the Intramolecular Interaction in Protein. J. Chem. Phys. 2023, 159, 024118. [Google Scholar] [CrossRef]
- Yang, Y.; Zhao, J.; Li, Y. Theoretical Study of the ESIPT Process for a New Natural Product Quercetin. Sci. Rep. 2016, 6, 32152. [Google Scholar] [CrossRef]
- Ding, Z.; Ji, S.; Zhao, J.; Zheng, D. Combination of Theoretical Calculation and Experiment to Study the Excited State Proton Transfer Behavior of Trifluoroacetamidoanthraquinone with Different Substitution Positions. J. Mol. Struct. 2022, 1252, 132084. [Google Scholar] [CrossRef]
- Li, Q.; Wan, Y.; Zhou, Q.; Li, Y.; Li, B.; Zhu, L.; Wan, Y.; Yin, H.; Shi, Y. Exploring the Effect of Nitrile Substituent Position on Fluorescence Quantum Yield of ESIPT-Based Oxazoline Derivatives: A TDDFT Investigation. Spectrochim. Acta A Mol. Biomol. Spectrosc. 2022, 272, 120953. [Google Scholar] [CrossRef]
- Alecu, I.M.; Zheng, J.; Zhao, Y.; Truhlar, D.G. Computational Thermochemistry: Scale Factor Databases and Scale Factors for Vibrational Frequencies Obtained from Electronic Model Chemistries. J. Chem. Theory. Comput. 2010, 6, 2872–2887. [Google Scholar] [CrossRef]
- Schlegel, H.B. Optimization of equilibrium geometries and transition structures. J. Comput. Chem. 1982, 3, 214–218. [Google Scholar] [CrossRef]
- Fukui, K.; Yonezawa, T.; Shingu, H. A Molecular Orbital Theory of Reactivity in Aromatic Hydrocarbons. J. Chem. Phys. 1952, 20, 722–725. [Google Scholar] [CrossRef]
- Fukui, K.; Yonezawa, T.; Nagata, C.; Shingu, H. Molecular Orbital Theory of Orientation in Aromatic, Heteroaromatic, and Other Conjugated Molecules. J. Chem. Phys. 1954, 22, 1433–1442. [Google Scholar] [CrossRef]
- Lu, T.; Chen, F. Multiwfn: A multifunctional wavefunction analyzer. J. Comput. Chem. 2012, 33, 580. [Google Scholar] [CrossRef]
- Humphrey, W.; Dalke, A.; Schulten, K. VMD: Visual molecular dynamics. J. Mol. Graph. 1996, 14, 27–38. [Google Scholar] [CrossRef]
- Frisch, M.J.; Trucks, G.W.; Schlegel, H.B.; Scuseria, G.E.; Robb, M.A.; Cheeseman, J.R.; Scalmani, G.; Barone, V.; Petersson, G.A.; Nakatsuji, H.; et al. Gaussian 16; Gaussian, Inc.: Wallingford, CT, USA, 2016. [Google Scholar]
- Miehlich, B.; Savin, A.; Stoll, H.; Preuss, H. Results obtained with the correlation energy density functionals of becke and Lee, Yang and Parr. Chem. Phys. Lett. 1989, 157, 200–206. [Google Scholar] [CrossRef]
- Yanai, T.; Tew, D.P.; Handy, N.C. A new hybrid exchange–correlation functional using the Coulomb-attenuating method (Cam-B3LYP). Chem. Phys. Lett. 2004, 393, 51–57. [Google Scholar] [CrossRef]
- Freeman, F. Mechanism of the cysteine sulfenic acid O-sulfenylation of 1,3-cyclohexanedione. Chem. Commun. 2014, 50, 4102–4104. [Google Scholar] [CrossRef]
- Park, K.; Son, H.-J.; Choe, J.-I. mPW1PW91 study for conformational isomers of methylene bridge-monosubstituted tetramethoxycalix[4]arenes. J. Ind. Eng. Chem. 2014, 20, 3276–3282. [Google Scholar] [CrossRef]
Disclaimer/Publisher’s Note: The statements, opinions and data contained in all publications are solely those of the individual author(s) and contributor(s) and not of MDPI and/or the editor(s). MDPI and/or the editor(s) disclaim responsibility for any injury to people or property resulting from any ideas, methods, instructions or products referred to in the content. |
© 2024 by the authors. Licensee MDPI, Basel, Switzerland. This article is an open access article distributed under the terms and conditions of the Creative Commons Attribution (CC BY) license (https://creativecommons.org/licenses/by/4.0/).