Article

Quality Evaluation of Lonicerae Flos Produced in Southwest China Based on HPLC Analysis and Antioxidant Activity

1
Chongqing Academy of Chinese Materia Medica, Chongqing 400065, China
2
Chongqing Institute for Food and Drug Control, Chongqing 401121, China
3
Research Centre of Natural Resources of Chinese Medicinal Materials and Ethnic Medicine, Jiangxi University of Chinese Medicine, Nanchang 330004, China
*
Author to whom correspondence should be addressed.
Molecules 2024, 29(11), 2560; https://doi.org/10.3390/molecules29112560
Submission received: 22 April 2024 / Revised: 17 May 2024 / Accepted: 23 May 2024 / Published: 29 May 2024
(This article belongs to the Collection Herbal Medicine Research)

Abstract

:
Lonicera macranthoides, the main source of traditional Chinese medicine Lonicerae Flos, is extensively cultivated in Southwest China. However, the quality of L. macranthoides produced in this region significantly varies due to its wide distribution and various cultivation breeds. Herein, 50 Lonicerae Flos samples derived from different breeds of L. macranthoides cultivated in Southwest China were collected for quality evaluation. Six organic acids and three saponin compounds were quantitatively analyzed using HPLC. Furthermore, the antioxidant activity of a portion of samples was conducted with 2,2′-Azinobis-(3-ethylbenzthiazoline-6-sulphonate) (ABTS) and 1,1-diphenyl-2-picryl-hydrazyl (DPPH) radical scavenging experiments. According to the quantitative results, all samples met the quality standards outlined in the Chinese Pharmacopoeia. The samples from Guizhou, whether derived from unopened or open wild-type breeds, exhibited high quality, while the wild-type samples showed relatively significant fluctuation in quality. The samples from Chongqing and Hunan demonstrated similar quality, whereas those from Sichuan exhibited relatively lower quality. These samples demonstrated significant abilities in clearing ABTS and DPPH radicals. The relationship between HPLC chromatograms and antioxidant activity, as elucidated by multivariate analysis, indicated that chlorogenic acid, isochlorogenic acid A, isochlorogenic acid B, and isochlorogenic acid C are active components and can serve as Q-markers for quality evaluation.

Graphical Abstract

1. Introduction

Lonicerae Flos, or “shanyinhua” in Chinese, has a long history of use in traditional Chinese medicine for treating fever and respiratory infections [1]. In addition, Lonicerae Flos exhibits diverse pharmacological properties, including anti-inflammatory, antimicrobial, antiviral, and anticancer effects [2,3,4]. Recently, it has been mainly used to prevent and treat respiratory syndromes and viral infections, such as HINI influenza, hand-foot- and-mouth disease, and COVID-19 [5]. According to the Chinese Pharmacopoeia, Lonicerae Flos refers to the dried flower and flower bud of Lonicera macranthoides Hand.-Mazz., L. hypoglauca Maq., L. confusa DC., or L. fulvotomentosa Hsu et S. C. Cheng containing no less than 2.0% chlorogenic acid (CGA) and 5.0% of the total contents of macranthoidin B (MB) and dipsacoside B (DB) [6]. Among these botanical sources, L. macranthoides has emerged as the main source of Lonicerae Flos in the current market owing to its extensive distribution and cultivation in southern China [7].
The genus Lonicera (Caprifoliaceae) comprises approximately 180 species distributed throughout the Northern Hemisphere. Multiple compounds belonging to the flavonoid, terpenoid, and iridoid groups were detected in Lonicera species; however, most of the species showed high diversity in genetics and chemical compositions [8,9]. Lonicerae Flos, derived from L. macranthoides, is rich in phenolic acids, flavonoids, saponins, and essential oils. Its medicinal properties primarily stem from phenolic acids and saponins [10]. CGAs, the main phenolic acids in L. macranthoides, are ester compounds composed of various trans-cinnamic acids [11]. Various CGAs have been identified in several plant species, particularly edible plants, such as coffee [12], black tea [13], roses [14], chrysanthemum [14], potatoes [15], burdock [16], and some other fruits or vegetables [17]. Owing to their protective effects, CGAs play a crucial role in plant resistance to environmental stressors, such as ultraviolet light [18], insect pests [19], and fungal infections [20]. As the main phenolic acids in L. macranthoides, CGAs exhibit various biological activities, including antimicrobial [21], anti-inflammatory [22], antioxidant [23], and antiobesity effects [24]. Saponins, another important group of compounds in L. macranthoides, are classified into six major types based on their chemical structures: hederin-type, oleanane-type, ursane-type, lupane-type, fernane-1-type, and fernane-2-type [25]. These saponins display diverse biological activities, including anti-inflammatory, antibacterial, antiallergic, immunomodulatory, and antitumor properties, as well as protection against Alzheimer’s disease [26,27]. Medicinal plants are regarded as a readily accessible and powerful source of antioxidants due to their diverse chemical compounds, which can operate independently or synergistically to treat diseases and enhance health. [28]. The antioxidant activity of L. macranthoides is attributed to its ability to scavenge free radicals, which are involved in developing various diseases [29]. This suggests that the antioxidant activity of L. macranthoides may underlie its medicinal properties [30].
L. macranthoides has traditionally been cultivated in Southwest China, spanning regions such as Chongqing City, Sichuan Province, Hunan Province, and Guizhou Province (Figure 1a). Consequently, certain breeds of L. macranthoides have been observed and cultivated in these regions, becoming the predominant breeds. Owing to variations in climate, geography, and cultivation methods in these regions, most of these breeds exhibit distinct morphological characteristics in their flowers. For example, some breeds retain a bud-like appearance without splitting, or rarely split, maintaining their color until they wither (Figure 1b) [31]. These unopened mutant breeds of L. macranthoides are now widely cultivated. During our field investigation, the open wild-type breeds are still the main cultivation breeds in Guizhou, characterized by flower buds that split and change from white to yellow as they mature (Figure 1c). The quality of the flowers from open wild-type breeds varies during their development stages, with higher CGA content observed in the early stages than in the late stages [32]. Considering these factors, the quality distinctions arising from the diverse producing regions and breeds of L. macranthoides remain unclear, and the variations in components may impact its antioxidant activity. Therefore, developing a comprehensive quality evaluation method that compares the components and antioxidant activity of L. macranthoides from different producing regions and breeds is necessary.
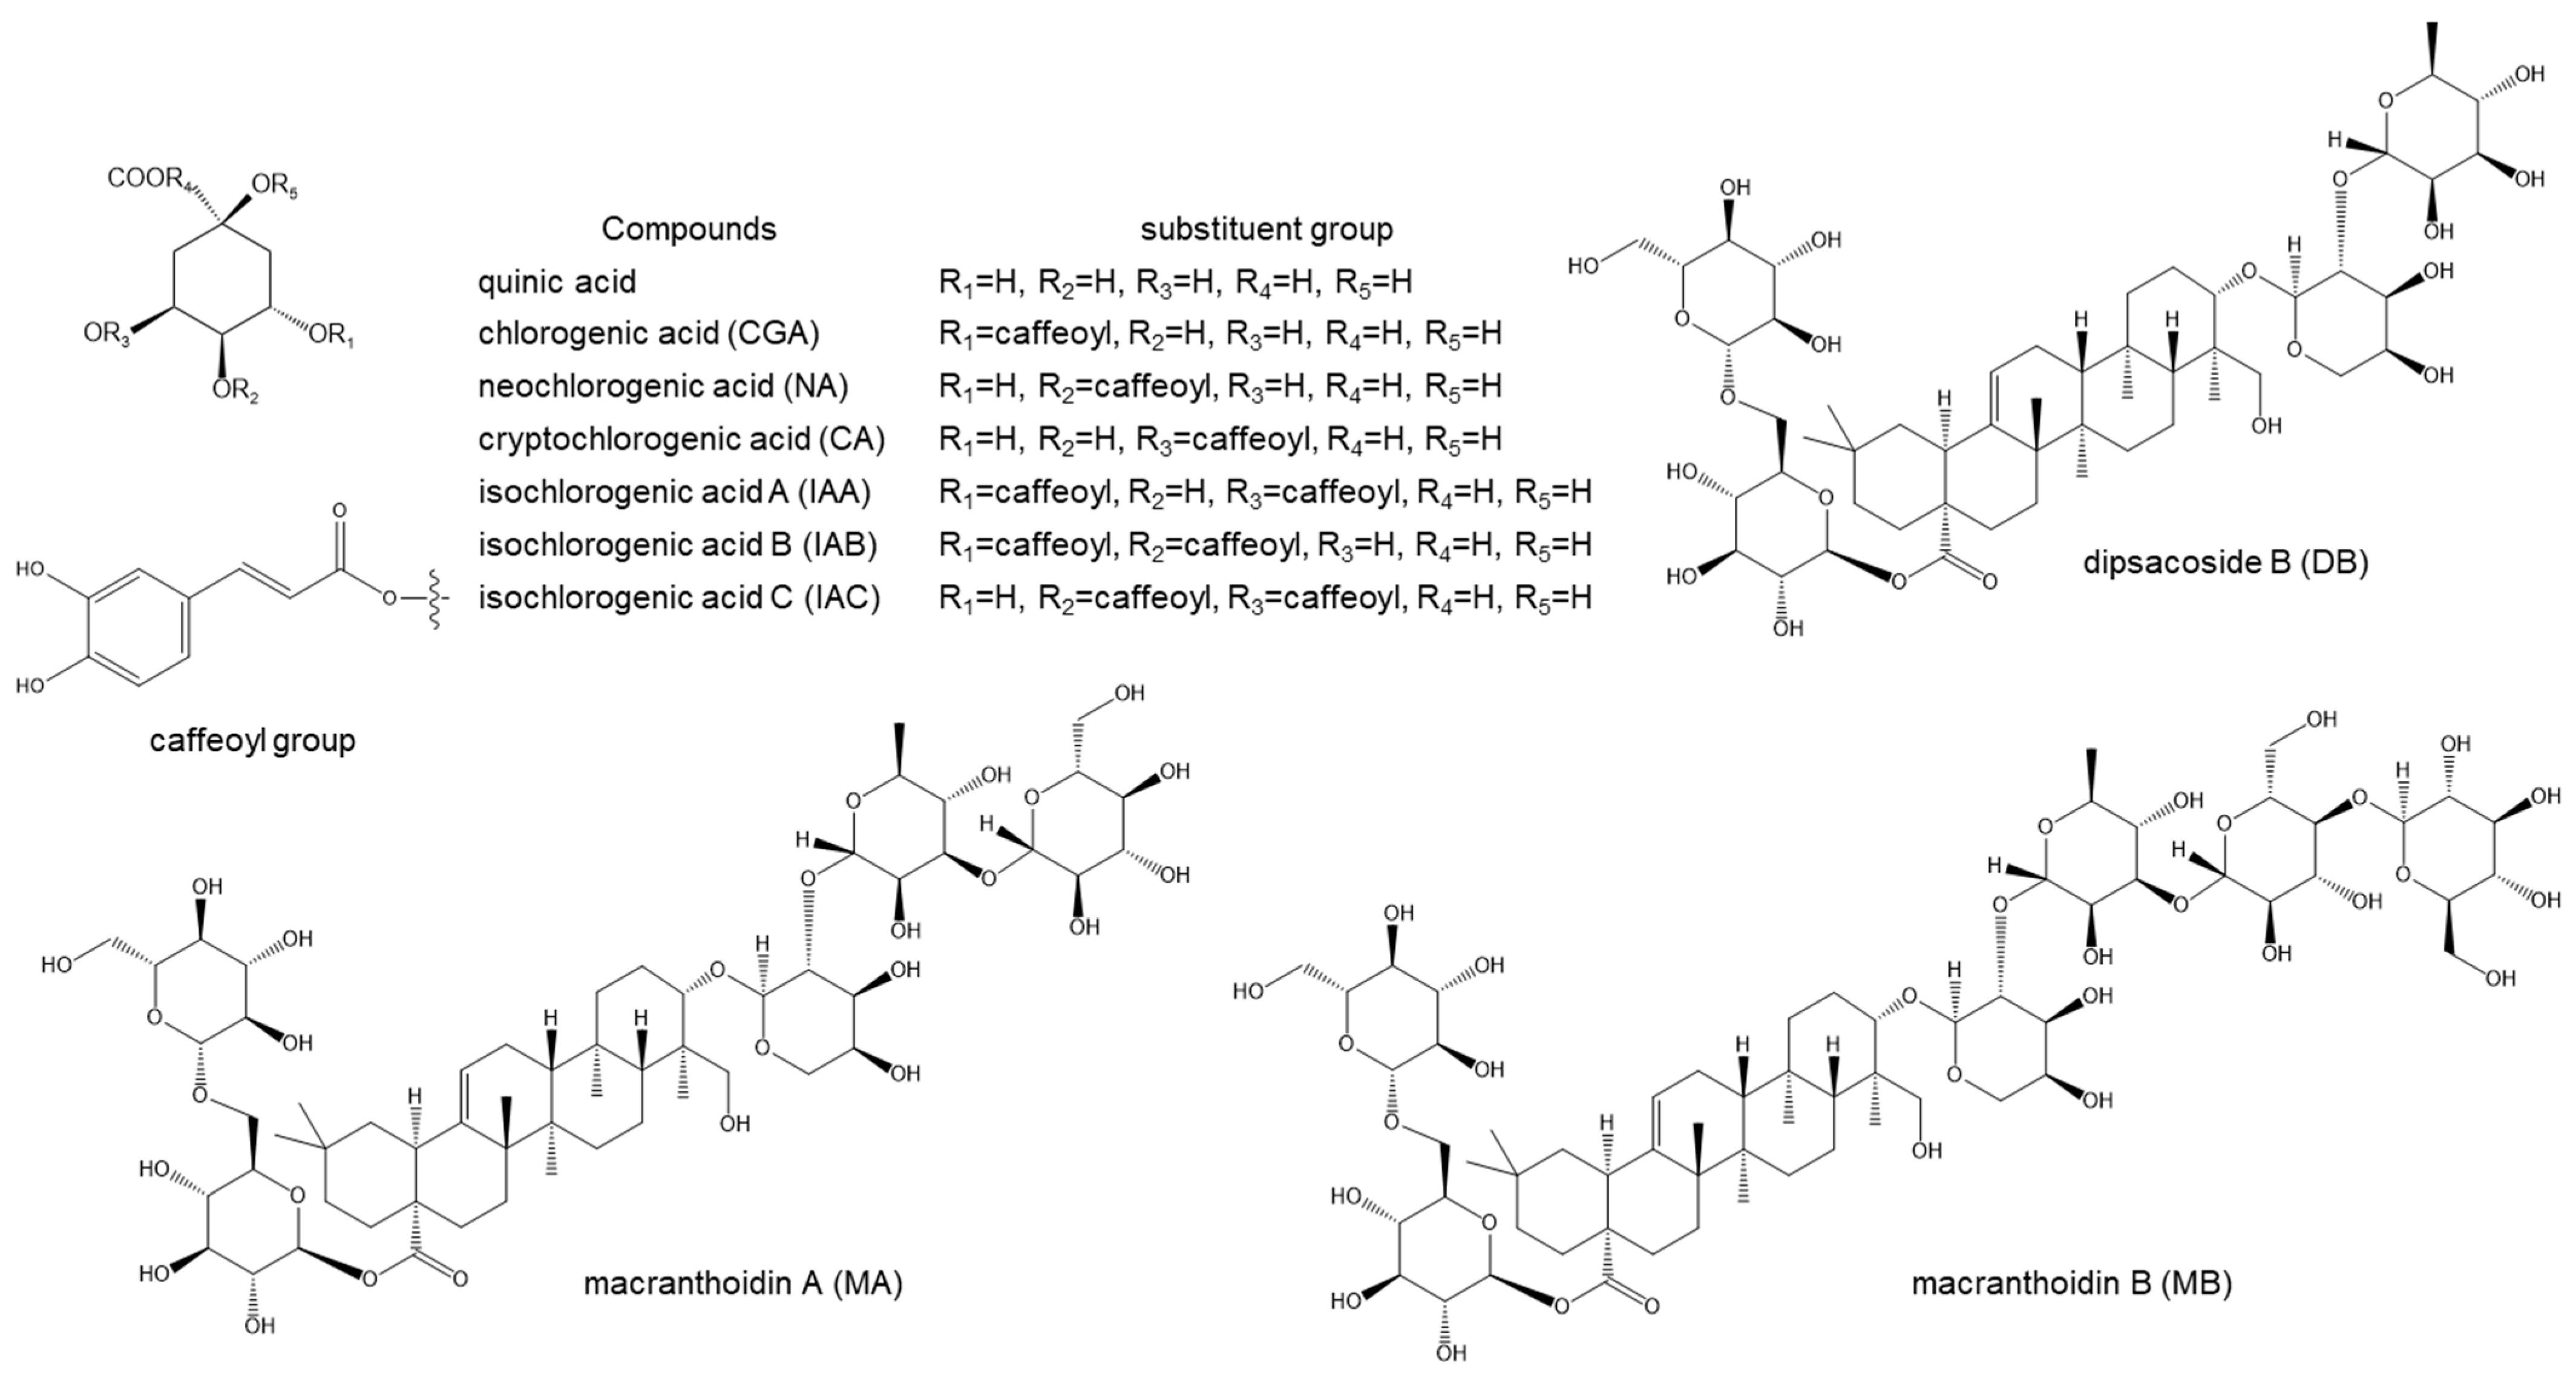
Herein, with an aim to clarify the quality differences of Lonicerae Flos derived from L. macranthoides cultivated in Southwest China, 50 samples were collected for investigation. CGA and other phenolic acid compounds were quantified using HPLC analysis (Figure 2). Three saponin compounds in L. macranthoides—MB, macranthoidin A (MA), and DB—were quantitatively determined using HPLC coupled with an evaporative light-scattering detector (ELSD) owing to low ultraviolet absorption. Component variation was characterized using multivariate statistical analysis, specifically orthogonal partial least squares-discriminant analysis (OPLS-DA). Furthermore, 2,2′-Azinobis-(3-ethylbenzthiazoline-6-sulphonate) (ABTS) and 1,1-diphenyl-2-picryl-hydrazyl (DPPH) scavenging assays were conducted to evaluate the antioxidant activity of the cultivated samples. Principal component analysis (PCA), partial least squares (PLS) regression, and heatmap analysis were conducted to identify active components and identify potential correlations between the HPLC chromatograms and antioxidant activity.

2. Results and Discussion

2.1. Method Validation

The quantitative method was validated by evaluating linearity (r), precision, stability, repeatability, and recovery (Table 1). High correlation coefficient values were observed for all nine analytes (r ≥ 0.9993 for the six phenolic acid compounds and r ≥ 0.9926 for the three saponin compounds), indicating strong correlations between concentrations and peak areas within the tested ranges (from 0.002 to 1.903 mg/mL). Precision, repeatability, and stability were also validated for each analyte, with RSD varying from 0.79% to 1.95%, 0.13% to 2.60%, and 0.34% to 1.66%, respectively. The recoveries of the nine analytes ranged from 93.99% to 100.67%, with RSD varying from 1.13% to 1.91%. These findings demonstrate that the established method is sensitive and sufficiently accurate for quantitatively analyzing the nine compounds in L. macranthoides.

2.2. Metabolite Profiling of L. macranthoides

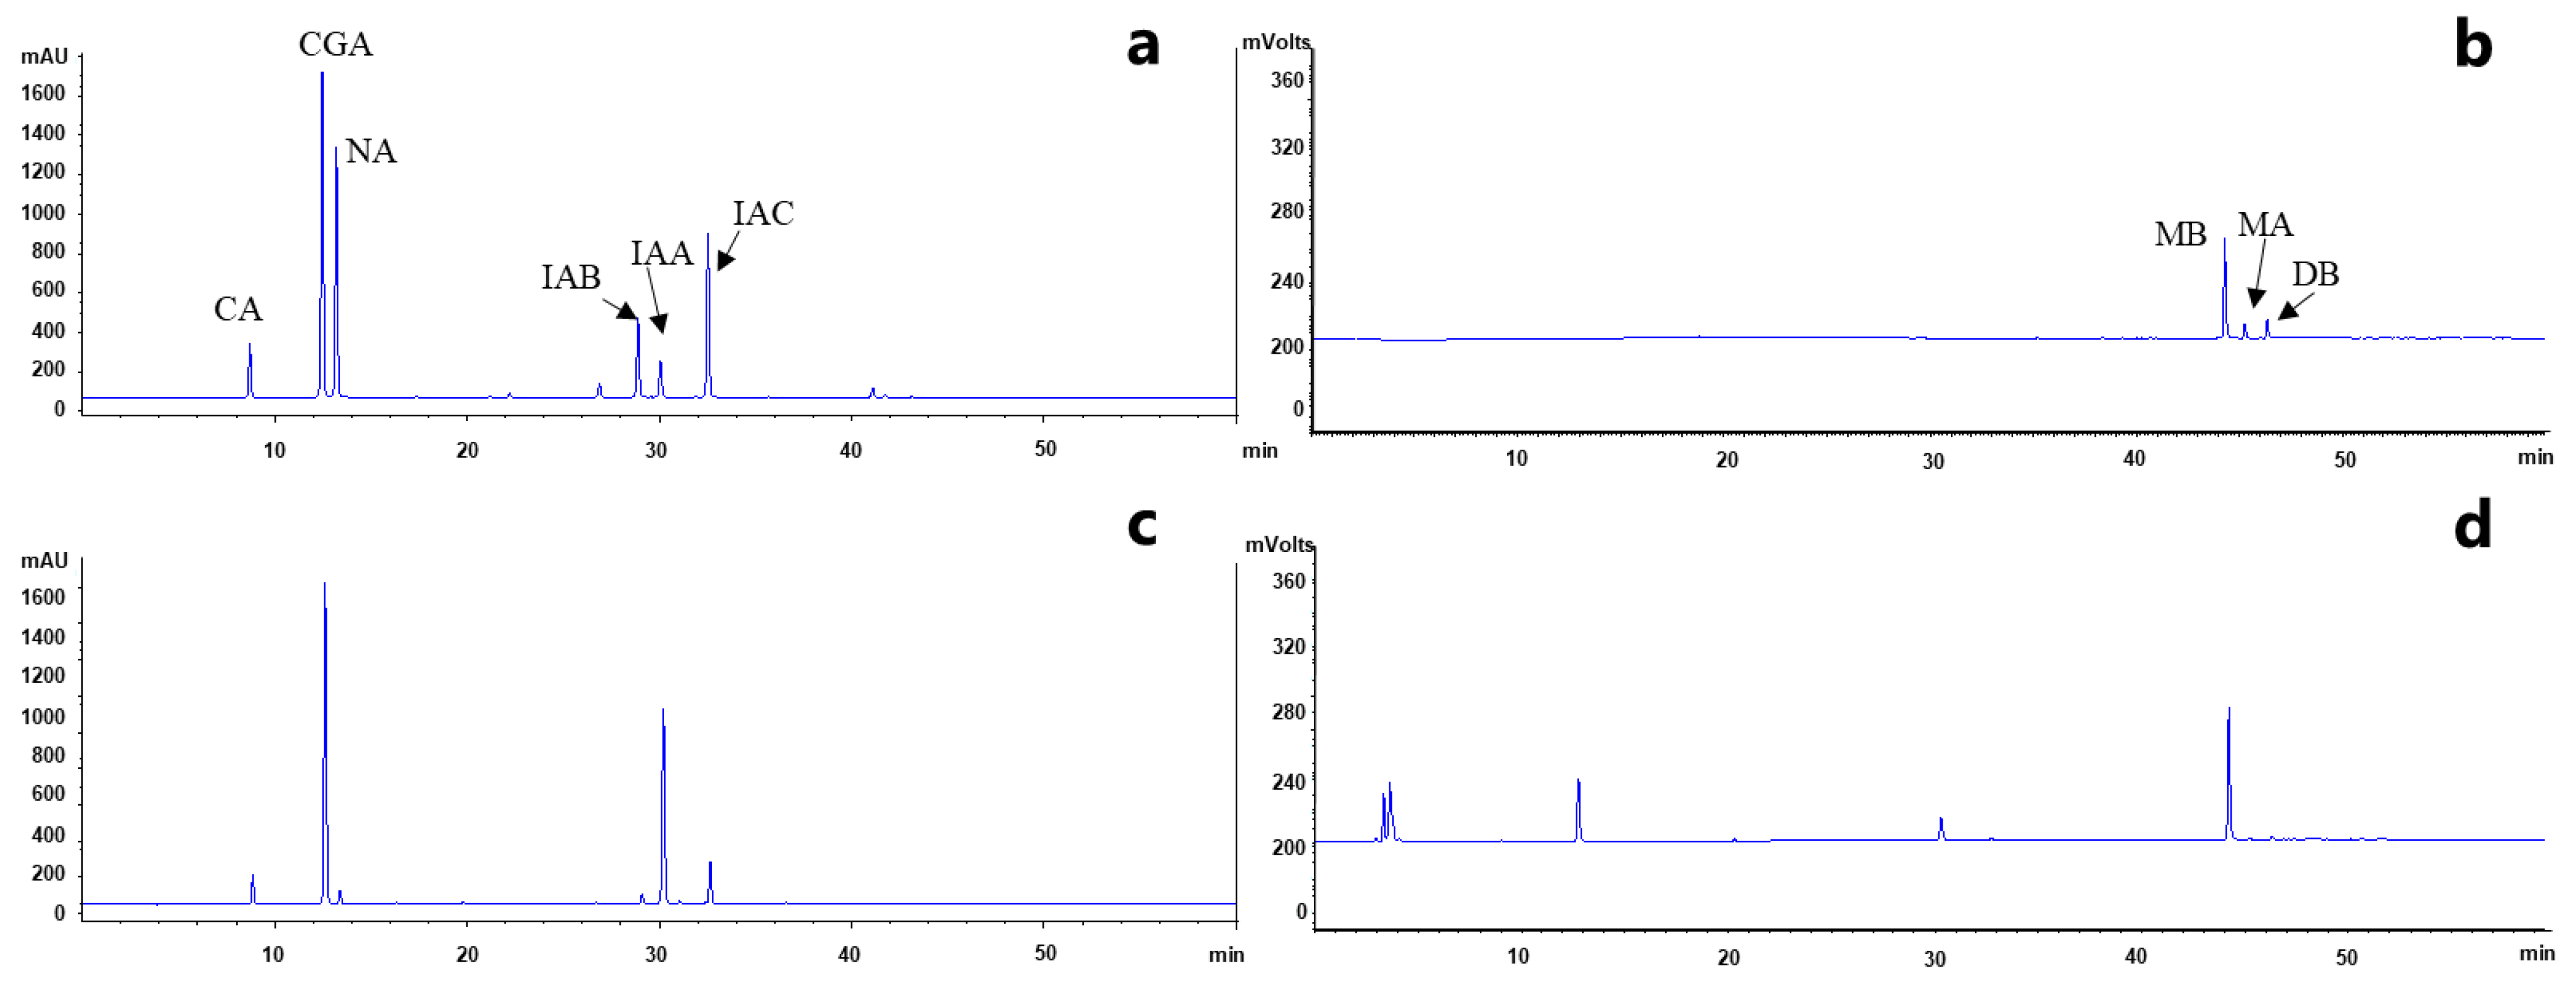
Six phenolic acid compounds including CGA, neochlorogenic acid (NA), cryptochlorogenic acid (CA), isochlorogenic acid A (IAA), isochlorogenic acid B (IAB), isochlorogenic acid C (IAC) and three saponin compounds (MB, DB, and MA) were simultaneously detected in the HPLC chromatograms of all samples derived from L. macranthoides by comparing retention times. A representative HPLC chromatogram is shown in Figure 3. No variations in component composition were observed among the L. macranthoides samples derived from different producing regions of China, indicating consistency in the composition of the samples used in this study.

2.3. Quantitative Analysis of the Nine Compounds in L. macranthoides

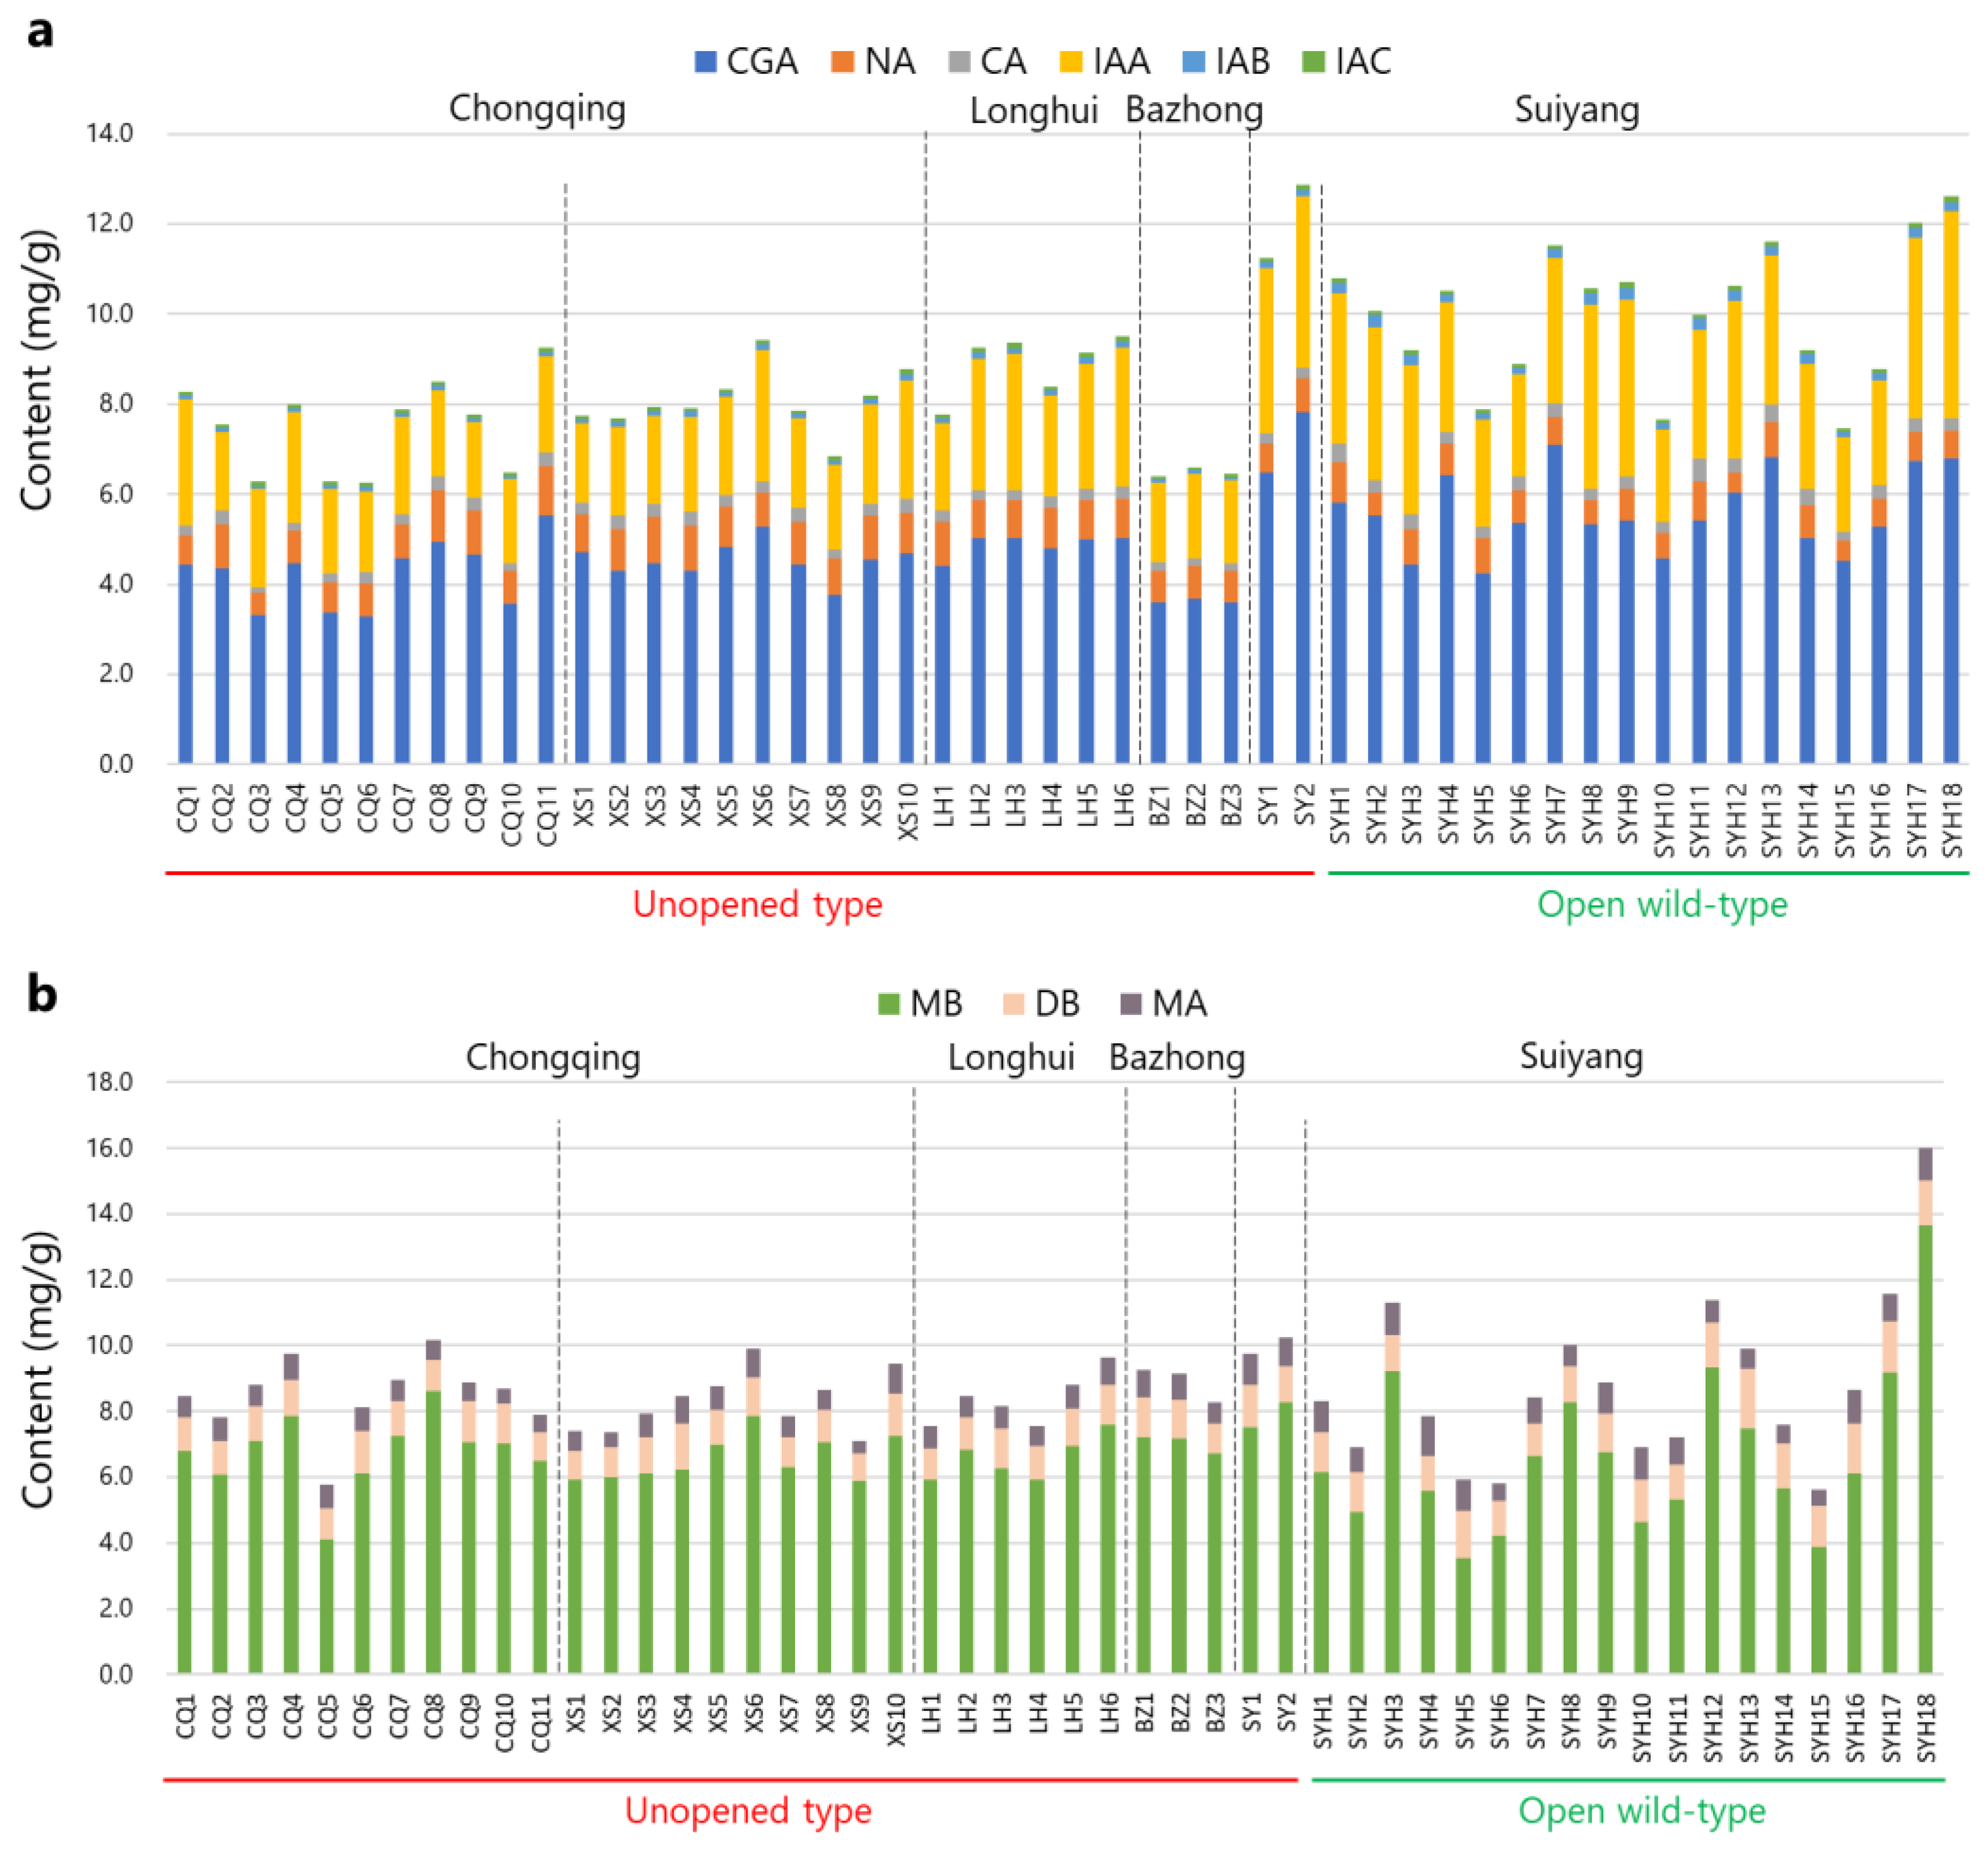
The contents of the nine compounds detected in the HPLC chromatograms were quantified using linear formulas for each compound. As presented in Table 2 and Figure 4, CGA, NA, CA, IAA, IAB, IAC, MB, DB, and MA exhibited relative contents ranging from 3.296% to 7.839%, 0.450% to 1.144%, 0.117% to 0.490%, 1.671% to 4.582%, 0.056% to 0.264%, 0.061% to 0.139%, 3.551% to 13.652%, 0.836% to 1.789%, and 0.350% to 1.202%, respectively. In addition, the total relative contents of MB and DB across all samples ranged from 4.989% to 15.000% (Table 2). According to the Chinese Pharmacopoeia (2020), Lonicerae Flos should contain no less than 2.0% CGA and 5.0% of the total contents of MB and DB, calculated with reference to the dried drug [6]. Our results demonstrate that all samples used in this study met the quality standard. Only Sample SYH5 from Suiyang, Guizhou, exhibited a slightly lower content of two saponins (4.989%) than the quality standard. XIAO et al. [33] detected CGA in 50 Lonicerae Flos derived from L. macranthoides cultivated in Longhui, Hunan, using HPLC, with the relative content ranging from 3.07% to 7.09%. Wu et al. [34] collected flowers of L. macranthoides from three regions in Hunan and Xiushan, Chongqing, and found that CGA showed a relative content of 3.067–4.479%. Liu et al. [35] collected L. macranthoides samples from Hunan, Sichuan, and Hubei and found that these samples contained CGAs of 72.14, 43.91, and 28.87 mg/g, respectively. These results align with our findings. Sun et al. [36] established a method for simultaneously determining 5 saponins in 10 L. macranthoides samples produced in Longhui, Hunan. MB, MA, and DB exhibited relative contents ranging from 4.317% to 6.185%, 0.045% to 0.094%, and 0.6245% to 1.342%, respectively, similar to our results.
The total contents of the six phenolic acids or three saponin compounds found in samples cultivated in different regions significantly differed (Table 2). When summing the contents of the six phenolic acids, samples from Chongqing City exclude Xiushan County (CQ1-11); Xiushan County, Chongqing City (XS1-10); and Longhui County, Hunan Province (LH1-6) showed average contents of 7.502%, 8.073%, and 8.908%, respectively, with no significant difference. Samples from Bazhong City, Sichuan Province (BZ1-3) showed an average content of 6.478%, significantly lower than those produced in Chongqing or Hunan. Samples from unopened type in Suiyang County, Guizhou Province (SY1-2) and wild open type in Suiyang County, Guizhou Province (SYH1-18) showed average contents of 12.059% and 10.009%, respectively, which is significantly higher than the other samples, with SY1-2 (12.059%) exhibiting a significantly higher content than SYH1-18 (10.009%). Regarding the total contents of the three saponin compounds, samples CQ1-11, XS1-10, LH1-6, BZ1-3, SY1-2, and SYH1-18 showed similar average contents of 8.485%, 8.288%, 8.367%, 8.901%, 9.993%, and 8.795%, respectively. Tian et al. [37] suggested that environmental factors, such as sunlight, temperature, water, altitude, and soil nutrition, may impact the content of CGA in tobacco. Zhang et al. [38] analyzed climatic factors affecting CGA in Lonicerae Japonica Flos and found that high-temperature stress had the most significant influence. Chen et al. examined the relationship between Lonicerae Flos quality and altitude. Their results showed that altitude significantly influenced the quality of Lonicerae Flos derived from L. macranthoides, with pharmacological substances increasing as altitude increased. Altitude also influenced the contents of MB and DB, with MB showing the highest content in samples from 600 to 700 m and DB showing the highest content in samples from 800 to 900 m [39]. To our knowledge, the altitudes of Chongqing, Bazhong, and Longhui range from 200 to 400 m, whereas Suiyang has an altitude of approximately 1300 m, which is much higher than the other regions. This disparity may be the main factor related to the high CGA content in L. macranthoides cultivated in Suiyang.
The HPLC results revealed that L. macranthoides cultivated in Southwest China exhibited high quality owing to their elevated levels of phenolic acids and saponin compounds. Samples from Chongqing, Hunan, and Sichuan demonstrated consistent contents of all nine compounds, indicating uniform quality. However, samples from Guizhou exhibited relatively high quality, with the total contents of the six phenolic acids and three saponin compounds ranging from 7.464 to 10.009% and 8.795 to 16.015%, respectively. Sample SYH18, which had the highest content of saponin compound, and Sample SYH4, which had the lowest content, belonged to the SYH group. This indicates significant fluctuations in quality for Lonicerae Flos derived from open wild-type L. macranthoides in Guizhou, possibly owing to genetic diversity.
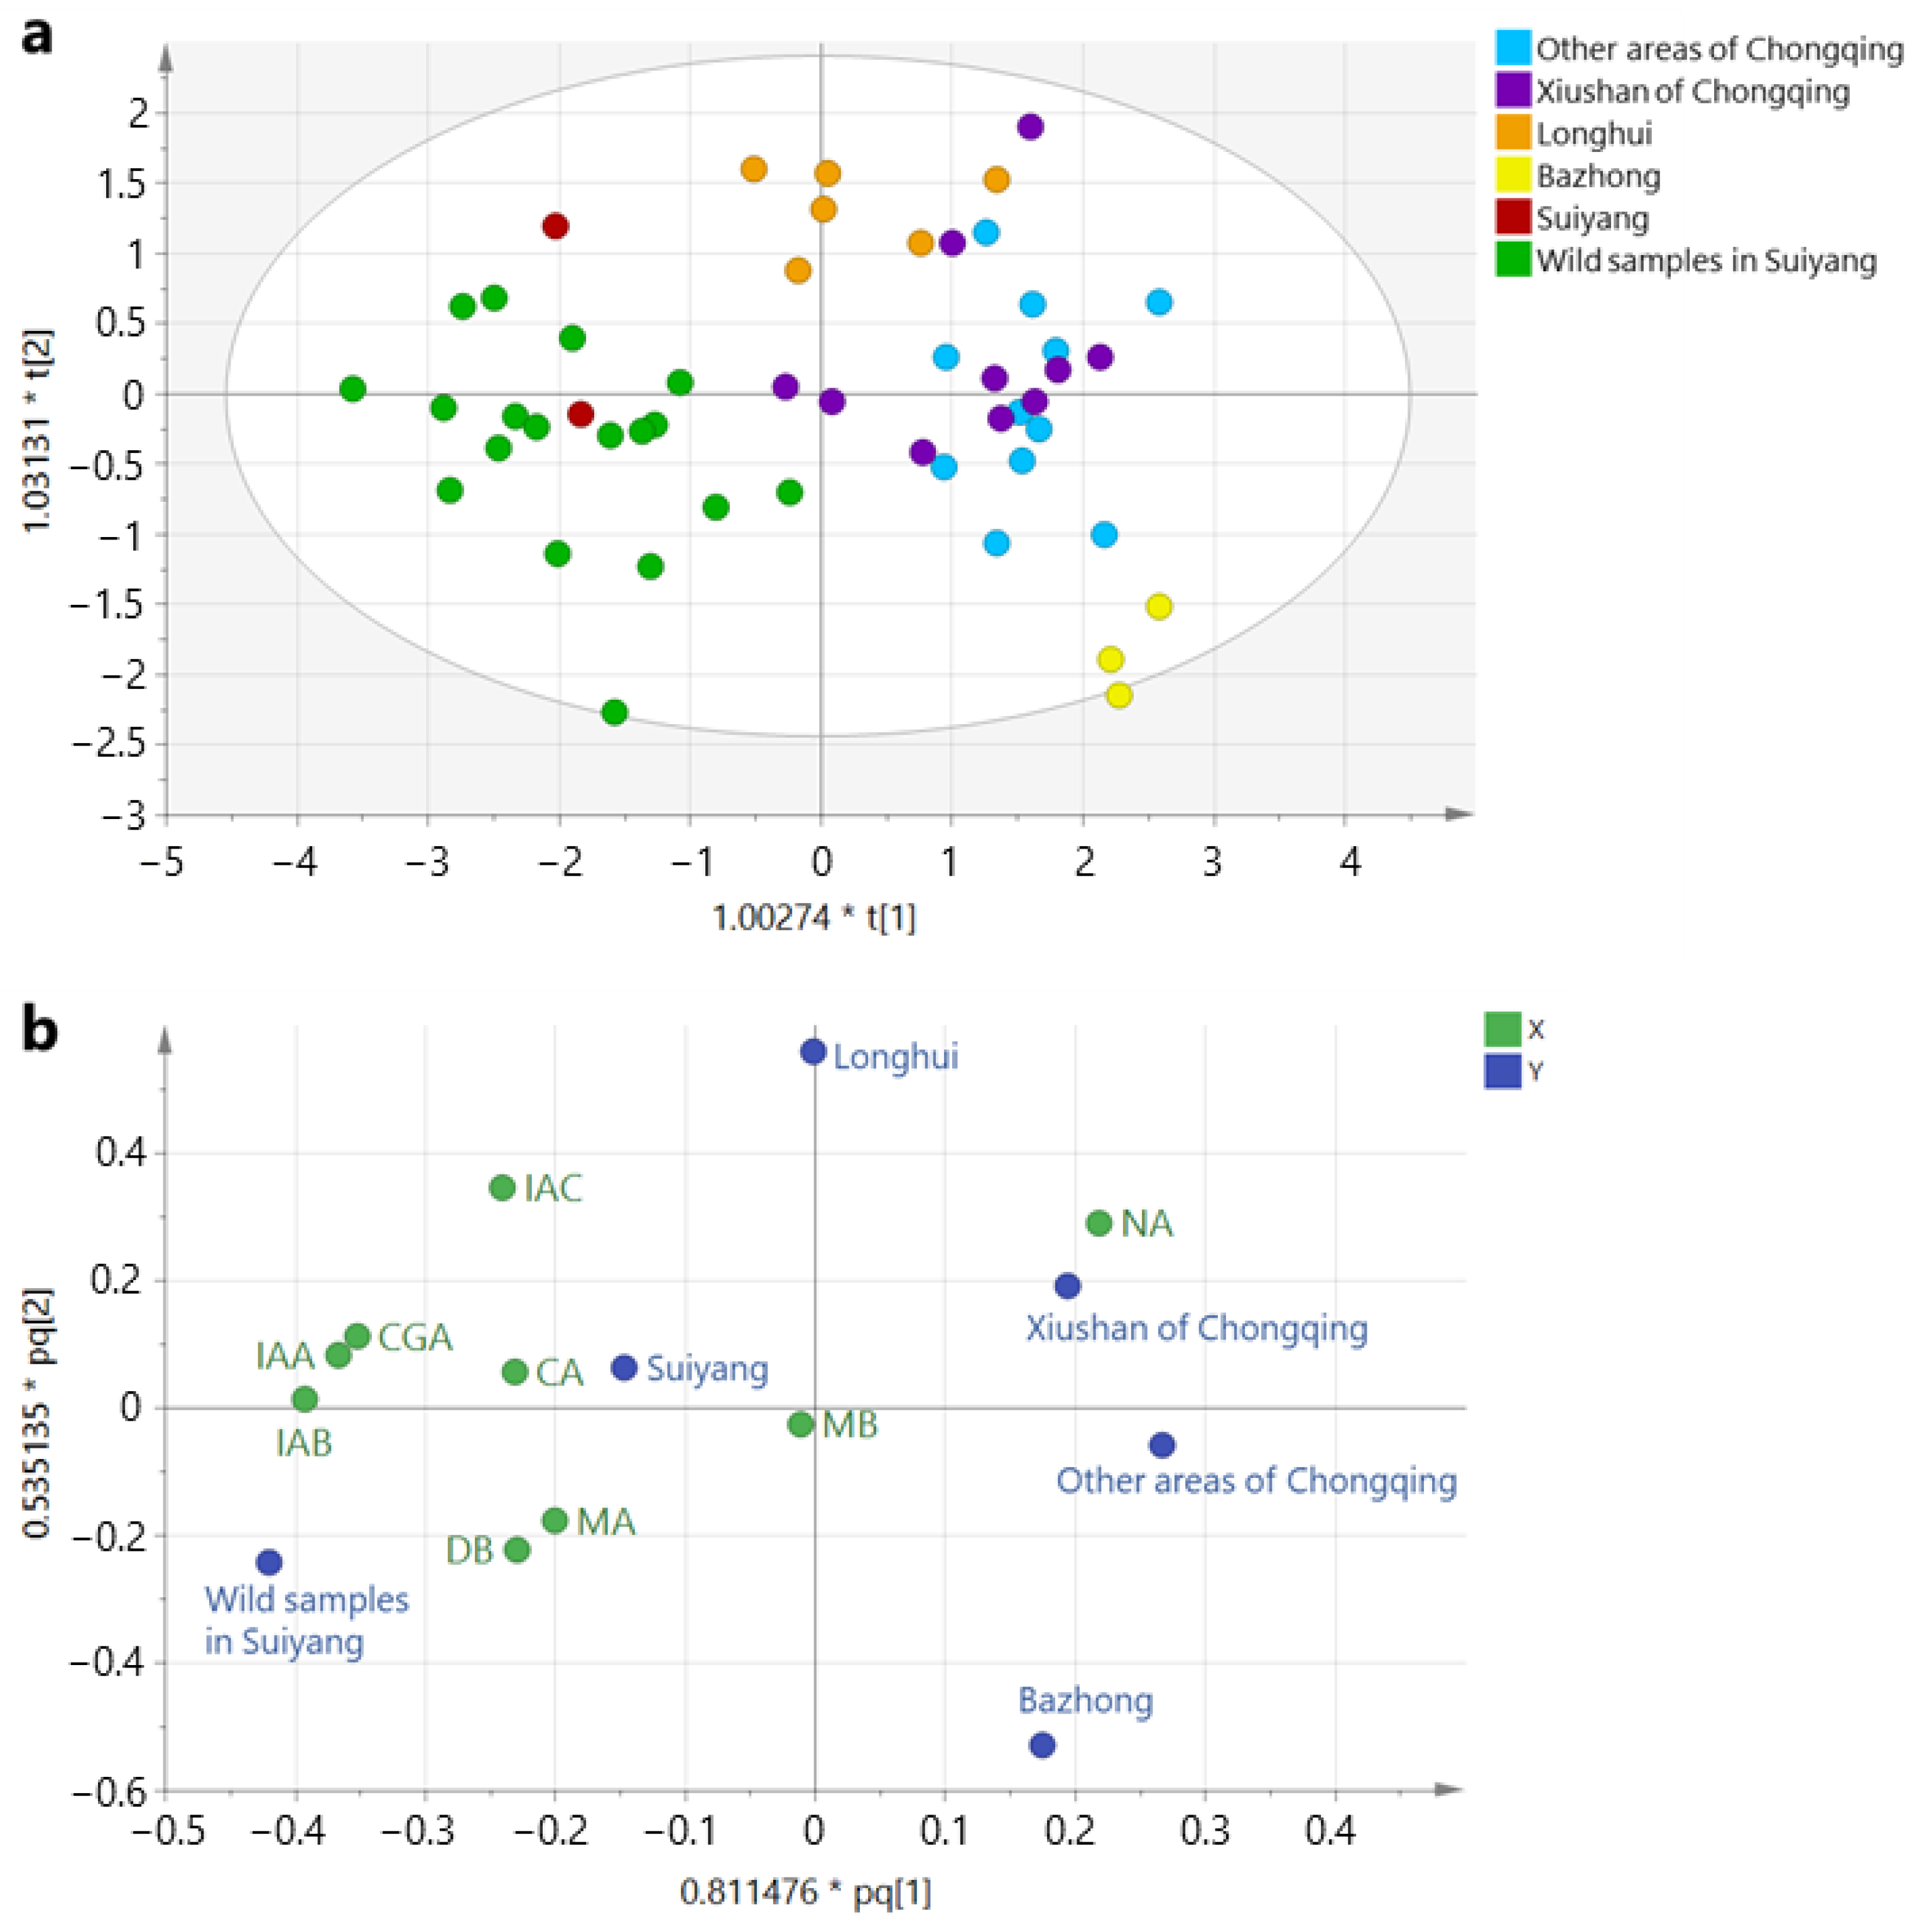
OPLS-DA was conducted on the HPLC data of all 50 L. macranthoides samples. The score and loading plots of OPLS-DA are depicted in Figure 5. In the score plot, samples produced in Suiyang, Guizhou, including those derived from the unopened and open wild types, were distinguished from the others. Among the remaining samples, three from Bazhong, Sichuan were separated from those produced in Chongqing and Longhui, Hunan. Samples from Chongqing and Longhui exhibited partial overlap. Samples from the entire Chongqing region, including those from Xiushan and other regions, were indistinguishable, indicating a similar quality. The results of the OPLS-DA aligned with the HPLC analysis.

2.4. Antioxidant Activity

All samples exhibited high radical scavenging activity in the ABTS and DPPH assays, with radical clearing ratios ranging from 68 to 93% in the ABTS assay and 48 to 71% in the DPPH assay (Table 3). For each sample group, samples within CQ, XS, LH, BZ, and SY demonstrated average ABTS radical scavenging as activities of 76%, 82%, 84%, 71%, and 92%, respectively, and average DPPH radical scavenging activities of 57%, 64%, 61%, 54%, and 71%, respectively. These results align with the tendencies observed in the bioactive compound contents. XIAO et al. [33] assessed radical scavenging activity based on DPPH for 50 Lonicerae Flos samples derived from L. macranthoides cultivated in Longhui, Hunan, using HPLC. Their results showed clearing ratios ranging from 21.87 to 86.74%, which are consistent with our results (48–71%).

2.5. Relationship between HPLC Chromatograms and Antioxidant Components

PCA, heatmap analysis, and PLS regression were conducted to explore the relationship between HPLC chromatograms and antioxidant activity. These statistical analysis models used the same data matrix created from HPLC peak areas and ABTS/DPPH scavenging activity data of 32 L. macranthoides samples. The PCA, heatmap analysis, and PLS regression results are depicted in Figure 6, Figure 7 and Figure 8, respectively.
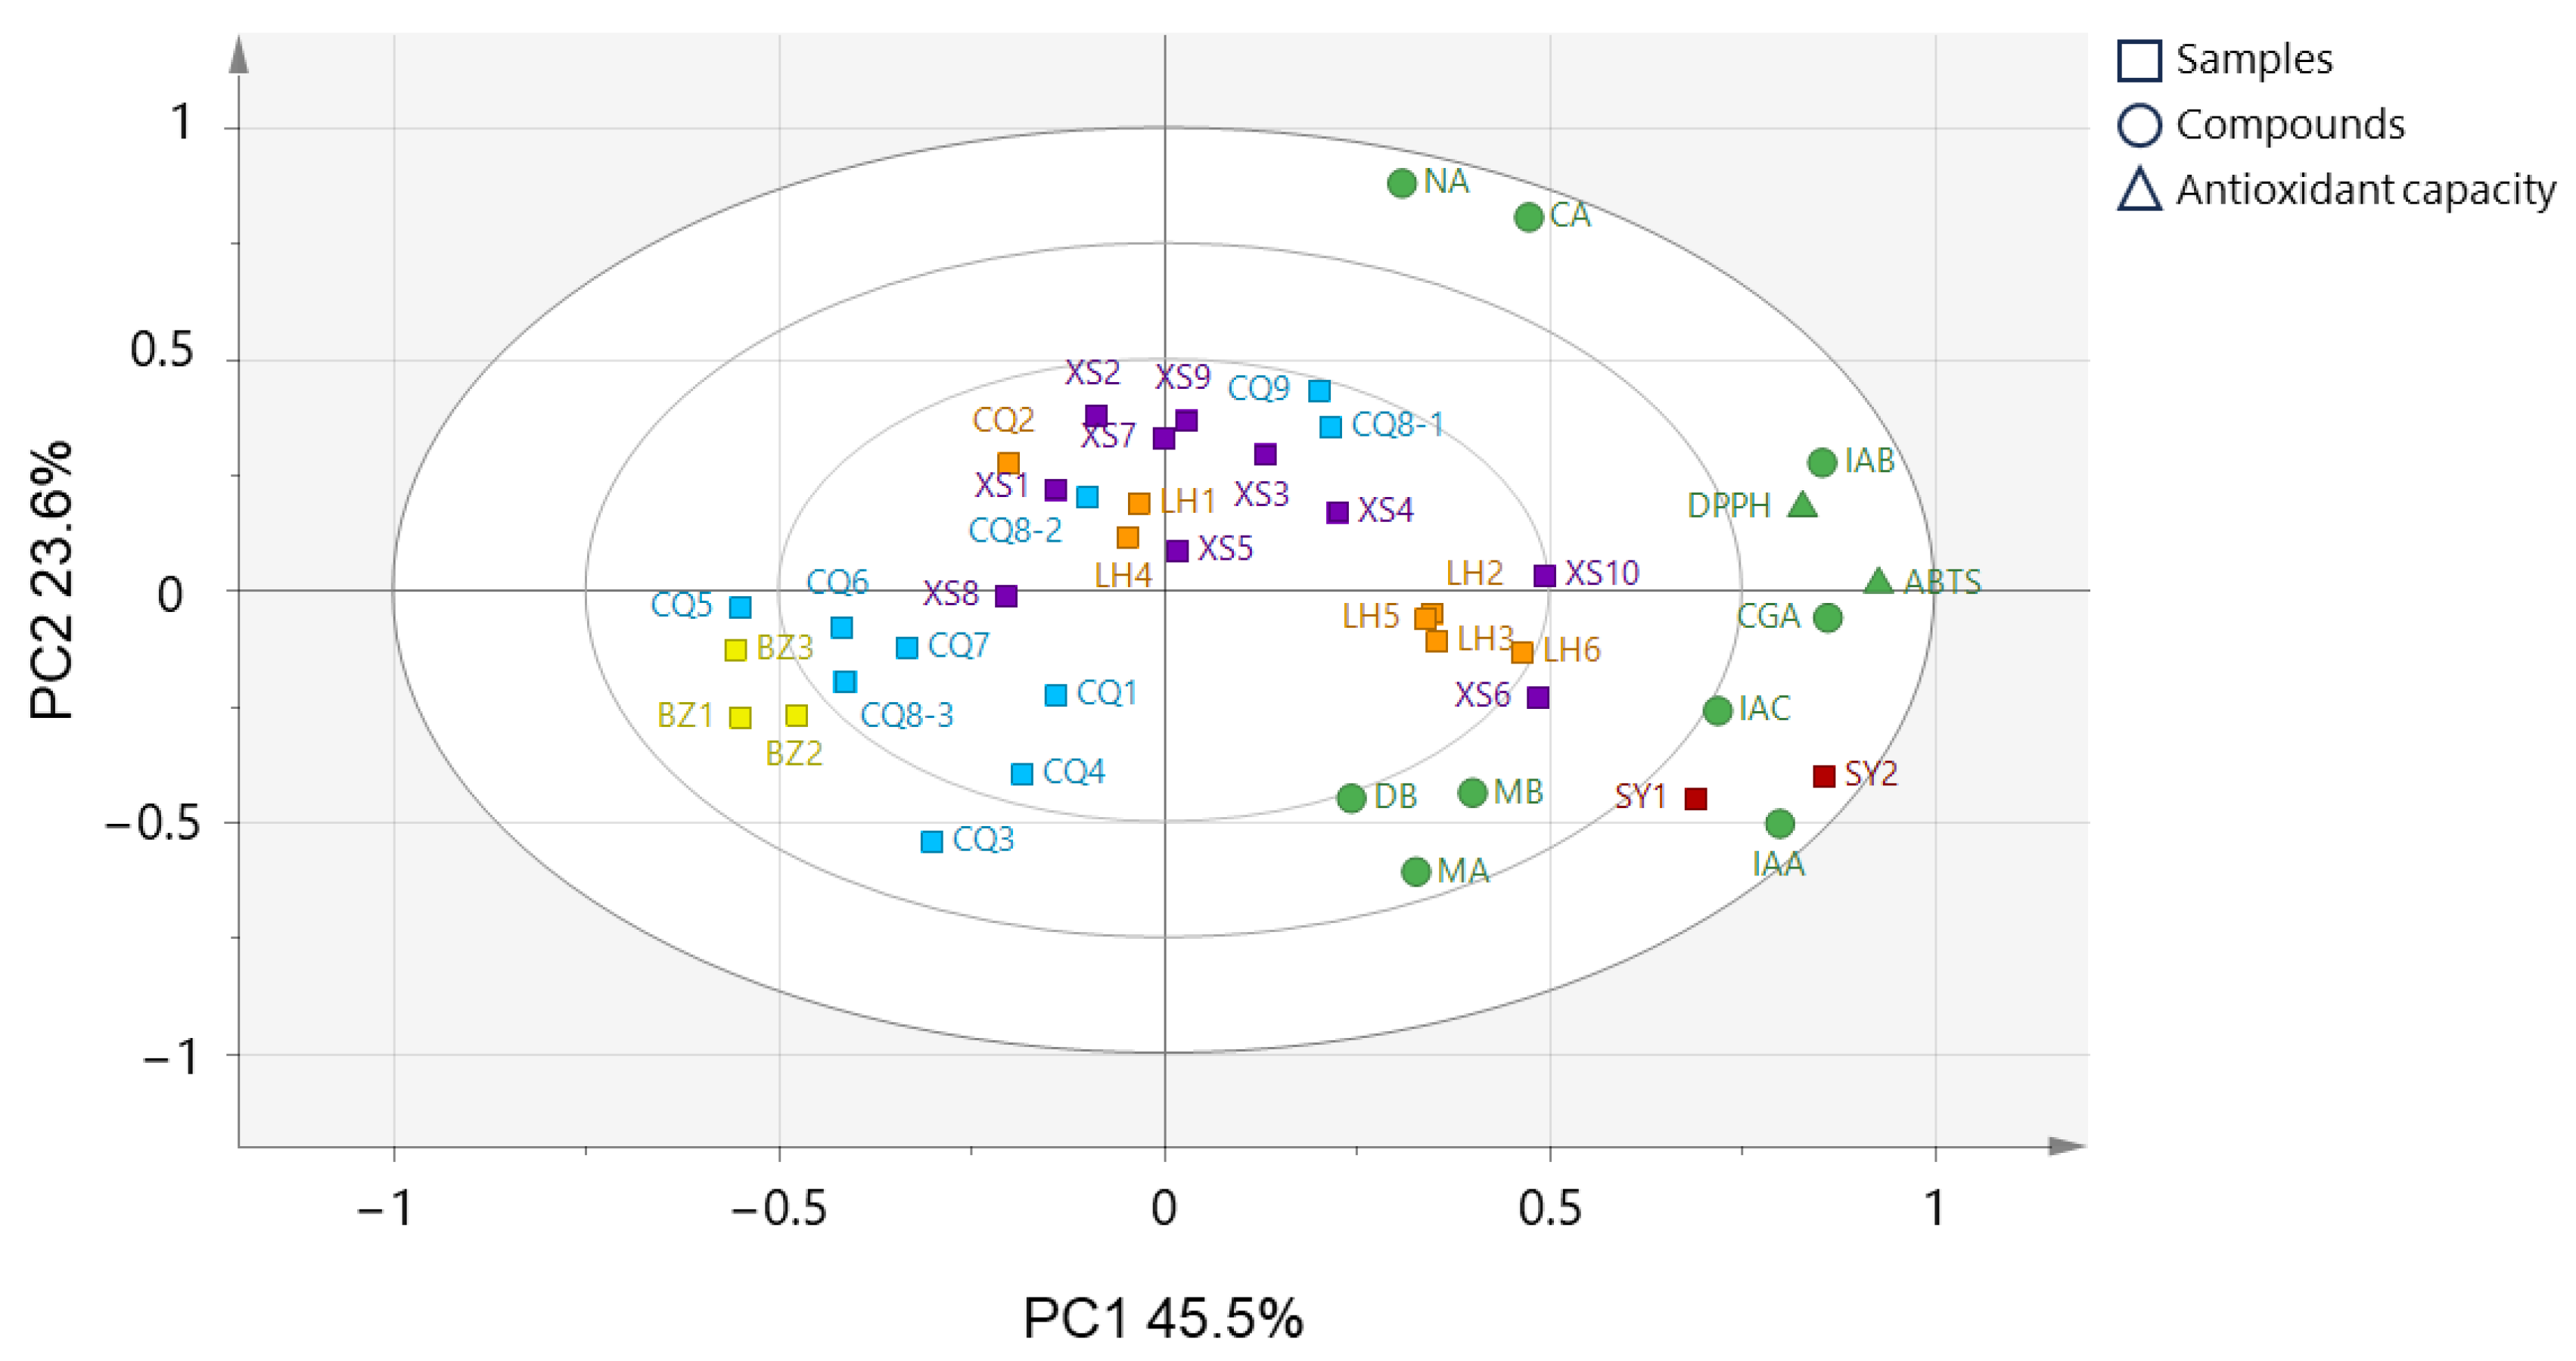
The PCA results are presented in Figure 6, where the crude drug samples are divided into five groups based on their producing regions. This classification aligns with the findings shown in Figure 5a. Notably, the variables of ABTS/DPPH scavenging activity and a portion of compounds (CGA, IAA, IAB, and IAC) tend to cluster, observed above and below the x-axis in quadrants 1 and 4, indicating that samples produced in Suiyang exhibit the strongest antioxidant activity and the highest CGA, IAA, IAB, and IAC contents. This observation is consistent with the results of the antioxidant activity and quantitative analyses, indicating a potential relationship between antioxidant activity and these four compounds.
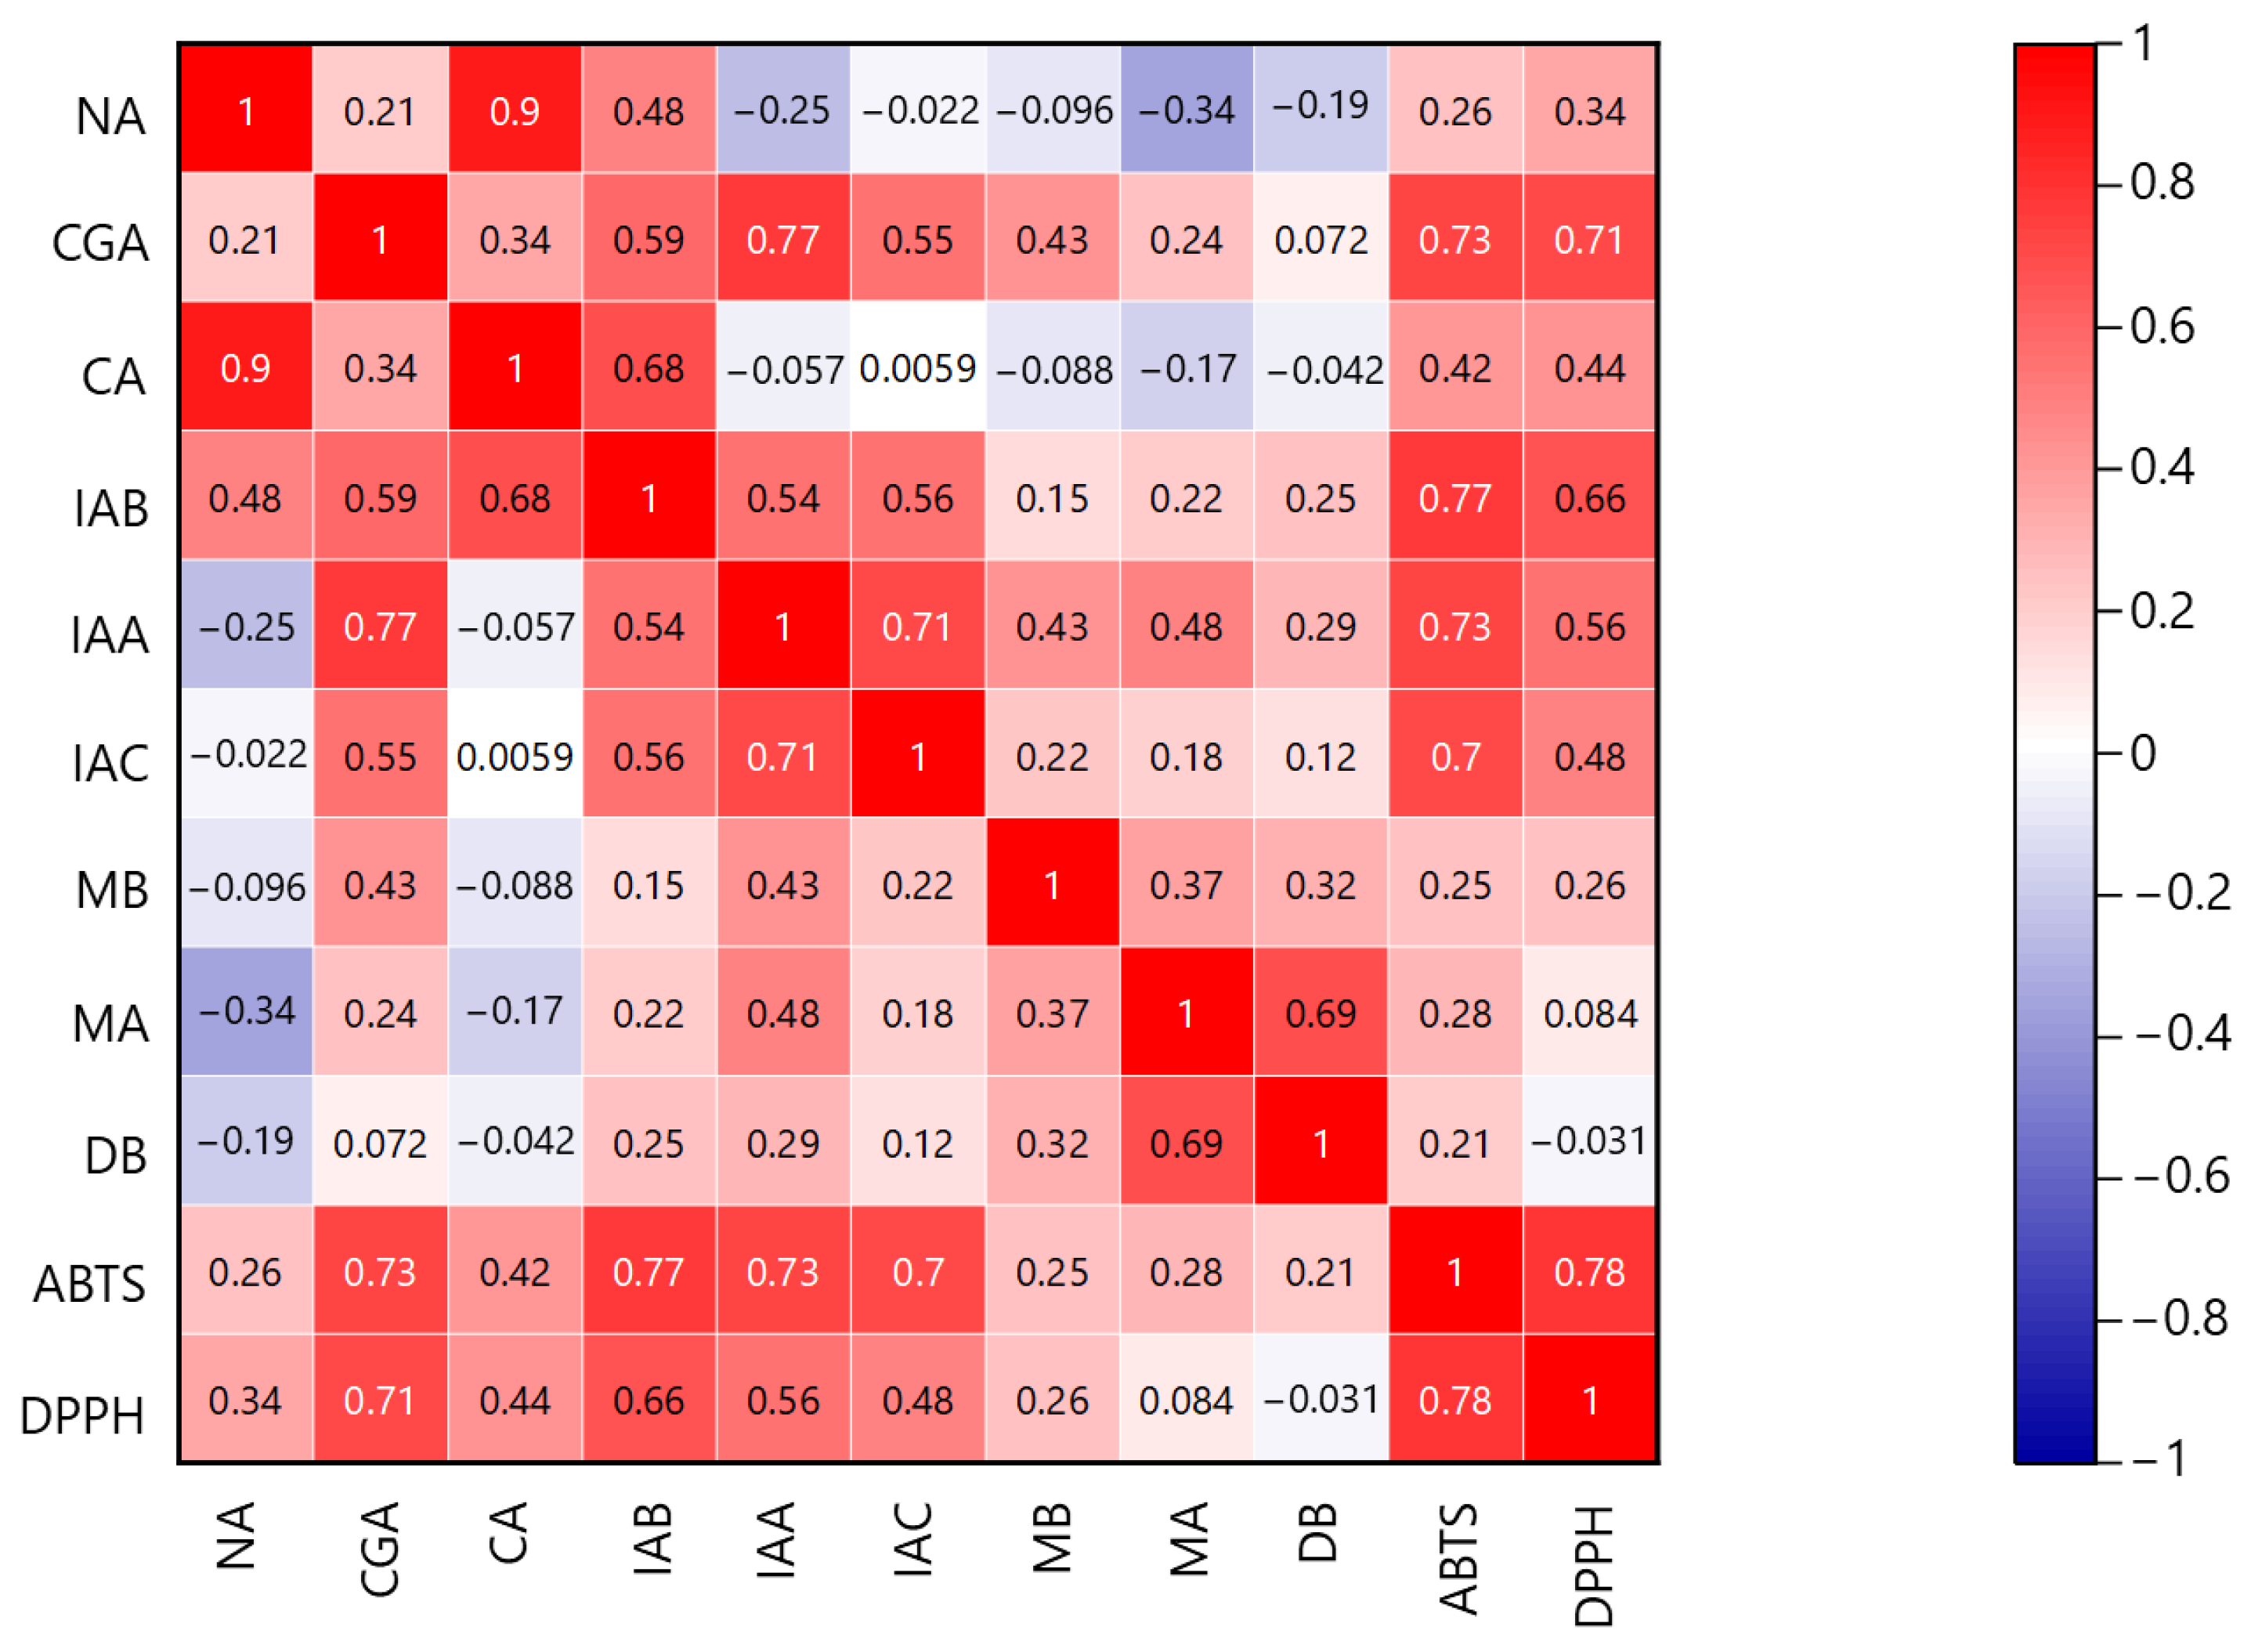
To further elucidate the antioxidant active components in L. macranthoides, a heatmap using Pearson’s correlation coefficient was used to explore the correlation between antioxidant activity and the compounds. As shown in Figure 7, ABTS scavenging activity exhibited relatively strong correlations with CGA (r = 0.73), IAA (r = 0.73), IAB (r = 0.77), and IAC (r = 0.70). Similarly, DPPH scavenging activity showed relatively strong positive correlations with CGA (r = 0.71) and IAB (r = 0.66) while displaying positive correlations with IAA (r = 0.56) and IAC (r = 0.48). These findings indicate that CGA, IAA, IAB, and IAC are associated with ABTS and DPPH radical scavenging activity.
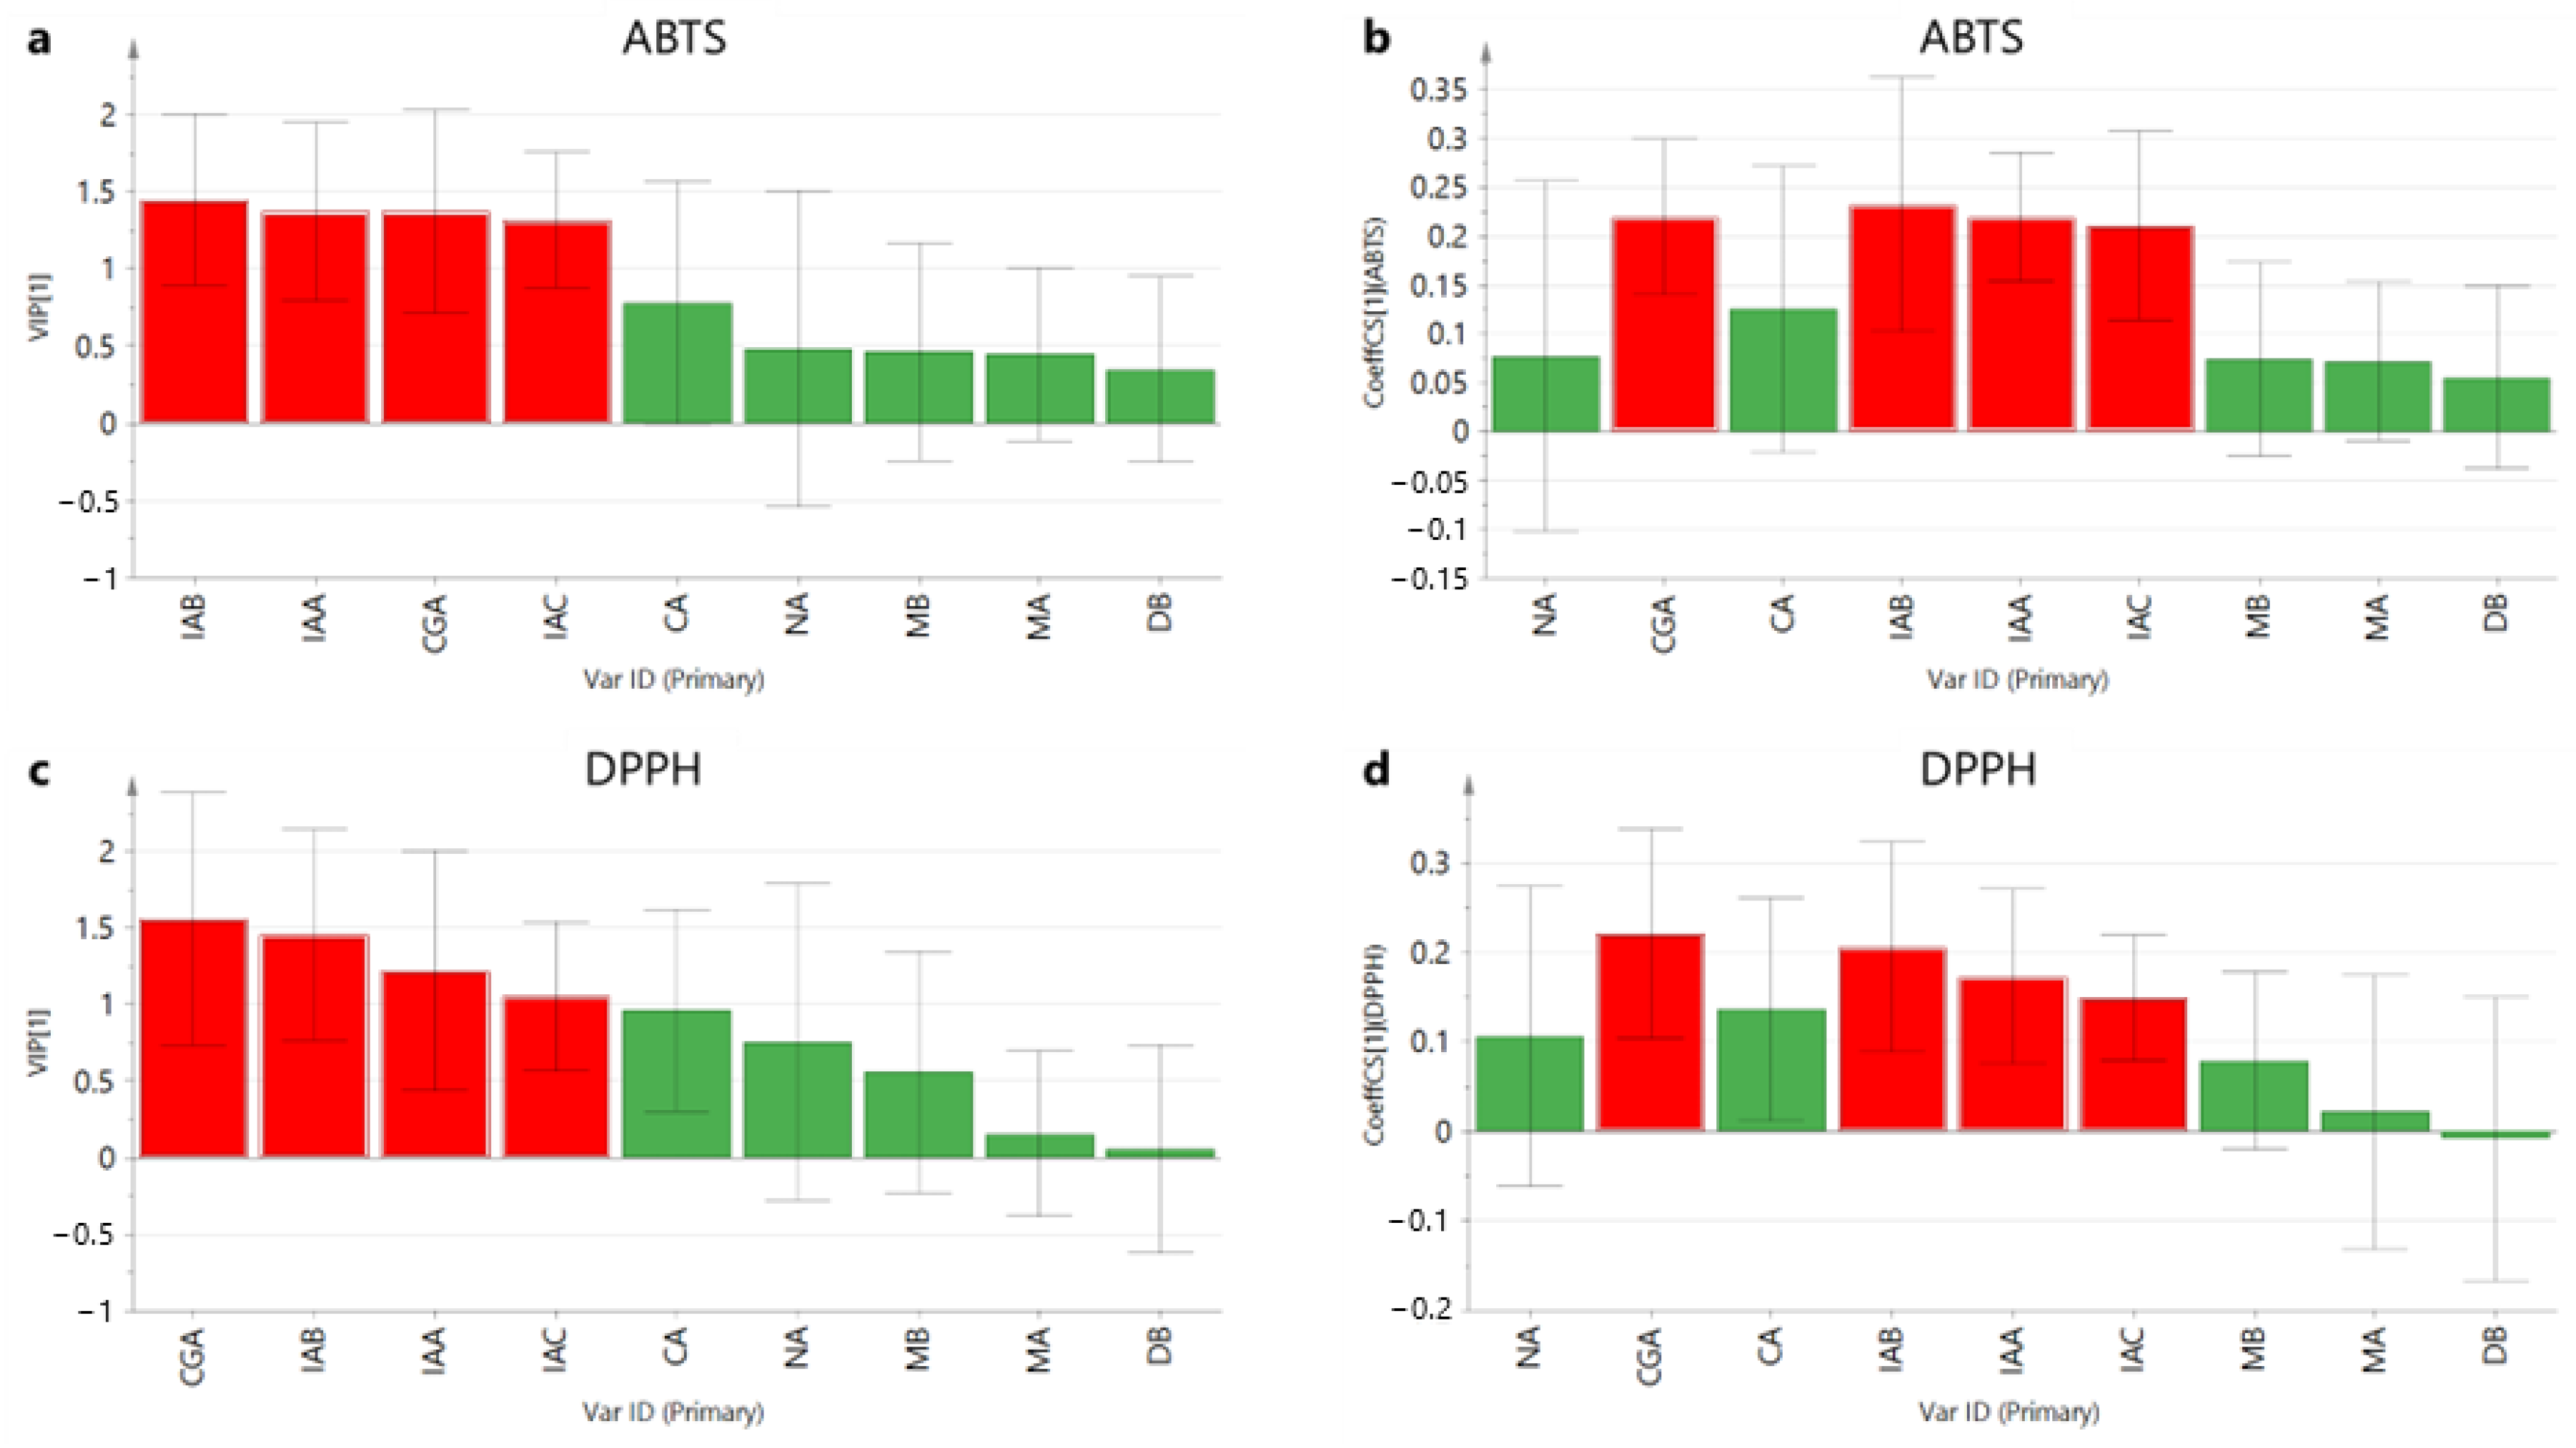
PLS regression was also used to investigate the correlation between antioxidant activity and the compounds. The compounds served as X variables, whereas either ABTS or DPPH radical scavenging activity served as Y variables to construct the PLS model (Y variables). Variable influence on projection (VIP) values are often used to assess the importance of the X variables in explaining the Y variables, with values >1 considered more relevant [40,41]. In Figure 8, the four red columns representing CGA, IAA, IAB, and IAC can be observed on the left side of the graph owing to their VIP values being >1, indicating a strong correlation between these four compounds and antioxidant activity. The regression coefficients in the PLS model reflect the degree of contribution of X to Y variables [42], which was also used to identify the compounds with a high contribution to the PLS model. In Figure 8, CGA, IAA, IAB, and IAC exhibited a positive relation and a high contribution to the model, suggesting that these four compounds might be the active components in L. macranthoides. These results were consistent with those of the heatmap in Figure 7.
Sato et al. [43] reported on the antioxidant activity of CGA, confirming the reliability of our results. Additionally, IAA and IAC showed DPPH scavenging activity similar to that of IAB at equivalent concentration levels [44,45]. Therefore, the moderate positive correlations for IAA and IAC might arise from differences in the concentrations of these three compounds or alterations in their synergistic effects owing to varying concentration ratios.
The above results reveal that CGA, IAA, IAB, and IAC are antioxidant-active compounds in L. macranthoides, and these four compounds could serve as indicators for quality evaluation. Based on these findings, active components can be rapidly identified by characterizing the correlation between characteristic components and antioxidant activity. Our results also suggest that combining multiple chemometric methods is fast and effective for exploring active components, identifying Q-markers, and elucidating the relationship between fingerprints and active components.

3. Materials and Methods

3.1. Materials

The 50 Lonicerae Flos samples derived from L. marcanthoides used in this study were collected in 2022 (Table 4). Among these, 21 samples were sourced from Chongqing, China, with 10 samples originating from Xiushan County, Chongqing, China, and 11 from other regions within Chongqing, China. In addition, six samples were collected from Longhui County in Hunan Province, China, and three from Bazhong City in Sichuan Province, China. All aforementioned samples were derived from unopened breeds of L. macranthoides. Furthermore, 2 samples were sourced from unopened breeds, whereas 18 samples were sourced from open wild-type breeds (primarily in the early stages) of L. macranthoides in Suiyang County, Guizhou Province, China. All samples were sealed in plastic bags at room temperature (15 to 25 °C) to avoid sunlight exposure. Vouchers were deposited at the Chongqing Academy of Chinese Materia Medica in Chongqing, China.

3.2. Chemicals and Reagents

Chemical standards of CGA, NA, CA, IAA, IAB, IAC, MB, MA, and DB were purchased from Shanghai Yuanye Biotechnology Co., Ltd. (Shanghai, China) with purities of ≥98%.
HPLC-grade methanol and acetonitrile were purchased from TEDIA (Fairfield, OH, USA), whereas HPLC-grade formic acid was procured from Aladdin (Shanghai, China). Analytical-grade methanol was sourced from Chongqing Chuandong Chemical (Group) Co., Ltd. (Chongqing, China). In addition, K2S2O8 was purchased from Shanghai Macklin Biochemical Co., Ltd. (Shanghai, China), whereas ABTS and DPPH were obtained from Shanghai Yuanye Biotechnology Co., Ltd. (Shanghai, China). Ultrapure water (18.2 MΩ) was filtered using a Milli-Q Integral 5 water purification system (Millipore, Billerica, MA, USA).

3.3. Preparation of Standard and Sample Solutions for HPLC Analysis

Standard solutions were prepared using standard compounds. CGA, NA, CA, IAA, IAB, IAC, MB, MA, and DB were accurately weighed and dissolved in 50% methanol to achieve concentrations of 9.345, 1.355, 1.445, 5.050, 0.215, 0.158, 9.515, 2.635, and 3.215 mg.mL−1, respectively. The standard compound mixture solution was further diluted 5, 10, 15, 25, 50, and 100 times. The linear relationship for calibration was obtained by plotting the peak area against the corresponding concentration of each analyte.
Lonicerae Flos samples were heated at 60 °C for at least 30 min before use, ground into powder, and passed through a 48-mesh (300 μm) sieve. The resulting fine powder was stored away from sunlight at room temperature until analysis. Subsequently, 250 mg of fine powder from each sample was weighed and extracted in a 25 mL volumetric flask using 50% methanol under supersonic (300 W) conditions for 60 min. After cooling the solution to room temperature, methanol was added to the scale line and the solution was centrifuged at 5000 rpm for 10 min. The supernatant was then filtered through a 0.45 μm filter (Tianjin Jinteng Experiment Equipment Co., Ltd., Tianjin, China) for HPLC analysis. Each sample was prepared in triplicate.

3.4. HPLC Conditions

The HPLC system (Agilent, Santa Clara, CA, USA) was equipped using a G1311A quat pump, G1322A degasser, G1329A auto-sampler, G1316A column oven, and G1315B DAD detector. HPLC analysis was conducted using an Agilent 1200 system (Agilent, USA) with an RD C18 column (4.6 mm × 250 mm, 3 μm). The mobile phase comprised Solvent A (0.1% formic acid in water, v/v) and Solvent B (acetonitrile), with a gradient elution profile: 0 min, 10% B; 20 min, 20% B; 35 min, 30% B; 40 min, 35% B; 45 min, 50% B; 50 min, 50% B; and 51 min, 10% B. The flow rate of the mobile phase was 0.6 mL/min, and the column temperature was maintained at 35 °C. Detection was conducted at a wavelength of 326 nm, with an injection volume of 5 μL.
Evaporative light scattering detection was conducted using an Alltech ELSD 2000ES instrument (Champaign, IL, USA). Dry condensed air served as the carrier gas at a flow rate of 2 L/min, whereas the detector temperature was maintained at 55 °C.

3.5. HPLC Method Validation

Precision was evaluated by conducting six analyses of a standard solution containing nine standard compounds, and the relative standard deviation (RSD) of the peak area for each standard compound was calculated. Repeatability was assessed by analyzing six sample solutions, with variations expressed as RSD. One sample solution was analyzed at 0, 1, 2, 4, 6, 8, 16, and 24 h to investigate stability. The accuracy of the method was assessed using a recovery test. Standard compounds were weighed to approximately 100% of their original amount and added to the CQ3 sample powder. This sample, containing the standard compounds, was then extracted and analyzed using the aforementioned method.

3.6. Sample Process for Oxidation Resistance Assay

To assess the oxidative resistance activities of the Lonicerae Flos samples and identify the compounds contributing to these activities, 32 samples derived from the unopened type of L. macranthoides were selected for an oxidation resistance assay. For each sample, 0.02 g of fine powder was placed in a 15 mL centrifugation tube and 10 mL of distilled water was added. The powder was then subjected to extraction under supersonic (300 W) conditions for 30 min. Thereafter, the solution was centrifuged at 10,000 rpm for 10 min, and the supernatant was used for the analysis. Each sample was analyzed in triplicate.

3.7. ABTS Free Radical Scavenging Assay

The ABTS radical cation was prepared by mixing 3 mL of ABTS (7.4 mM) with 3 mL of K2S2O8 (2.6 mM) for 12–16 h at room temperature in the dark. The resulting mixture was diluted with distilled water until it reached an absorbance of 0.70 ± 0.10 at 734 nm. Next, 20 μL of the sample extraction was combined with 180 μL of the ABTS radical cation solution and allowed to react for 10 min in darkness at room temperature. The absorbance was then measured at 734 nm using a microplate reader (TECAN DNA Export, Morrisville, NC, USA), and the resulting value was recorded as At. To establish the baseline, 200 μL of distilled water was measured as a blank (Ab). In addition, 20 μL of distilled water, used as the sample powder and processed as described in the previous section, served as the negative control, and its final absorbance was recorded as A0. The ABTS radical clearing ratio was calculated using Formula (1):
ABTS radical scavenging activity = [A0 − (At − Ab)]/A0 × 100%.

3.8. DPPH-Free Radical Scavenging Assay

Initially, 50 μL of the sample extraction was combined with 1000 μL of freshly prepared 0.5 M DPPH radical cation solution, gently mixed, and allowed to react for 40 min in the dark at room temperature. Subsequently, the absorbance was measured at 517 nm using a microplate reader (TECAN DNA Export, USA), and the resulting value was recorded as Ax0. For the assay, 50 μL of absolute ethyl alcohol was used as the sample powder and extracted as described in the previous section, and its absorbance was recorded as A0. To eliminate the color contribution from the sample powder, the absorbance of 50 μL of the extraction mixed with 100 μL of absolute ethyl alcohol was measured and recorded as Ax. The DPPH radical clearing ratio was calculated using Formula (2):
DPPH radical scavenging activity = [A0 − (Ax0 − Ax)]/A0 × 100%.

3.9. Multivariate Analysis

OPLS-DA was conducted on the 50 Lonicerae Flos samples derived from L. macranthoides to characterize the components of samples from different regions and breeds. PCA, PLS regression, and heatmap analysis were conducted to elucidate the relationship between HPLC chromatograms and antioxidant activity. The data matrix used for OPLS-DA was created using the HPLC peak areas of the 50 samples. By contrast, the data matrix used for PCA, PLS regression, and heatmap analysis was created using HPLC peak areas and ABTS/DPPH scavenging activity data of 32 crude drug samples. Both data matrices were normalized using the Z-score transformation method, as described in our previous studies [46,47]. SIMCA-P (Version 14.1, Umetrics, Umea, Sweden) was used for OPLS-DA, PCA, and PLS regression, whereas Origin 2021 (Version 9.8; MicroCal, LLC, Malvern, UK) was used for heatmap analysis

4. Conclusions

Fifty samples of Lonicerae Flos were collected that were sourced from various regions and different breeds in Southwest China. These samples underwent quantitative analysis using HPLC for six organic acids and three saponin compounds alongside antioxidant assays using ABTS and DPPH radical scavenging experiments. All samples met the quality standards outlined in the Chinese Pharmacopoeia and exhibited high quality owing to their elevated levels of nine bioactive compounds. In particular, samples from Chongqing and Hunan displayed similar quality, those from Sichuan exhibited relatively lower quality, and samples from Guizhou, particularly the unopened and open wild types, demonstrated higher quality. However, relatively significant fluctuations in quality were observed among samples derived from the open wild-type. In addition, all samples exhibited strong radical scavenging abilities in the ABTS and DPPH assays, with the tendencies observed in the bioactive compound contents. Multivariate analysis identified CGA, IAA, IAB, and IAC as active antioxidant compounds in Lonicerae Flos. These results contribute to the quality control of Lonicerae Flos and provide a foundation for cultivating L. macranthoides.

Author Contributions

Q.L. performed the study design, analyzed the data, and wrote and revised the manuscripts. H.Y. performed the antioxidative assay. Y.D. provided technical support for the multivariate analysis data and image analysis, as well as the revision of the manuscripts. W.Q. helped with the HPLC-ELSD experiments. Z.S. also contributed to processing data and image analysis. L.L. conceived and designed the study experiments idea and has collected all the samples. All authors have read and agreed to the published version of the manuscript.

Funding

This research was funded by the China Agriculture Research System of MFO and MARA (CARS-21), Research on the industrialization of geo-authentic Chinese medicine and the discovery of new Chinese medicine in Chongqing (CSTB2023JXJL-YFX0051).

Institutional Review Board Statement

Not applicable.

Informed Consent Statement

Not applicable.

Data Availability Statement

The data presented in this study are available upon request from the corresponding author.

Conflicts of Interest

The authors declare no conflicts of interest.

References

  1. Liu, J.; Zhang, J.; Wang, F.; Zou, Y.; Chen, X. Isolation and Characterization of New Minor Triterpenoid Saponins from the Buds of Lonicera macranthoides. Carbohydr. Res. 2013, 370, 76–81. [Google Scholar] [CrossRef] [PubMed]
  2. Gao, Y.; Wang, F.; Liu, Q.; Qi, Y.; Wang, Q.; Liu, H. Comparison of Anti-Inflammatory Effects of Lonicerae japonicae flos and Lonicerae flos Based on Network Pharmacology. Chin. Herb. Med. 2021, 13, 332–341. [Google Scholar] [CrossRef] [PubMed]
  3. Yang, R.; Fang, L.; Li, J.; Zhao, Z.; Zhang, H.; Zhang, Y. Separation of Five Iridoid Glycosides from Lonicerae japonicae flos Using High-Speed Counter-Current Chromatography and Their Anti-Inflammatory and Antibacterial Activities. Molecules 2019, 24, 197. [Google Scholar] [CrossRef] [PubMed]
  4. Li, Y.; Li, W.; Fu, C.; Song, Y.; Fu, Q. Lonicerae japonicae flos and Lonicerae flos: A Systematic Review of Ethnopharmacology, Phytochemistry and Pharmacology. Phytochem. Rev. Proc. Phytochem. Soc. Eur. 2020, 19, 1–61. [Google Scholar] [CrossRef] [PubMed]
  5. Chen, Z.; Tang, N.; You, Y.; Lan, J.; Liu, Y.; Li, Z. Transcriptome Analysis Reveals the Mechanism Underlying the Production of a High Quantity of Chlorogenic Acid in Young Leaves of Lonicera macranthoides Hand.-Mazz. PLoS ONE 2015, 10, e0137212. [Google Scholar] [CrossRef] [PubMed]
  6. Chinese Pharmacopoeia Commission. Pharmacopoeia of The People’s Republic of China; China Medical Science Press: Beijing, China, 2020; Volume I, pp. 268–269. [Google Scholar]
  7. Wen, Q.; Shu, B.; Ding, Y.; Hu, L.; Fang, L. General Situation of Resource Distribution and Development of Planting Technique of Lonicera Japonica Flos and Lonicera Flos. China Pharm. 2018, 27, 004. [Google Scholar]
  8. Kang, K.B.; Kang, S.-J.; Kim, M.S.; Lee, D.Y.; Han, S.I.; Kim, T.B.; Park, J.Y.; Kim, J.; Yang, T.-J.; Sung, S.H. Chemical and Genomic Diversity of Six Lonicera Species Occurring in Korea. Phytochemistry 2018, 155, 126–135. [Google Scholar] [CrossRef] [PubMed]
  9. Sun, Z.; Gao, T.; Yao, H.; Shi, L.; Zhu, Y.; Chen, S. Identification of Lonicera Japonica and Its Related Species Using the DNA Barcoding Method. Planta Med. 2011, 77, 301–306. [Google Scholar] [CrossRef] [PubMed]
  10. Li, W.; Zhang, L.; He, P.; Li, H.; Pan, X.; Zhang, W.; Xiao, M.; He, F. Traditional Uses, Botany, Phytochemistry, and Pharmacology of Lonicerae japonicae flos and Lonicerae flos: A Systematic Comparative Review. J. Ethnopharmacol. 2024, 322, 117278. [Google Scholar] [CrossRef] [PubMed]
  11. Clifford, M.N.; Knight, S.; Surucu, B.; Kuhnert, N. Characterization by LC-MS(n) of Four New Classes of Chlorogenic Acids in Green Coffee Beans: Dimethoxycinnamoylquinic Acids, Diferuloylquinic Acids, Caffeoyl-Dimethoxycinnamoylquinic Acids, and Feruloyl-Dimethoxycinnamoylquinic Acids. J. Agric. Food Chem. 2006, 54, 1957–1969. [Google Scholar] [CrossRef]
  12. Mahesh, V.; Million-Rousseau, R.; Ullmann, P.; Chabrillange, N.; Bustamante, J.; Mondolot, L.; Morant, M.; Noirot, M.; Hamon, S.; De Kochko, A.; et al. Functional Characterization of Two P-Coumaroyl Ester 3′-Hydroxylase Genes from Coffee Tree: Evidence of a Candidate for Chlorogenic Acid Biosynthesis. Plant Mol. Biol. 2007, 64, 145–159. [Google Scholar] [CrossRef] [PubMed]
  13. Zhang, S.; Yang, C.; Idehen, E.; Shi, L.; Lv, L.; Sang, S. Novel Theaflavin-Type Chlorogenic Acid Derivatives Identified in Black Tea. J. Agric. Food Chem. 2018, 66, 3402–3407. [Google Scholar] [CrossRef] [PubMed]
  14. Xiong, L.; Yang, J.; Jiang, Y.; Lu, B.; Hu, Y.; Zhou, F.; Mao, S.; Shen, C. Phenolic Compounds and Antioxidant Capacities of 10 Common Edible Flowers from China. J. Food Sci. 2014, 79, C517–C525. [Google Scholar] [CrossRef]
  15. Narváez-Cuenca, C.-E.; Vincken, J.-P.; Gruppen, H. Quantitative Fate of Chlorogenic Acid during Enzymatic Browning of Potato Juice. J. Agric. Food Chem. 2013, 61, 1563–1572. [Google Scholar] [CrossRef] [PubMed]
  16. Ma, K.; Sheng, W.; Song, X.; Song, J.; Li, Y.; Huang, W.; Liu, Y. Chlorogenic Acid from Burdock Roots Ameliorates Oleic Acid-Induced Steatosis in HepG2 Cells through AMPK/ACC/CPT-1 Pathway. Molecules 2023, 28, 7257. [Google Scholar] [CrossRef]
  17. Lu, H.; Tian, Z.; Cui, Y.; Liu, Z.; Ma, X. Chlorogenic Acid: A Comprehensive Review of the Dietary Sources, Processing Effects, Bioavailability, Beneficial Properties, Mechanisms of Action, and Future Directions. Compr. Rev. Food Sci. Food Saf. 2020, 19, 3130–3158. [Google Scholar] [CrossRef]
  18. Rivelli, D.P.; Filho, C.A.H.; Almeida, R.L.; Ropke, C.D.; Sawada, T.C.H.; Barros, S.B.M. Chlorogenic Acid UVA–UVB Photostability. Photochem. Photobiol. 2010, 86, 1005–1007. [Google Scholar] [CrossRef]
  19. Kundu, A.; Vadassery, J. Chlorogenic Acid-Mediated Chemical Defence of Plants against Insect Herbivores. Plant Biol. Stuttg. Ger. 2019, 21, 185–189. [Google Scholar] [CrossRef]
  20. Martínez, G.; Regente, M.; Jacobi, S.; Rio, M.D.; Pinedo, M.; de la Canal, L. Chlorogenic Acid Is a Fungicide Active against Phytopathogenic Fungi. Pestic. Biochem. Physiol. 2017, 140, 30–35. [Google Scholar] [CrossRef]
  21. Yang, X.; Lan, W.; Xie, J. Antimicrobial and Anti-Biofilm Activities of Chlorogenic Acid Grafted Chitosan against Staphylococcus aureus. Microb. Pathog. 2022, 173, 105748. [Google Scholar] [CrossRef]
  22. Xiong, S.; Su, X.; Kang, Y.; Si, J.; Wang, L.; Li, X.; Ma, K. Effect and Mechanism of Chlorogenic Acid on Cognitive Dysfunction in Mice by Lipopolysaccharide-Induced Neuroinflammation. Front. Immunol. 2023, 14, 1178188. [Google Scholar] [CrossRef] [PubMed]
  23. Bal, E.; Hanalıoğlu, Ş.; Apaydın, A.S.; Bal, C.; Şenat, A.; Gümüşkaya, B.; Bahadır, B.; Türkoğlu, Ö.F. Can Chlorogenic Acid Reduce Oxidative Stress and in an Experimental Spinal Cord Injury? Turk. J. Trauma Emerg. Surg. 2022, 28, 125–133. [Google Scholar] [CrossRef] [PubMed]
  24. Kumar, R.; Sharma, A.; Iqbal, M.S.; Srivastava, J.K. Therapeutic Promises of Chlorogenic Acid with Special Emphasis on Its Anti-Obesity Property. Curr. Mol. Pharmacol. 2020, 13, 7–16. [Google Scholar] [CrossRef] [PubMed]
  25. Yin, X.; Xiang, Y.; Huang, F.; Chen, Y.; Ding, H.; Du, J.; Chen, X.; Wang, X.; Wei, X.; Cai, Y.; et al. Comparative Genomics of the Medicinal Plants Lonicera macranthoides and L. Japonica Provides Insight into Genus Genome Evolution and Hederagenin-based Saponin Biosynthesis. Plant Biotechnol. J. 2023, 21, 2209–2223. [Google Scholar] [CrossRef]
  26. Podolak, I.; Galanty, A.; Sobolewska, D. Saponins as Cytotoxic Agents: A Review. Phytochem. Rev. 2010, 9, 425–474. [Google Scholar] [CrossRef] [PubMed]
  27. Fang, Z.; Li, J.; Yang, R.; Fang, L.; Zhang, Y. A Review: The Triterpenoid Saponins and Biological Activities of Lonicera Linn. Molecules 2020, 25, 3773. [Google Scholar] [CrossRef] [PubMed]
  28. Pirtskhalava, M.; Mittova, V.; Tsetskhladze, Z.R.; Palumbo, R.; Pastore, R.; Roviello, G.N. Georgian Medicinal Plants as Rich Natural Sources of Antioxidant Derivatives: A Review on the Current Knowledge and Future Perspectives. Curr. Med. Chem. 2024, in press. [Google Scholar] [CrossRef]
  29. Chen, Y.; Li, S.; Lin, X.; Luo, H.; Li, G.; Yao, H. On-Line Screening and Identification of Radical Scavenging Compounds Extracted from Flos Lonicerae by LC-DAD–TOF-MS. Chromatographia 2008, 68, 327–332. [Google Scholar] [CrossRef]
  30. Li, Y.; Chen, J.; Li, Y.; Li, P. Identification and Quantification of Free Radical Scavengers in the Flower Buds of Lonicera Species by Online HPLC-DPPH Assay Coupled with Electrospray Ionization Quadrupole Time-of-flight Tandem Mass Spectrometry. Biomed. Chromatogr. 2012, 26, 449–457. [Google Scholar] [CrossRef]
  31. Liu, S.; Qiao, Z.; Liu, X.; Wang, X.; Zeng, H.; Li, Y.; Cai, N. Comparative Transcriptome Analysis of Corolla Opening in Lonicera macranthoides between Bud Type and Common Type. Mol. Plant Breed. 2021, 19, 1822–1829. [Google Scholar] [CrossRef]
  32. Li, L.; Zhang, Y.; Ma, P.; Wu, Y. Study on optimal harvest period of Lonicera Flos (Lonicera macranthoides). China J. Chin. Mater. Medica 2014, 39, 3060–3064. [Google Scholar] [CrossRef]
  33. Xiao, Z.; Xie, M.; Gan, L.; Fang, M.; Zhou, X.; Zhou, Y.; He, W.; Chen, L.; Huang, J. Determination of chlorogenic acid, total flavones, and anti-oxidant activity of Flos Lonicerae Japonicae and Flos Lonicerae. Chin. Tradit. Herb. Drugs 2019, 50, 210–216. [Google Scholar] [CrossRef]
  34. Wu, F.; Qing, Z.; Zeng, J. HPLC determination of chlorogenic acid and galuteolin in different parts of Lonicera macranthoides. Mod. Chin. Med. 2014, 16, 614–617. [Google Scholar] [CrossRef]
  35. Liu, M.; Gao, S.; Liu, L.; Zhang, Y.; Nian, L.; Liu, X. Simultaneous determination of six organic acids in Lonicerae japonicae flos and Lonicerae flos in different habitats by HPLC. Zhong Yao Cai Zhongyaocai J. Chin. Med. Mater. 2013, 36, 196–198. [Google Scholar] [CrossRef]
  36. Sun, L.; Fan, X.; Guo, Q.; Zhang, X.; Chen, L. Simultaneous determination of 5 saponins in Lonicerae flos by QAMS method. China Pharm. 2017, 28, 2546–2549. [Google Scholar] [CrossRef]
  37. Tian, A.; Zhou, W.; Wen, S.; Huang, G.; Xu, Q.; Li, H. Advances in flue-cured tobacco chlorogenic acid content factors. Anhui Agric. Sci. Bull. 2016, 22, 22–25. [Google Scholar] [CrossRef]
  38. Zhang, P.; Pu, G. Study on influences of climatic factors to chlorogenic acid content in Flos lonicerae. Shandong Agric. Sci. 2015, 47, 77–79. [Google Scholar] [CrossRef]
  39. Chen, S.; Zhang, S.; Yang, M.; Li, H. Effects of different altitudes on quality of Lonicerae flos. Agric. Res. Appl. 2023, 36, 8–12. [Google Scholar]
  40. Rivera-Pérez, A.; Romero-González, R.; Garrido Frenich, A. A Metabolomics Approach Based on 1H NMR Fingerprinting and Chemometrics for Quality Control and Geographical Discrimination of Black Pepper. J. Food Compos. Anal. 2022, 105, 104235. [Google Scholar] [CrossRef]
  41. Galindo-Prieto, B.; Trygg, J.; Geladi, P. A New Approach for Variable Influence on Projection (VIP) in O2PLS Models. Chemom. Intell. Lab. Syst. 2017, 160, 110–124. [Google Scholar] [CrossRef]
  42. Liu, H.; Zhu, S.; Liu, Q.; Zhang, Y. Spectrum–Effect Relationship Study between HPLC Fingerprints and Antioxidant of Honeysuckle Extract. Biomed. Chromatogr. 2019, 33, e4583. [Google Scholar] [CrossRef] [PubMed]
  43. Sato, Y.; Itagaki, S.; Kurokawa, T.; Ogura, J.; Kobayashi, M.; Hirano, T.; Sugawara, M.; Iseki, K. In Vitro and in Vivo Antioxidant Properties of Chlorogenic Acid and Caffeic Acid. Int. J. Pharm. 2011, 403, 136–138. [Google Scholar] [CrossRef] [PubMed]
  44. Xu, J.-G.; Hu, Q.-P.; Liu, Y. Antioxidant and DNA-Protective Activities of Chlorogenic Acid Isomers. J. Agric. Food Chem. 2012, 60, 11625–11630. [Google Scholar] [CrossRef] [PubMed]
  45. Hu, X.; Chen, L.; Shi, S.; Cai, P.; Liang, X.; Zhang, S. Antioxidant Capacity and Phenolic Compounds of Lonicerae macranthoides by HPLC–DAD–QTOF-MS/MS. J. Pharm. Biomed. Anal. 2016, 124, 254–260. [Google Scholar] [CrossRef] [PubMed]
  46. Batsukh, Z.; Toume, K.; Javzan, B.; Kazuma, K.; Cai, S.; Hayashi, S.; Atsumi, T.; Yoshitomi, T.; Uchiyama, N.; Maruyama, T.; et al. Characterization of Metabolites in Saposhnikovia divaricata Root from Mongolia. J. Nat. Med. 2021, 75, 11–27. [Google Scholar] [CrossRef]
  47. Dong, Y.; Toume, K.; Zhu, S.; Shi, Y.; Tamura, T.; Yoshimatsu, K.; Komatsu, K. Metabolomics Analysis of Peony Root Using NMR Spectroscopy and Impact of the Preprocessing Method for NMR Data in Multivariate Analysis. J. Nat. Med. 2023, 77, 792–816. [Google Scholar] [CrossRef]
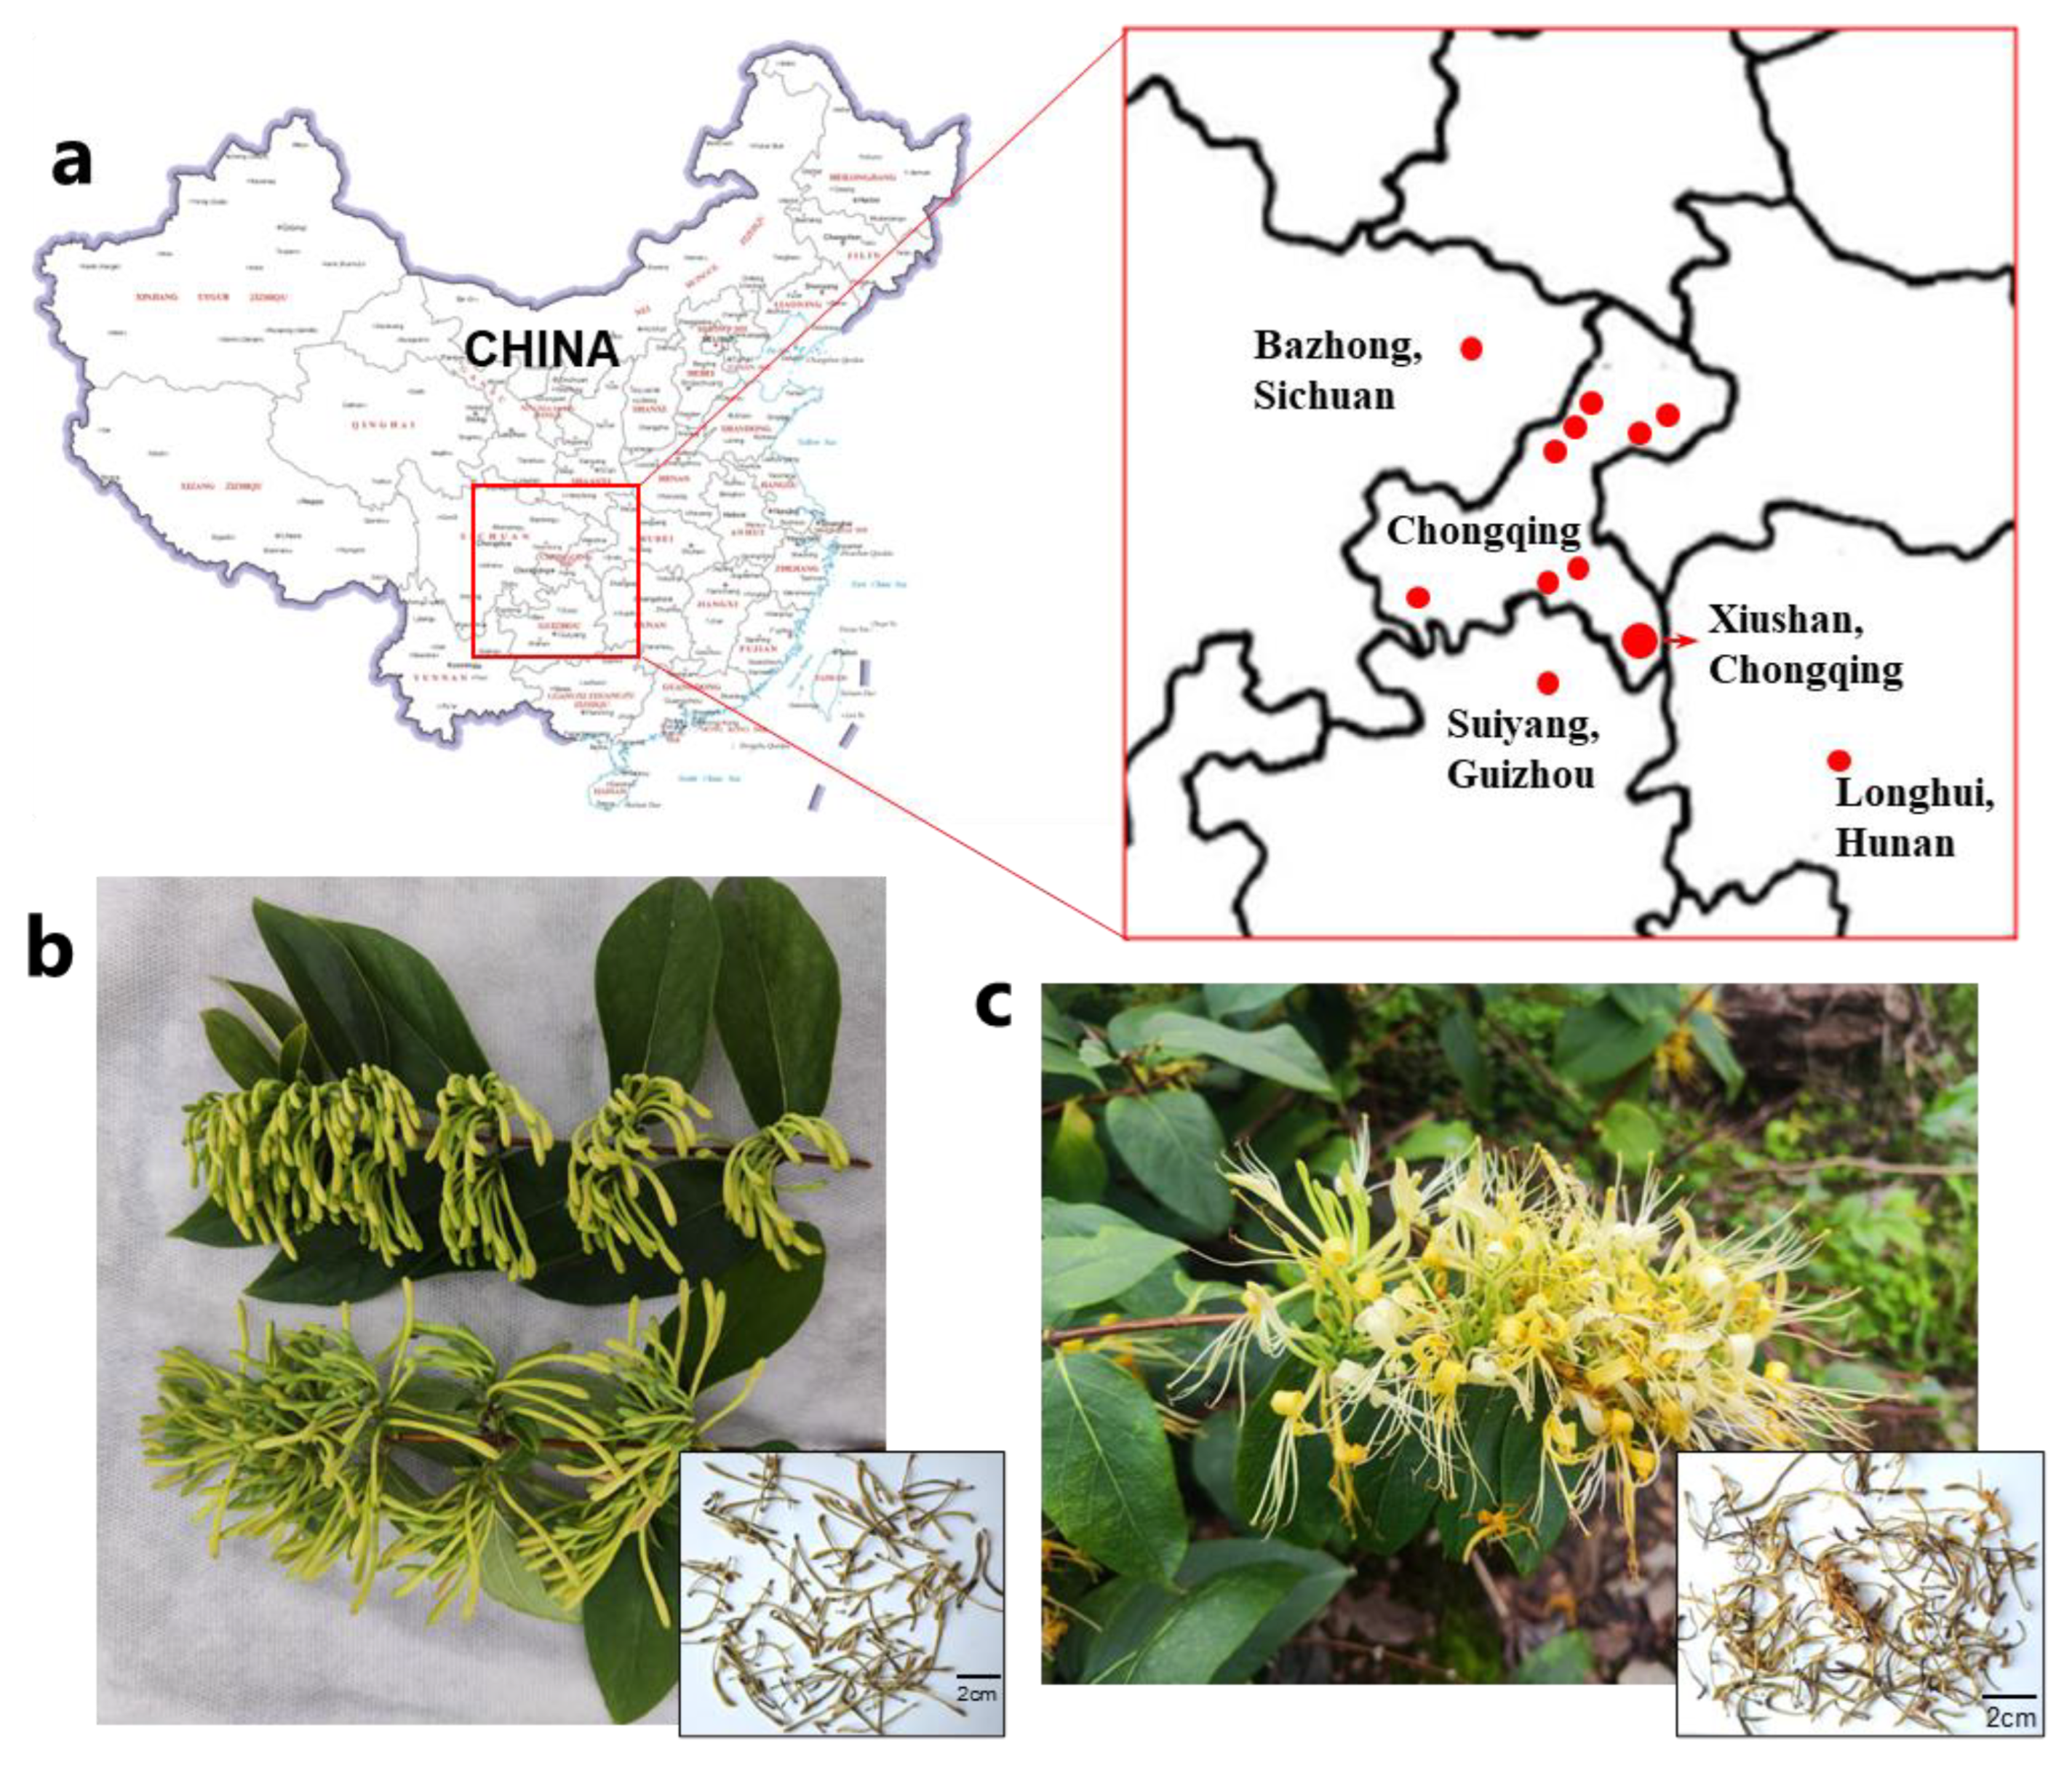
Figure 1. Different Lonicerae Flos-producing regions and L. macranthoides breeds. (a) Producing regions of Lonicerae Flos in this study. (b) Unopened-type L. macranthoides and the derived Lonicerae Flos. (c) Open wild type of L. macranthoides and the derived Lonicerae Flos.
Molecules 29 02560 g001
Figure 2. Structures of reference compounds.
Molecules 29 02560 g002
Figure 3. Representative HPLC chromatograms of L. macranthoides samples and standard compounds. CGA: chlorogenic acid; NA: neochlorogenic acid; CA: cryptochlorogenic acid; IAA: isochlorogenic acid A; IAB: iso-chlorogenic acid B; IAC: isochlorogenic acid C; MB: macranthoidin B; MA: macranthoidin A; DB: dipsacoside B. (a) HPLC-DAD chromatogram of six chemical standard phenolic acid compounds. (b) HPLC-ELSD chromatograms of three chemical standard saponin compounds. (c) HPLC-DAD chromatogram of sample CQ3. (d) HPLC-ELSD chromatogram of sample CQ3.
Molecules 29 02560 g003
Figure 4. Quantitative results of L. macranthoides: (a) relative contents of six phenolic acid compounds and (b) three saponin compounds. The samples were distinguished by dashed lines according to different producing areas or breeds.
Molecules 29 02560 g004
Figure 5. OPLS-DA results of 50 L. macranthoides samples: (a) score plot, circles with different colors indicate the samples produced in different regions of China; (b) loading plot, X (green) indicates compounds analyzed in this study, and Y (blue) indicates the different producing regions (response variables) of the samples.
Molecules 29 02560 g005
Figure 6. PCA results of 32 L. macranthoides samples using the data matrix created by HPLC quantitative data and antioxidant capacity. The square indicates each sample, the circle indicates compounds, and the triangle indicates the antioxidant capacity of the crude drug samples.
Molecules 29 02560 g006
Figure 7. Heatmap using Pearson’s correlation analysis of the compound contents and antioxidant capacity of crude drug samples. The numerals on the graph indicate Pearson’s correlation coefficient; alphabetical abbreviations indicate compound names; and ABTS and DPPH indicate ABTS and DPPH free radical scavenging activity, respectively.
Molecules 29 02560 g007
Figure 8. VIP score and coefficient plot of PLS regression using compounds (X variables) and antioxidant activity (Y variables). (a,b) are under the ABTS scavenging activity condition, and (c,d) are under the DPPH scavenging activity condition.
Molecules 29 02560 g008
Table 1. Regression equations, correlation coefficients, linearity ranges, precisions, repeatability, stability, and recovery for nine analytes.
ComponentCalibration Curve EquationrLinear Range (mg/mL)Precision (RSD%) n = 6Repeatability (RSD%)
n = 6
Stability (RSD%) n = 8Recovery (%)
n = 6
RSD%
CGAy = 23722x + 494.290.99930.098–0.9351.570.420.36100.501.45
NAy = 23991x + 85.4490.99990.014–0.2711.950.240.36100.671.13
CAy = 18329x + 58.610.99990.015–0.2891.602.601.4099.001.91
IAAy = 27927x + 240.890.99990.053–0.5051.901.400.3493.991.55
IABy = 22053x + 12.8290.99970.002–0.0431.481.461.6699.891.22
IACy = 23732x − 70.1030.99960.002–0.0321.731.811.3999.891.61
MBy = 732336x − 793860.99830.010–1.9031.140.131.14100.411.53
MAy = 503752x − 9198.30.99260.028–0.5270.792.131.0999.561.47
DBy = 482044x − 258910.99780.033–0.6250.970.701.63100.131.59
CGA: chlorogenic acid; NA: neochlorogenic acid; CA: cryptochlorogenic acid; IAA: isochlorogenic acid A; IAB: iso-chlorogenic acid B; IAC: isochlorogenic acid C; MB: macranthoidin B; MA: macranthoidin A; DB: dipsacoside B; r: correlation coefficient; RSD: relative standard deviation.
Table 2. The contents of nine compounds in samples.
Producing AreaVoucher No.CGANACAIAAIABIACSUM of Six Phenolic AcidsMBDBMASUM of MB&DBSUM of Three Saponins
ChongqingCQ14.4260.6670.2002.8040.0920.0828.2706.7971.0040.6517.8028.452
CQ24.3570.9770.3001.7380.0960.0757.5426.0751.0200.7367.0947.830
CQ33.3260.4960.1172.1670.0560.1166.2787.1031.0440.6608.1478.807
CQ44.4550.7480.1712.4630.0690.0978.0037.8501.1170.7958.9679.763
CQ53.3590.6870.1851.8760.0860.0876.2814.1020.9540.7045.0565.761
CQ63.2960.7210.2451.8100.1070.0796.2576.1201.2880.7267.4078.133
CQ74.5760.7630.2242.1400.0860.0827.8707.2341.0640.6518.2988.949
CQ84.9471.1440.3141.8860.1250.0898.5058.6220.9420.5929.56410.156
CQ94.6580.9900.2741.6710.1020.0877.7827.0571.2630.5608.3208.880
CQ103.5690.7180.1861.8580.0780.0776.4867.0391.2140.4488.2538.701
CQ115.5391.0770.3152.1240.1020.0879.2446.4790.8870.5407.3667.906
XS14.7110.8370.2681.7460.0980.0807.7395.9230.8780.6106.8017.411
XS24.2870.9380.2911.9790.1120.0747.6826.0140.8930.4706.9067.376
XS34.4651.0260.3041.9340.1220.0997.9506.1111.1020.7147.2137.926
XS44.2921.0260.3012.0950.1260.0827.9236.2201.4130.8497.6328.481
XS54.8290.9080.2542.1610.1020.0818.3356.9951.0640.6978.0598.756
XS65.2810.7480.2472.9110.1450.1059.4377.8501.1860.8659.0369.900
XS74.4310.9550.2981.9920.1120.0757.8646.2910.9390.6127.2307.842
XS83.7700.8010.2091.8650.1020.0926.8387.0740.9740.6108.0488.658
XS94.5490.9830.2612.1910.1100.0998.1935.8990.8360.3506.7357.086
XS104.6770.9170.2972.6220.1560.0988.7687.2401.3110.8958.5519.446
HunanLH14.4230.9730.2421.9350.1080.1037.7835.9300.9500.6886.8807.567
LH25.0330.8270.2432.9110.1320.1159.2616.8181.0060.6317.8248.456
LH35.0250.8280.2413.0190.1260.1199.3586.2751.2010.6907.4778.167
LH44.8050.8960.2502.2370.1080.0978.3935.9231.0190.6016.9427.543
LH54.9970.8670.2572.7780.1310.1159.1456.9421.1440.7308.0868.816
LH65.0200.8850.2733.0710.1440.1149.5087.5861.2000.8688.7869.654
SichuanBZ13.5980.7080.1901.7720.0650.0636.3957.1981.2410.8338.4399.272
BZ23.6870.7090.1861.8840.0670.0656.5987.1601.1730.8218.3329.153
BZ33.6080.6810.1811.8480.0640.0616.4426.7120.9140.6527.6268.278
GuizhouSY16.4830.6540.2233.6600.1300.10511.2557.5031.3190.9218.8229.743
SY27.8390.7530.2283.7970.1270.12012.8648.2641.1080.8719.37110.243
SYH15.8080.9060.4163.3320.2340.10910.8056.1581.2060.9467.3648.310
SYH25.5330.4870.2873.4040.2640.10510.0804.9511.2160.7476.1676.914
SYH34.4470.7700.3373.2970.2320.1039.1859.2151.1100.98410.32511.308
SYH46.4250.6910.2742.8690.1700.09510.5255.5831.0691.2026.6527.854
SYH54.2410.7900.2542.3750.1390.0887.8873.5511.4380.9394.9895.928
SYH65.3580.7250.3052.2730.1560.0798.8964.2201.0570.5205.2775.797
SYH77.0950.6300.2893.2390.1820.09311.5286.6470.9740.8167.6218.438
SYH85.3320.5320.2624.0880.2480.11810.5818.2821.1030.6249.38510.008
SYH95.4040.7130.2903.9140.2630.11810.7006.7571.1920.9407.9498.889
SYH104.5870.5500.2522.0370.1410.0837.6504.6191.3190.9575.9396.896
SYH115.4080.8790.4902.8800.2490.0859.9915.3311.0500.8276.3817.207
SYH126.0330.4500.3083.5000.2330.10510.6299.3451.3430.69810.68911.387
SYH136.8310.7780.3933.2940.2030.10811.6087.4921.7890.6359.2819.915
SYH145.0380.7280.3632.7700.2170.0909.2065.6711.3610.5507.0327.583
SYH154.5070.4640.1942.1000.1220.0767.4643.8881.2300.5145.1185.632
SYH165.2870.6060.2952.3390.1660.0748.7666.1191.5291.0107.6488.658
SYH176.7380.6270.3293.9930.2290.11112.0279.1681.5840.81310.75111.565
SYH186.7930.6070.2854.5820.2190.13912.62513.6521.3481.01615.00016.015
CGA: chlorogenic acid; NA: neochlorogenic acid; CA: cryptochlorogenic acid; IAA: isochlorogenic acid A; IAB: iso-chlorogenic acid B; IAC: isochlorogenic acid C; MB: macranthoidin B; MA: macranthoidin A; DB: dipsacoside B.
Table 3. The clearing ratio of water extraction of unopened L. macranthoides samples.
Voucher No.ABTSDPPH
Clearing Ratio %SDClearing Ratio %SD
CQ177.890.0358.240.06
CQ277.070.0255.500.02
CQ381.800.0258.090.05
CQ477.140.0253.850.05
CQ571.890.0252.650.07
CQ672.070.0248.450.06
CQ769.610.0351.240.07
CQ881.740.0362.590.06
CQ977.010.0257.190.06
CQ1072.460.0255.830.11
CQ1182.620.0168.180.02
XS180.800.0261.120.08
XS281.750.0261.340.05
XS382.340.0562.240.04
XS490.760.0262.260.05
XS577.010.0465.950.03
XS687.440.0167.070.05
XS781.830.0164.250.03
XS873.470.0262.160.02
XS981.620.0165.690.04
XS1086.450.0169.660.03
LH179.030.0261.720.04
LH288.380.0161.690.03
LH385.930.0163.890.04
LH479.210.0356.560.05
LH585.850.0261.760.02
LH687.600.0259.670.04
BZ168.390.0152.860.04
BZ272.760.0153.680.05
BZ371.570.0356.060.11
SY192.120.0171.370.05
SY292.520.0169.860.06
Table 4. Lonicerae Flos (derived from L. macranthoides) samples localities, voucher number, breeds, and harvest date.
Producing AreaVoucher No.L. macranthoides BreedsCollection Date
ChongqingZhong countyCQ1unopened type2022.6
Jiangjin districtCQ2unopened type2022.6
Kaizhou districtCQ3unopened type2022.7
Wanzhou districtCQ4unopened type2022.7
Pengshui countyCQ5unopened type2022.7
Kaizhou districtCQ6unopened type2022.7
Wulong districtCQ7unopened type2022.7
Fengjie countyCQ8unopened type2022.7
Fengjie countyCQ9unopened type2022.7
Fengjie countyCQ10unopened type2022.7
Yunyang countyCQ11unopened type2022.7
Liangshui village, Longfengba town, Xiushan countyXS1unopened type2022
Shiban village, Rongxi town, Xiushan countyXS2unopened type2022
Shuiyuan village, Longchi town, Xiushan countyXS3unopened type2022
Guiluo village, Zhongping town, Xiushan countyXS4unopened type2022
Pingyang village, Qingxichang, Xiushan countyXS5unopened type2022
Malu, Zhongling town, Xiushan countyXS6unopened type2022
Rongxi town, Xiushan countyXS7unopened type2022
Pingjian, Pingkai, Xiushan countyXS8unopened type2022
Xinqiao village, Cenxi town, Xiushan countyXS9unopened type2022
Bamang village, Aikou town, Xiushan countyXS10unopened type2022
HunanLonghui county, Shaoyang cityLH1unopened type2022
Longhui county, Shaoyang cityLH2unopened type2022
Longhui county, Shaoyang cityLH3unopened type2022
Longhui county, Shaoyang cityLH4unopened type2022
Longhui county, Shaoyang cityLH5unopened type2022
Longhui county, Shaoyang cityLH6unopened type2022
SichuanBazhong cityBZ1unopened type2022.8
Bazhong cityBZ2unopened type2022.8
Bazhong cityBZ3unopened type2022.8
GuizhouSuiyang county, Zunyi citySY1unopened type2022.9
Suiyang county, Zunyi citySY2unopened type2022.9
Suiyang county, Zunyi citySYH1open wild type2022.7
Suiyang county, Zunyi citySYH2open wild type2022.7
Suiyang county, Zunyi citySYH3open wild type2022.7
Suiyang county, Zunyi citySYH4open wild type2022.7
Suiyang county, Zunyi citySYH5open wild type2022.7
Suiyang county, Zunyi citySYH6open wild type2022.7
Suiyang county, Zunyi citySYH7open wild type2022.7
Suiyang county, Zunyi citySYH8open wild type2022.7
Suiyang county, Zunyi citySYH9open wild type2022.7
Suiyang county, Zunyi citySYH10open wild type2022.7
Suiyang county, Zunyi citySYH11open wild type2022.7
Suiyang county, Zunyi citySYH12open wild type2022.7
Suiyang county, Zunyi citySYH13open wild type2022.7
Suiyang county, Zunyi citySYH14open wild type2022.7
Suiyang county, Zunyi citySYH15open wild type2022.7
Suiyang county, Zunyi citySYH16open wild type2022.7
Suiyang county, Zunyi citySYH17open wild type2022.7
Suiyang county, Zunyi citySYH18open wild type2022.7
Disclaimer/Publisher’s Note: The statements, opinions and data contained in all publications are solely those of the individual author(s) and contributor(s) and not of MDPI and/or the editor(s). MDPI and/or the editor(s) disclaim responsibility for any injury to people or property resulting from any ideas, methods, instructions or products referred to in the content.