Abstract
Compound 7–16 was designed and synthesized in our previous study and was identified as a more potential selective 5-HT2A receptor antagonist and inverse agonist for treating Parkinson’s disease psychosis (PDP). Then, the metabolism, disposition, and excretion properties of 7–16 and its potential inhibition on transporters were investigated in this study to highlight advancements in the understanding of its therapeutic mechanisms. The results indicate that a total of 10 metabolites of 7–16/[14C]7–16 were identified and determined in five species of liver microsomes and in rats using UPLC-Q Exactive high-resolution mass spectrometry combined with radioanalysis. Metabolites formed in human liver microsomes could be covered by animal species. 7–16 is mainly metabolized through mono-oxidation (M470-2) and N-demethylation (M440), and the CYP3A4 isozyme was responsible for both metabolic reactions. Based on the excretion data in bile and urine, the absorption rate of 7–16 was at least 74.7%. 7–16 had weak inhibition on P-glycoprotein and no effect on the transport activity of OATP1B1, OATP1B3, OAT1, OAT3, and OCT2 transporters. The comprehensive pharmacokinetic properties indicate that 7–16 deserves further development as a new treatment drug for PDP.
1. Introduction
Parkinson’s disease psychosis (PDP) includes nonmotor symptoms experienced by almost 60% of individuals suffering from Parkinson’s disease, such as autonomic dysfunction, sensory disturbances, and neuropsychiatric manifestations including hallucinations, delusions, cognitive impairment, sleep disturbances, depression, and anxiety [1,2]. No antipsychotic drug had been indicated for PDP until the emergence of pimavanserin, a selective 5-HT2A receptor antagonist and inverse agonist, which was approved for listing in the USA in 2016 [3]. However, it’s reported that pimavanserin was associated with a potential risk of prolonged QT interval in patients [4,5]. In our previous study [6], a series of novel pimavanserin derivatives were designed and synthesized to improve its 5-HT2A receptor antagonist and inverse agonist activity so as to reduce clinical dosage. Fortunately, we found that compound 7–16 exhibited 50-fold higher 5-HT2A receptor antagonist activity (IC50 = 0.54 nM) and 23-fold higher inverse agonist activity (IC50 = 2.10 nM) than pimavanserin (IC50 = 27.3 and 50.0 nM, respectively), as well as decreased hERG inhibitory activity (IC50 = 1.10 nM), which was 2-fold weaker than that of pimavanserin. In vivo, it suggested that 7–16 was at least four times more potent than pimavanserin for blocking 5-HT2A receptors by the head twitches test in rats.
The development of safe and effective medications requires a profound understanding of their pharmacokinetic (PK) characteristics, which could be elucidated through investigation of drug absorption, disposition, metabolism, and excretion. Among these, metabolite identification contributes to understanding its pharmacological effects, selecting animal species in toxicology evaluation, and predicting toxicity [7]. Moreover, the in vivo study of metabolism and disposal is more critical in understanding metabolic pathways and rates and routes of excretion, which helps to identify and quantitate the exposure to metabolites and also to predict the safety of the parent drugs [8]. Wu et al. [9] studied and identified the metabolites of pimavanserin in rats, and a total of 23 metabolites were detected and identified using ultra-high performance liquid chromatography (UPLC) combined with Fourier transform ion cyclotron resonance high-resolution mass spectrometry (HRMS). However, the mass spectroscopy signal intensities generally cannot accurately estimate the actual abundance of metabolites in metabolism and excretion relative to the unchanged drug. Radioanalysis combined with UPLC-HRMS can provide accurate quantitative data for identified metabolites, which can lead to a better insight into the pharmacokinetic processes [10,11,12]. In addition, drug–drug interactions (DDIs) mediated by cytochrome P450 enzymes or those efflux/uptake transporters can impact the efficacy or toxicity of medications [13,14].
In this study, we carried out a series of experiments in vivo and in vitro to understand the PK characteristics of 7–16, including metabolite identification of 7–16 in liver microsomes of different species using UPLC-Q Exactive HRMS and a metabolism and excretion study of 7–16 in rats after oral administration of carbon 14 (14C) labeled 7–16 ([14C]7–16) by UPLC-Q Exactive HRMS and LC coupled with radioactivity monitor (LC-RAM). Meanwhile, the metabolic enzyme phenotype of 7–16 in human recombinant enzymes and the inhibition potential of 7–16 on the transport activity of several main efflux/uptake transporters are closely related to clinical DDIs, such as P-glycoprotein (P-gp), organic anion transporting polypeptides 1b1 and 1b3 (OATP1B1 and OATP1B3), organic anion transporters 1 and 3 (OAT1, OAT3), and organic cation transporter 2 (OCT2). These study results provided data support for the further development of 7–16.
2. Results and Discussion
2.1. Metabolite Identification in Liver Microsomes
As presented in Figure 1A, the [M + H]+ ion of 7–16 and its 14C labeled compound [14C]7–16 is observed at m/z 455.2054 (−2.4 ppm) and m/z 457.2097 (−1.1 ppm), respectively. The fragment ion of 7–16 is presented in Figure 1B, and fragment ions at m/z 224 and m/z 98 (N-methylpiperidine) are the main references for the analysis of metabolic sites of metabolites.
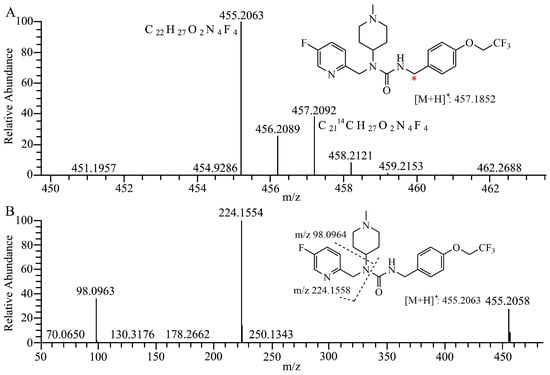
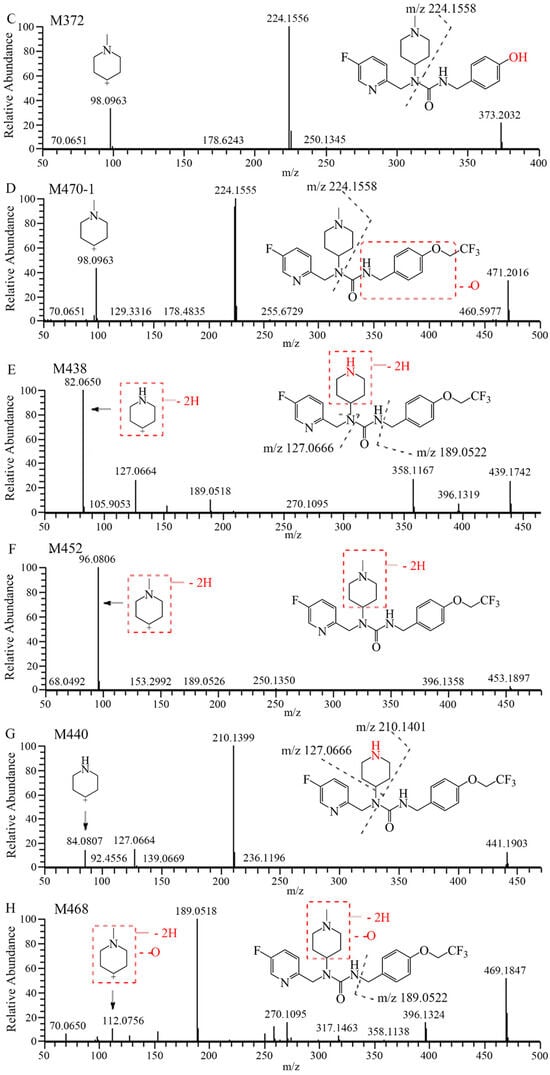
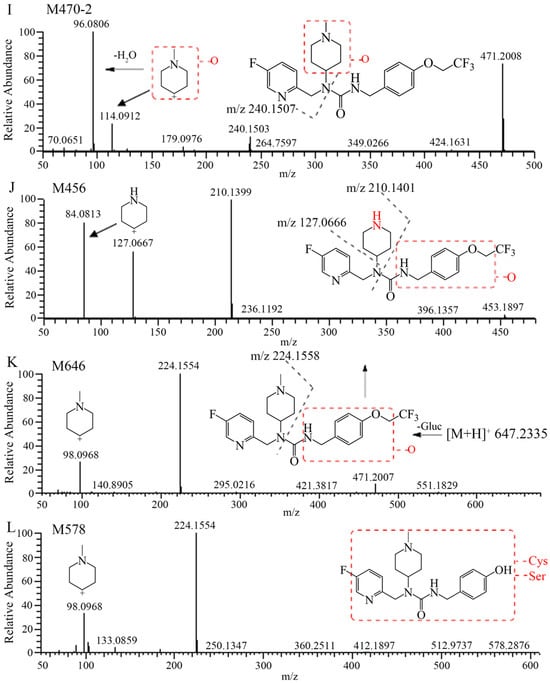
Figure 1.
Structures and full scan mass spectrum of 7–16 and [14C]7–16 (A) * 14C labeling site, product–ion spectra and proposed fragmentation pathways of 7–16 (B) and its metabolites (C–L).
The mass spectra, retention times, and relative abundance of 7–16 and its detected metabolites after incubation in liver microsomes from humans, mice, rats, dogs, and monkeys have been summarized in Table 1. The combined fragment ion mass analysis of 7–16 and its metabolites, as presented in Figure 1B–I, are identified as seven metabolites, including the O-dealkylation metabolite (M372), mono-oxidation metabolites (M470-1, M470-2), demethylation and dehydrogenation metabolite (M438), dehydrogenation metabolite (M452), N-demethylation metabolite (M440), and mono-oxidation and dehydrogenation metabolite (M468). M372 is identified as the loss of the trifluoroethyl group, decreasing its mass to 82 (C2HF3) compared with 7–16. M470-2, with the fragment ions of m/z 240 and m/z 114, features the increased oxygen molecules (16) from the fragment ions of 7–16 at m/z 224 and m/z 98, indicating that the oxidation occurred at the N-methylpiperidine group. M470-1 is oxidized at the trifluoroethoxy-benzy group because there were the same fragment ions of m/z 224 and m/z 98 as that of 7–16. M440 is identified as the demethylation metabolite, decreasing a mass loss of 14 compared with 7–16, with the characteristic fragment ions at m/z 210, m/z 127, and m/z 84. Furthermore, M438 and M452 produced characteristic fragment ions of m/z 82 and m/z 96, respectively, indicating that the dehydrogenation occurred in the piperidine group. Based on the presence of the characteristic fragment ions of m/z 189 and m/z 112, the dehydrogenation and oxidation site of the M468 is ascertained at the N-methylpiperidine group.

Table 1.
Summary of the metabolites of 7–16 detected in human, mouse, rat, dog, and monkey liver microsomes using the UPLC-Q Exactive HRMS.
After incubation of liver microsomes of five species, the parent drug accounted for the main proportion, with a relative abundance of 77.2–95.2%. M470-2 was the main metabolic product with a relative abundance of 2.53–17.3%. The relative abundances of other metabolites are observed to be less than 1.92%.
All the metabolites detected in humans are also found in animal species, demonstrating that no unique metabolites are formed in human liver microsomes after incubation at 37 °C for 60 min. The major metabolite M470-2 exhibits a relatively high abundance in animal species as compared with humans, whereas all other metabolites are present in similar proportions in both humans as well as animals, which provides data support for animal species selection for toxicology and safety evaluations of 7–16.
2.2. Metabolite Identification in Rat Plasma, Urine, Feces, and Bile
The extraction ion chromatograms and retention times of 7–16 and its metabolites in rat plasma, urine, feces, and bile samples after oral administration have been depicted in Figure 2. Table 2 lists the mass spectrum findings of the [14C]7–16 and its metabolites identified in rats. After analysis of the fragment ion mass of 7–16 and its metabolites, besides the seven metabolites found in microsomes (Figure 1C–I), three metabolites were found including the N-demethylation and mono-oxidation metabolite (M456), mono-oxidation and glucuronide conjugate (M646), and dealkylation and conjugated cysteine and serine (M578) (Figure 1J–L). The latter two are mainly found in bile. M456 has the same fragment ions (m/z 210, m/z 127, and m/z 84) as M440, so it was oxidized at the trifluoroethoxy-benzy group. M646 increased its mass 176 more than M470, and it had the fragment ions of m/z 224 and m/z 98, so it was oxidized and conjugated glucuronide at the trifluoroethoxy-benzy group. M578 had a mass increase of 206 compared with M372, having the same fragment ions (m/z 224 and m/z 98) as M372. Through accurate quality calculations, it was speculated by Thermo Compound Discover software (Version 3.3) that M578 was produced by M372 conjugated cysteine and serine.
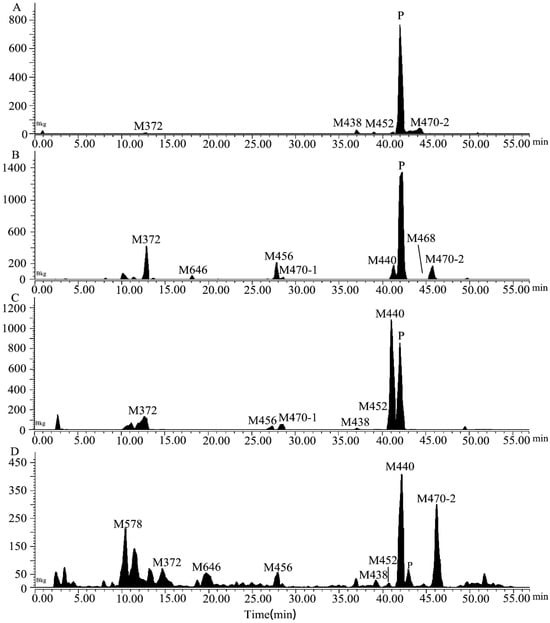
Figure 2.
The extracted ion chromatograms in rat plasma (A), urine (B), feces (C), and bile (D) samples obtained after a single oral dose of [14C]7–16 at 3 mg/100 µCi/kg.

Table 2.
Summary of the metabolites of 7–16 detected in rat plasma, urine, feces, and bile obtained after a single oral dose of [14C]7–16 at 3 mg/100 µCi/kg plasma using UPLC-Q Exactive HRMS.
The relative abundances of the metabolites were calculated from the percentage of total radiation intensity (TRA%) in plasma and from the percentage of dose in urine, feces, and bile. The results indicate the sex-based differences in exposure to 7–16 in rats, shown in Table 2. The relative abundance of unchanged [14C]7–16 in female and male rat plasma is 81.9% and 57.3%, respectively, and accounts for most of the content. Meanwhile, M470-2 is the main metabolite detected in the plasma, with relative abundances of 8.63% and 27.2% in females and males, respectively. In urine, [14C]7–16 is also dominant, with abundances of 23.6% and 9.79% observed in females and males, respectively, followed by metabolite M440, which is the predominant metabolite in feces (21.1% in females and 24.2% in males). Hence, M470-2 and M440 are major metabolites detected in vivo.
A total of 10 metabolites of 7–16 are identified in vitro and in vivo, and 7–16 is considered to undergo metabolism through two pathways, namely, mono-oxidation and N-demethylation. The analysis revealed that 7–16 is metabolized by phase I reactions in vivo, and the metabolites formed are excreted through urine and feces. The proposed metabolic scheme is depicted in Figure 3. Compared with pimavanserin, the introduction of the trifluoroethyl group not only significantly improved the activity of the compound but also greatly enhanced its stability [6,15].
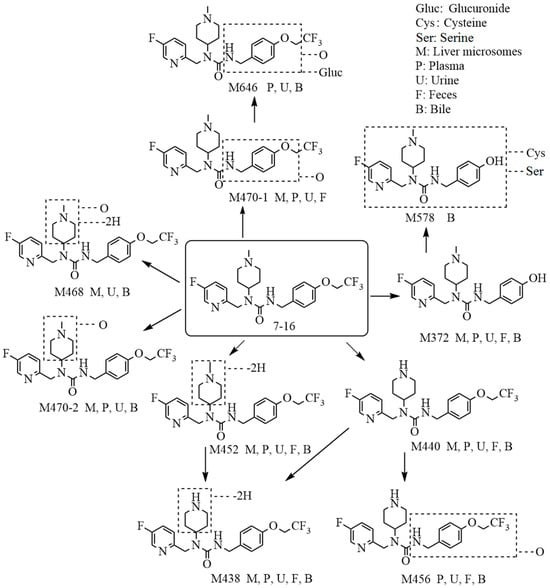
Figure 3.
The proposed metabolic pathways of 7–16 in liver microsomes and in rats.
2.3. Metabolic Phenotype by P450 Enzymes
In accordance with the metabolite identification results, M470-2 and M440 were selected as the targets for metabolic phenotype study using recombinantly expressed human cytochrome P450 (rhCYP) isozymes. The results indicate that CYP3A4 is the primary isozyme responsible for the mono-oxidation and N-demethylation metabolism of 7–16, as evident from Figure 4. The relative contributions of CYP3A4 range from 93.2% to 96.7%. Meanwhile, there is little or no contribution from CYP1A2, CYP2B6, CYP2C8, CYP2C9, CYP2C19, and CYP2D6 isozymes. The clearance data of the probe substrates of seven rhCYP isozymes are all normal and acceptable.
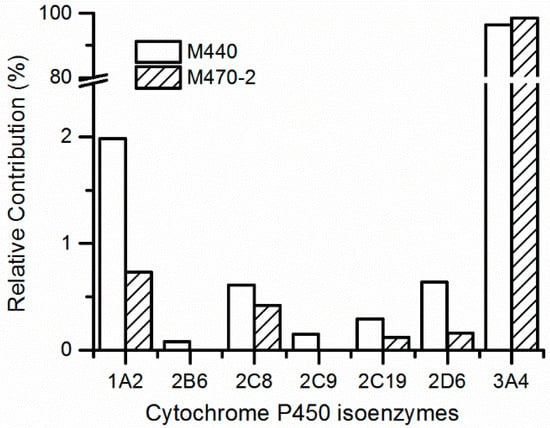
Figure 4.
Prediction of relative contribution of cytochrome P450 isoenzymes to 7–16 metabolites in human liver microsomes.
Phenotypic studies of metabolic responses contribute to comprehending the roles of the P450 enzyme in drug metabolism processes [16,17]. Human hepatic CYP3A4, recognized as a multifunctional enzyme, has a wide range of substrates, including commonly used drugs [18]. 7–16 is a substrate of CYP3A4, and the DDIs might be provoked by co-administration of drugs that are potent inhibitors or inducers of the enzyme, which should be paid more attention to in future clinical trials of 7–16. In our previous study [6], 7–16 was demonstrated as a medium inhibitor of CYP1A2 with an IC50 value of 8.5 μM and almost no inhibition for CYP2C9, CYP2C19, CYP2D6, and CYP3A4 with an IC50 value more than 62.9 μM. Although it will depend on the dose applied, the potential cause of DDIs due to inhibition of P450 enzymes by 7–16 is very low.
2.4. Excretion in Rats
Female and male rats for both intact rats and BDC rats exhibit similar excretion ratios of 7–16 after a single oral dose (the percent difference is less than 6.5% between the two sexes), and the mean values of the recovery of radioactivity in excreta (urine, feces, and bile) from both sexes were used as described below, which has been expressed as a percent of the administered dose, shown in Figure 5. For intact rats, a total of 98.9% of the administered drug was recovered within 0–168 h post-administration, with 39.9% of the drug recovered from the urine, 55.0% in feces, and 4.06% in cage rinse/wash. Most of [14C]7–16 (76.8% of the dose) were recovered within the first 24 h post-administration. For BDC rats, 98.3% of the dose was recovered within 0–72 h post-administration, with 56.3% recovered in urine, 20.2% in feces, 18.4% in bile, and 3.42% in cage rinse/wash. Most of the radioactivity (82.8% of the dose) was recovered within the first 24 h post-administration. Based on the percentage of the dose excreted in bile and urine from BDC rats, the absorption rate of 7–16 was calculated to be at least 74.7% of the dose. Thus, 7–16 can be considered to display excellent absorption properties.

Figure 5.
Accumulated excretion rate of radioactivity in rat excreta following a single oral dose of [14C]7–16 at 3 mg/100 µCi/kg to intact rats ((A), n = 6) and bile duct cannulated rats ((B), n = 8).
2.5. Inhibitor Assay for the P-gp, OATP1B1, OATP1B3, OAT1, OAT3, and OCT2 Transporters
The results show that 7–16 inhibits P-gp mediated efflux of digoxin with an IC50 value of 30.6 µM, as shown in Table 3. At the tested conditions, the percent of lucifer yellow in every basolateral well is no more than 0.4 (acceptance standards are less than 2.0), which indicates a good MDR1-MDCK II monolayer integrity. And verapamil inhibits P-gp activity with an IC50 of 1.57 µM, indicating that the test system is considered acceptable. In addition, it was demonstrated that 7–16 does not inhibit the transport activity of OATP1B1, OATP1B3, OAT1, OAT3, and OCT2 with IC50 values all more than 72.5 µM. For positive inhibitors, the calculated IC50 values are acceptable (Table 3), which indicates that the test system is inhibitable.

Table 3.
Inhibitory effect of 7–16 on P-gp, OATP1B1, OATP1B3, OAT1, OAT3, and OCT2 transporters.
P-gp is one of the most important and well-studied efflux transporters. It is expressed in many tissues, including the intestine, liver, kidney, and brain, with the functions of actively pumping small molecule compounds out of cells [19]. On another side, influx transporters have the important role in small-molecule-compound transport across hepatocytes (OATP1B1, OATP1B3) and kidney cells (OAT1, OAT3, and OCT2) [20,21]. In addition, transporter inhibition plays a role that cannot be underestimated in a number of side effects, including an imbalance of endobiotics and dietary nutrients [13,22]. It is very important to understand the impact of 7–16 on the physiologic function of transporters and to take into account these effects in drug discovery and clinical practice. Based on the results of excretion in rats, 7–16 is eliminated via the urine, with a much lesser extent in bile and feces. Thus, the potential to cause DDIs due to transporter inhibition by 7–16 was low. This study provides a database aiding further research and the development of 7–16.
3. Materials and Methods
3.1. Materials
3.1.1. Chemicals and Reagents
7–16 [3-(4-(2,2,2-trifluoroethoxy)benzyl)-1-((5-fluoropyridin-2-yl)methyl)-1-(1-methylpiperidin-4-yl) urea] (purity > 99%) was offered by the Medicinal Chemistry Research Department, R&D Center (Luye Pharma Group Ltd., Yantai, China). [14C]7–16 (chemical purity of 99.50%, and radiochemical purity of 99.57%) was prepared by WuXi AppTec (Shanghai, China) Co., Ltd. Human, rat, mouse, and dog liver microsomes and recombinantly expressed human cytochrome P450 (rhCYP) isozymes were purchased from Corning Co., Ltd. (Shanghai, China) Monkey liver microsomes were purchased from RILD Liver Disease Research Co., Ltd. (Shanghai, China) Substrates of P450 isozymes and their specific metabolites and NADPH were purchased from Sigma-Aldrich (Shanghai, China). HPLC-grade acetonitrile and methanol were purchased from Merck (Darmstadl, Germany). All chemicals and reagents were of analytical grade and purchased from Sinopharm Chemical Reagent (Shanghai, China).
3.1.2. Animals
The adult Sprague-Dawley rats (weighing 200 ± 20 g) were obtained from Weitong Lihua Experimental Animal Technology Co., Ltd. (Jiaxing, China) and were housed in a controlled environment, including temperature (20~26 °C), relative humidity of 40~70%, and a 12 h light/dark cycle. All animals had free access to feed and water in strict accordance with the National Institute of Health Guide for the Care and Use of Laboratory Animals (NIH Publications No. 8023). And the experiment protocols were approved by the Institutional Animal Care and Use Committee.
3.2. Methods
3.2.1. Metabolite Identification in Liver Microsomes of Different Species
In accordance with our previous methods [23], 7–16 (10 µM) was incubated with mouse, rat, dog, monkey, and human liver microsome proteins (1 mg/mL) in 100 mM sodium phosphate buffer (pH 7.4) containing 10 mM magnesium chloride and 2 mM NADPH at 37 °C for 60 min. All samples were prepared in duplicates. The reactions were terminated by adding three times the volume of ice-cold acetonitrile (600 µL) and stored at −20 °C until analysis. Control samples without NADPH and 0-time point samples were included. As a positive control, testosterone (10 µM), which was metabolized to produce the hydroxylation metabolite, was used as a substrate to confirm the activity of the incubation system.
After pre-treatments, the samples were analyzed by an Acquity UPLC system coupled with a diode array detector (Waters Corporation, Milford, MA, USA) and Q Exactive HRMS (Thermo Electron Corporation, Waltham, MA, USA) (UPLC–UV-Q Exactive HRMS). Samples were separated on an Agilent XDB C18 column (150 × 2.1 mm i.d. 3.5 μm, Agilent Corporation, Santa Clara, CA, USA) at 40 °C by gradient elution with water and acetonitrile containing 0.1% formic acid. The flow rate was 0.40 mL/min. The ultraviolet (UV) detection wavelength was 286 nm. Q Exactive HRMS were operated at positive ion mode (3.5 kV) using a heating electrospray ionization source. Mass calibration was required to be performed before conducting experiments so as to achieve the best mass accuracy and mass calibration should be performed every five days. The metabolites were detected by full MS/dd-MS2 analysis from m/z 100 to m/z 1000. The resolution of the first-class scan and second-class scan was 70,000 and 17,500, respectively. Thermo Compound Discover software was used to identify expected and unknown metabolites, and we finally proposed the 7–16 metabolic pathways based on the deduced metabolites and relevant drug biotransformation knowledge.
3.2.2. Metabolite Identification in Rat Plasma
The rats received a single oral dose of [14C]7–16 at 3 mg/100 µCi/kg (3 females and 3 males for each time point). At 0.25, 1, 6, and 24 h after administration, about 0.3 mL of blood was collected into a collection vessel containing K2-EDTA anticoagulant by cardiac puncture, and the plasma samples were acquired after centrifugation at 8000 rpm for 10 min at 4 °C. All samples were stored at −20 °C until analysis. The rat plasma samples at each time point were mixed in accordance with the area under the concentration curve contribution at corresponding time intervals [6,24]. After the pooled plasma samples were pre-treated, the radio-profiles of plasma samples were detected using Shimadzu LC coupled with a radioactivity monitor (LC-RAM, Scintillation and Luminescence Counter Technology, Perkin Elmer Corporation, Waltham, MA, USA), and the metabolites were identified by UPLC-QE HRMS (Thermo Electron Corporation, Waltham, MA, USA). The percentage of each metabolite based on the total radiation intensity (TRA%) in plasma samples was calculated. The structures of metabolites were identified by the same method used for metabolite identification in the liver microsomes of different species.
3.2.3. Excretion in Rats and Metabolite Identification in Rat Urine, Feces, and Bile
In the urine and feces excretion experiment, six rats (3 females and 3 males) were administered a single oral dose of [14C]7–16 at 3 mg/100 µCi/kg. Urine, feces and cage washing/cleaning solution samples were collected from 0 to 168 h following drug administration at the following time intervals: 0–8, 8–24 h (0–24 h for feces), 24–48, 48–72, 72–96, 96–120, 120–144, and 144–168 h. In the biliary excretion experiment, 8 rats using a bile duct cannula (BDC) (4 females and 4 males) were administered a single oral dose of [14C]7–16 at 3 mg/100 µCi/kg. Bile, urine, feces, and cage washing solution were collected from before and 0–72 h after oral administration at the following time intervals: 0–4, 4–8 (urine 0–8), 8–24 (feces 0–24), 24–48, and 48–72 h. All samples were collected and refrigerated at −20 °C until determination of the radioactive concentrations by liquid scintillation counter (Perkin Elmer Corporation, Waltham, MA, USA). Urine, feces, and bile samples at each time period were mixed by equal percentages of either volume or weight. After the mixed samples were treated, the radio-profiles and metabolite identification in the bile, urine, and feces samples were carried out by LC-RAM and UPLC-Q Exactive HRMS, and the TRA% of each metabolite in plasma and the percentage of dose (dose%) of each compound in urine, feces, and bile samples were calculated.
3.2.4. Identification of P450 Isozymes Responsible for Metabolism
Based on the result of metabolite identification, two metabolites were selected as targets for metabolic phenotyping analysis. Seven CYP isozymes (CYP1A2, CYP2B6, CYP2C8, CYP2C9, CYP2C19, CYP2D6, and CYP3A4) were investigated using the rhCYP isozymes method [22]. In brief, 7–16 (1 µΜ) was incubated with each rhCYP isozyme (20 pg/mL) in 100 mM sodium phosphate buffer (pH 7.4) containing 3 mM magnesium chloride. After 10 min of preincubation at 37 °C, the reactions were initiated by adding NADPH (1 mM) and then incubated at 37 °C in a shaking water bath for 0, 5, 15, and 30 min. The specific substrates of each rhCYP isozyme were incubated as the above method to confirm the activity of the incubation system. The samples were prepared in triplicates. The reactions were terminated by adding three times the volume of ice-cold acetonitrile (600 µL) and stored at −20 °C until analysis. After pre-treatment, the samples were determined by the LC–MS/MS (Shimadzu Exion-Triple Quad 4500) method. The relative contribution rate of each isozyme to the metabolism of 7–16 was evaluated in HLMs using the following formula: Contributionx% = Vx × Abundancex (pmol/mg protein)/Σ(Vi × Abundancei). Vx (µL/min/pmol) is the production rate of metabolites for each rhCYP isozyme.
3.2.5. Transporter Inhibitor Assay
The identification of potential inhibition of 7–16 on P-gp using the MDR1-MDCKII cell line, which is the Madin-Darby canine kidney cell line stably transfected with human MDR1 gene encoding the P-gp. The inhibition assay of 7–16 on other transports was conducted with recombinant stable HEK293 cell lines expressing human OATP1B1, OATP1B3, OAT1, OAT3, and OCT2, which were supplied by GenoMembrane (Kanagawa, Japan). The study was accomplished by WuXi AppTec Co., Ltd. (Shanghai, China) Briefly, cells were incubated in 5% CO2 at 37 ± 1 °C with saturated humidity, and the inhibition effect of 7–16 on the substrate uptake activity of each transporter are measured at 8 concentrations (0.045~100 μM).
For the P-gp inhibitor assay, MDR1-MDCKII cells at passage 8 were seeded on the 96-well insert system at the density of 2.3 × 10⁵ cells/cm2 and cultured for 6 days before being used in the transport experiment. After a 150 min transport experiment, the bi-directional permeability and efflux ratios of digoxin (10.0 µM), a known P-gp substrate, in the presence or absence of different concentrations of 7–16/verapamil (a positive inhibitor) were determined by an LC–MS/MS assay. The P-gp activity was represented by the efflux ratios of digoxin in the presence and absence of 7–16, and the %P-gp activity values of MDR1-MDCK II cells were used to calculate half maximal inhibitory concentration (IC50).
Similarly, HEK293-OATP1B1, OATP1B3, OAT1, OAT3, and OCT2 cells were seeded onto 96-well plates with a density of 1.5 × 10⁵ cells/cm2 and incubated for 24 h, then incubated with the relevant substrates in the absence and presence of 7–16 or corresponding positive inhibitors. After incubation, concentrations of each substrate in samples were analyzed by LC–MS/MS. The percentage of the mean transport activity values in the presence and absence of test compounds was used for the calculation of IC50.
3.2.6. Data Analysis
Thermo Compound Discover software was used to find expected and unknown mark backgrounds, and a fragment ion search scoring model was also used to screen and identify metabolites of 7–16. GraphPad Prism 5 software was used to calculate inhibition IC50 values. SPSS Statistics 20.0 software was used for data processing and analysis. Data were expressed as mean ± standard deviation.
4. Conclusions
A total of 10 metabolites of 7–16 were identified in vitro and in vivo, and their relative abundances were accurately determined using UPLC–UV-HRMS and LC-RAM. The relative abundance of each metabolite in human liver microsomes could be covered by that observed in animal species. 7–16 was metabolized mainly through mono-oxidation (formed M470-2) and N-demethylation (formed M440) pathways in vivo. CYP3A4 isozyme was responsible for the primary metabolic reactions. The relative abundance of prototype drugs in rat plasma and urine accounted for most of the content. Meanwhile, M470-2 was the main metabolite detected in the plasma. The metabolite M440 was the predominant metabolite in feces and bile. Based on the data excreted through the bile and urine, the absorption rate of 7–16 was noted to be at least 74.7%. The potentiality to cause DDIs due to transporter inhibition by 7–16 was low. The comprehensive PK properties of 7–16 contributed to its further development of a new treatment for PDP, and these results should promote its clinical development.
Author Contributions
Conceptualization: J.T. and L.Y.; Writing: Z.H. and W.W.; Investigation: H.Y., F.Z. and C.S.; Visualization: Z.H. and W.M.; Supervision: S.Y. and H.W. All authors have read and agreed to the published version of the manuscript.
Funding
This work was partially supported by the “Taishan Industry Leading Talent Laureate” and the Major Technological Innovation Project of Shandong Province PR China (2019JZZY011122) and the Natural Science Foundation of Shandong Province, China (No. ZR2022MH186).
Institutional Review Board Statement
The animal study protocol was approved by the Ethics Committee of Luye Pharma Group Ltd. (Yantai, China) (Approval code 20211026).
Informed Consent Statement
Not applicable.
Data Availability Statement
Data are contained within the article.
Acknowledgments
We would like to thank the Drug Performance Evaluation Department of WuXi AppTec for their support.
Conflicts of Interest
Authors Wenyan Wang, Huijie Yang, Fengjuan Zhao, Chunjie Sha, Jingwei Tian were employed by the company Shandong Luye Pharmaceutical Co., Ltd. The remaining authors declare that the research was conducted in the absence of any commercial or financial relationships that could be construed as a potential conflict of interest.
References
- Sveinbjornsdottir, S. The clinical symptoms of Parkinson’s disease. J. Neurochem. 2016, 139 (Suppl. S1), 318–324. [Google Scholar] [CrossRef]
- Fénelon, G.; Soulas, T.; Zenasni, F.; de Langavant, L.C. The changing face of Parkinson’s disease-associated psychosis: A cross-sectional study based on the new NINDS-NIMH criteria. Mov. Disord. 2010, 25, 763–766. [Google Scholar] [CrossRef]
- Combs, B.L.; Cox, A.G. Update on the treatment of Parkinson’s disease psychosis: Role of pimavanserin. Neuropsychiatr. Dis. Treat. 2017, 13, 737–744. [Google Scholar] [CrossRef]
- Hunter, N.S.; Anderson, K.C.; Cox, A. Pimavanserin. Drugs Today 2015, 51, 645–652. [Google Scholar] [CrossRef]
- Hacksell, U.; Burstein, E.S.; McFarland, K.; Mills, R.G.; Williams, H. On the discovery and development of pimavanserin: A novel drug candidate for Parkinson’s psychosis. Neurochem. Res. 2014, 39, 2008–2017. [Google Scholar] [CrossRef]
- Ma, M.; Yang, Y.; Du, G.; Dai, Y.; Zhu, X.; Wang, W.; Xu, H.; Zhang, J.; Zheng, L.; Zou, F.; et al. Improving the treatment of Parkinson’s disease: Structure-based development of novel 5-HT2A receptor antagonists/inverse agonists. Eur. J. Med. Chem. 2022, 234, 114246. [Google Scholar] [CrossRef]
- Ge, Y.; Yu, Y.; Zhang, Y.; Li, X.; Liu, Q. Characterization of the metabolite of AdipoRon in rat and human liver microsomes by ultra-high performance liquid chromatography combined with Q-Exactive Orbitrap tandem mass spectrometry. Biomed. Chromatogr. 2019, 33, e4645. [Google Scholar] [CrossRef]
- Coppola, P.; Andersson, A.; Cole, S. The importance of the human mass balance study in regulatory submissions. CPT Pharmacometrics Syst. Pharmacol. 2019, 8, 792–804. [Google Scholar] [CrossRef]
- Wu, W.; Chu, Y.; Wang, S.; Sun, X.; Zhang, J.; Wang, Y.; Chen, X. Investigation of metabolic profile of pimavanserin in rats by ultrahigh-performance liquid chromatography combined with Fourier transform ion cyclotron resonance mass spectrometry. Rapid Commun. Mass Spectrom. 2018, 32, 269–276. [Google Scholar] [CrossRef]
- Pánczél, J.; Schudok, M.; Schiell, M.; Riedel, J.; Kertesz, V. An Effective QWBA/UHPLC-MS/Tissue Punch Approach: Solving a Pharmacokinetic Issue via Quantitative Met-ID. Drug Metab. Lett. 2021, 14, 152–162. [Google Scholar] [CrossRef]
- Roffey, S.J.; Obach, R.S.; Gedge, J.I.; Smith, D.A. What is the objective of the mass balance study? A retrospective analysis of data in animal and human excretion studies employing radiolabeled drugs. Drug Metab. Rev. 2007, 39, 17–43. [Google Scholar] [CrossRef] [PubMed]
- Spracklin, D.K.; Chen, D.; Bergman, A.J.; Callegari, E.; Obach, R.S. Mini-review: Comprehensive drug disposition knowledge generated in the modern human radiolabeled ADME study. CPT Pharmacomet. Syst. Pharmacol. 2020, 9, 428–434. [Google Scholar] [CrossRef]
- Jala, A.; Ponneganti, S.; Vishnubhatla, D.S.; Bhuvanam, G.; Mekala, P.R.; Varghese, B.; Radhakrishnanand, P.; Adela, R.; Murty, U.S.; Borkar, R.M. Transporter-mediated drug-drug interactions: Advancement in models, analytical tools, and regulatory perspective. Drug Metab. Rev. 2021, 53, 285–320. [Google Scholar] [CrossRef]
- Rendic, S.P. Metabolism and interactions of Ivermectin with human cytochrome P450 enzymes and drug transporters, possible adverse and toxic effects. Arch. Toxicol. 2021, 95, 1535–1546. [Google Scholar] [CrossRef] [PubMed]
- Yang, Y.; Yu, D.; Zhu, X.; Du, G.; Wang, W.; Zou, F.; Wang, H.; Zhang, R.; Ye, L.; Tian, J. Synthesis and analysis of dihydrotetrabenazine derivatives as novel vesicular monoamine transporter 2 inhibitors. Eur. J. Med. Chem. 2021, 224, 113718. [Google Scholar] [CrossRef]
- Hosea, N.A.; Collard, W.T.; Cole, S.; Maurer, T.S.; Fang, R.X.; Jones, H.; Kakar, S.M.; Nakai, Y.; Smith, B.J.; Webster, R.; et al. Prediction of human pharmacokinetics from preclinical information: Comparative accuracy of quantitative prediction approaches. J. Clin. Pharmacol. 2009, 49, 513–533. [Google Scholar] [CrossRef] [PubMed]
- Williams, J.A.; Hurst, S.I.; Bauman, J.; Jones, B.C.; Hyland, R.; Gibbs, J.P.; Obach, R.S.; Ball, S.E. Reaction phenotyping in drug discovery: Moving forward with confidence? Curr. Drug Metab. 2003, 4, 527–534. [Google Scholar] [CrossRef]
- Yuan, X.; Lu, H.; Zhao, A.; Ding, Y.; Min, Q.; Wang, R. Transcriptional regulation of CYP3A4 by nuclear receptors in human hepatocytes under hypoxia. Drug Metab. Rev. 2020, 52, 225–234. [Google Scholar] [CrossRef]
- Lin, J.H.; Yamazaki, M. Role of P-glycoprotein in pharmacokinetics: Clinical implications. Clin. Pharmacokinet. 2003, 42, 59–98. [Google Scholar] [CrossRef]
- Giacomini, K.M.; Huang, S.M. Transporters in drug development and clinical pharmacology. Clin. Pharmacol. Ther. 2013, 94, 3–9. [Google Scholar] [CrossRef]
- Nakanishi, T.; Tamai, I. Interaction of drug or food with drug transporters in intestine and liver. Curr. Drug Metab. 2015, 16, 753–764. [Google Scholar] [CrossRef]
- Lepist, E.I.; Ray, A.S. Beyond drug-drug interactions: Effects of transporter inhibition on endobiotics, nutrients and toxins. Expert Opin. Drug Metab. Toxicol. 2017, 13, 1075–1087. [Google Scholar] [CrossRef]
- Wang, W.; Du, G.; Lin, S.; Liu, J.; Yang, H.; Yu, D.; Ye, L.; Zou, F.; Wang, H.; Zhang, R.; et al. (+)-9-Trifluoroethoxy-α-Dihydrotetrabenazine as a highly potent vesicular monoamine transporter 2 inhibitor for tardive dyskinesia. Front. Pharmacol. 2021, 12, 770377. [Google Scholar] [CrossRef]
- Hop, C.E.; Wang, Z.; Chen, Q.; Kwei, G. Plasma-pooling methods to increase throughput for in vivo pharmacokinetic screening. J. Pharm. Sci. 1998, 87, 901–903. [Google Scholar] [CrossRef]
Disclaimer/Publisher’s Note: The statements, opinions and data contained in all publications are solely those of the individual author(s) and contributor(s) and not of MDPI and/or the editor(s). MDPI and/or the editor(s) disclaim responsibility for any injury to people or property resulting from any ideas, methods, instructions or products referred to in the content. |
© 2024 by the authors. Licensee MDPI, Basel, Switzerland. This article is an open access article distributed under the terms and conditions of the Creative Commons Attribution (CC BY) license (https://creativecommons.org/licenses/by/4.0/).