Article

A Non-Matrix-Matched Calibration Method for In Situ Major and Trace Element Analysis of Scheelite by Nanosecond LA-ICP-MS

1
Laboratory of Mineralization and Dynamics, College of Earth Sciences and Land Resources, Chang’an University, 126 Yanta Road, Xi’an 710054, China
2
Shaanxi Mineral Resources and Geological Survey, Shaanxi Institute of Geological Survey, Xi’an 710068, China
*
Author to whom correspondence should be addressed.
Molecules 2024, 29(1), 51; https://doi.org/10.3390/molecules29010051
Submission received: 27 November 2023 / Revised: 15 December 2023 / Accepted: 18 December 2023 / Published: 20 December 2023
(This article belongs to the Section Analytical Chemistry)

Abstract

:
In this work, a reliable and robust in situ non-matrix-matched calibration method is proposed for element composition determination in scheelite samples. With external calibration against the silicate glass standard reference material NIST SRM 610, the concentrations of both major elements (Ca and W) and trace elements (Si, Fe, Mo, Y, rare earth elements, etc.) in scheelite are determined using an ArF 193 nm excimer nanosecond laser ablation-inductively coupled plasma mass spectrometer (LA-ICP-MS). Here, the ablation was performed by hole drilling under a helium (He) environment using a laser spot size of 35 μm and a laser repetition of 5 Hz, and the aerosols were then transported to a quadrupole ICP-MS by a mixture of He and make-up gas argon (Ar) with a total gas flow rate of 1.6 L/min. Results showed that there was no apparent matrix effect between the NIST SRM 610 and scheelite by this proposed method. With internal standardization against W, the obtained concentrations of CaO and WO3 were found to yield an average matrix CaO/WO3 mass fraction ratio of 0.245 (2σ = 0.003, n = 19), which agreed well with the value of 0.243 (2σ = 0.002, n = 15) from electron probe microanalysis (EPMA). Furthermore, the accuracy of trace element analyses with this proposed non-matrix-matched calibration in situ method was evaluated by comparing the concentration results with those from bulk analysis by solution nebulizer ICP-MS (SN-ICP-MS). It was found that the quantification results from LA-ICP-MS and SN-ICP-MS were comparable, in particular showing a relative concentration bias of the total ∑REE+Y contents of less than 2%. This confirmed that scheelites can be accurately analyzed in situ by LA-ICP-MS without matrix-matched calibration standards. By using this developed in situ method, the element compositions in a series of scheelite samples from different W-associated deposits in China were successfully quantified, promising further genetic process investigation and associated geologic activities of the polymetallic resources.

Graphical Abstract

1. Introduction

Scheelite, which has a chemical composition of CaWO4 with a simple crystal structure of tetrahedral [WO4]2− groups and irregular dodecahedral [WO8]4− groups [1], is a widespread accessory mineral in hydrothermal associated mineral deposits, such as tungsten deposits, gold deposits, and Sn and Mo deposits [2,3,4]. Due to the similarities of ironic radii and the tetragonal symmetry crystal structure of Ca-bearing minerals, a wide range of elements involving Sr, Y, Mo, Pb, and rare earth elements (REEs) are easily incorporated into scheelite via the substitution of Ca2+ or W6+ in the crystal lattice [5]. This makes scheelite a well-known host of various trace elements, generally exhibiting distinct REE patterns and trace element characteristics [6,7].
During the last several decades, scheelite has been extensively utilized in the investigation of deposit types, metallogenic settings, ore genesis, physicochemical conditions, and the evolutionary history of the mineralizing fluids via its trace element compositions [8,9,10,11]. By analyzing the REE patterns and trace element systematics of scheelite samples, Ghaderi et al. [12] discussed the rock types and physical conditions in the Kalgoorlie-Norsman region of West Australia at the time of hydrothermal activity. Song et al. [13] applied the element geochemistry of scheelite samples to source identification and oxide/redox condition prediction of the ore-forming fluids for skarn-type W-Mo deposits in east China. Poulin et al. [14] assessed the capability of scheelite as a good ore-deposit discriminator via the comprehensive study of its trace element and REE chemistry. Li et al. [15] tracked the dynamic hydrothermal processes through REE fractionation patterns and Sr-Nd isotopes of scheelite samples from the Yangjiashan W deposit in south China. With trace element and Sr isotope geochemistry of skarn-hosted scheelite samples, Dai et al. [16] constrained the source and evolution of the ore-forming fluid of the Cuonadong Sn-W-Be polymetallic deposit in south Tibet of China.
The trace elements of scheelites were conventionally analyzed by inductively coupled plasma atomic emission spectroscopy (ICP-AES) [17] or solution nebulizer ICP mass spectrometry (SN-ICP-MS) [18,19]. By using such techniques, sample decomposition is mandatory prior to the quantification of scheelite trace elements. Generally, scheelite is digested through either alkali fusion/sintering followed by acid leaching [18,20,21] or acid decomposition with low-temperature attack [22] and/or the Teflon bomb method [17,19]. These methods, however, suffer from the time-consuming sample preparation process, the relatively high content of REEs from fusion reagents, and the risk of element loss during digestion procedures. Laser ablation ICP-MS (LA-ICP-MS), an in situ technique [23] for micro-scale major and trace element analysis in solid samples [24,25], has been extensively employed to quantify element composition in scheelite using a non-matrix-matched standard calibration method. Sylvester et al. [26] first reported the usage of LA-ICP-MS in quantitative element composition analyses of scheelite, giving W measurements that fell within 5% of the concentrations expected from electron probe microanalysis (EPMA). However, they found that W progressively fractionated from Ca in the silicate glass standard reference material NIST SRM 610 but not in the scheelite during ablation. The authors thus recommended the data reduction should be performed using the early maximum count rates for W and Ca rather than the mean count rates of the whole ablation. Fu et al. [27] concluded that the matrix effect between NIST SRM 610 and scheelite can be circumvented with the usage of Ca as the internal standard element and a 193 nm excimer laser operated at a low laser repetition rate of 5 Hz. However, Hao et al. [28] argued that the matrix effect was negligible when the ablation was conducted using a 193 nm excimer laser at a 7 Hz repetition rate and 44 μm spot size. Recently, Xiao et al. [29] studied the ablation behaviors of scheelite and NIST SRM 610 with a spot size of 10~90 μm, revealing that a spot size of ≥32 μm was preferred for scheelite regardless of pulse number, while the favored spot size for NIST SRM 610 was highly dependent on the utilized pulse number. Collectively, there has been no consistent approach for the element composition in scheelite by LA-ICP-MS using NIST SRM 610 as the external calibration standard.
In this work, a non-matrix-matched calibration method against NIST SRM 610 for accurate major and trace element determination in scheelite samples by using nanosecond LA-ICP-MS was proposed. Here, the ablation behaviors of elements W and Ca in scheelite were studied in detail. Additionally, the matrix effect and quantification accuracy of this in situ method were evaluated. Finally, this developed LA-ICP-MS approach with optimized configuration was employed to determine the element compositions in a series of scheelite samples which were collected from different W-associated deposits in China.

2. Results and Discussion

2.1. Element Compositions of Scheelite Samples by EPMA Analysis

By using EPMA, the concentration levels of matrix components Ca and W together with elements Si, Na, Mg, Ca, Mn, Fe, and Mo in the studied scheelite samples were obtained. The results are summarized in Table 1, showing that the contents of Na, Mg, Mn, Fe, and Mo were nearly within the detection limits. It was also found that the average concentrations of SiO2 ranged from 0.14 to 0.21%, and the relative standard deviations (RSDs) were higher than 15% (n = 3). Since the quantification was carried out on the region that appeared free of surface-near inclusions or cracks by backscattering electron image inspection, we assumed that the large RSDs of SiO2 contents might be due to heterogeneities or inclusions hidden under the sample surface. The concentration values of CaO and WO3 were observed to be within 18.74–19.83% and 78.28–80.87%, respectively, with RSDs of less than 2.83% (n = 3). The corresponding matrix CaO/WO3 mass fraction ratios for these samples were found in the range of 0.235 to 0.250 and yielded an average value of 0.243 (2σ = 0.002, n = 15).

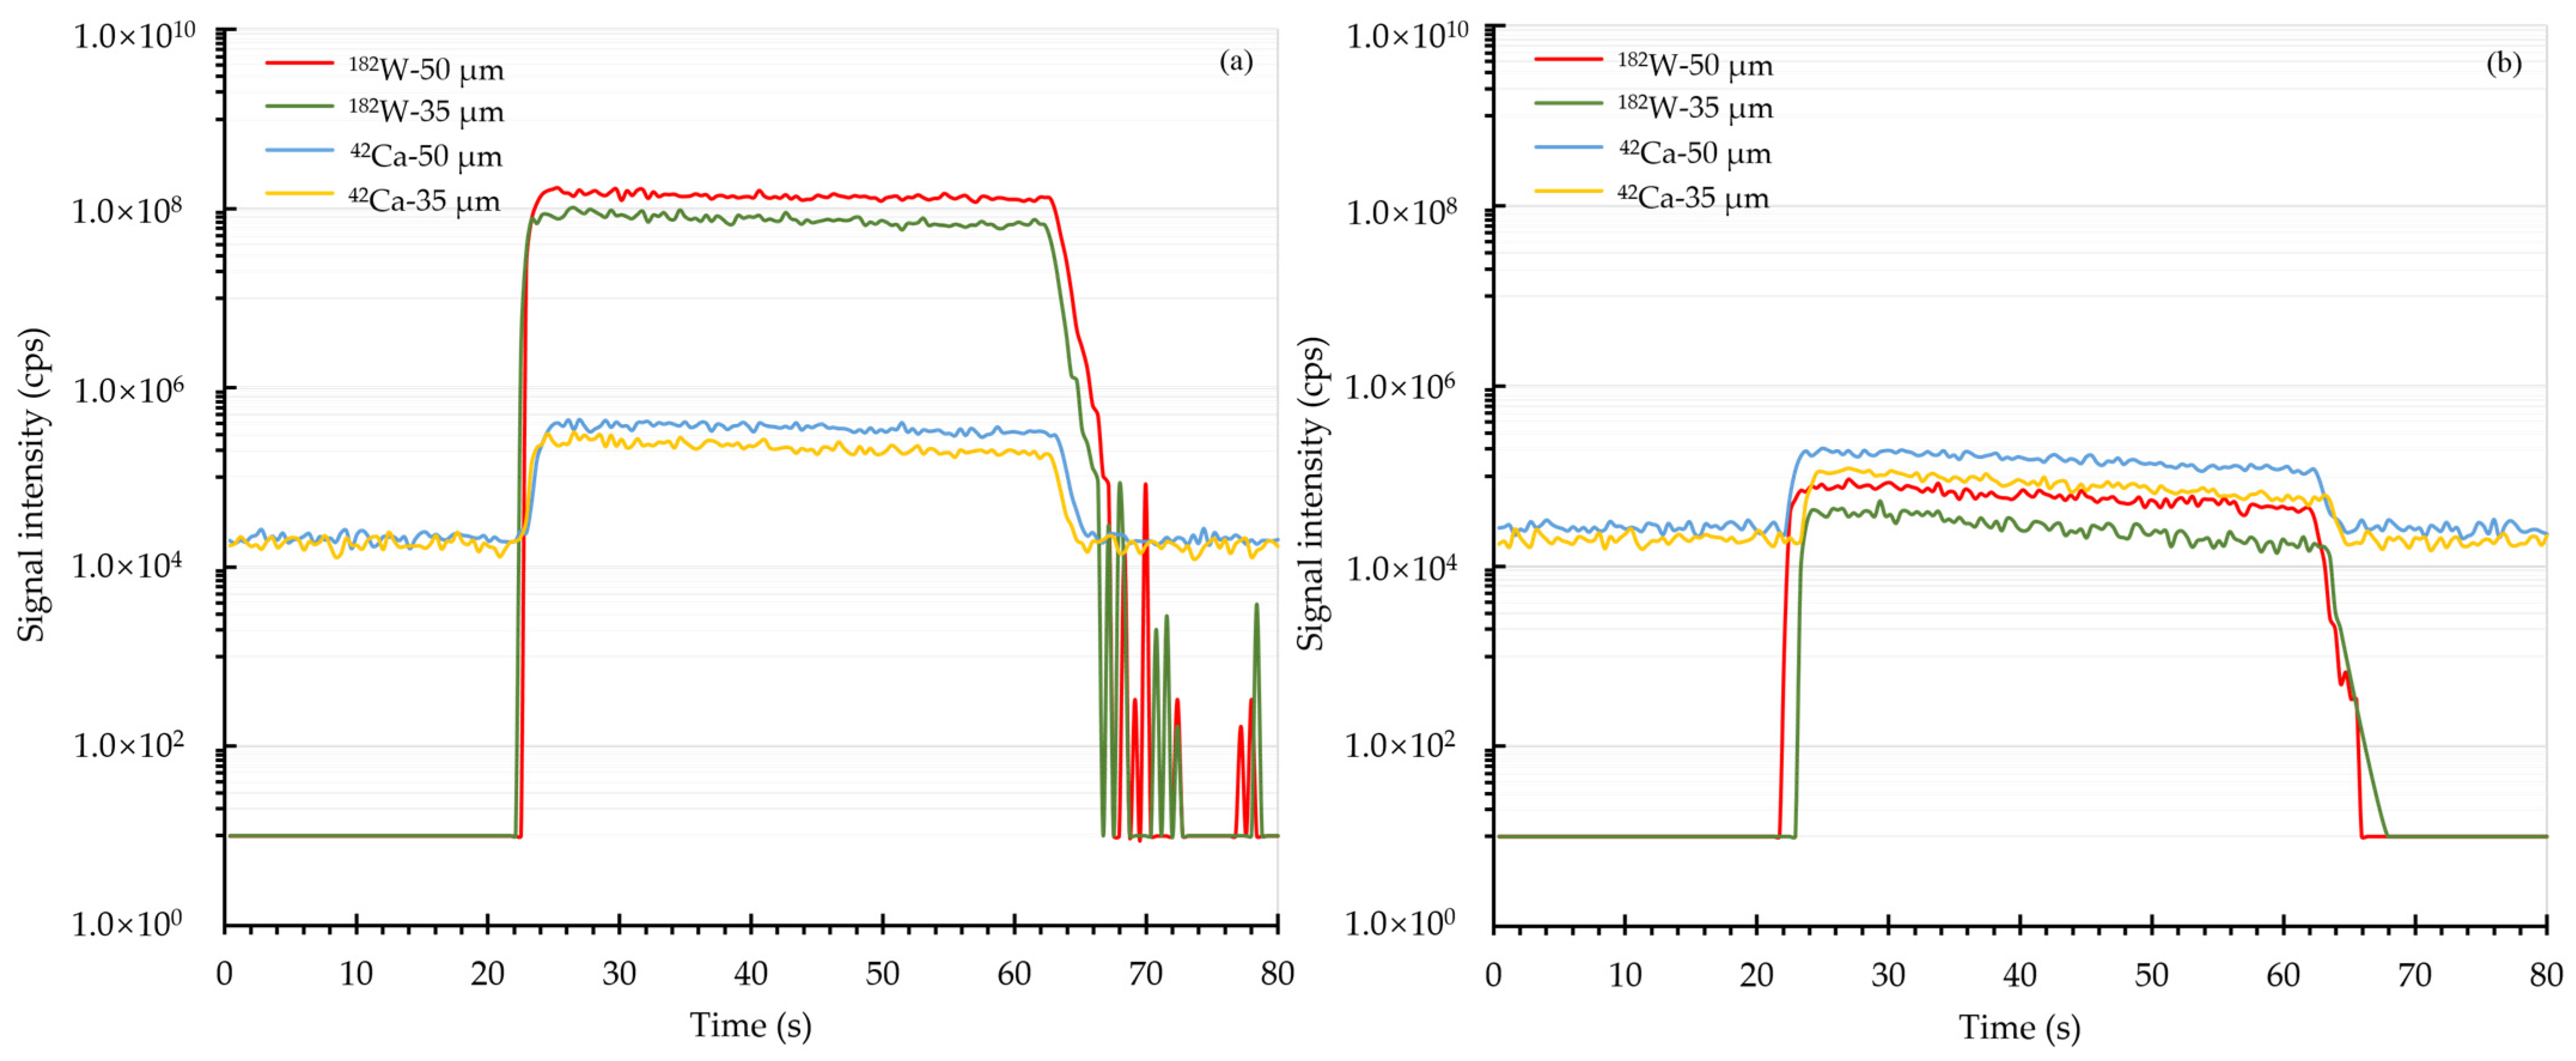
2.2. Ablation Behaviors of Ca and W in LA-ICP-MS Analysis

The ablation behaviors of Ca and W in scheelite and NIST SRM 610 were investigated by monitoring the transient signals over the course of one single spot analysis. With a fixed energy fluence of 2.51 J/cm2, the transient signal profiles of Ca and W using 50 and 35 µm spot sizes were graphically shown in Figure 1. It was observed that the intensities of both Ca and W in scheelite and NIST SRM 610 were relatively steady during the whole ablation period. Furthermore, the element fractionation of W was then estimated in terms of the ratios of integrated signals of W, which were normalized to the integrated signals of Ca, from the second 20 s to that from the first 20 s [30]. The element fractionation analyses showed that the fractionation factor of W in scheelite for one continuous ablation was 1.07 when using a 50 µm spot size, while this value declined to 1.01 when using a spot size of 35 µm. It is thus clear that a smaller spot size of 35 µm produces less element fractionation effect on scheelite sample analysis. When it comes to NIST SRM 610, the fractionation factors were found to be 1.01 using a 50 µm spot size and 1.02 using a 35 µm spot size, showing that there was no significant influence from the utilized spot size. Apparently, the reported phenomenon that W progressively fractionated from Ca in NIST SRM 610 [26] did not occur under this current instrument configuration.
To further evaluate the ablation behaviors, the correlation coefficients of transient signal intensities between Ca and W within the ablation process at 35 and 50 µm spot sizes were analyzed (see Figure 2). As shown in Figure 2, the values of the correlation coefficient were found to be less than 0.9, revealing that the two elements had a relatively independent relationship during the interactions of the target (i.e., scheelite and NIST SRM 610) with pulse lasers. However, it is worth noting that there were outliers of the correlation coefficients in the ablation of scheelite using a 50 µm spot size, which was consistent with the slightly higher element fractionation effect of W in scheelite samples. Hence, a 35 µm spot size was used as default in the subsequential quantification analyses.

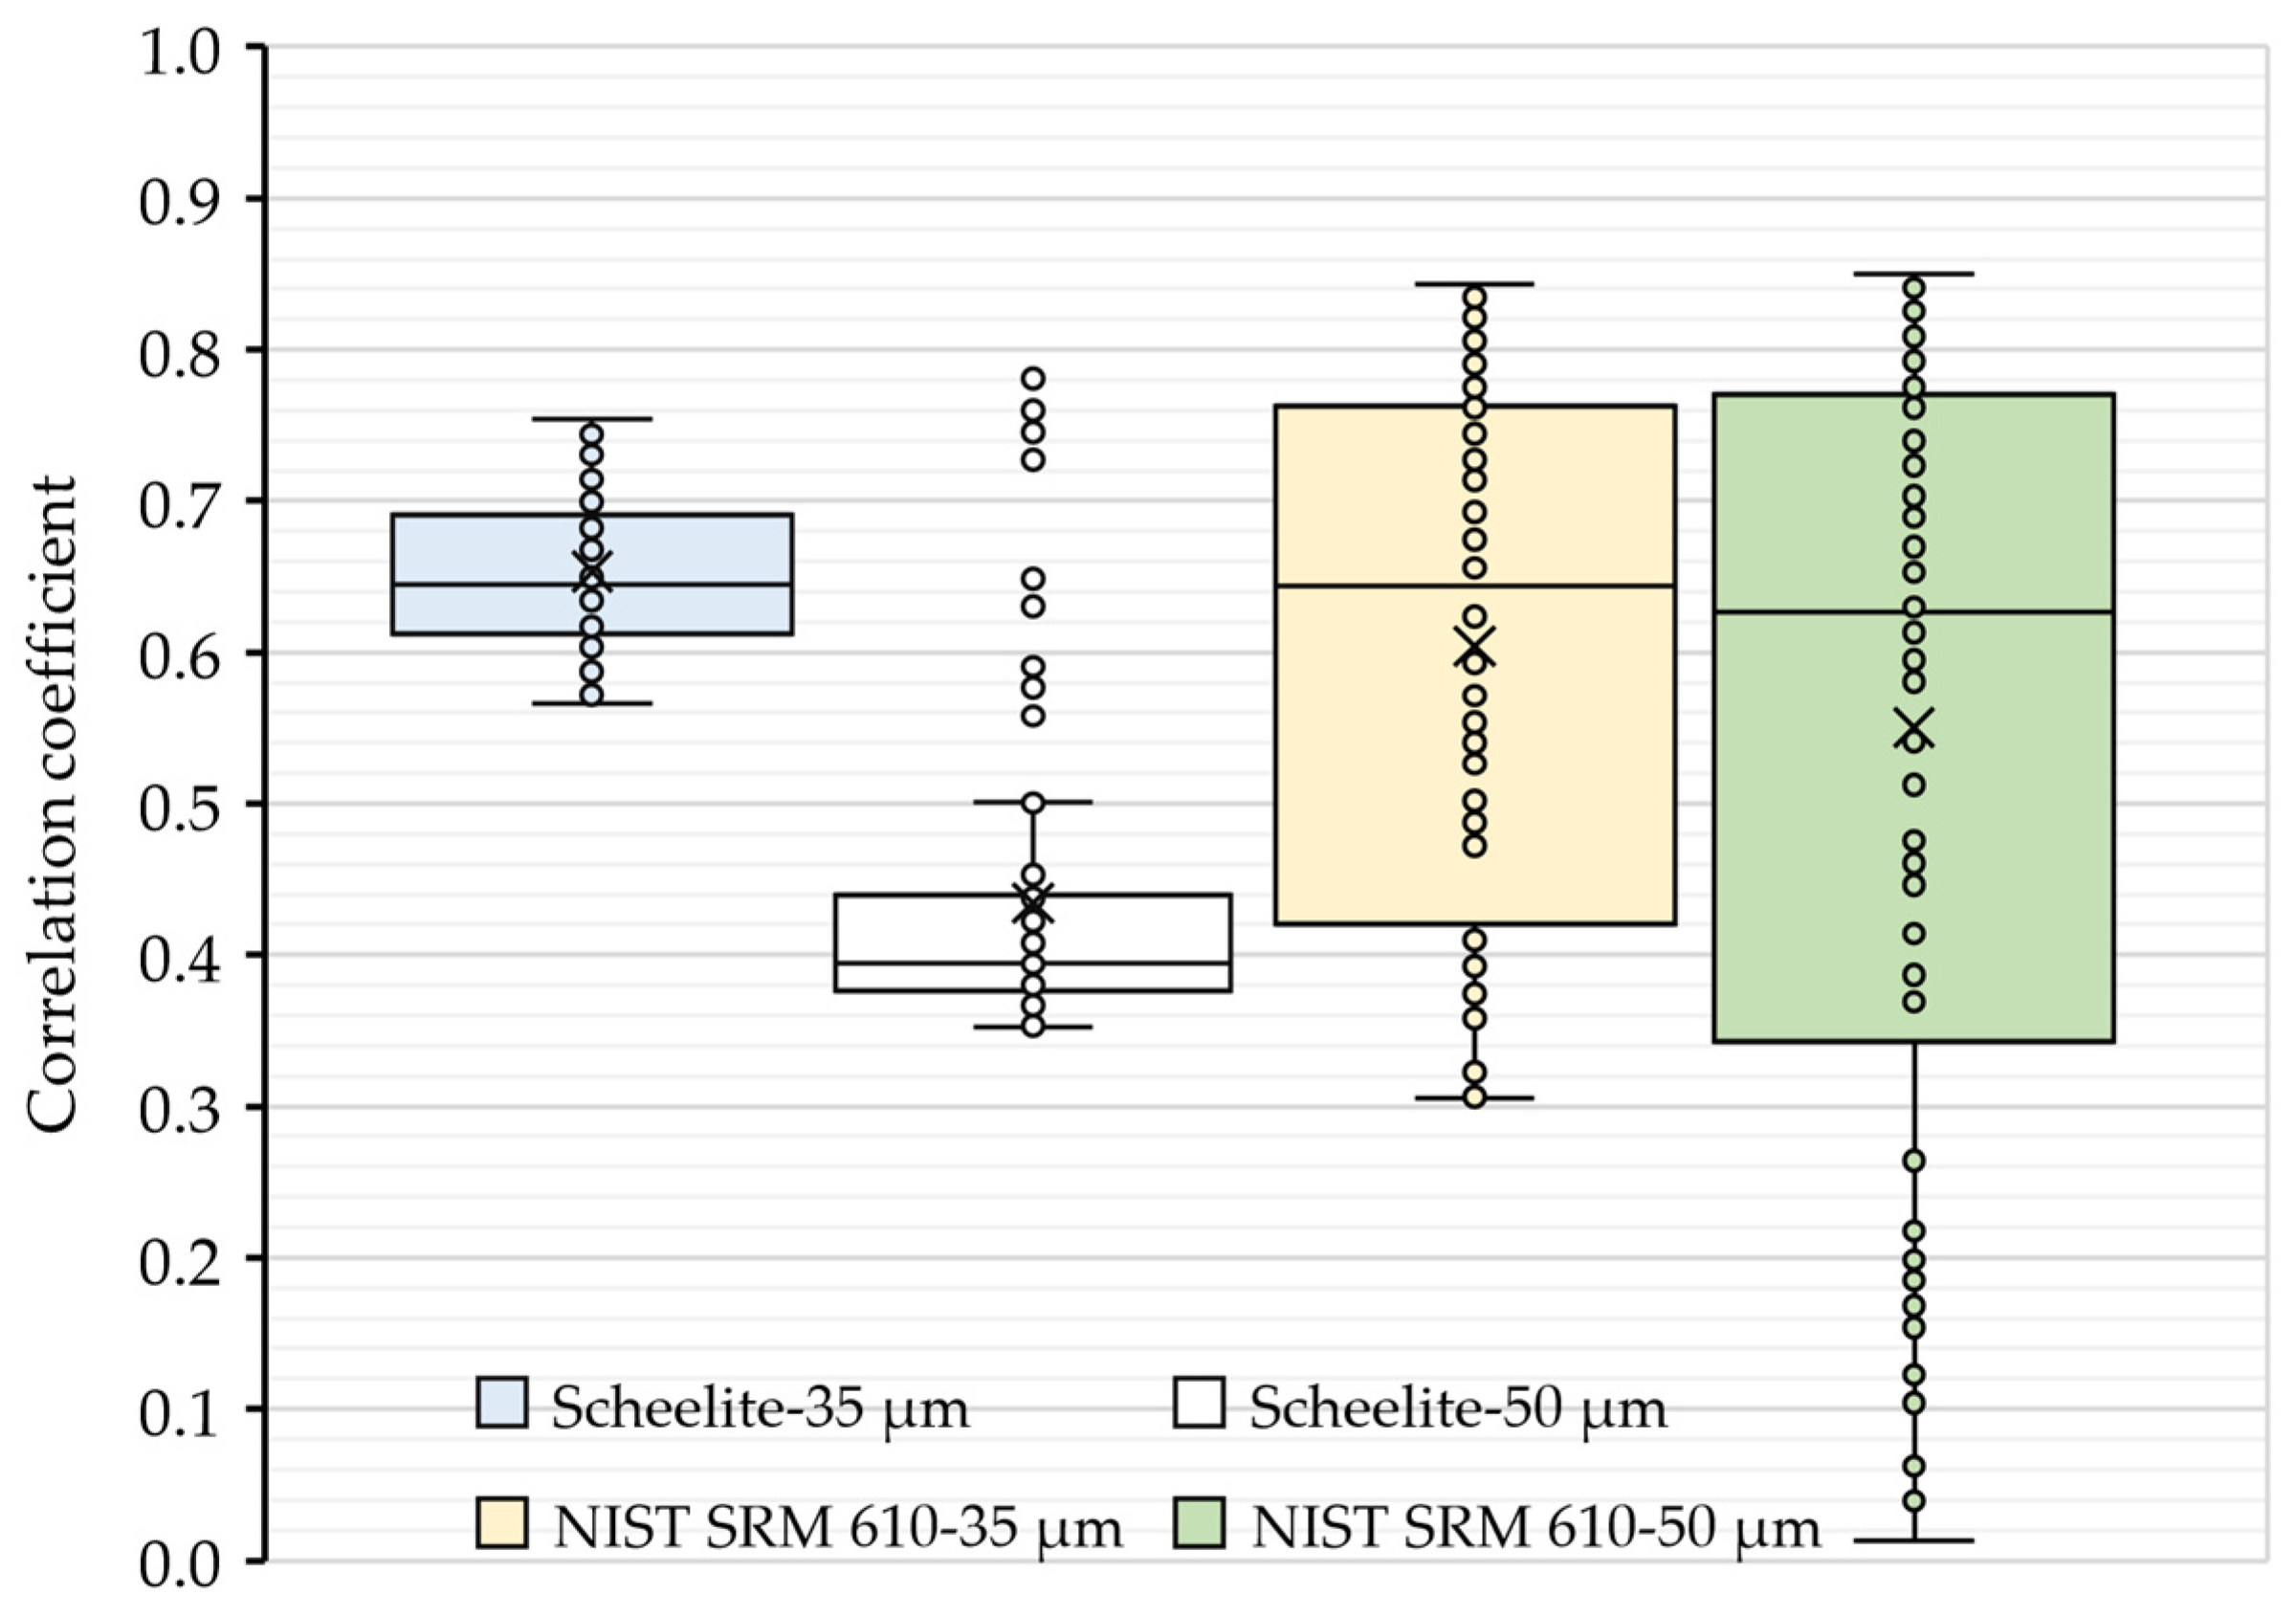
2.3. Matrix Effect and Quantification Accuracy of Major and Minor Elements Using LA-ICP-MS

With NIST SRM 610 as the calibration standard, the five scheelite samples were quantified by LA-ICP-MS using a hole drilling strategy under 5 Hz laser repetition, 35 µm spot size, and 2.51 J/cm2 of energy fluence. Results showed that the concentrations of CaO were within 19.03–20.16% (RSDs < 2.86%, n ≥ 3), and WO3 was found at levels between 79.43% and 80.72% (RSDs < 0.74%, n ≥ 3). It is clear that the content levels of CaO and WO3 were highly in agreement with the pure stoichiometric scheelite (19.48% of CaO and 80.52% of WO3), which confirmed the nearly ideal stoichiometric composition of the studied scheelite samples. The yielded average matrix CaO/WO3 mass fraction ratio of 0.245 (2σ = 0.003, n = 19) also showed consistency with that obtained by EPMA. Hence, the matrix effect from the non-matrix-matched standard glass NIST SRM 610 can be neglected for scheelite quantification when using the proposed LA-ICP-MS method.
To further assess the quantification accuracy of scheelite samples by the proposed LA-ICP-MS, concentration results of CaO, WO3, and SiO2 were then compared to the values obtained by EPMA. As shown in Figure 3a,b, it is clear that the concentrations of matrix CaO and WO3 from LA-ICP-MS analysis agreed well with results from EPMA analysis, giving concentration ratios within 0.98–1.01 (see Figure S1). Additionally, the minor component SiO2 with values of 0.13–0.19% from LA-ICP-MS analysis was found to fall within the concentration range given by EPMA (see Figure 3c). It is worth noting that the concentration results of SiO2 from LA-ICP-MS analysis exhibited better precision with standard deviations of less than 0.04%, which might be attributed to the larger sample mass sampled via laser ablation and, thus, the micro-heterogeneities or inclusions hidden under the sample surface such as QPL-1 were not noticeable.

2.4. Quantification Accuracy of Trace Elements Using LA-ICP-MS and SN-ICP-MS

Apart from the composition quantification of major and minor elements, the analytical capability of this proposed in situ method for trace elements in scheelite was also evaluated. With concentration values from bulk solution analysis using SN-ICP-MS as the reference, the concentration ratios are shown in Figure S2, and the concentration results of selected trace elements Y and REEs are summarized in Table 2. It is clear from Figure S2 and Table 2 that there were no significant differences in the results for the studied scheelite samples from LA-ICP-MS analyses to those from solution-based SN-ICP-MS measurements, which gave concentration ratios in the range of 0.8 to 1.2, in particular showing a relative concentration bias of the total ∑REE+Y contents of less than 2%. This demonstrated the robustness of this developed LA-ICP-MS approach with NIST SRM 610 as the calibration standard for trace element quantification in scheelite samples. On the other hand, the comparable content levels from the in situ and bulk solution analyses revealed a relatively homogeneous distribution of trace elements in the studied scheelite samples.

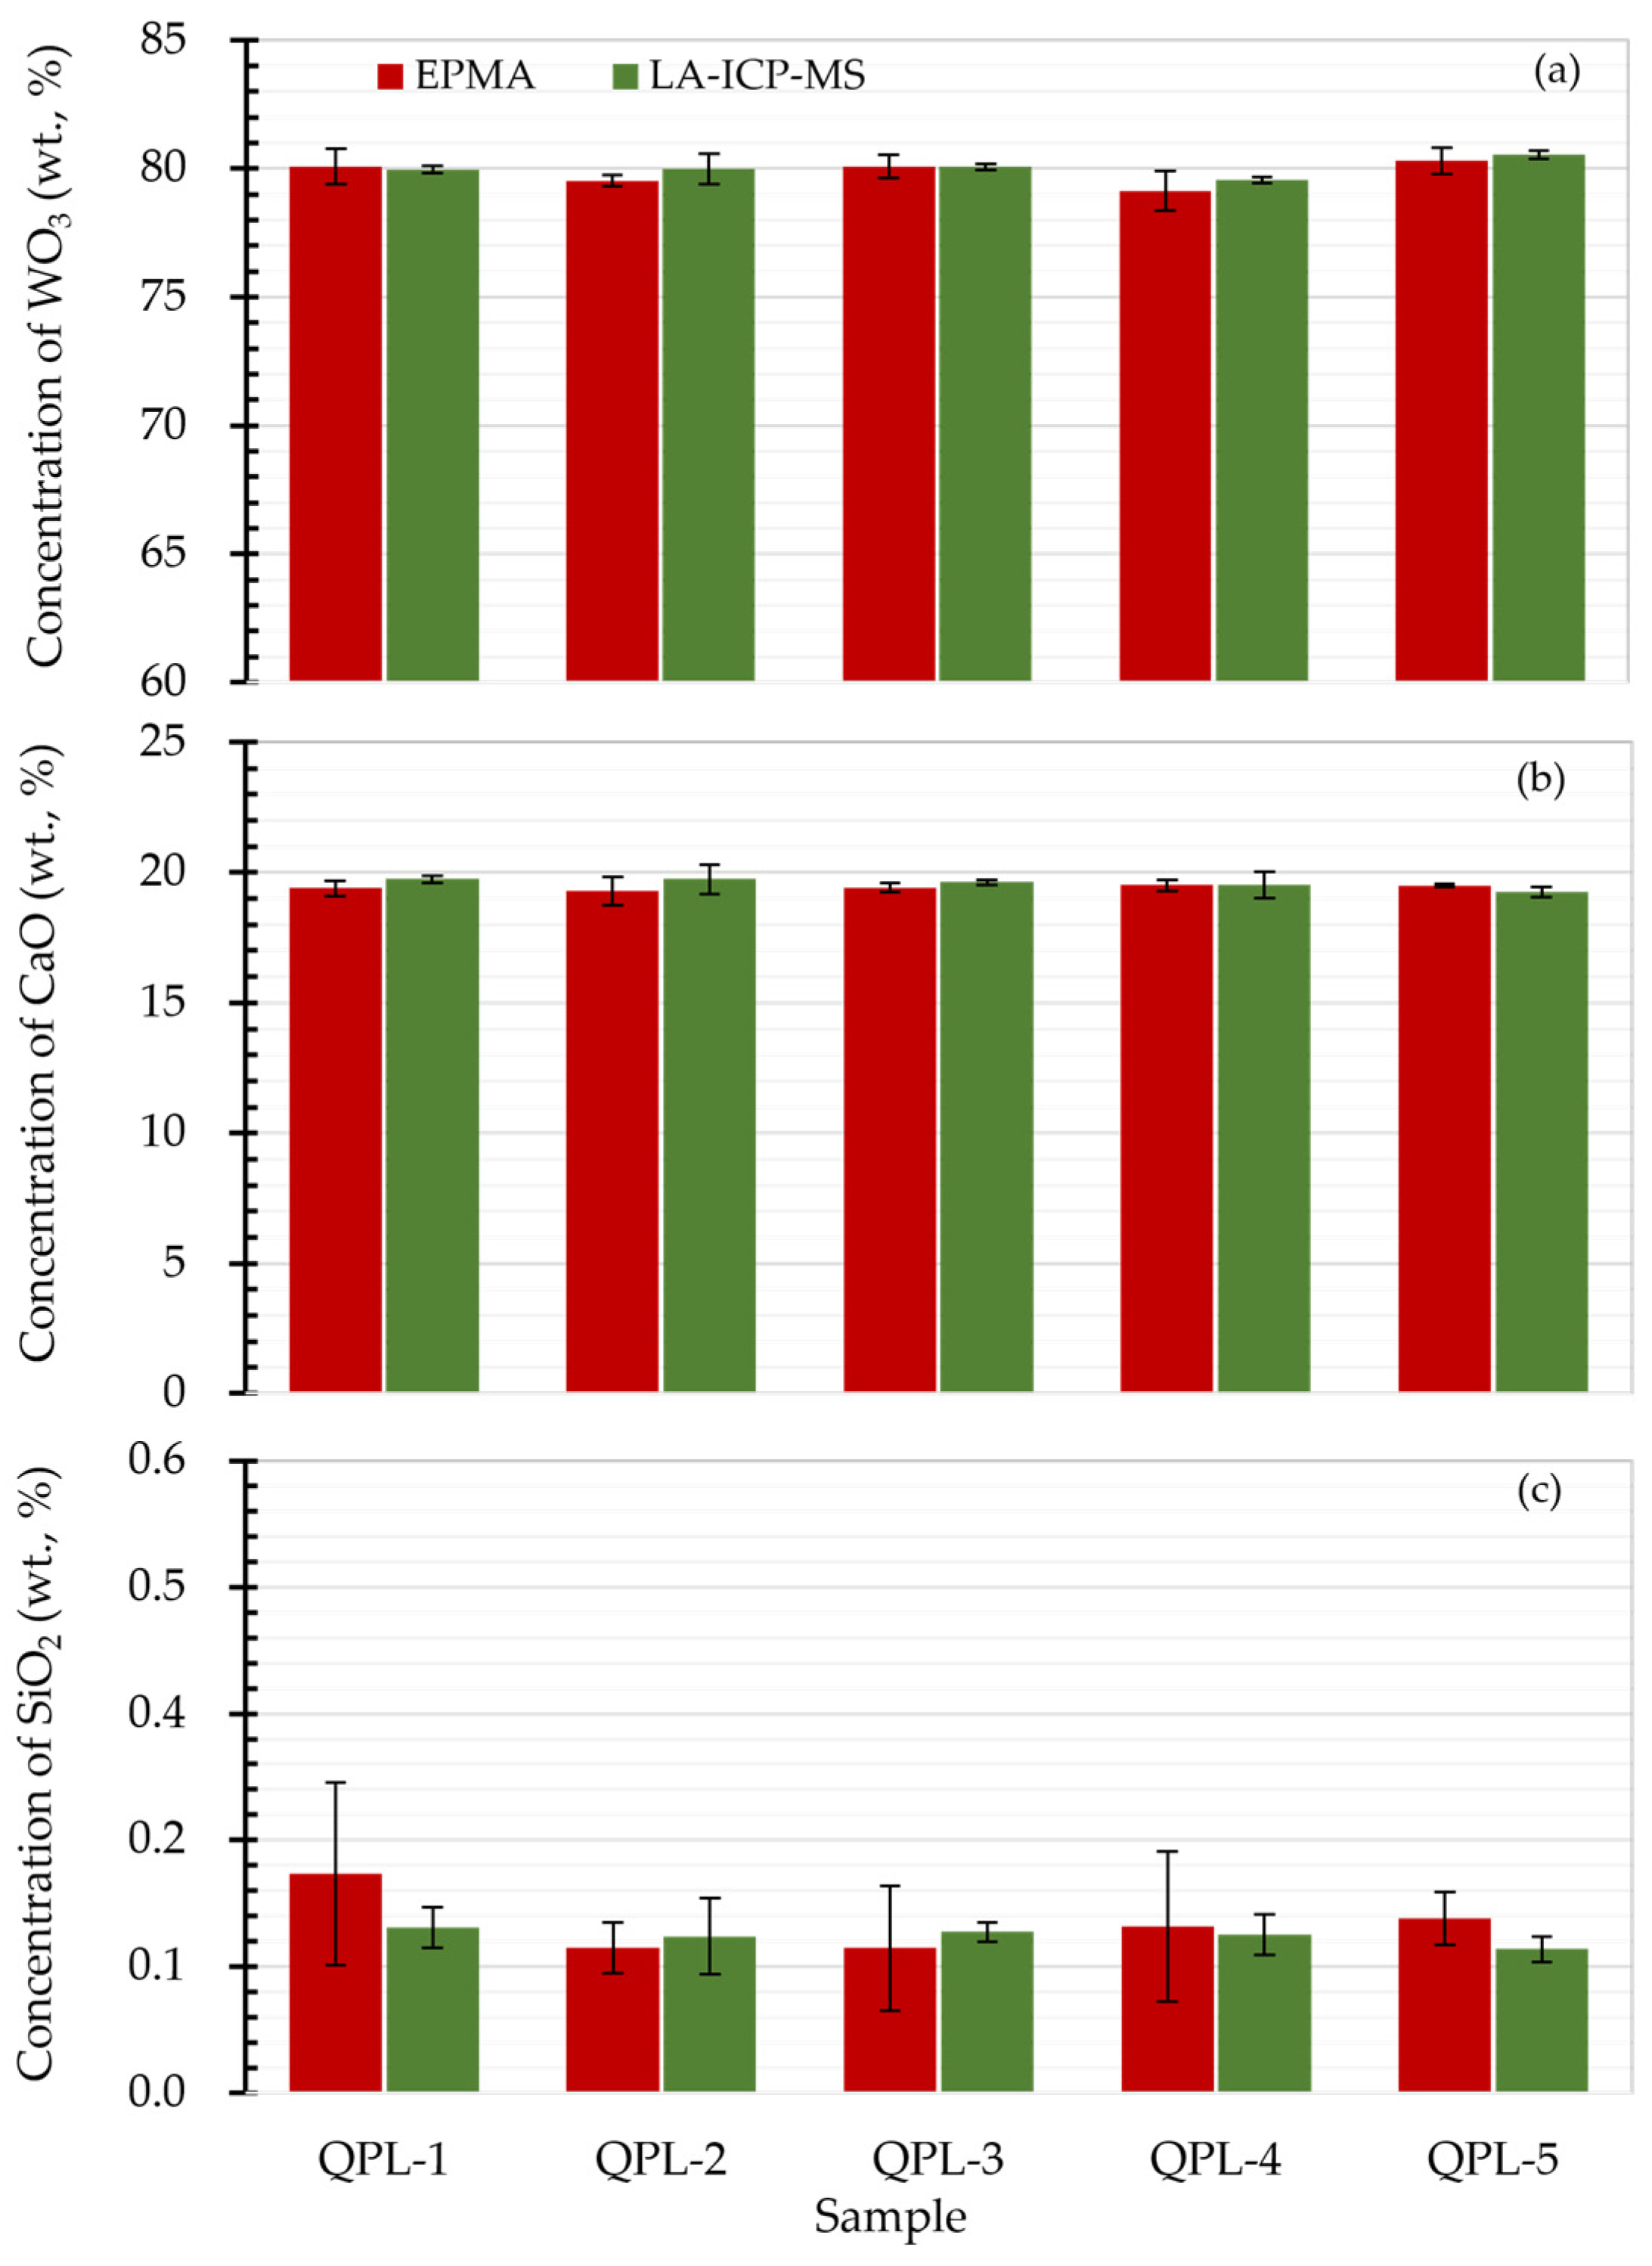
2.5. Application to Scheelite Sample Quantification by LA-ICP-MS

Based on the results discussed above, the proposed LA-ICP-MS method was then applied to element quantification of a suite of scheelite samples from different W-associated deposits in China. Here, samples QPL-6~QPL-10 are also from the Qipangou deposit of Shaanxi, samples WTG-1~WTG-10 are from the Wutonggou deposit of Xinjiang [31], and samples XDS-1~XDS-10 are from Xiaodushan deposit of Gansu [32]. The quantification results are compiled in Table S1.
It is clear from Table S1 that the matrix components in the scheelite samples were in a range of 18.64–19.89% for CaO and 79.76–80.95% for WO3, from which the regional differences among the three deposits could not be distinguished. However, the three deposits were found to differentiate in terms of trace elements. Scheelite samples from the Qipangou deposit showed the lowest content level of Mg but the highest concentrations of Si, Fe, and Sr, with Na, Mn, Ga, Th, and U below the detection limits of the used instrument. Samples from the Xiaodushan deposit were observed to enrich elements Na, Mg, Mn, Nb, Pb, Y, and REEs, and contained total ∑REE+Y contents up to thousands of μg/g, which were distinctly higher than those from the other two deposits. Furthermore, elements Th and U were detectable only in the scheelite samples from the Xiaodushan deposit, showing contents of 0.19–0.50 and 0.05–0.25 μg/g, respectively. For the Wutonggou deposit, the scheelite samples enriched element Mo in particular, showing concentrations over a wide range of 259.7–924.6 μg/g except for sample WTG-7, which contained 17.08 μg/g of Mo. It is also worth noting that there were four levels of the sum concentrations of Y and REEs in scheelite samples from the Wutonggou deposit, and the total ∑REE+Y contents generally followed an increasing trend of around 1.82, 11.08–31.16, 74.46–128.7, and about 238.7 μg/g. This might be due to the different evolution stages or fluid activities during scheelite mineralization in the Wutonggou deposit. However, the aim of this study was not specifically to investigate the scheelite mineralization process. Collectively, one can note that the characteristics of trace elements in these scheelite samples can provide valuable information in W-associated deposit fingerprinting.

3. Materials and Methods

3.1. Instrumentation and Operating Conditions

The measurements were carried out on an Agilent 7700x ICP-MS (Agilent, Santa Clara, CA, USA), connected to a 193 nm ArF excimer nanosecond LA system. This Analyte Excite LA system (Photon Machines, Thousand Oaks, CA, USA) provides a maximum energy fluence of 15 J/cm2 and contains a HelEx Active two-volume LA cell [33]. To enhance isotope signal sensitivity, the torch of the utilized ICP-MS was equipped with a Pt shielding plate and a silicon shielding cap. Generally, the signal intensity for 1 μg/g of U can reach 2500 cps/s when using a 5 Hz laser repetition rate and a 40 μm spot size. A “cylinder shape signal stabilizer” with a volume of 21.2 mL [34] was installed after the LA cell to reduce the signal oscillations during the measurements. Here, ablation occurred in a helium atmosphere (He, 99.999% purity). Argon gas (Ar, 99.996% purity) was used as the make-up gas and mixed with the sample aerosol from the ablation cell by a T-connector before entering the ICP.
The LA-ICP-MS was optimized daily to achieve the highest possible sensitivity for low- to high-mass isotopes before scheelite analyses. After the system had been stabilizing for at least one hour, the carrier gas flow rates of He were optimized through ablating NIST SRM 610 silicate glass using a fixed spot size of 40 μm and a repetition rate of 5 Hz. Apart from analyte sensitivity, the daily optimization included the oxide formation control with a ThO+/Th+ ratio lower than 0.5% and an achieved 238U+/232Th+ signal intensity ratio near 1.05. Other parameters (including sampling depth and lens voltages) and the ICP-MS instrument’s P/A factor calibrations were updated on a daily basis. Typical operating parameters for the ICP-MS and LA system are summarized in Table 3.

3.2. Sample Description and Handling

Five scheelite samples from the W-associated mining deposit in Shaanxi Province, China [35] (Qipangou deposit: QPL-1, QPL-2, QPL-3, QPL-4 and QPL-5) were selected in this method of investigation work.
All scheelite samples were prepared in the form of thin sections, for which the scheelite samples with a standard thickness of 30 μm were carefully mounted on glass beads. When the surfaces of all the samples were polished, the samples were cleaned using ethanol (99.7%) followed by sonication in ultrapure water (Milli-Q, Millipore, Bedford, MA, USA). The NIST SRM 610 reference glass was used for calibration and the preferred values from the GeoReM database [36] were used as references. Before LA sampling, the surfaces of all the standard material and samples were carefully cleaned using ethanol (99.7%) and let dry.

3.3. Data Acquisition and Processing

Each LA-ICPMS analysis consisted of a 20 s background signal acquisition and 40 s data collection while ablating standards and the samples. One complete assay cycle consisted of a sequence of 2 spot analyses of NIST SRM 610, 6 to 10 spot analyses of scheelite samples, and 2 spot analyses of NIST SRM 610.
All data were collected in a mode of time-resolved analysis and data reduction was carried out using “Stalquant”, an in-house data reduction software developed by the Günther group in ETH [37]. Here, NIST SRM 610 was defined as the external standard. Quantification was performed using W as the internal standard element or via matrix normalization (100 wt % oxides) [38]. In this work, the major element concentration results of scheelite samples were expressed as 100 wt % oxide, while the trace element concentrations were given as μg/g.

3.4. EMPA

EPMA analyses were performed using a JEOL JXA-8100 instrument (Jeol Ltd., Tokyo, Japan), with apparatus details given in our previous work [39]. In this current work, all data for the scheelite samples were obtained using an acceleration voltage of 15.0 kV, a probe current of 20 nA, and an electron beam diameter of 1 µm. Acquisition times were 20 s on peak and 10 s on each background position. For all elements, the Kα lines were used, except for Mo, where the Lα line was measured. Here, Si, Na, and Mg were measured on TAP; Ca, Mo, and W were analyzed on PET, Fe; and Mn values were determined on LIF. The natural minerals wollastonite, albite, forsterite, fayalite, and pyrophanite were used as standards for Si, Na, Mg, Fe, and Mn, respectively. Scheelite was the standard for Ca and W, and a pure metal was used for Mo. At least 3 points were measured for each sample and the element concentrations were calculated using the CitZAF interelement correction model [40]. The results were expressed as oxide form in wt %.

3.5. SN-ICP-MS

The solution analyses of trace elements in scheelite samples were finished by a ThermoFisher Scientific X7 ICP-MS (Waltham, MA, USA). The scheelite samples were digested using an in-house high-pressure closed acidic decomposition method [41] with small modifications. With the addition of 0.5 mL of HF and 1.0 mL of HNO3, a sample of 50 ± 0.5 mg in the Teflon bombs was evaporated to incipient dryness at 140 °C. Then, 0.5 mL of HF, 0.5 mL of HCl, and 1.0 mL of HNO3 were added to the sample. Thereafter, the bomb was tightly closed and put into an oven at 185 °C for 48 h. After cooling, the sample was evaporated to incipient dryness at 140 °C, and the residue was re-dissolved and dried twice using 1.0 mL of HNO3. With 2.5 mL of 40% HNO3 (v/v) added, the sample solution was heated at 135 °C for 6 h with bombs sealed and then aged overnight. Then the sample solution was transferred to a PET bottle and gravimetrically diluted to 50 ± 0.5 g using 2% HNO3 (v/v) solution. After aging overnight, the sample was directly taken for quantification of trace elements by ICP-MS.

4. Conclusions

In this work, a reliable and accurate LA-ICP-MS method using NIST SRM 610 as an external calibration standard for major and trace element quantification of scheelite samples was proposed. The ablation behavior study showed that less element fractionation occurred for scheelite analyses when using a smaller laser spot size, while the element fractionation was negligible for NIST SRM 610 analyses irrespective of the utilized spot size. With a laser spot size of 35 μm and a laser repetition of 5 Hz, no apparent matrix effect was observed between the NIST SRM 610 and scheelite using this current instrumental configuration. The obtained concentrations of matrix components CaO and WO3 were highly consistent with those from EPMA analysis. Furthermore, the concentration results of trace elements of the studied scheelite samples by this proposed in situ method were comparable with those from bulk solution analysis by SN-ICP-MS, in particular showing a relative concentration bias of the total ∑REE+Y contents less than 2%. This developed method was then applied to element composition determination in a suite of scheelite samples from different W-associated deposits in China. Despite there being no significant concentration differences of the matrix components, the regional deposits can be distinguished by trace elements, which was valuable for further investigation of the genetic process and associated geologic activities of the polymetallic resources.

Supplementary Materials

The following supporting information can be downloaded at: https://www.mdpi.com/article/10.3390/molecules29010051/s1, Figure S1: Mass fraction ratios from LA-ICP-MS and EPMA analyses of all samples analyzed. The LA-ICP-MS analysis was done using 5 Hz of laser repetition, 35 μm of spot size and 2.51 J/cm2. Figure S2: Concentration ratios from LA-ICP-MS and SN-ICP-MS analyses of all samples analyzed. The LA-ICP-MS analysis was done using 5 Hz of laser repetition, 35 μm of spot size and 2.51 J/cm2. Table S1: Element compositions of scheelite samples from different W-associated deposits.

Author Contributions

L.L. carried out EPMA experimental studies. H.T. and D.X. performed data collection and analysis. T.L. helped to revise the manuscript. X.T. designed the research, finished the LA-ICP-MS analysis, and wrote the manuscript. All authors have read and agreed to the published version of the manuscript.

Funding

This research was funded with financial support from the National Key Research and Development Project, China grant number 2021YFC2901902; the Natural Science Foundation, China, grant number 42103009; and the Natural Science Basic Research Program of Shaanxi Province, China, grant number 2020JQ-974.

Institutional Review Board Statement

Not applicable.

Informed Consent Statement

Not applicable.

Data Availability Statement

Data are contained within the article and Supplementary Materials.

Acknowledgments

We highly appreciate the constructive comments from anonymous reviewers and the editor. The authors also gratefully acknowledge the sample support from Xiaodushan and Wutonggou deposits by Xiaohua Deng, and instrument support from the Laboratory of Mineralization and Dynamics, Chang’an University.

Conflicts of Interest

The authors declare no conflict of interest.

References

  1. Dickinson, R.G. The crystal structures of wulfenite and scheelite. J. Am. Chem Soc. 1920, 42, 85–93. [Google Scholar] [CrossRef]
  2. Choi, W.; Park, C.; Song, Y. Multistage W-mineralization and magmatic-hydrothermal fluid evolution: Microtextural and geochemical footprints in scheelite from the Weondong W-skarn deposit, South Korea. Ore Geol. Rev. 2020, 116, 103219. [Google Scholar] [CrossRef]
  3. Brugger, J.; Lahaye, Y.; Costa, S.; Lambert, D.; Bateman, R. Inhomogeneous distribution of REE in scheelite and dynamics of Archaean hydrothermal systems (Mt. Charlotte and Drysdale gold deposits, Western Australia). Contrib. Miner. Pet. 2000, 139, 251–264. [Google Scholar] [CrossRef]
  4. Wu, S.H.; Mao, J.W.; Ireland, T.R.; Zhao, Z.; Yao, F.; Yang, Y.; Sun, W. Comparative geochemical study of scheelite from the Shizhuyuan and Xianglushan tungsten skarn deposits, South China: Implications for scheelite mineralization. Ore Geol. Rev. 2019, 109, 448–464. [Google Scholar] [CrossRef]
  5. Cottrant, J.F. Cristallochimie et Géochimie Desterres Rares Dans la Scheelite: Application á Quelques Gisements Français. Ph.D. Thesis, University Paris-VI, Paris, France, 1981. [Google Scholar]
  6. Zhao, W.W.; Zhou, M.F.; Williams-Jones, A.E.; Zhao, Z. Constraints on the uptake of REE by scheelite in the Baoshan tungsten skarn deposit, South China. Chem. Geol. 2018, 477, 123–136. [Google Scholar] [CrossRef]
  7. Sciuba, M.; Beaudoin, G.; Grzela, D.; Makvandi, S. Trace element composition of scheelite in orogenic gold deposits. Miner. Depos. 2020, 55, 1149–1172. [Google Scholar] [CrossRef]
  8. Nie, L.Q.; Wang, F.Y.; White, N.C.; Zhang, D.; Yan, C.; Wang, X. Scheelite trace element compositions: A robust new tool for mineral exploration. Ore Geol. Rev. 2023, 155, 105338. [Google Scholar] [CrossRef]
  9. Sánchez, S.M.T.; Benito, M.C.M.; Pérez, M.L.C. Mineralogical and physiochemical evolution of the Los Santos scheelite skarn, Salamanca, NW Spain. Econ. Geol. 2009, 104, 961–995. [Google Scholar] [CrossRef]
  10. Hazarika, P.; Mishra, B.; Pruseth, K.L. Scheelite, apatite, calcite and tourmaline compositions from the late Archean Hutti orogenic gold deposit: Implications for analogous two stage ore fluids. Ore Geol. Rev. 2016, 72, 989–1003. [Google Scholar] [CrossRef]
  11. Chen, R.; Zhu, L.; Jiang, S.Y. Fluid evolution and scheelite precipitation mechanism of the large-scale Shangfang quartz-vein-type tungsten deposit, South China: Constraints from rare earth element (REE) behaviour during fluid/rock interaction. J. Earth Sci. 2020, 31, 635–652. [Google Scholar] [CrossRef]
  12. Ghaderi, M.; Palin, J.M.; Campbell, I.H.; Sylvester, P.J. Rare earth element systematics in scheelite from hydrothermal gold deposits in the Kalgoorlie-Norseman region, Western Australia. Econ. Geol. 1999, 94, 423–437. [Google Scholar] [CrossRef]
  13. Song, G.; Qin, K.; Li, G.; Evans, N.J.; Chen, L. Scheelite elemental and isotopic signatures: Implications for the genesis of skarn-type W-Mo deposits in the Chizhou Area, Anhui Province, Eastern China. Am. Miner. 2014, 99, 303–317. [Google Scholar] [CrossRef]
  14. Poulin, R.S.; Kontak, D.J.; McDonald, A.; McCLenaghan, M.B. Assessing scheelite as an ore-deposit discriminator using its trace-element and REE chemistry. Can. Miner. 2018, 56, 265–302. [Google Scholar] [CrossRef]
  15. Li, W.; Xie, G.Q.; Cook, N.J.; Mao, J.W.; Li, C.; Ciobanu, C.L.; Zhang, Z.Y. Tracking dynamic hydrothermal processes: Textures, in-situ Sr-Nd isotopes and trace element analysis of scheelite from the Yangjiashan vein-type W deposit, South China. Am. Miner. 2021, 106, 1987–2002. [Google Scholar] [CrossRef]
  16. Dai, Z.W.; Li, G.M.; Xie, Y.L.; Yang, Z.M.; Huizenga, J.M.; Liang, W.; Fu, J.-G.; Cao, H.-W. Source and evolution of the ore-forming fluid of the Cuonadong Sn-W-Be polymetallic deposit (southern Tibet, China): Constraints from scheelite trace element and Sr isotope geochemistry. Ore Geol. Rev. 2022, 142, 104570. [Google Scholar] [CrossRef]
  17. Chen, X.Y.; Guo, F.L.; Chen, Q.; Liu, X.; Zhao, Z. Dissolution behavior of the associated rare-earth elements in scheelite using a mixture of sulfuric and phosphoric acids. Miner. Eng. 2019, 144, 106057. [Google Scholar] [CrossRef]
  18. Liu, Y.; Deng, J.; Li, C.; Shi, G.; Zheng, A. REE composition in scheelite and scheelite Sm-Nd dating for the Xuebaoding W-Sn-Be deposit in Sichuan. Chin. Sci. Bull. 2007, 52, 2543–2550. [Google Scholar] [CrossRef]
  19. Wang, G.; Du, G.; Liu, S.S.; Shi, H.; Zhang, L.; Ren, J. Accurate determination of rare earth elements in scheelite using high resolution-inductively coupled plasma-mass spectrometry-An instance of Nanyangtian scheelite mining, Malipo, Yunnan. Rock Miner. Anal. 2012, 31, 1050–1057. [Google Scholar]
  20. Zhao, Z.W.; Li, H.G. Thermodynamics for leaching of scheelite: Pseudo-ternary system phase diagram and its application. Metall. Mater. Trans. B 2008, 39, 519–523. [Google Scholar] [CrossRef]
  21. Hamid, S.A.; Alfonso, P.; Oliva, J.; Anticoi, H.; Guasch, E.; Sampaio, C.H.; Garcia-Vallès, M.; Escobet, T. Modeling the liberation of comminuted scheelite using mineralogical properties. Minerals 2019, 9, 536. [Google Scholar] [CrossRef]
  22. Chu, Z.Y.; Guo, J.H.; Yang, Y.H.; Liang, Q.; Chen, L.; Li, X.; Gao, J. Evaluation of sample dissolution method for Sm-Nd isotonic analysis of scheelite. J. Anal. At. Spectrom. 2012, 27, 509–515. [Google Scholar] [CrossRef]
  23. Gray, A.L. Solid sample introduction by laser ablation for inductively coupled plasma source mass spectrometry. Analyst 1985, 110, 551–556. [Google Scholar] [CrossRef]
  24. Mankoula, A.F.; Tawfik, W.; Gagnon, J.E.; Fryer, B.J.; El-Mekawy, F.; Shaheen, M.E. ICMMS-2: Assessment of heavy metals content in the agricultural soils of Kafr El-Zayat Egypt using laser ablation inductively coupled plasma mass spectrometry and inductively coupled plasma optical emission spectroscopy. Egypt. J. Chem. 2021, 64, 1167–1177. [Google Scholar] [CrossRef]
  25. Shaheen, M.E.; Tawfik, W.; Mankoula, A.F.; Gagnon, J.E.; Fryer, B.J.; El-Mekawy, F. Determination of heavy metal content and pollution indices in the agricultural soils using laser ablation inductively coupled plasma mass spectrometry. Environ. Sci. Pollut. Res. 2021, 28, 36039–36052. [Google Scholar] [CrossRef]
  26. Sylvester, P.J.; Ghaderi, M. Trace element analysis of scheelite by excimer laser ablation-inductively coupled plasma-mass spectrometry (ELA-ICP-MS) using a synthetic silicate glass standard. Chem. Geol. 1997, 141, 49–65. [Google Scholar] [CrossRef]
  27. Fu, Y.; Sun, X.M.; Xiong, D.X. In-situ determination of rare earth elements in scheelite by laser ablation-inductively coupled plasma-mass spectrometry. Rock Miner. Anal. 2013, 32, 875–882. [Google Scholar]
  28. Hao, Y.J.; Shang, Q.Q.; Ren, Y.S.; Liu, X.; Chen, C. In situ analysis of rare earth element composition of scheelite by LA-ICP-MS. J. Jilin Univ. Earth Sci. Ed. 2020, 50, 1029–1041. [Google Scholar]
  29. Xiao, Y.T.; Yang, J.; Deng, J.; Wang, W. Influence of spot size on LA-ICP-MS ablation behavior for synthetic calcium tungstate and silicate glass reference material NIST SRM 610. At. Spectrosc. 2021, 42, 36–42. [Google Scholar] [CrossRef]
  30. Fryer, B.J.; Jackson, S.E.; Longerich, H.P. The design, operation and role of the laser-ablation microprobe coupled with an inductively coupled plasma-mass spectrometer (LAM-ICP-MS) in the earth sciences. Can. Mineral. 1995, 33, 303–312. [Google Scholar]
  31. Xue, D.; Deng, X.-H.; Bagas, L.; Chen, X.-A.; Wu, Y.-S.; Jiang, X. Genesis of the Heiyanshan tungsten skarn deposit in the East Tianshan, NW China: Insights from geology, fluid inclusion, isotopic geochemistry and geochronology. Front. Earth Sci. 2021, 9, 664603. [Google Scholar] [CrossRef]
  32. Sun, C.P.; Chen, Y.F.; Liu, Y. Analysis of metallogenic system of Xiaodushan tungsten deposit in Beishan area. Gansu Sci. Technol. 2017, 33, 21–25. [Google Scholar]
  33. Müller, W.; Shelley, M.; Miller, P.; Broude, S. Initial performance metrics of a new custom-designed ArF Excimer LA-ICP-MS system coupled to a two-volume laser-ablation cell. J. Anal. At. Spectrom. 2009, 24, 209–214. [Google Scholar] [CrossRef]
  34. Xiong, D.Y.; Guo, L.F.; Liu, C.; Wang, L.; Liu, Y.; Tan, X. Analytical effect of stabilizer volume and shape on zircon U–Pb dating by nanosecond LA-ICP-QMS. J. Anal. Sci. Technol. 2022, 13, 13. [Google Scholar] [CrossRef]
  35. Lei, X.-F.; Jiang, S.-Y.; Su, H.-M.; Ying, Y.-C. Hydrothermal titanite U–Pb age and geochemistry as a reliable chronometer and genetic tracer for quartz vein-type tungsten deposit at Qipangou of Qinling orogenic belt, Central China. Ore Geol. Rev. 2021, 135, 104246. [Google Scholar] [CrossRef]
  36. Jochum, K.P.; Nohl, U.; Herwig, K.; Lammel, E.; Stoll, B.; Hofmann, A.W. GeoReM: A new geochemical database for reference materials and isotopic standards. Geostand. Geoanal. Res. 2005, 9, 333–338. [Google Scholar] [CrossRef]
  37. Fricker, M.B. Design of Ablation Cells for LA-ICP-MS. Ph.D. Thesis, ETH Zürich, Zürich, Switzerland, 2012. [Google Scholar] [CrossRef]
  38. Liu, Y.S.; Hu, Z.C.; Gao, S.; Günther, D.; Xu, J.; Gao, C.G.; Chen, H.H. In situ analysis of major and trace elements of anhydrous minerals by LA-ICP-MS without applying an internal standard. Chem. Geol. 2008, 257, 34–43. [Google Scholar] [CrossRef]
  39. Liu, M.W.; Tan, X.J. Uncertainty of the results of electron probe microanalysis using a spectrometer with wavelength dispersion in the study of geological samples. J. Anal. Chem. 2022, 77, 1333–1339. [Google Scholar] [CrossRef]
  40. Armstrong, J.T. CITZAF: A package of correction programs for the quantitative electron microbeam X-ray analysis of thick polished materials, thin Films, and particles. Microbeam Anal. 1995, 4, 177–200. [Google Scholar]
  41. Tan, X.J.; Wang, Z.M. General high-pressure closed acidic decomposition method of rock samples for trace element determination using inductively coupled plasma mass spectrometry. J. Anal. Chem. 2020, 75, 1295–1303. [Google Scholar]
Figure 1. Transient signal profiles of Ca and W. Panel (a) and panel (b) were the transient signal results of scheelite and NIST SRM 610, respectively. Here 50 and 35 μm spot sizes were utilized.
Molecules 29 00051 g001
Figure 2. Correlation coefficients of the signal intensity of Ca with W in an ablation. The correlation coefficients were obtained from the intensity values of Ca and W collected at each sweep of the ICP-MS detector after the ablation started. Boxes in blue and white are results for scheelites, while boxes in light gold and green are results for NIST SRM 610.
Molecules 29 00051 g002
Figure 3. Result comparison of scheelite determined by EPMA and LA-ICP-MS. Panels (ac) were the concentration comparison for WO3, CaO and SiO2 in scheelite samples from EPMA and LA-ICP-MS analyses. Here the error bar was the standard deviation for repetitive quantifications. The LA-ICP-MS analysis was performed using 5 Hz laser repetition, 35 μm spot size, and 2.51 J/cm2.
Molecules 29 00051 g003
Table 1. Chemical compositions of scheelite samples by EPMA 1.
SampleCaOWO3SiO2Na2OMgOMnOFeOMoO3
QPL-1QPL-1_119.08 80.87 0.30 0.019LDLD0.0020.025
QPL-1_219.60 79.78 0.19 LDLDLD0.022LD
QPL-1_319.54 79.64 0.14 0.0070.004LD0.013LD
Average19.40 80.09 0.21 0.009 0.001 LD0.012 0.008
0.33 0.78 0.10 0.011 //0.012 /
QPL-2QPL-2_118.74 79.77 0.11 LD0.021LD0.0210.102
QPL-2_219.35 79.48 0.16 LD0.034LDLD0.068
QPL-2_319.83 79.35 0.14 0.0360.001LDLDLD
Average19.31 79.54 0.14 0.012 0.019 LD0.007 0.057
0.63 0.25 0.03 /0.019 /0.014 0.060
QPL-3QPL-3_119.25 80.61 0.10 LDLD0.0290.0380.008
QPL-3_219.61 79.87 0.21 0.058LDLDLDLD
QPL-3_319.39 79.79 0.11 LD0.0170.011LD0.034
Average19.42 80.09 0.14 0.019 0.006 0.013 0.013 0.014
0.21 0.52 0.07 //0.017 /0.021
QPL-4QPL-4_119.68 79.37 0.14 0.0740.0330.0140.038LD
QPL-4_219.59 78.28 0.24 0.1860.0360.0210.0540.017
QPL-4_319.27 79.78 0.10 LD0.0200.015LD0.042
Average19.52 79.14 0.16 0.130 0.030 0.017 0.031 0.020
0.25 0.90 0.08 0.091 0.010 0.004 0.032 0.024
QPL-5QPL-5_119.45 80.36 0.17 0.0450.0110.0110.014dl
QPL-5_219.57 80.79 0.14 LD0.034LD0.0090.017
QPL-5_319.50 79.75 0.19 0.071LD0.019LDLD
Average19.51 80.30 0.17 0.039 0.015 0.010 0.008 0.006
0.07 0.60 0.03 0.041 0.020 0.011 0.008 /
1 LD denotes below detection limits.
Table 2. Content results of Y and REEs in scheelite by SN-ICP-MS and LA-ICP-MS 1.
ElementQPL-1QPL-2QPL-3QPL-4QPL-5
SN-ICP-MSLA-ICP-MSSN-ICP-MSLA-ICP-MSSN-ICP-MSLA-ICP-MSSN-ICP-MSLA-ICP-MSSN-ICP-MSLA-ICP-MS
Content
μg/g
Content
μg/g
Content
μg/g
Content
μg/g
Content
μg/g
Content
μg/g
Content
μg/g
Content
μg/g
Content
μg/g
Content
μg/g
Y35.701.3933.421.1738.921.2139.461.4035.501.133.790.3721.200.6619.730.1924.600.8324.740.70
La3.040.213.430.212.560.62.690.172.460.122.320.311.470.071.480.021.830.091.740.16
Ce13.010.6413.740.3012.010.5611.540.4510.100.1910.240.296.080.096.370.048.440.138.490.24
Pr2.560.192.770.052.060.092.060.061.840.061.980.021.180.041.350.021.520.051.530.04
Nd15.300.7115.970.5412.610.5012.260.3810.800.2711.480.137.110.187.460.109.060.238.900.11
Sm5.290.365.710.284.600.314.750.503.860.154.400.052.530.102.370.043.180.133.200.09
Eu2.770.172.600.531.660.081.610.062.410.052.020.020.930.031.060.051.130.041.140.03
Gd5.870.366.170.815.280.175.120.174.500.084.310.072.890.053.080.043.620.073.580.15
Tb1.040.080.960.270.940.030.910.030.800.020.840.010.520.020.510.010.650.020.650.02
Dy5.870.345.900.775.360.165.200.174.570.114.440.063.010.073.200.043.680.093.700.10
Ho1.140.081.180.091.030.061.000.030.880.050.990.050.580.030.640.010.710.040.710.02
Er2.820.182.930.302.500.052.450.072.170.052.040.041.420.031.580.021.750.041.740.06
Tm0.300.020.310.030.260.010.260.010.250.010.290.060.150.010.130.020.180.010.180.01
Yb1.320.081.380.131.140.051.140.031.020.051.330.020.670.030.550.010.820.040.820.02
Lu0.160.010.150.030.140.010.150.010.160.010.180.010.0810.0040.0870.0010.100.0050.1010.003
∑REE+Y96.181.396.622.0191.031.5790.581.7981.521.1780.671.2149.810.6949.610.4561.271.1461.231.37
1 Results are given as confidence intervals (95%, n ≥ 3).
Table 3. Operating parameters for the utilized LA-ICPMS 1.
ICP-MS Laser Ablation
MS typeAgilent 7700xLaser typeArF excimer
RF power, W1450Wavelength, nm 193
Plasma gas, L/min Ar15.0Pulse duration, ns5
Auxiliary gas, L/min Ar1.0Repetition rate, Hz5
Make-up gas, L/min Ar *0.8Fluence, J/cm2 2.51
Detector modeDual Spot size, µm35
Settling time, ms0.2Sampling strategySingle spot
Dwell time, ms *5.0Pulses/spot200
Sweeps/reading *1Carrier gas, L/min He *0.2 Inner cup
0.6 Main volume
Data collection modeTime-resolved analysis
1 Parameters with star mark (*) are presented as the default values, which were modified during instrumental optimization.
Disclaimer/Publisher’s Note: The statements, opinions and data contained in all publications are solely those of the individual author(s) and contributor(s) and not of MDPI and/or the editor(s). MDPI and/or the editor(s) disclaim responsibility for any injury to people or property resulting from any ideas, methods, instructions or products referred to in the content.

