
Use of Double Gelled Microspheres to Improve Release Control of Cinnamon-Loaded Nanoemulsions


Abstract
:1. Introduction
2. Results
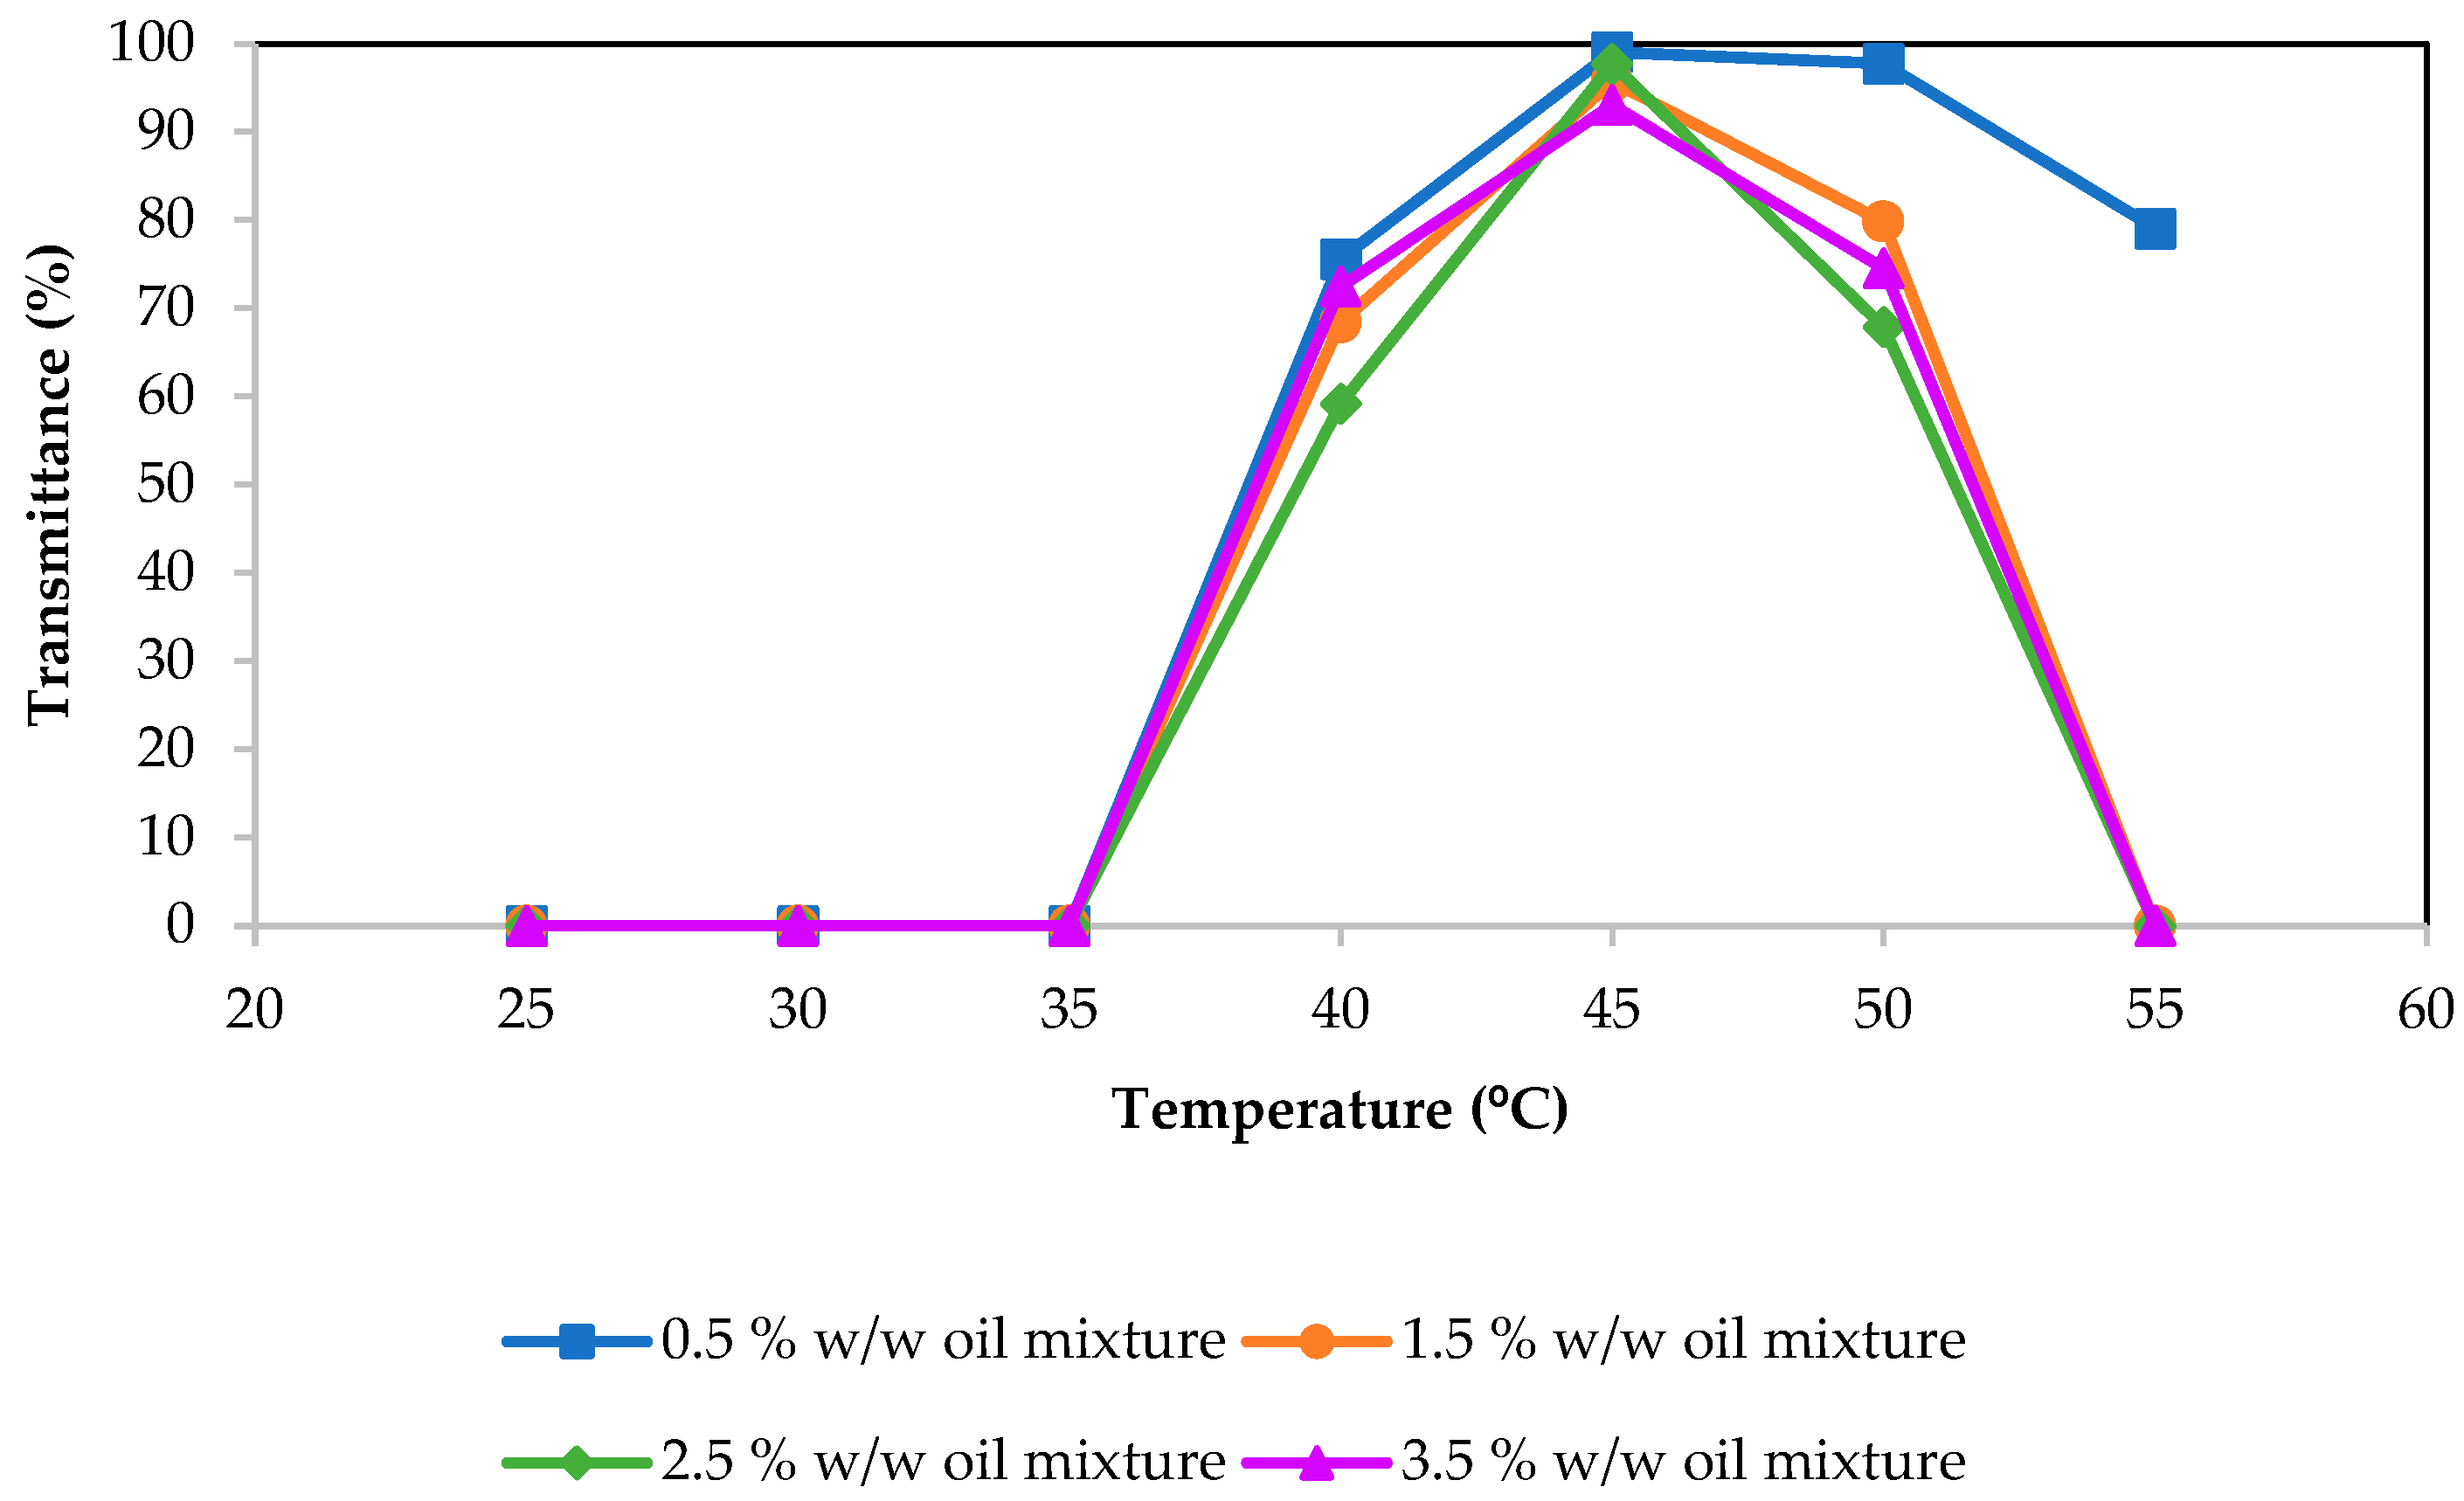
2.1. Phase Diagram
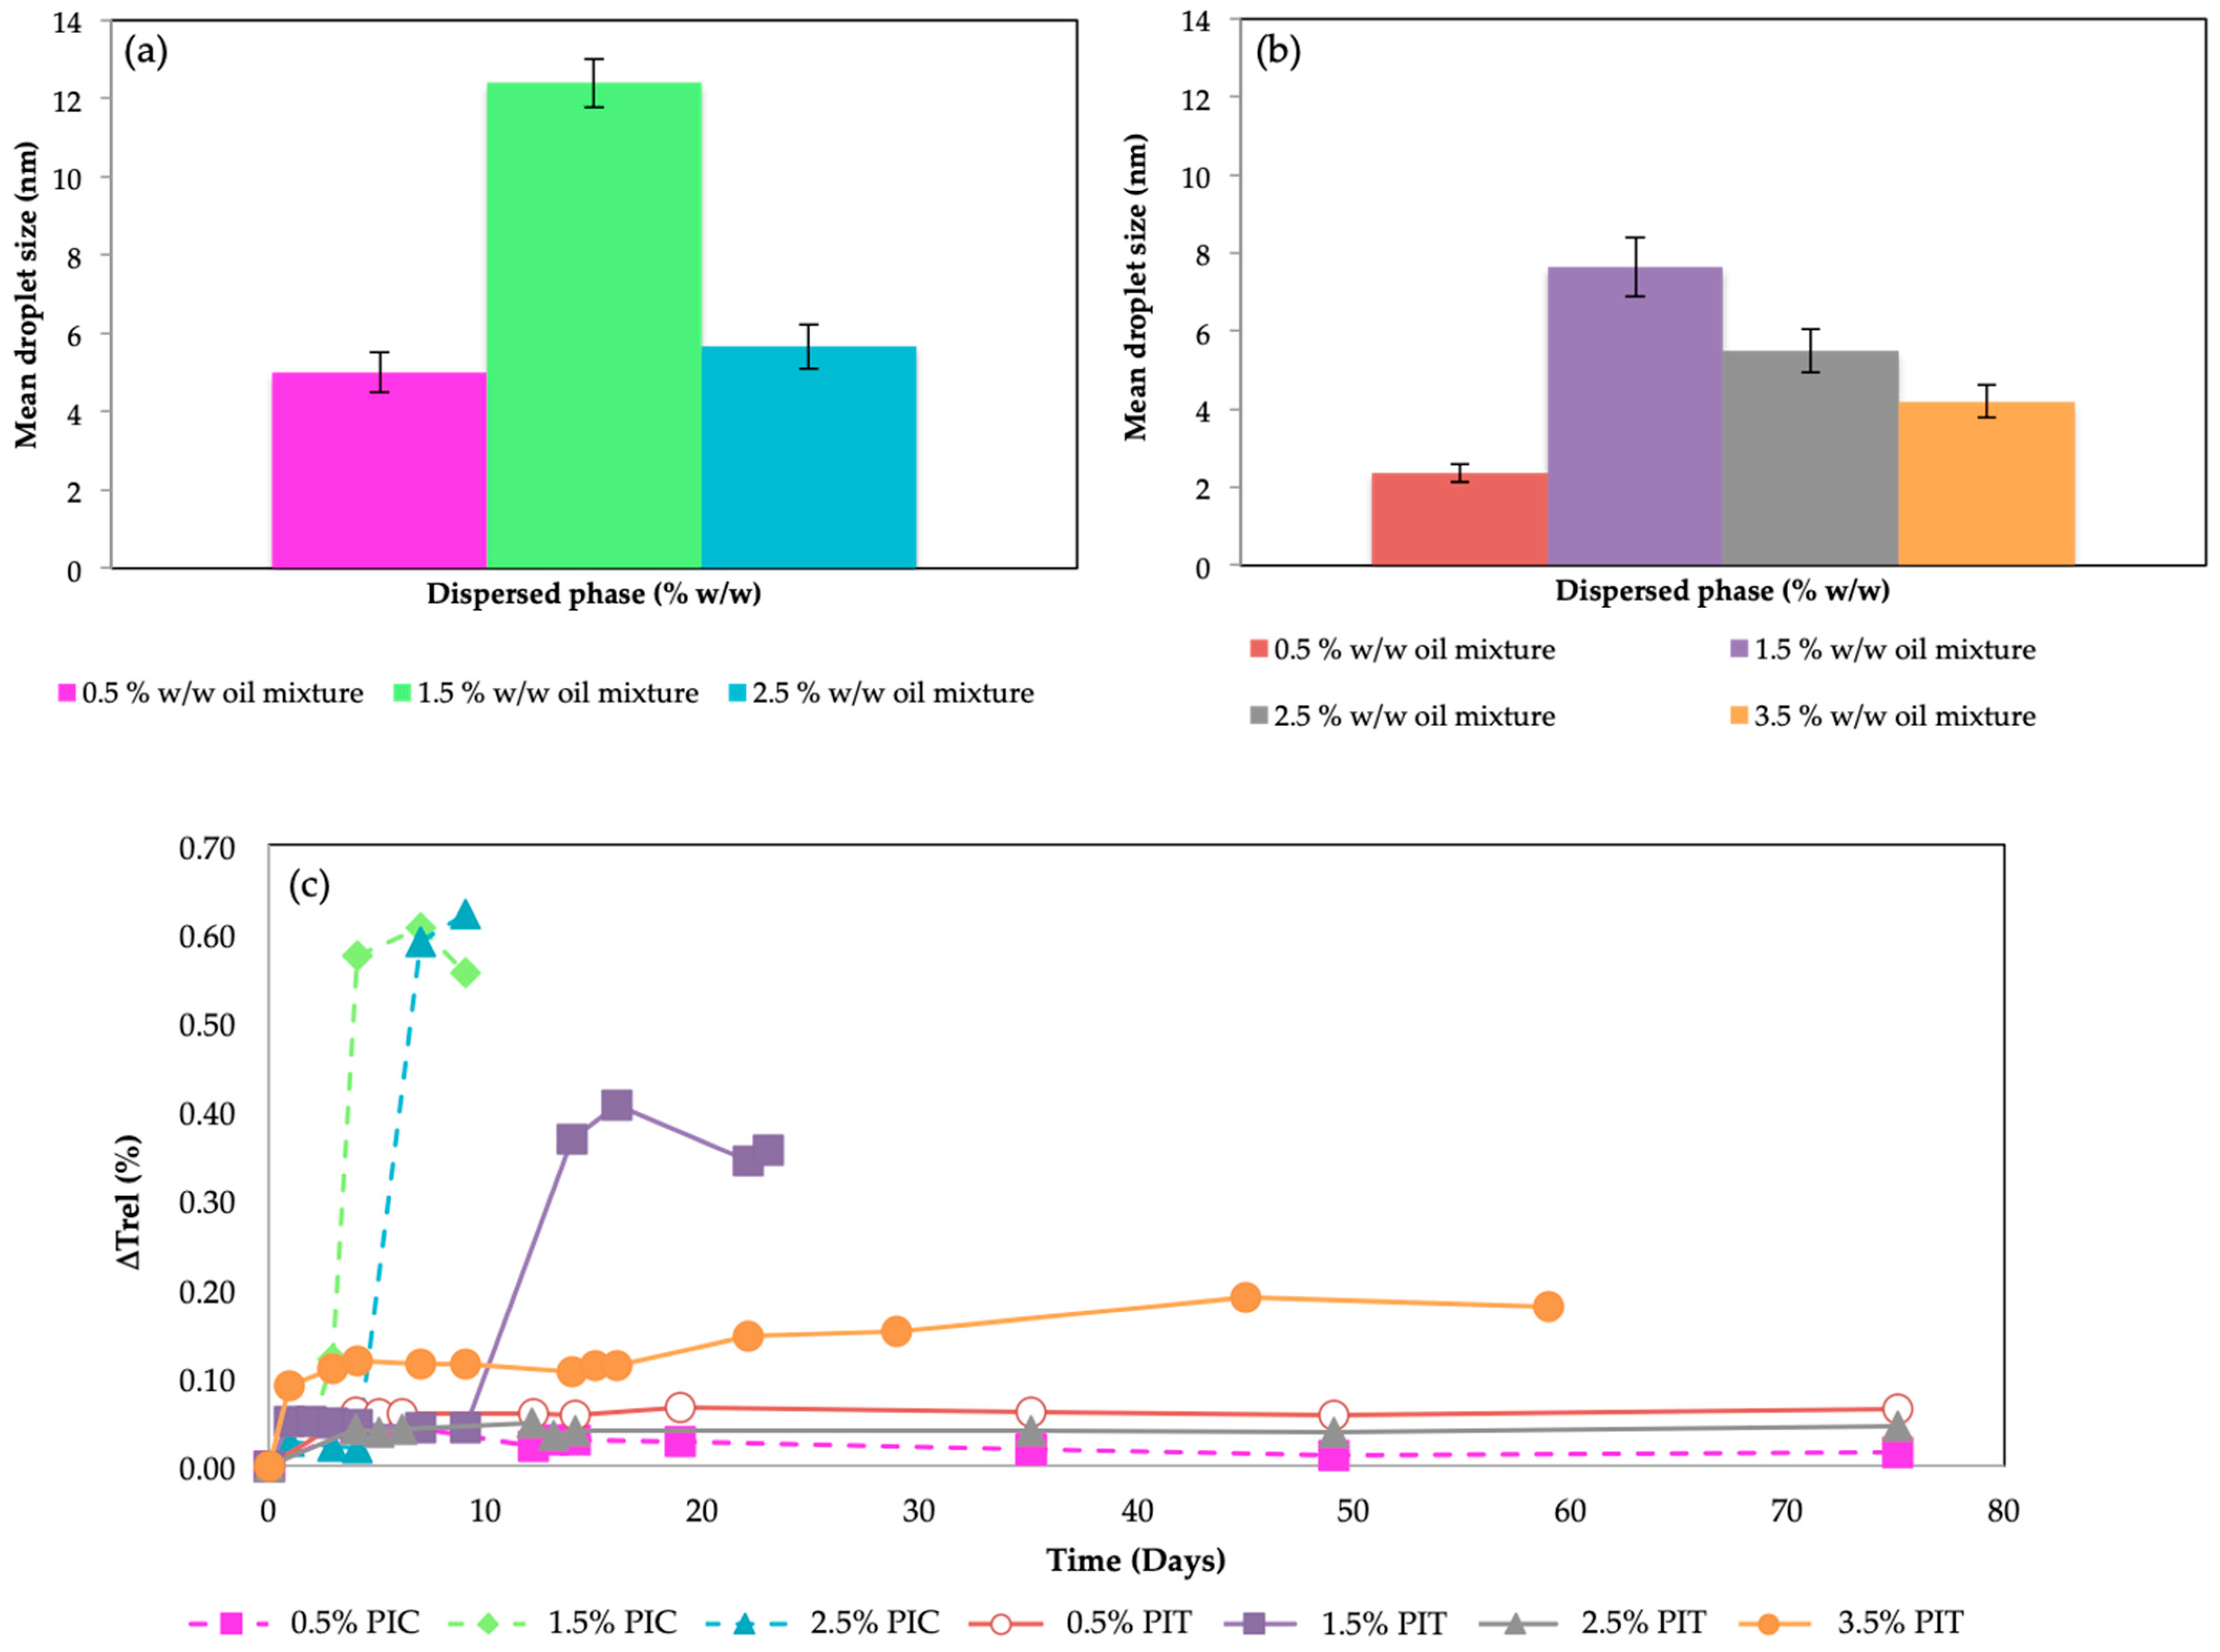
2.2. Nanoemulsions Characterization
2.3. Encapsulation of Nanoemulsions
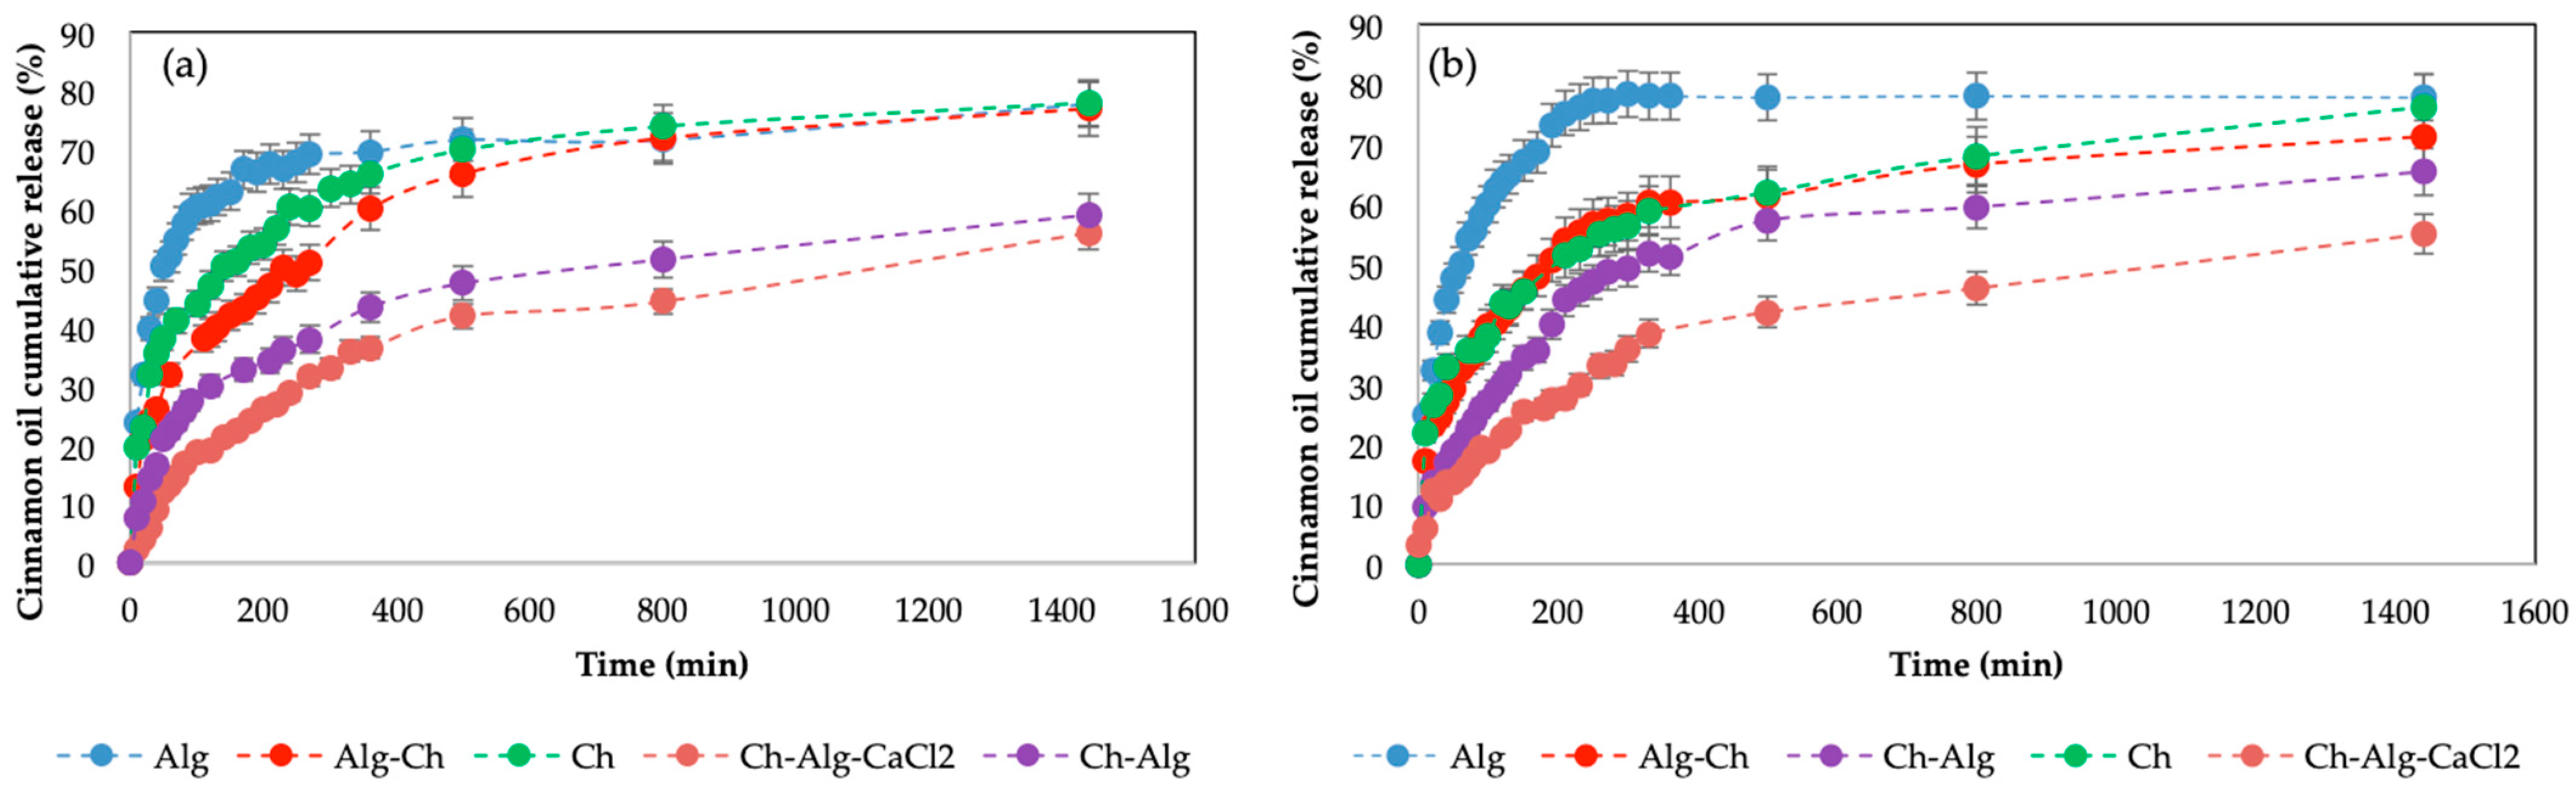
2.4. Cinnamon Oil Release Kinetics
3. Materials and Methods
3.1. Materials
3.2. Determination of Phase Diagram
3.3. Nanoemulsion Formation by PIC Method
3.4. Nanoemulsion Formation by PIT Method
3.5. Droplet Size
3.6. Stability Measurements
3.7. Encapsulation of Nanoemulsions
3.7.1. Encapsulation in an Alginate Matrix
3.7.2. Encapsulation in a Chitosan Matrix
3.8. Bead Size Determination
3.9. Encapsulation Efficiency
3.10. SEM Measurements
3.11. Release Kinetics of Cinnamon Nanoemulsions Loaded in Different Beads
4. Conclusions
Author Contributions
Funding
Data Availability Statement
Acknowledgments
Conflicts of Interest
References
- Timilsena, Y.P.; Haque, M.A.; Adhikari, B. Encapsulation in the Food Industry: A Brief Historical Overview to Recent Developments. Food Nutr. Sci. 2020, 11, 481–508. [Google Scholar] [CrossRef]
- Marcillo-Parra, V.; Tupuna-Yerovi, D.S.; González, Z.; Ruales, J. Encapsulation of Bioactive Compounds from Fruit and Vegetable By-Products for Food Application—A Review. Trends Food Sci. Technol. 2021, 116, 11–23. [Google Scholar] [CrossRef]
- McClements, D.J.; Rao, J. Food-grade nanoemulsions: Formulation, fabrication, properties, performance, biological fate, and potential toxicity. Crit. Rev. Food Sci. Nutr. 2011, 51, 285–330. [Google Scholar] [CrossRef] [PubMed]
- Rodrigues Reis, D.; Ambrosi, A.; Di Luccio, M. Encapsulated essential oils: A perspective in food preservation. Future Foods 2022, 5, 100126. [Google Scholar] [CrossRef]
- Maes, C.; Bouquillon, S.; Fauconnier, M.L. Encapsulation of Essential Oils for the Development of Biosourced Pesticides with Controlled Release: A Review. Molecules 2019, 24, 2539. [Google Scholar] [CrossRef]
- Sneha, K.; Kumar, A. Nanoemulsions: Techniques for the preparation and the recent advances in their food applications. Innov. Food Sci. Emerg. Technol. 2022, 76, 102914. [Google Scholar] [CrossRef]
- Santamaría, E.; Maestro, A.; Vilchez, S.; González, C. Study of nanoemulsions using carvacrol/MCT-(Oleic acid-potassium oleate)/Tween 80®-water system by low energy method. Heliyon 2023, 9, e16967. [Google Scholar] [CrossRef]
- Santamaría, E.; Maestro, A.; González, C. Encapsulation of Carvacrol-Loaded Nanoemulsion Obtained Using Phase Inversion Composition Method in Alginate Beads and Polysaccharide-Coated Alginate Beads. Foods 2023, 12, 1874. [Google Scholar] [CrossRef]
- Fu, X.; Gao, Y.; Yan, W.; Zhang, Z.; Sarker, S.; Yin, Y.; Liu, Q.; Feng, J.; Chen, J. Preparation of eugenol nanoemulsions for antibacterial activities. RSC Adv. 2022, 12, 3180–3190. [Google Scholar] [CrossRef]
- Liu, T.; Gao, Z.; Zhong, W.; Fu, F.; Li, G.; Guo, J.; Shan, Y. Preparation, Characterization, and Antioxidant Activity of Nanoemulsions Incorporating Lemon Essential Oil. Antioxidants 2022, 11, 650. [Google Scholar] [CrossRef]
- Chuesiang, P.; Siripatrawan, U.; Sanguandeekul, R.; McLandsborough, L.; McClements, D.J. Optimization of cinnamon oil nanoemulsions using phase inversion temperature method: Impact of oil phase composition and surfactant concentration. J. Colloid. Interface Sci. 2018, 504, 208–216. [Google Scholar] [CrossRef]
- Alizadeh Behbahani, B.; Falah, F.; Lavi Arab, F.; Vasiee, M.; Tabatabaee Yazdi, F. Chemical Composition and Antioxidant, Antimicrobial, and Antiproliferative Activities of Cinnamomum zeylanicum Bark Essential Oil. Evid. Based Complement. Altern. Med. 2020, 2020, 5190603. [Google Scholar] [CrossRef]
- Błaszczyk, N.; Rosiak, A.; Kałuzna-Czaplinska, J. The Potential Role of Cinnamon in Human Health. Forests 2021, 12, 648. [Google Scholar] [CrossRef]
- Majeed, H.; Liu, F.; Hategekimana, J.; Sharif, H.R.; Qi, J.; Ali, B.; Bian, Y.Y.; Ma, J.; Yokoyama, W.; Zhong, F. Bactericidal action mechanism of negatively charged foodgrade clove oil nanoemulsions. Food Chem. 2016, 197, 75–83. [Google Scholar] [CrossRef]
- Jo, Y.J.; Chun, J.Y.; Kwon, Y.J.; Min, S.G.; Hong, G.P.; Choi, M.J. Physical and antimicrobial properties of trans-cinnamaldehyde nanoemulsions in water-melon juice. LWT-Food Sci. Technol. 2015, 60, 444–451. [Google Scholar] [CrossRef]
- Ricaurte, L.; De Jesús Perea-Flores, M.; Martinez, A.; Quintanilla-Carvajal, M.X. (Production of high-oleic palm oil nanoemulsions by high-shear homogenization (microfluidization). Innov. Food Sci. Emerg. Technol. 2016, 35, 75–85. [Google Scholar] [CrossRef]
- Uluata, S.; Decker, E.A.; McClements, D.J. Optimization of nanoemulsion fabrication using microfluidization: Role of surfactant concentration on formation and stability. Food Biophys. 2016, 11, 52–59. [Google Scholar] [CrossRef]
- Pan, K.; Chen, H.; Davidson, P.M.; Zhong, Q. Thymol nanoencapsulated by sodium caseinate: Physical and antilisterial properties. J. Agric. Food Chem. 2014, 62, 649–1657. [Google Scholar] [CrossRef]
- Scholz, P.; Keck, C.M. Nanoemulsions produced by rotor–stator high-speed stirring. Int. J. Pharm. 2015, 482, 110–117. [Google Scholar] [CrossRef]
- Wu, J.E.; Lin, J.; Zhong, Q. Physical and antimicrobial characteristics of thyme oil emulsified with soluble soybean polysaccharide. Food Hydrocoll. 2014, 39, 144–150. [Google Scholar] [CrossRef]
- Shinoda, K.; Saito, H.J. The effect of temperature on the phase equilibria and the types of dispersions of the ternary system composed of water, cyclohexane, and nonionic surfactant. Colloid. Interface Sci. 1968, 26, 70–74. [Google Scholar] [CrossRef]
- Morales, D.; Gutiérrez, J.M.; García-Celma, M.J.; Solans, C. A Study of the relation between bicontinuous microemulsions and Oil/Water nano-emulsion formation. Langmuir 2003, 19, 7196–7200. [Google Scholar] [CrossRef]
- Waisaka, S.; Nishimura, T.; Gohtani, S. O/W nanoemulsion formation using an isothermal low-energy method in a mixture of polyglycerol monolaurate with glycerol system. J. Oleo Sci. 2015, 64, 405–413. [Google Scholar] [CrossRef]
- Waisaka, S.; Nishimura, T.; Gotani, S. Phase behaviour and formation of O/W nanoemulsion in vegetable oil/mixture of polyglycerol polyricinoleate and polyglycerin fatty acid ester/water systems. J. Oleo Sci. 2014, 63, 229–237. [Google Scholar] [CrossRef]
- Matricardi, P.; Di Meo, C.; Coviello, T.; Alhaique, F. Recent advances and perspectives on coated alginate microspheres for modified drug deliver. Expert. Opin. Drug Deliv. 2008, 5, 417–425. [Google Scholar] [CrossRef]
- Atencio, S.; Maestro, A.; Santamaría, E.; Gutiérrez, J.M.; González, C. Encapsulation of ginger oil in alginate-based shell materials. Food Biosci. 2020, 37, 100714. [Google Scholar] [CrossRef]
- Chang, Y.; McLAndsborough, L.; McClements, D.J. Physicochemical properties of antimicrobial efficacy of carvacrol nanoemulsions formed by spontaneous emulsification. J. Agric. Food Chem. 2013, 61, 8906–8913. [Google Scholar] [CrossRef]
- Gutiérrez, J.M.; González, C.; Maestro, A.; Solè, I.; Pey, C.M.; Nolla, J. Nanoemulsions: New applications and optimization of their preparation. Curr. Opin. Colloid. Interface Sci. 2008, 13, 245–251. [Google Scholar] [CrossRef]
- Solans, C.; Solè, I. Nanoemulsions: Formation by low-energy methods. Curr. Opin. Colloid. Interface Sci. 2002, 17, 246–254. [Google Scholar] [CrossRef]
- Heunemann, P.; Prévost, S.; Grillo, I.; Marino, C.M.; Meyer, J.; Gradzielski, M. Formation and structure of slightly anionically charged nanoemulsions obtained by phase inversion concentration (PIC) method. Soft Matter 2011, 7, 5697. [Google Scholar] [CrossRef]
- Salvia-Trujillo, L.; Rojas-Graü, M.A.; Soliva-Fortuny, R.; Martín-Belloso, O. Impact of microfluidization or ultrasound processing on the antimicrobial activity against Escherichia coli of lemongrass oil-loaded nanoemulsions. Food Control 2014, 37, 292–297. [Google Scholar] [CrossRef]
- Sugumar, S.; Ghosh, V.; Nirmala, M.J.; Mukherjee, A.; Chandrasekaran, N. Ultrasonic emulsification of eucalyptus oil nanoemulsion: Antibacterial activity against Staphylococcus aureus and wound healing activity in Wistar rats. Ultrason. Sonochem. 2014, 21, 1044–1049. [Google Scholar] [CrossRef]
- Jumazhanova, M.; Kakimova, Z.; Zharykbasov, Y.; Kassymov, S.; Zhumadilova, G.; Muratbayev, A.; Tashybayeva, M.; Suychinov, A. Effect of the Encapsulation Process on the Viability of Probiotics in a Simulated Gastrointestinal Tract Model Medium. Processes 2023, 11, 2757. [Google Scholar] [CrossRef]
- Cheng, M.; Cui, Y.; Guo, Y.; Zhao, P.; Wang, J.; Zhang, R.; Wang, X. Design of carboxymethyl chitosan-reinforced pH-responsive hydrogels for on-demand release of carvacrol and simulation release kinetics. Food Chem. 2023, 405, 134856. [Google Scholar] [CrossRef]
- Wang, L.; Gang, X.; Xiao, Y.; Ren, Y.; Wang, J.; Niu, B.; Li, W. Sodium Alginate/ carboxymethyl chitosan-CuO hydrogel beads as a pH-sensitive carrier for the controlled release of curcumin. Eur. Polym. J. 2023, 192, 112069. [Google Scholar] [CrossRef]
- Jayanudin, J.; Rochmadi, R.; Wiratni, W.; Yulvianti, M.; Barleany, D.R.; Ernayati, W. Encapsulation of red ginger oleoresin (Zingiber officinale var. Rubrum) Chitosan Alginate Wall Mater. Using Spray drying. Res. J. Appl. Sci. Eng. Technol. 2015, 10, 1370–1378. [Google Scholar] [CrossRef]
- Nazlı, A.B.; Açıkel, Y.S. Loading of cancer drug resveratrol to pH-Sensitive, smart, alginate-chitosan hydrogels and Investigation of controlled release kinetics. J. Drug Deliv. Sci. Technol. 2019, 53, 101199. [Google Scholar] [CrossRef]
- Zhang, H.F.; Ma, L.; Su, F.; Ma, X.F.; Li, T.; Zha, X.; Yan, H.J. pH and reduction dual-responsive feather keratin- sodium alginate nanogels with high drug loading capacity for tumor-targeting DOX delivery. Polym. Test. 2021, 103, 107375. [Google Scholar] [CrossRef]
- Huang, X.; Braze, C.S. On the importance and mechanisms of burst release in matrix-controlled drug delivery systems. J. Control. Release 2001, 73, 121–136. [Google Scholar] [CrossRef]
- Korsmeyer, R.W.; Gurny, E.; Doelker, E.; Buri, P.; Peppas, N.A. Mechanisms of solute release from porous hydrophilic polymers. Int. J. Pharm. 1983, 15, 25–35. [Google Scholar] [CrossRef]
- Uskoković, V. Mechanism of formation governs the mechanism of release of antibiotics from calcium phosphate nanopowders and cements in a drug-dependent manner. J. Mater. Chem. B 2019, 7, 3982–3992. [Google Scholar] [CrossRef] [PubMed]
- Ferrero, C.; Massuelle, D.; Doelker, E. Towards elucidation of the drug release mechanism from compressed hydrophilic matrices made of cellulose ethers. II. Evaluation of a possible swelling-controlled drug release mechanism using dimensionless analysis. J. Control. Release 2010, 141, 223–233. [Google Scholar] [CrossRef] [PubMed]
- Ritger, P.L.; Peppas, N.A. A simple equation for description of solute release II. Fickian and anomalous release from swelleable devices. J. Control. Release 1987, 5, 37–42. [Google Scholar] [CrossRef]
- Fu, Y.; Kao, W.J. Drug release kinetics and transport mechanisms of non-degradable and degradable polymeric delivery systems. Expert. Opin. Drug Deliv. 2010, 7, 429–444. [Google Scholar] [CrossRef] [PubMed]
- Chew, S.; Tan, C.; Long, K.; Nyam, K. In-vitro evaluation of kenaf seed oil in chitosan coated-high methoxyl pectin-alginate microcapsules. Ind. Crops Prod. 2015, 72, 230–236. [Google Scholar] [CrossRef]
- Makimori, R.Y.; Endo, E.H.; Makimori, J.W.; Zanqueta, E.B.; Ueda-Nakamura, T.; Leimann, F.V.; Gonçalves, O.H.; Dias Filho, B.P. Preparation, characterization and antidermatophytic activity of free- and microencapsulated cinnamon essential oil. J. Mycol. Méd. 2020, 30, 100933. [Google Scholar] [CrossRef]
- Wang, Y.; Yuan, C.; Liu, Y.; Cui, B. Fabrication of kappa–carrageenan hydrogels with cinnamon essential oil/hydroxypropyl–β–cyclodextrin composite: Evaluation of physicochemical properties, release kinetics and antimicrobial activity. Int. J. Biol. Macromol. 2021, 170, 593–601. [Google Scholar] [CrossRef]
- Matshetshe, K.I.; Sundararajan, P.; Manki, S.M.; Oluwafemi, O.S. Preparation, characterization and in vitro release study of β-cyclodextrin/chitosan nanoparticles loaded Cinnamomum zeylanicum essential oil. Int. J. Biol. Macromol. 2018, 118, 676–682. [Google Scholar] [CrossRef]
- Yeh, Y.M.; Tsai, T.Y.; Yang, C.Y. Encapsulation and release kinetics of polyphenols and p-coumaric acid extracted from Phyllostachys makinoi by ultrasonic pretreatment autoclaving. LWT 2022, 167, 113838. [Google Scholar] [CrossRef]
- Rakshit, M.; Srivastav, P.P. Encapsulation of hydrolysable tannin from pomegranate peel in W/O/W double emulsion: In-vitro digestion release kinetics, storage and physical stabilities. Food Hydrocoll. Health 2022, 2, 100067. [Google Scholar] [CrossRef]


| Korsmeyer-Peppas Model | |||||
|---|---|---|---|---|---|
| Sample | M24h (%) | K | n | R2 | |
| pH 2 | Alg | 77.7 | 0.2602 | 0.1664 | 0.9014 |
| Alg-Ch | 72.2 | 0.0899 | 0.3075 | 0.9786 | |
| Ch | 78.0 | 0.1456 | 0.2462 | 0.9958 | |
| Ch-Alg | 59.6 | 0.0570 | 0.3311 | 0.9783 | |
| Ch-Alg-CaCl2 | 55.9 | 0.0233 | 0.4485 | 0.9897 | |
| pH 7 | Alg | 78.5 | 0.2478 | 0.1870 | 0.8735 |
| Alg-Ch | 71.3 | 0.1172 | 0.2670 | 0.9440 | |
| Ch | 76.2 | 0.1256 | 0.2554 | 0.9827 | |
| Ch-Alg | 65.4 | 0.0569 | 0.3580 | 0.9253 | |
| Ch-Alg-CaCl2 | 55.0 | 0.0339 | 0.3937 | 0.9668 | |
Disclaimer/Publisher’s Note: The statements, opinions and data contained in all publications are solely those of the individual author(s) and contributor(s) and not of MDPI and/or the editor(s). MDPI and/or the editor(s) disclaim responsibility for any injury to people or property resulting from any ideas, methods, instructions or products referred to in the content. |
© 2023 by the authors. Licensee MDPI, Basel, Switzerland. This article is an open access article distributed under the terms and conditions of the Creative Commons Attribution (CC BY) license (https://creativecommons.org/licenses/by/4.0/).
Share and Cite
Santamaría, E.; Maestro, A.; González, C. Use of Double Gelled Microspheres to Improve Release Control of Cinnamon-Loaded Nanoemulsions. Molecules 2024, 29, 158. https://doi.org/10.3390/molecules29010158
Santamaría E, Maestro A, González C. Use of Double Gelled Microspheres to Improve Release Control of Cinnamon-Loaded Nanoemulsions. Molecules. 2024; 29(1):158. https://doi.org/10.3390/molecules29010158
Chicago/Turabian StyleSantamaría, Esther, Alicia Maestro, and Carmen González. 2024. "Use of Double Gelled Microspheres to Improve Release Control of Cinnamon-Loaded Nanoemulsions" Molecules 29, no. 1: 158. https://doi.org/10.3390/molecules29010158
APA StyleSantamaría, E., Maestro, A., & González, C. (2024). Use of Double Gelled Microspheres to Improve Release Control of Cinnamon-Loaded Nanoemulsions. Molecules, 29(1), 158. https://doi.org/10.3390/molecules29010158