Article

Electrochemiluminescence Sensor Based on CeO2 Nanocrystalline for Hg2+ Detection in Environmental Samples

1
College of Chemistry and Chemical Engineering, Yantai University, Yantai 264005, China
2
Shandong Dyne Marine Biopharmaceutical Co., Ltd., Weihai 264300, China
*
Authors to whom correspondence should be addressed.
Molecules 2024, 29(1), 1; https://doi.org/10.3390/molecules29010001
Submission received: 20 November 2023 / Revised: 5 December 2023 / Accepted: 10 December 2023 / Published: 19 December 2023
(This article belongs to the Special Issue Application of Functional Materials in Analysis and Detection)

Abstract

:
The excessive concentration of heavy-metal mercury ions (Hg2+) in the environment seriously affects the ecological environment and even threatens human health. Therefore, it is necessary to develop rapid and low-cost determination methods to achieve trace detection of Hg2+. In this paper, an Electrochemiluminescence (ECL) sensing platform using a functionalized rare-earth material (cerium oxide, CeO2) as the luminescent unit and an aptamer as a capture unit was designed and constructed. Using the specific asymmetric matching between Hg2+ and thymine (T) base pairs in the deoxyribonucleic acid (DNA) single strand, the “T−Hg−T” structure was formed to change the ECL signal, leading to a direct and sensitive response to Hg2+. The results show a good linear relationship between the concentration and the response signal within the range of 10 pM–100 µM for Hg2+, with a detection limit as low as 0.35 pM. In addition, the ECL probe exhibits a stable ECL performance and excellent specificity for identifying target Hg2+. It was then successfully used for spiked recovery tests of actual samples in the environment. The analytical method solves the problem of poor Hg2+ recognition specificity, provides a new idea for the efficient and low-cost detection of heavy-metal pollutant Hg2+ in the environment, and broadens the prospects for the development and application of rare-earth materials.

Graphical Abstract

1. Introduction

Electroluminescence (ECL) technology, as a new analytical method, has attracted much attention, combines the characteristics of both electrochemical and photochemical techniques and has the advantage of being easy to operate and portable [1,2]. This technology has low background signals and excellent sensitivity [3], due to the fact that the signal light source is not affected by the electrical energy of the excitation source, making it widely used in fields, such as environmental monitoring [4], biosensors [5], and immunoassays [6]. The emphasis on the development of ECL sensors lies in the construction of a sensing platform, in which the selection of ECL-active substances is the crucial element. Some research work has shown that traditional precious metal materials, such as gold [7,8], platinum [9], and ruthenium [10,11], have good electrical conductivity and ECL properties. However, their high prices limit their large-scale applications. Therefore, there is an urgent need to explore a simple, environmentally friendly, and low-cost ECL-active material to achieve the development of novel ECL signal amplification strategies.
Recent research developments have revealed that rare-earth nanomaterials have been widely used as attractive materials in ECL sensing analysis [12,13], due to their excellent luminescent properties and unique electron transfer properties of functional materials, which can enhance ECL signals by promoting electron transfer [14,15]. A rare-earth element terbium (Tb) metal complex was synthesized and constructed in an ECL sensor successfully with the ligand of pyridine-3-sulfonic acid (3-pSO3H) by Zhou’s team. When cadmium ions (Cd2+) were present in the environment, the ECL signal will be effectively quenched, achieving a sensitive response to Cd2+ in actual samples [16]. Yang et al. synthesized water-soluble nanoprobe iridium nanorods (Ir NRs) and further developed highly sensitive dual-signal Ir NRs@CdS quantum dots (QDs) with excellent luminescent properties, in which Ir NRs were used as the anodic emitter and CdS QDs as the cathodic emitter. Based on enzymatic reactions, a ratio-type change of ECL signals was generated, achieving a highly selective determination for ethyl paraoxon (EP) [17]. Babamiri et al. synthesized stable EuS nanocrystals and constructed ECL sensors. Combined with molecular imprinting technology, they explored a new method for a rapid and accurate response to human immunodeficiency virus HIV-1 [18]. It can be seen that rare-earth materials have the potential to build ECL sensing platforms. The development of ECL analysis strategies based on novel low-toxicity and environmentally friendly rare-earth-based inorganic semiconductor materials is receiving increasing attention. CeO2 NPs, being important rare-earth-based inorganic semiconductor materials, have obvious chemical properties, optical, magnetic properties, and good photochemical stability. At present, there is still little research on these kinds of materials in the field of ECL [19,20].
As one of the transitional heavy-metal elements, mercury pollution incidents occur frequently around the world [21]. Due to the nondegradability of mercury ions (Hg2+), inappropriate emissions can lead to their accumulation and long-term existence in the environment, and pollution of aquatic ecosystems can even affect human health through the food chain [22,23]. It has been reported that the ingestion of trace amounts of Hg2+ can cause varying degrees of damage to the central nervous system, kidneys, and brain [24,25]. Therefore, the rapid and sensitive determination of Hg2+ in environmental samples is of great significance. In previous research, traditional analytical methods, such as atomic absorption spectrometry (AAS) [26], mass spectrometry (MS) [27], and inductively coupled plasma (ICP) [28], have been widely applied for the determination of Hg2+; however, they usually require professional personnel to operate and some techniques do not meet the international standard for the detection of mercury in real samples. In recent years, researchers have focused on improving the sensitivity of detection techniques and developing new inspection methods to identify and detect trace amounts of Hg2+ [29,30,31].
It is worth noting that ligand recognition technology has developed rapidly in the field of analysis and detection due to its stable, inexpensive, and easy modification of deoxyribonucleic acid (DNA) in many analysis strategies [32,33]. In 2004, it was first discovered that thymine (T) in the nucleic acid sequence can preferentially and specifically bind to Hg2+ over cytosine (A), resulting in a mismatch of base pairs to form a “T−Hg−T” structure [34].
Based on this recognition mechanism, this work utilized a hydrothermal method to synthesize amino-modified cerium oxide nanomaterials (CeO2 NPs) and constructed an Hg2+ recognition platform by combining amide bonds with T base-containing aptamers. When Hg2+ was present in the solution, T-rich aptamers formed a stem–ring structure due to “T−Hg−T” asymmetric pairing, specifically capturing and quantitatively responding to Hg2+ within the concentration range of 10 pM–100 µM (Figure 1). Owing to the highly specific binding ability between Hg2+ and aptamers, other ions coexisting in a complex sample do not interfere with its detection. Fish and shrimp samples were then tested using the proposed ECL sensor with excellent correlations, suggesting that the proposed sensor is of great promise in Hg2+ detection at low concentrations in the environment. Compared with other ECL methods to detect Hg2+, our method is more direct and simpler.

2. Results

2.1. Morphological Characterization

The morphology of CeO2 NPs was characterized by using a scanning electron microscope (SEM, JEOL, Tokyo, Japan), and it can be clearly observed that the material was formed by the agglomeration of small particles with a particle diameter of 100 nm, as shown in Figure 2A. The analysis results of elements in the dispersive spectrometer (EDS) mapping diagrams of Figure S1 prove that Ce and O were the main constituent elements, and N was uniformly distributed on the surface of CeO2. In addition, the X-ray diffractometer (XRD) spectrum of CeO2 (Figure 2B) could further confirm the successful synthesis of the CeO2 material by comparison with the XRD standard card.
The changes in the surface groups of the CeO2 and CeO2-Apt materials were analyzed by using Fourier transform infrared (FT-IR) spectroscopy. As shown in Figure 2C, the existence of a stretching vibration peak of N–H (υ(N–H)) can be clearly found at 3200–3500 cm−1 in CeO2 (black line). Compared with reference [35], it can be proven that amino groups (-NH2) were rich in the CeO2 material surface. Meanwhile, the FT-IR peaks situated at 3180 cm−1 for υ(O–H) and 1760 cm−1 for υ(C=O) jointly prove that the surface of CeO2 also contained a handful of carboxylic groups (-COOH), which can be considered to be induced from the raw material CA in the synthesis operation. A secondary amine bond of υ(N–H) was observed at 1502 cm−1 and an amide bond υ(CON–R) at 3418 cm−1 of CeO2-Apt (red line) in conformity with previous reports [36], which demonstrated the successful binding of the aptamer. Further, when comparing the ECL performance generated by each fabrication step of the sensor platform, as shown in Figure 2D, it can be clearly seen that the synthesized CeO2 material had excellent ECL strength and the binding of the aptamers generated a certain steric hindrance resulting in a slight decrease in the ECL emission intensity. When target molecules of Hg2+ were present in the environmental sample, the specific capture led to a further increase in steric hindrance, which significantly quenched the ECL signal, thus achieving recognition and detection of Hg2+.

2.2. Optimization of Experimental Conditions

To obtain the best ECL performance of this Hg2+ ECL sensor, the pH of the sensing environment was first optimized. Coreactant solutions with different pH values (3.4, 4.4, 5.4, 6.4, 7.4, 8.4, 9.4, and 10.4) were selected for ECL testing, as shown in Figure S2A. The results show that CeO2 had the best ECL emission when the test environment pH increased to 7.4, which conformed to the pH in most natural environments. Thus, the following ECL experiments were performed at this pH. Subsequently, the CeO2 drop-coating concentration during the construction of the sensing platform was optimized, in which the concentration increased from 0.1 to 3 mg·mL−1, as shown in Figure S2B. The experimental results indicate that too small or too large of a concentration did not facilitate the ECL emission of CeO2. Therefore, a concentration of 1 mg·mL−1 was selected for drop coating in subsequent tests.

2.3. ECL Mechanism of CeO2

There was a further analysis of the possible ECL mechanism of the CeO2 material. Charge injection reduced CeO2 on the GCE surface to negatively charged radicals (CeO2•−) under an initial negative potential. At the same time, the coreactant S2O82− in the solution also obtained electrons, generating the free radicals (SO4•−) and SO42−. The two free-radical ions collided and exchanged energy, and the high-energy excited states of CeO2 (CeO2*) and SO42− were produced. However, CeO2* was unstable and returned to the ground state to release light energy. The relationship formula was as follows:
CeO2 + e → CeO2•−
S2O82− + e → SO42− + SO4•−
CeO2•− + SO4•− → CeO2* + SO42−
CeO2* → CeO2 +
Adapters utilized -COOH groups on the surface to bind CeO2 through amide bonds. When Hg2+ exists in the environmental sample, the T base pairs in the aptamer can specifically capture Hg2+ to form a “T−Hg−T” structure, leading to the bending of the aptamer structure. Doing that, the ECL signal was quenched due to the fact that the electron transfer was blocked as the structure changed.

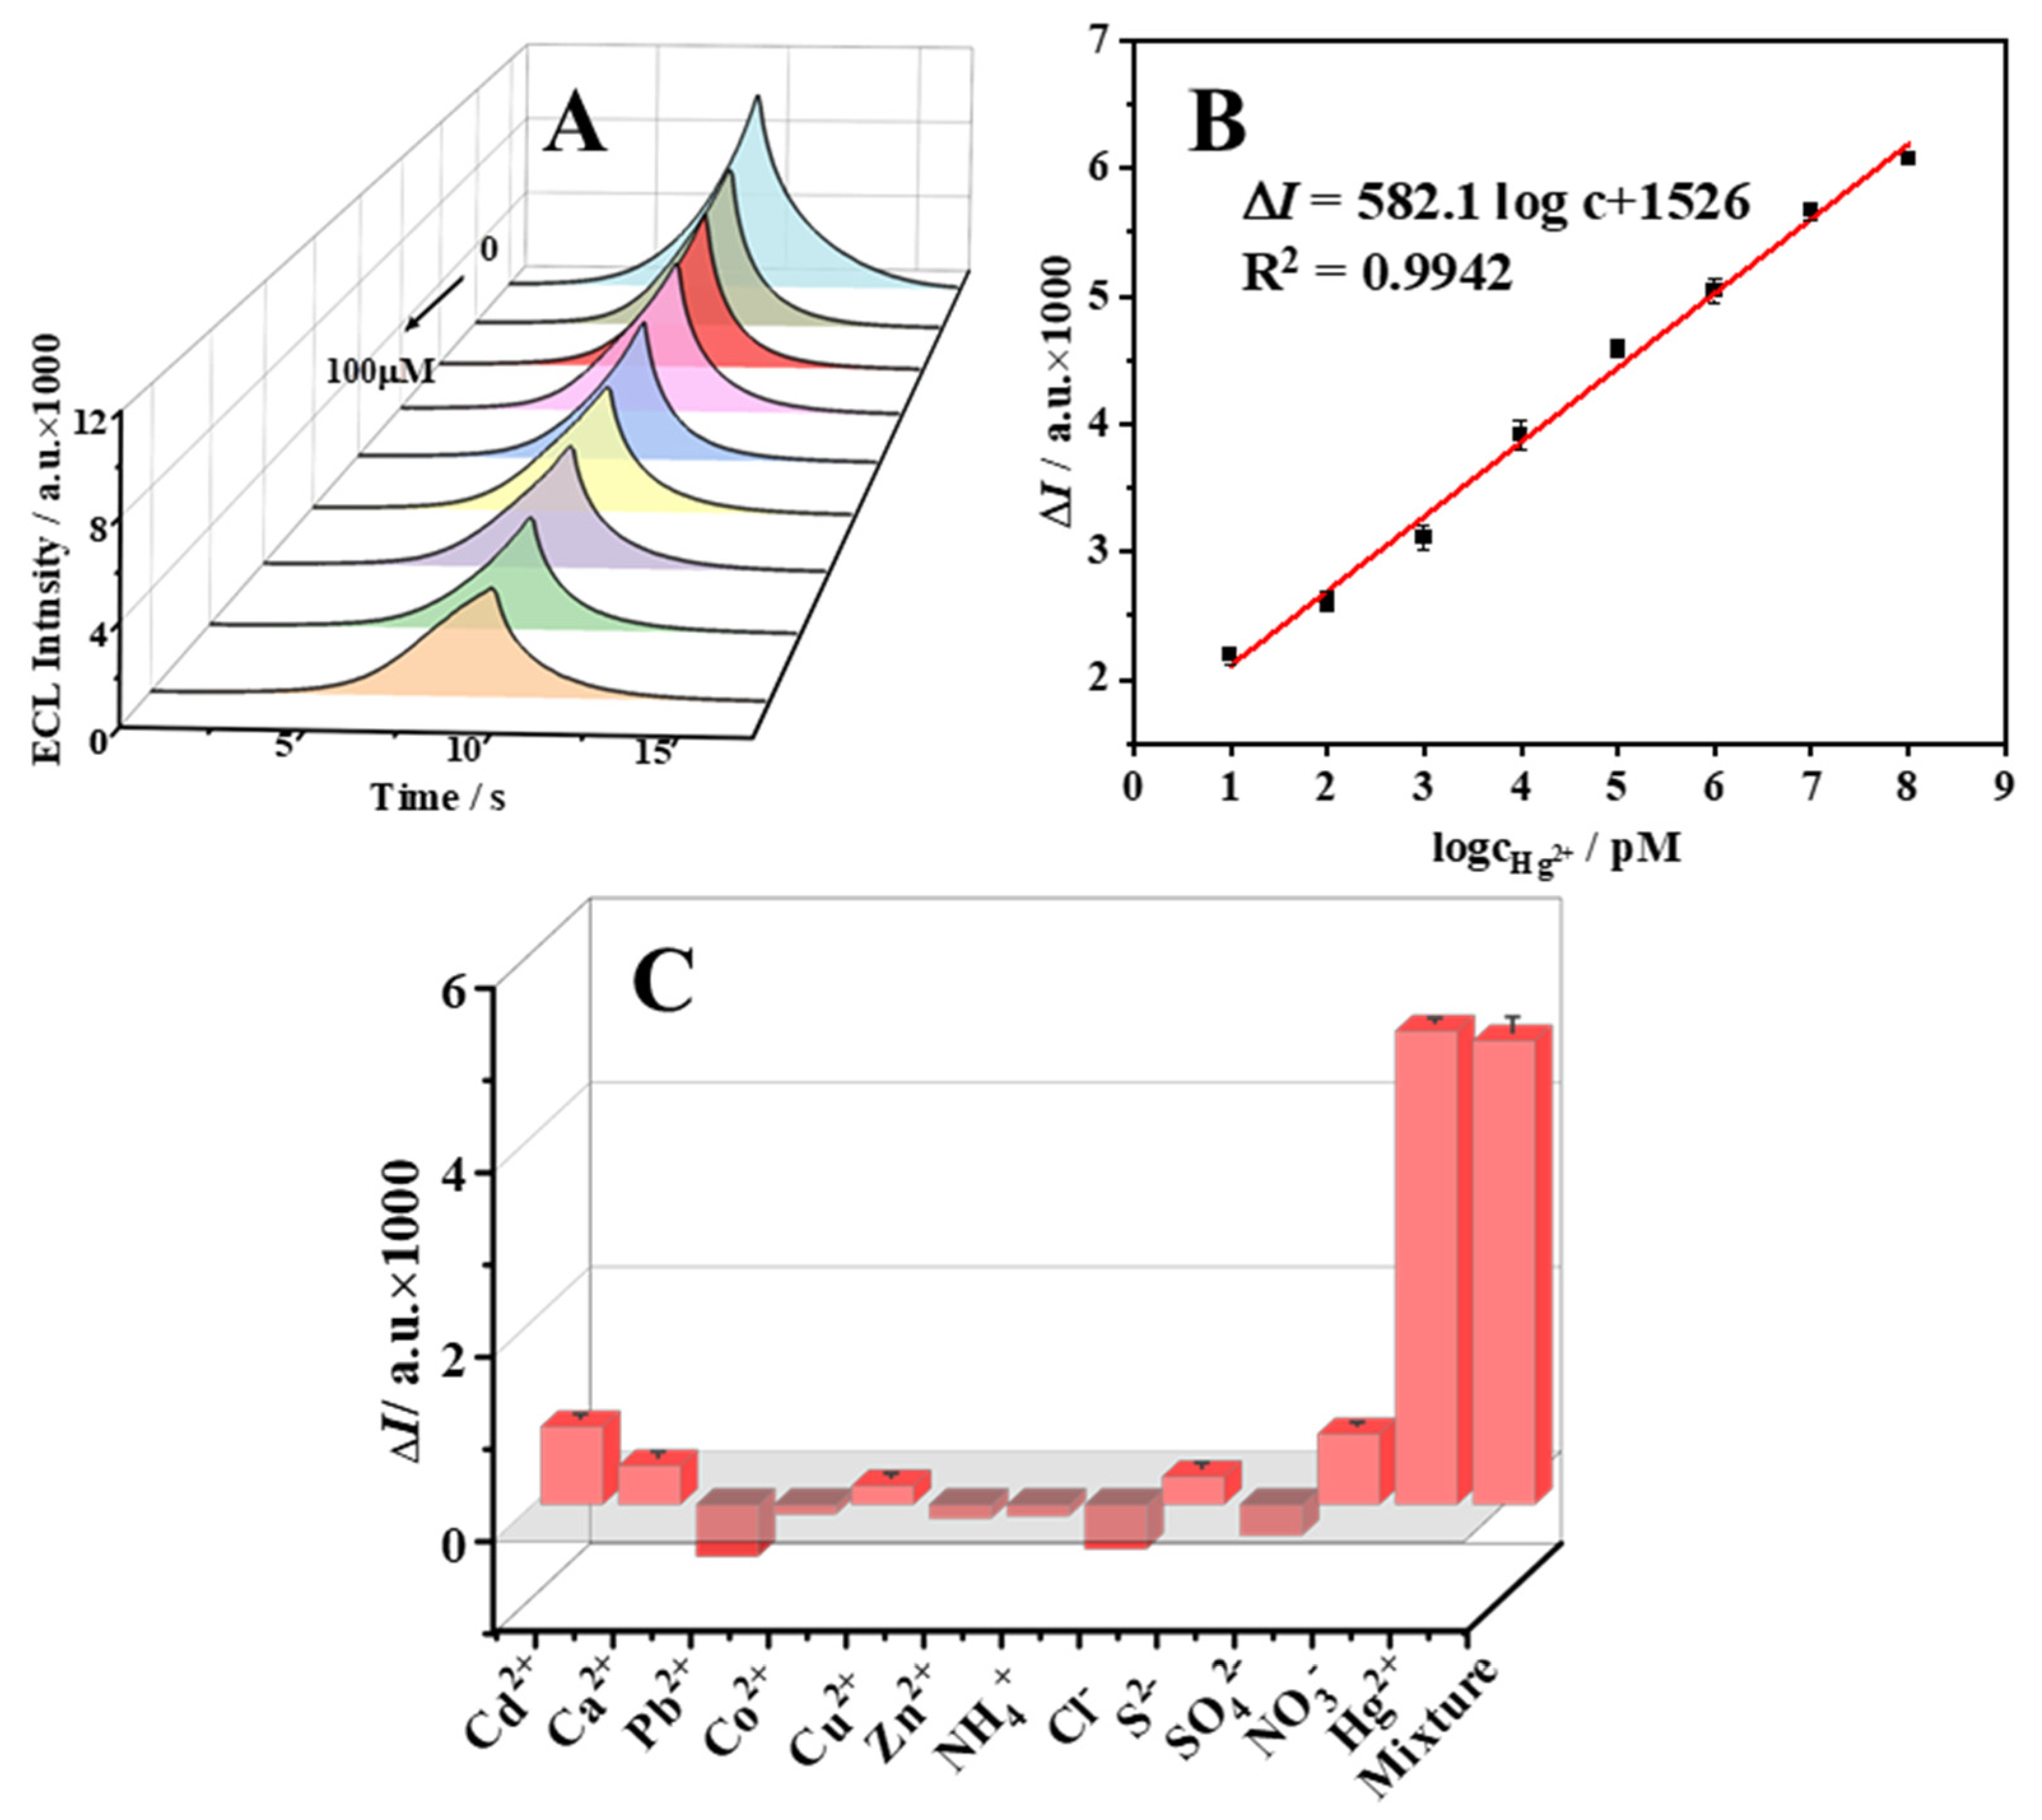
2.4. Response of the ECL Sensor to Hg2+

For the purpose of a quantitative assessment of the Hg2+ concentration in the environmental sample, this sensor was designed for the specific identification of different concentrations (100 µM, 10 µM, 1 µM, 100 nM, 10 nM, 1 nM, 100 pM, and 10 pM) of Hg2+ under optimal experimental conditions. When experimentally analyzed, the ECL response signals decreased with increasing Hg2+ concentrations in the bare solution, as shown in Figure 3A, which was consistent with the above reaction mechanism. The linear relationship and equation established between the concentration logarithmic value of the recognition unit of Hg2+ and the quenching value ΔI of ECL are shown in Figure 3B. The fitted linear equation was ΔI = 582.1 log c + 1526, R2 = 0.9942. A good linear relationship with a limit of detection (LOD, S/N = 3) as low as 0.35 pM was indicated. Compared to the techniques for detecting Hg2+ reported in other references, as shown in Table S1, the ECL sensor was not only simple to operate but also had a wide linear range and excellent LOD based on CeO2, which has certain superiority in identifying trace amounts of Hg2+.
To verify specific selectivity, several common interference ions in the environment were utilized for selective testing of the sensor. The change signals of different ions are shown in Figure 3C. Significant ECL signal quenching was exhibited for Hg2+ and solutions containing Hg2+, and the response for other ions was negligible, which indicated that the sensor only had a specific response to solutions containing Hg2+. Thus, the results of the experiment demonstrate the reliability and accuracy of this experimental strategy and greatly broaden its application prospects.

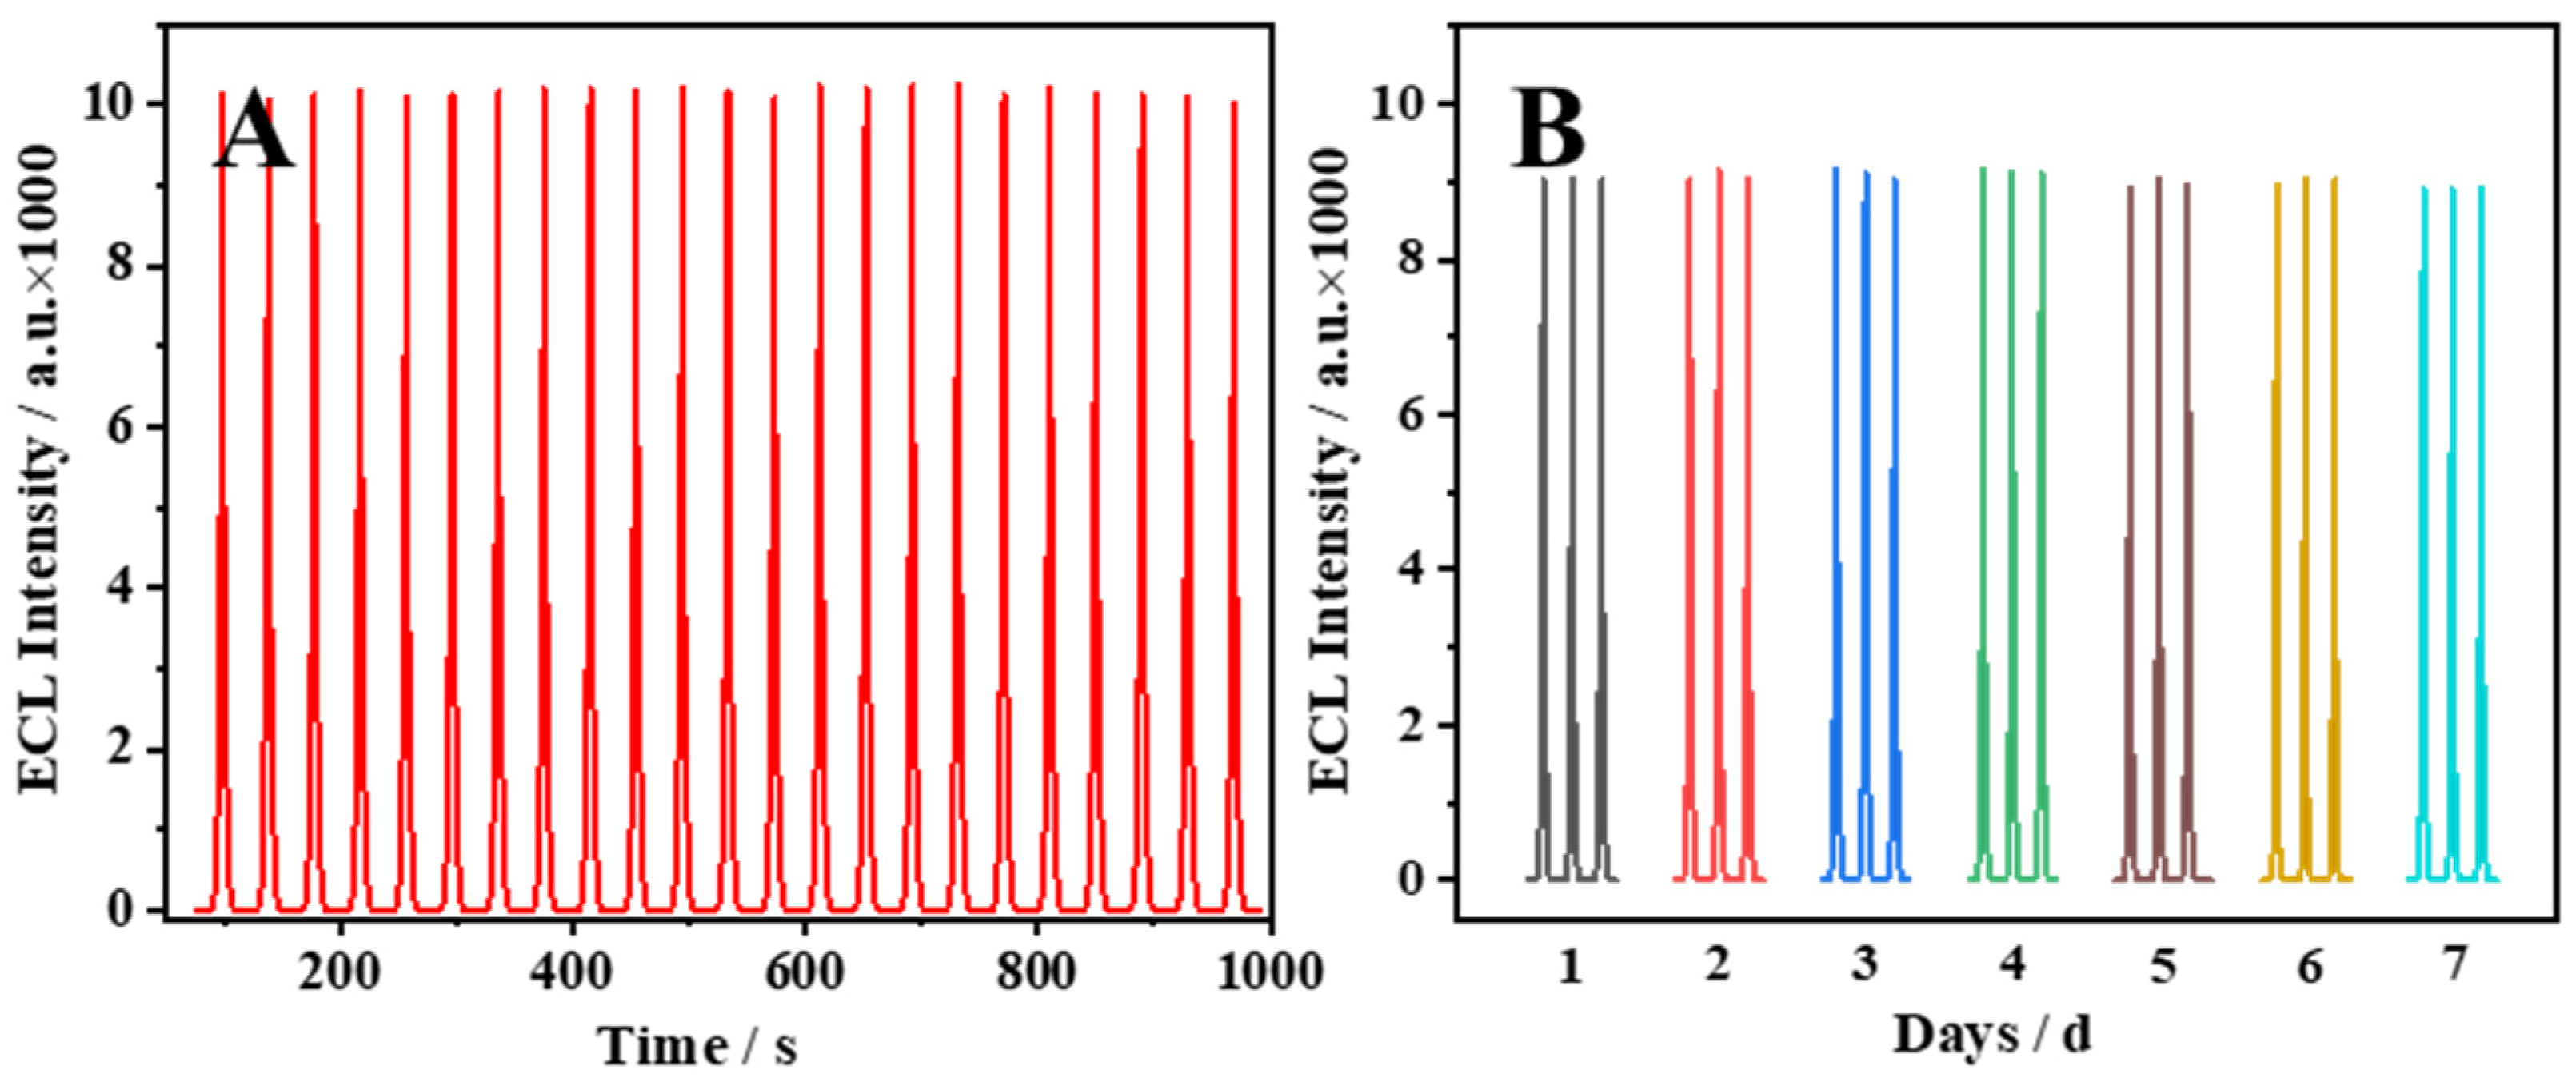
2.5. Stability of the ECL Sensor

The stability of the ECL sensing platform constructed with modified electrodes by CeO2 NPs was tested. Consecutive cycles of 23 cycles were tested in PBS solution containing 0.1 M K2S2O8 of one electrode to verify the ECL stability. As shown in Figure 4A, one electrode exhibited a strong and stable ECL signal in the same ECL test. When verifying short-term stability, the 7-day stability of the same modified electrodes was measured, as shown in Figure 4B. The ECL performance of the CeO2-modified electrode hardly changed within 7 days, which demonstrates the excellent ECL stability of CeO2/GCE.

2.6. Detection of Hg2+ in Actual Samples

Spiking tests were used to verify the application potential of this ECL sensor in actual environmental samples (fish and shrimp). The results are shown in Table 1. The spiked recovery rate was between 82.99% and 105.0%, and the relative standard deviation (RSD) was less than 2.5%. Evidently, it can be utilized for the direct and accurate determination of Hg2+ in subsequent actual environmental samples based on a satisfactory spiked recovery effect.

3. Materials and Methods

3.1. Reagents and Chemicals

Cerium nitrate hexahydrate (CeCl3·6H2O, AR), urea (AR), citric acid (CA, AR), hydrogen peroxide (H2O2, AR), potassium persulfate (K2S2O8, AR), sodium phosphate dibasic dodecahydrate (Na2HPO4·2H2O, AR), potassium dihydrogen phosphate (KH2PO4, AR), N-hydroxysuccinimide (NHS, AR), 1-(3-Dimethylaminopropyl)-3-ethylcarbodiimide (EDC, AR), and mercuric chloride (HgCl2, AR) were obtained from Aladdin Biochemical Technology Co., Ltd. (Shanghai, China). Cadmium nitrate (Cd(NO3)2, AR), sodium chloride (NaCl, AR), sodium nitrate (NaNO3, AR), barium chloride (BaCl2, AR), lead nitrate (Pb(NO3)2, AR), cobalt chloride (CoCl2, AR), sodium sulfate decahydrate (Na2S·9H2O, AR), and sodium sulfate (Na2SO4, AR) were purchased from Sinopharm Chemical Reagents Co., Ltd. (Tianjin, China). The Hg2+ aptamer (5′-COOH-(CH2)6-TTTTTTTTTTTT-3′) was synthesized by Shanghai Sangon Biotechnology Co., Ltd. (Shanghai, China). The reagents used in this study were not subjected to purification treatment unless otherwise specified. The solutions involved were all prepared with ultrapure water (18.25 MΩ cm).

3.2. Apparatus

The ECL signals were measured by using a type of MPI-E ECL Analysis System (Xi’An Remax Electronic Science & Technology Co., Ltd., Xi’an, China). SEM images and EDS element mapping images were obtained by using JSM-7900F (JEOL, Tokyo, Japan). XRD spectrum was acquired by using XRD-Smart Lab (3 kW, Smart Lab, Tokyo, Japan). FT-IR spectrum was obtained by using IR Affinity-1S (Shimadzu, Shanghai, China).

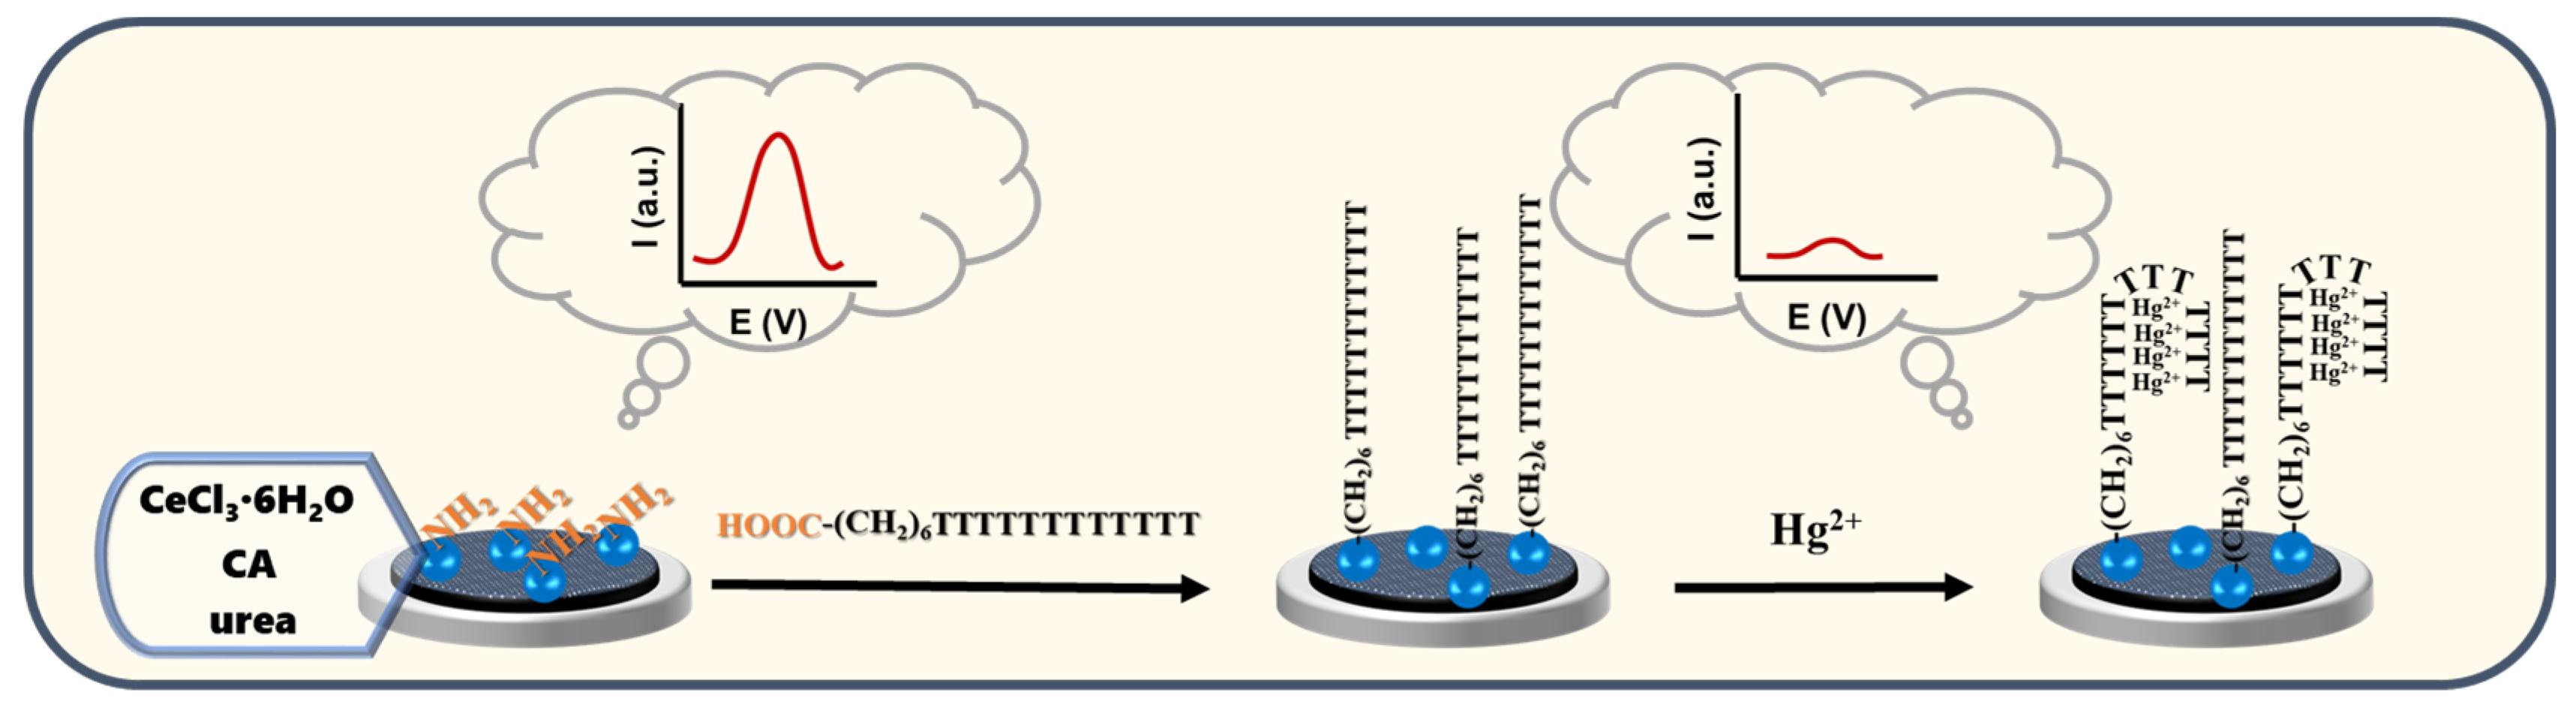
3.3. Synthesis of CeO2 NPs

CeO2 was synthesized according to previous reports [31]. Briefly, 0.02 g of CA, 0.1 g of CeCl3·6H2O, and 0.16 g of urea were fully mixed and completely dissolved in 25 mL of ultrapure water, and subsequently, 0.15 mL of H2O2 (30%) was added dropwise. The above-mixed solution was heated to 180 °C for 20 h in 45 mL of polytetrafluoroethylene liner. The suspension containing white solids was washed with water and alcohol three times after the reaction was completed and cooled to room temperature. The obtained white solids of CeO2 NPs were dried overnight at 60 °C and stored at 4 °C for subsequent experiments.

3.4. Synthesis of CeO2-Apt

First, 1 mL Hg2+ aptamer (0.1 mM) was added to the mixed solution including 2 mL EDC (25 mg·mL−1) and 2 mL NHS (12 mg·mL−1) and stirring continued for 1.5 h at room temperature to activate the carboxyl group (-COOH) on the surface of the aptamer. Soon afterward, 1 mg of CeO2 was added and fully reacted for 2 h at room temperature to the above solution. Hence, CeO2 modified with the aptamer (CeO2-Apt) was obtained by centrifuging with ultrapure water three times and dried at 60 °C, Finally, the sample was stored at 4 °C for further use.

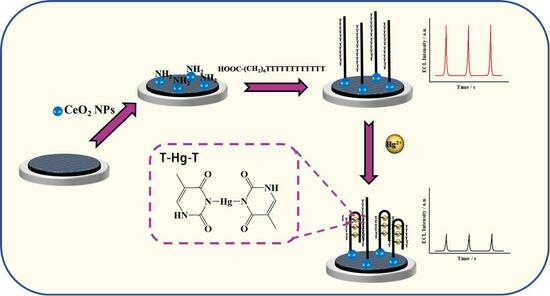
3.5. Construction of the Hg2+ ECL Sensor

A total of 1 mg CeO2-Apt powder was dissolved in 1 mL ultrapure water to prepare the material solution (1 mg·mL−1). Then, 5 µL was dropwise added to the clean surface of the glassy carbon electrode (GCE). The working electrode CeO2-Apt/GCE was obtained after drying at room temperature; the counter electrode was a platinum (Pt) wire electrode; and the reference electrode was an Ag/AgCl electrode (the concentration of KCl in the filled liquid was 3 M). The working voltage range of the electrochemical analyzer was set to be −2.0–0 V; the scanning rate was 100 mV s−1; the photomultiplier tube (PMT) was 800 V; and the coreactant to be selected was 0.1 M K2S2O8 (5 mL) solution that was confected by 0.1 M phosphate buffer solution (PBS, pH = 7.4). We performed an ECL response test on a series of 100 µL concentrations of Hg2+ at 10 pM, 100 pM, 1 nM, 10 nM, 100 nM, 1 µM, 10 µM, and 100 µM. Based on ECL signals to construct a linear standard curve between different Hg2+ concentrations and ECL quenching values, ΔII = I0I, I0 is the blank signal of the ECL without the addition of Hg2+ to be tested, and I is the ECL signal value after the addition of different concentrations of Hg2+) was obtained from the test.

3.6. Selective Testing

Several common anions and cation ions (Cd2+, Ca2+, Pb2+, Co2+, Cu2+, Zn2+, NH4+ Cl, S2−, SO42−, and NO3) in the environment were selected as interfering substances and prepared at 1 µM. After that, we added the above-interfering ions and a mixed solution with them and the same concentration of Hg2+ and collected the response values of the different solutions.

3.7. Actual Sample Test

Fish and shrimp were selected as actual samples to evaluate the practical application potential of this Hg2+ ECL sensor. The fish and shrimp used in this study were purchased from Yantai University Market. The standard addition method was used to detect the content of Hg2+ in fish and shrimp. First, fish and shrimp meat were subjected to pretreatment, and 1.0 g of meat was washed and shredded before being added in 10 mL of ultrapure water. Then, the above solutions were broken by using a cell disruptor for 30 min, followed by centrifugation to extract the supernatant. Then, a filter membrane with a pore diameter of 0.22 µm was used for further filtration. The solutions were divided into equal parts, and spiked sample solutions were prepared with concentrations of 100 pM, 100 nM, and 100 µM of Hg2+, and the spiked recovery experiments were carried out under the same conditions.

4. Conclusions

In the present study, a simple-to-operate and environmentally friendly ECL sensor was constructed based on the inexpensive and easily synthesized CeO2 NPs. The results indicate that CeO2 NPs were the ideal ECL emitter with a strong and stable ECL performance. The established Hg2+ sensing platform achieved an accurate determination of Hg2+ concentrations within the range of 10 pM–100 μM, with an LOD as low as 0.35 pM. Finally, the ECL sensor was successfully applied for the detection of trace Hg2+ in actual samples in the environment. This strategy greatly reduced the research costs, improved the detection sensitivity and response speed, and also provided the possibility for the development of rare-earth materials in the ECL field.

Supplementary Materials

The following supporting information can be downloaded at: https://www.mdpi.com/article/10.3390/molecules29010001/s1, Figure S1: EDS mapping images of (A) CeO2 (B) Ce (C) O (D) N; Figure S2: (A) Optimization of pH of ECL sensing environment (B) The concentration of the CeO2 solution dripped onto the electrode surface; Table S1: Comparison between CeO2 ECL sensor and other methods for detecting Hg2+. References [37,38,39,40] are cited in the Supplementary Materials.

Author Contributions

Conceptualization, F.L. and W.G.; data curation and formal analysis, C.T. and F.T.; software and visualization, M.W., X.Z. and L.W.; writing—review and editing, F.L.; funding acquisition, F.L. and W.G. All authors have read and agreed to the published version of the manuscript.

Funding

This research was funded by the Natural Science Foundation of Shandong Province, China (Grant Nos. ZR2021MB024, ZR2020KH002, and ZR2023MB047).

Institutional Review Board Statement

Not applicable.

Informed Consent Statement

Not applicable.

Data Availability Statement

The data are available upon reasonable request.

Conflicts of Interest

Author Wei Guo was employed by the company Shandong Dyne Marine Biopharmaceutical Co., Ltd. The remaining authors declare that the research was conducted in the absence of any commercial or financial relationships that could be construed as a potential conflict of interest.

References

  1. Chikhaliwala, P.; Chandra, S. Dendrimers: New tool for enhancement of electrochemiluminescent signal. J. Organomet. Chem. 2016, 821, 78–90. [Google Scholar] [CrossRef]
  2. Hiramoto, K.; Villani, E.; Iwama, T.; Komatsu, K.; Inagi, S.; Inoue, K.Y.; Nashimoto, Y.; Ino, K.; Shiku, H. Recent Advances in Electrochemiluminescence-Based Systems for Mammalian Cell Analysis. Micromachines 2020, 11, 530. [Google Scholar] [CrossRef] [PubMed]
  3. Zhang, X.; Wang, P.L.; Nie, Y.X.; Ma, Q. Recent development of organic nanoemitter-based ECL sensing application. Trends Anal. Chem. 2021, 143, 116410. [Google Scholar] [CrossRef]
  4. Wang, Z.Y.; Pan, J.B.; Li, Q.; Zhou, Y.; Yang, S.; Xu, J.J.; Hua, D.B. Improved AIE-Active Probe with High Sensitivity for Accurate Uranyl Ion Monitoring in the Wild Using Portable Electrochemiluminescence System for Environmental Applications. Adv. Funct. Mater. 2020, 30, 2000220. [Google Scholar] [CrossRef]
  5. Chen, D.L.; Zhang, M.; Zhou, F.Y.; Hai, H.; Li, J.P. Ultrasensitive electroluminescence biosensor for a breast cancer marker microRNA based on target cyclic regeneration and multi-labeled magnetized nanoparticles. Microchim. Acta 2019, 186, 628. [Google Scholar] [CrossRef] [PubMed]
  6. Zou, Y.; Zhang, H.X.; Wang, Z.H.; Liu, Q.Y.; Liu, Y. A novel ECL method for histone acetyltransferases (HATs) activity analysis by integrating HCR signal amplification and ECL silver clusters. Talanta 2019, 198, 39–44. [Google Scholar] [CrossRef]
  7. Tu, L.P. Gold nanomaterials for biochemical sensing. Gold Bull. 2022, 55, 169–185. [Google Scholar] [CrossRef]
  8. Lv, X.H.; Ma, H.M.; Wu, D.; Yan, T.; Ji, L.; Liu, Y.X.; Pang, X.H.; Du, B.; Wei, Q. Novel gold nanocluster electrochemiluminescence immunosensors based on nanoporous NiGd-Ni2O3-Gd2O3 alloys. Biosens. Bioelectron. 2016, 75, 142–147. [Google Scholar] [CrossRef]
  9. Zhang, H.H.; Zhang, C.Y.; Qu, H.; Xi, F.N. Immunosensor with Enhanced Electrochemiluminescence Signal Using Platinum Nanoparticles Confined within Nanochannels for Highly Sensitive Detection of Carcinoembryonic Antigen. Molecules 2023, 28, 6559. [Google Scholar] [CrossRef]
  10. Wei, H.; Wang, E. Electrochemiluminescence of tris(2,2′-bipyridyl)ruthenium and its applications in bioanalysis: A review. Luminescence 2011, 26, 77–85. [Google Scholar] [CrossRef]
  11. Kerr, E.; Doeven, E.H.; Francis, P.S. Recent advances in mechanistic understanding and analytical methodologies of the electrochemiluminescence of tris(2,2′-bipyridine) ruthenium(II) and tri-n-propylamine. Curr. Opin. Electrochem. 2022, 35, 101034. [Google Scholar] [CrossRef]
  12. Hua, Q.; Tang, F.Y.; Wang, X.B.; Li, M.; Gu, X.W.; Sun, W.J.; Luan, F.; Tian, C.Y.; Zhuang, X.M. Electrochemiluminescence sensor based on EuS nanocrystals for ultrasensitive detection of mercury ions in seafood. Sens. Actuators B Chem. 2022, 352, 131075. [Google Scholar] [CrossRef]
  13. Tian, C.Y.; Wang, L.; Luan, F.; Fu, X.L.; Zhuang, X.M.; Chen, L.X. A novel electrochemiluminescent emitter of europium hydroxide nanorods and its application in bioanalysis. Chem. Commun. 2019, 55, 12479–12482. [Google Scholar] [CrossRef] [PubMed]
  14. Moghaddam, M.R.; Ganjali, M.R.; Hosseini, M.; Faridbod, F.; Pur, M.R.K. A novel electrochemiluminescnece sensor based on an Ru(bpy)32+−Eu2O3—Nafion nanocomposite and its application in the detection of diphenhydramine. Int. J. Electrochem. Sci. 2017, 12, 5220–5232. [Google Scholar] [CrossRef]
  15. Ma, G.Y.; Wu, P.P.A.; Wu, K.; Deng, A.P.; Li, J.G. A novel electrochemiluminescence immunoassay based on highly efficient resonance energy transfer for florfenicol detection. Talanta 2021, 235, 122732. [Google Scholar] [CrossRef] [PubMed]
  16. Zhu, Y.G.; Zhao, M.; Hu, X.J.; Wang, X.F.; Wang, L. Electrogenerated chemiluminescence behavior of Tb complex and its application in sensitive sensing Cd2+. Electrochim. Acta 2017, 228, 1–8. [Google Scholar] [CrossRef]
  17. Yang, G.M.; He, Y.; Zhao, J.W.; Chen, S.H.; Yuan, R. Ratiometric electrochemiluminescence biosensor based on Ir nanorods and CdS quantum dots for the detection of organophosphorus pesticides. Sens. Actuators B Chem. 2021, 341, 130008. [Google Scholar] [CrossRef]
  18. Babamiri, B.; Salimi, A.; Hallaj, R. A molecularly imprinted electrochemiluminescence sensor for ultrasensitive HIV-1 gene detection using EuS nanocrystals as luminophore. Biosens. Bioelectron. 2018, 117, 332–339. [Google Scholar] [CrossRef]
  19. Yang, L.; Zhu, W.J.; Ren, X.; Khan, M.S.; Zhang, Y.; Du, B.; Wei, Q. Macroporous graphene capped Fe3O4 for amplified electrochemiluminescence immunosensing of carcinoembryonic antigen detection based on CeO2@TiO2. Biosens. Bioelectron. 2017, 91, 842–848. [Google Scholar] [CrossRef]
  20. Cheng, W.Q.; Lin, Z.; Zhao, L.A.; Fan, N.K.; Bai, H.J.; Cheng, W.; Zhao, M.; Ding, S.J. CeO2/MXene heterojunction-based ultrasensitive electrochemiluminescence biosensing for BCR-ABL fusion gene detection combined with dual-toehold strand displacement reaction for signal amplification. Biosens. Bioelectron. 2022, 210, 114287. [Google Scholar] [CrossRef]
  21. Malone, A.; Figueroa, L.; Wang, W.S.; Smith, N.M.; Ranville, J.F.; Vuono, D.C.; Zapata, F.D.A.; Paredes, L.M.; Sharp, J.O.; Bellona, C. Transitional dynamics from mercury to cyanide-based processing in artisanal and small-scale gold mining: Social, economic, geochemical, and environmental considerations. Sci. Total Environ. 2023, 898, 165492. [Google Scholar] [CrossRef] [PubMed]
  22. Dastoor, A.; Angot, H.; Bieser, J.; Christensen, J.H.; Douglas, T.A.; Heimburger-Boavida, L.E.; Jiskra, M.; Mason, R.P.; McLagan, D.S.; Obrist, D.; et al. Arctic mercury cycling. Nat. Rev. Earth Environ. 2022, 3, 270–286. [Google Scholar] [CrossRef]
  23. Okereafor, U.; Makhatha, M.; Mekuto, L.; Uche-Okereafor, N.; Sebola, T.; Mavumengwana, V. Toxic Metal Implications on Agricultural Soils, Plants, Animals, Aquatic life and Human Health. Int. J. Environ. Res. Public Health 2020, 17, 2204. [Google Scholar] [CrossRef] [PubMed]
  24. Hirai, T.; Abe, O.; Nakamura, M.; Inui, S.; Uetani, H.; Ueda, M.; Azuma, M. Brain structural changes in patients with chronic methylmercury poisoning in Minamata. Brain Res. 2023, 1805, 148278. [Google Scholar] [CrossRef] [PubMed]
  25. Marumoto, M.; Sakamoto, M.; Marumoto, K.; Tsuruta, S.; Komohara, Y. Mercury and Selenium Localization in the Cerebrum, Cerebellum, Liver, and Kidney of a Minamata Disease Case. Acta Histochem. Cytochem. 2020, 53, 147–155. [Google Scholar] [CrossRef] [PubMed]
  26. Liang, P.; Yu, J.; Yang, E.J.; Mo, Y.J. Determination of Mercury in Food and Water Samples by Displacement-Dispersive Liquid-Liquid Microextraction Coupled with Graphite Furnace Atomic Absorption Spectrometry. Food Anal. Methods 2015, 8, 236–242. [Google Scholar] [CrossRef]
  27. Khalizov, A.F.; Guzman, F.J.; Cooper, M.; Mao, N.; Antley, J.; Bozzelli, J. Direct detection of gas-phase mercuric chloride by ion drift—Chemical ionization mass spectrometry. Atmos. Environ. 2020, 238, 117687. [Google Scholar] [CrossRef]
  28. Chen, X.P.; Han, C.; Cheng, H.Y.; Liu, J.H.; Xu, Z.G.; Yin, X.F. Determination of mercurial species in fish by inductively coupled plasma mass spectrometry with anion exchange chromatographic separation. Anal. Chim. Acta 2013, 796, 7–13. [Google Scholar] [CrossRef]
  29. Miao, P.; Tang, Y.G.; Wang, L. DNA Modified Fe3O4@Au Magnetic Nanoparticles as Selective Probes for Simultaneous Detection of Heavy Metal Ions. ACS Appl. Mater. Interfaces 2017, 9, 3940–3947. [Google Scholar] [CrossRef]
  30. Ferreira, N.; Viana, T.; Henriques, B.; Tavares, D.S.; Jacinto, J.; Colónia, J.; Pinto, J.; Pereira, E. Application of response surface methodology and box-behnken design for the optimization of mercury removal by Ulva sp. J. Hazard. Mater. 2023, 445, 130405. [Google Scholar] [CrossRef]
  31. Tan, T.; Zhang, C.; Han, Y.; Chu, R.J.; Xi, W.Y.; Chen, X.L.; Sun, J.Y.; Huang, H.; Hu, Y.J.; Huang, X.H. Fine-tuning bromide AIE probes for Hg2+ detection in mitochondria with wash-free staining. J. Hazard. Mater. 2024, 464, 132999. [Google Scholar] [CrossRef] [PubMed]
  32. Li, D.L.; Liu, L.Y.; Huang, Q.L.; Tong, T.; Zhou, Y.; Li, Z.Y.; Bai, Q.Q.; Liang, H.; Chen, L.L. Recent advances on aptamer-based biosensors for detection of pathogenic bacteria. World J. Microbiol. Biotechnol. 2021, 27, 45. [Google Scholar] [CrossRef] [PubMed]
  33. Alkhamis, O.; Canoura, J.; Yu, H.X.; Liu, Y.Z.; Xiao, Y. Innovative engineering and sensing strategies for aptamer-based small-molecule detection. TrAC Trends Anal. Chem. 2019, 121, 115699. [Google Scholar] [CrossRef] [PubMed]
  34. Ono, A.; Togashi, H. Highly Selective Oligonucleotide-Based Sensor for Mercury (II) in Aqueous Solutions. Angew. Chem. 2004, 116, 4300–4302. [Google Scholar] [CrossRef] [PubMed]
  35. Guzman, M.; Estrada, M.; Miridonov, S. Synthesis of cerium oxide (IV) hollow nanospheres with tunable structure and their performance in the 4-nitrophenol adsorption. Microporous Mesoporous Mater. 2019, 278, 241–250. [Google Scholar] [CrossRef]
  36. Zhu, X.; Tang, L.; Wang, J.J.; Peng, B.; Ouyang, X.L.; Tan, J.S.; Yu, J.F.; Feng, H.P.; Tang, J.L. Enhanced peroxidase-like activity of boron nitride quantum dots anchored porous CeO2 nanorods by aptamer for highly sensitive colorimetric detection of kanamycin. Sens. Actuators B Chem. 2021, 330, 129318. [Google Scholar] [CrossRef]
  37. Liu, C.; Tuffour, A.; Liao, J.H.; Li, M.L.; Lv, Q.X.; Zhou, D.R.; Gao, L. Highly sensitive detection of Hg2+ using molybdenum disulfide-DNA sensors. Chem. Phys. 2020, 534, 110758. [Google Scholar] [CrossRef]
  38. Bu, Y.W.; Wang, K.; Yang, X.Y.; Nie, G.M. Photoelectrochemical sensor for detection Hg2+ based on in situ generated MOFs-like structures. Anal. Chim. Acta 2022, 1233, 340496. [Google Scholar] [CrossRef]
  39. Fang, Y.M.; Zhang, Y.; Cao, L.G.; Yang, J.Z.; Hu, M.H.; Pang, Z.L.; He, J.H. Portable Hg2+ Nanosensor with ppt Level Sensitivity Using Nanozyme as the Recognition Unit, Enrichment Carrier, and Signal Amplifier. ACS Appl. Mater. Interfaces 2020, 12, 11761–11768. [Google Scholar] [CrossRef]
  40. Zhou, J.; Wei, D.; Hu, C.C.; Li, S.; Ma, L.; Chen, Z.; Deng, Y. A simple label-free electrochemical aptamer sensor for detection of Hg2+ based on black phosphorus. Mater. Express 2022, 12, 802–809. [Google Scholar] [CrossRef]
Figure 1. Construction of the ECL sensor and mechanism diagram for detecting Hg2+.
Molecules 29 00001 g001
Figure 2. (A) SEM image of CeO2. (B) XRD spectrum of CeO2 (black line) and XRD standard characteristic diffraction peak of CeO2 (red line). (C) FT-IR spectra of CeO2 (black line) and CeO2-Apt (red line). (D) ECL spectra of the bare GCE (black line), CeO2 (blue line), CeO2-Apt (green line), and CeO2-Apt-Hg2+ (red line).
Molecules 29 00001 g002
Figure 3. (A) ECL signals measured at different concentrations of Hg2+ (0–100 µM). (B) Logarithmic calibration curve between ECL signal change value and Hg2+ concentration. (C) Comparison of ECL signal changes generated by different interfering ions and the mixed solution at the same concentration.
Molecules 29 00001 g003
Figure 4. (A) ECL scan signal obtained by 23 consecutive cycles of CeO2/GCE in the sensors. (B) ECL signal of one CeO2-modified electrode in one week under the same experimental conditions.
Molecules 29 00001 g004
Table 1. Determination of Hg2+ in actual environmental samples by the ECL sensor (n = 3).
SamplesAdded
(pM)
Found
(pM)
Recovery
(%)
RSD
(%)
Fish1 × 1020.8299 × 10282.990.81
1 × 1051.050 × 105105.01.4
1 × 1080.9258 × 10892.581.7
Shrimp1 × 1020.8831 × 10288.310.7
1 × 1050.8730 × 10587.302.5
1 × 1080.8551 × 10885.510.73
Disclaimer/Publisher’s Note: The statements, opinions and data contained in all publications are solely those of the individual author(s) and contributor(s) and not of MDPI and/or the editor(s). MDPI and/or the editor(s) disclaim responsibility for any injury to people or property resulting from any ideas, methods, instructions or products referred to in the content.

