


Mitochondria-Targeted Fluorescent Nanoparticles with Large Stokes Shift for Long-Term BioImaging
 and
and 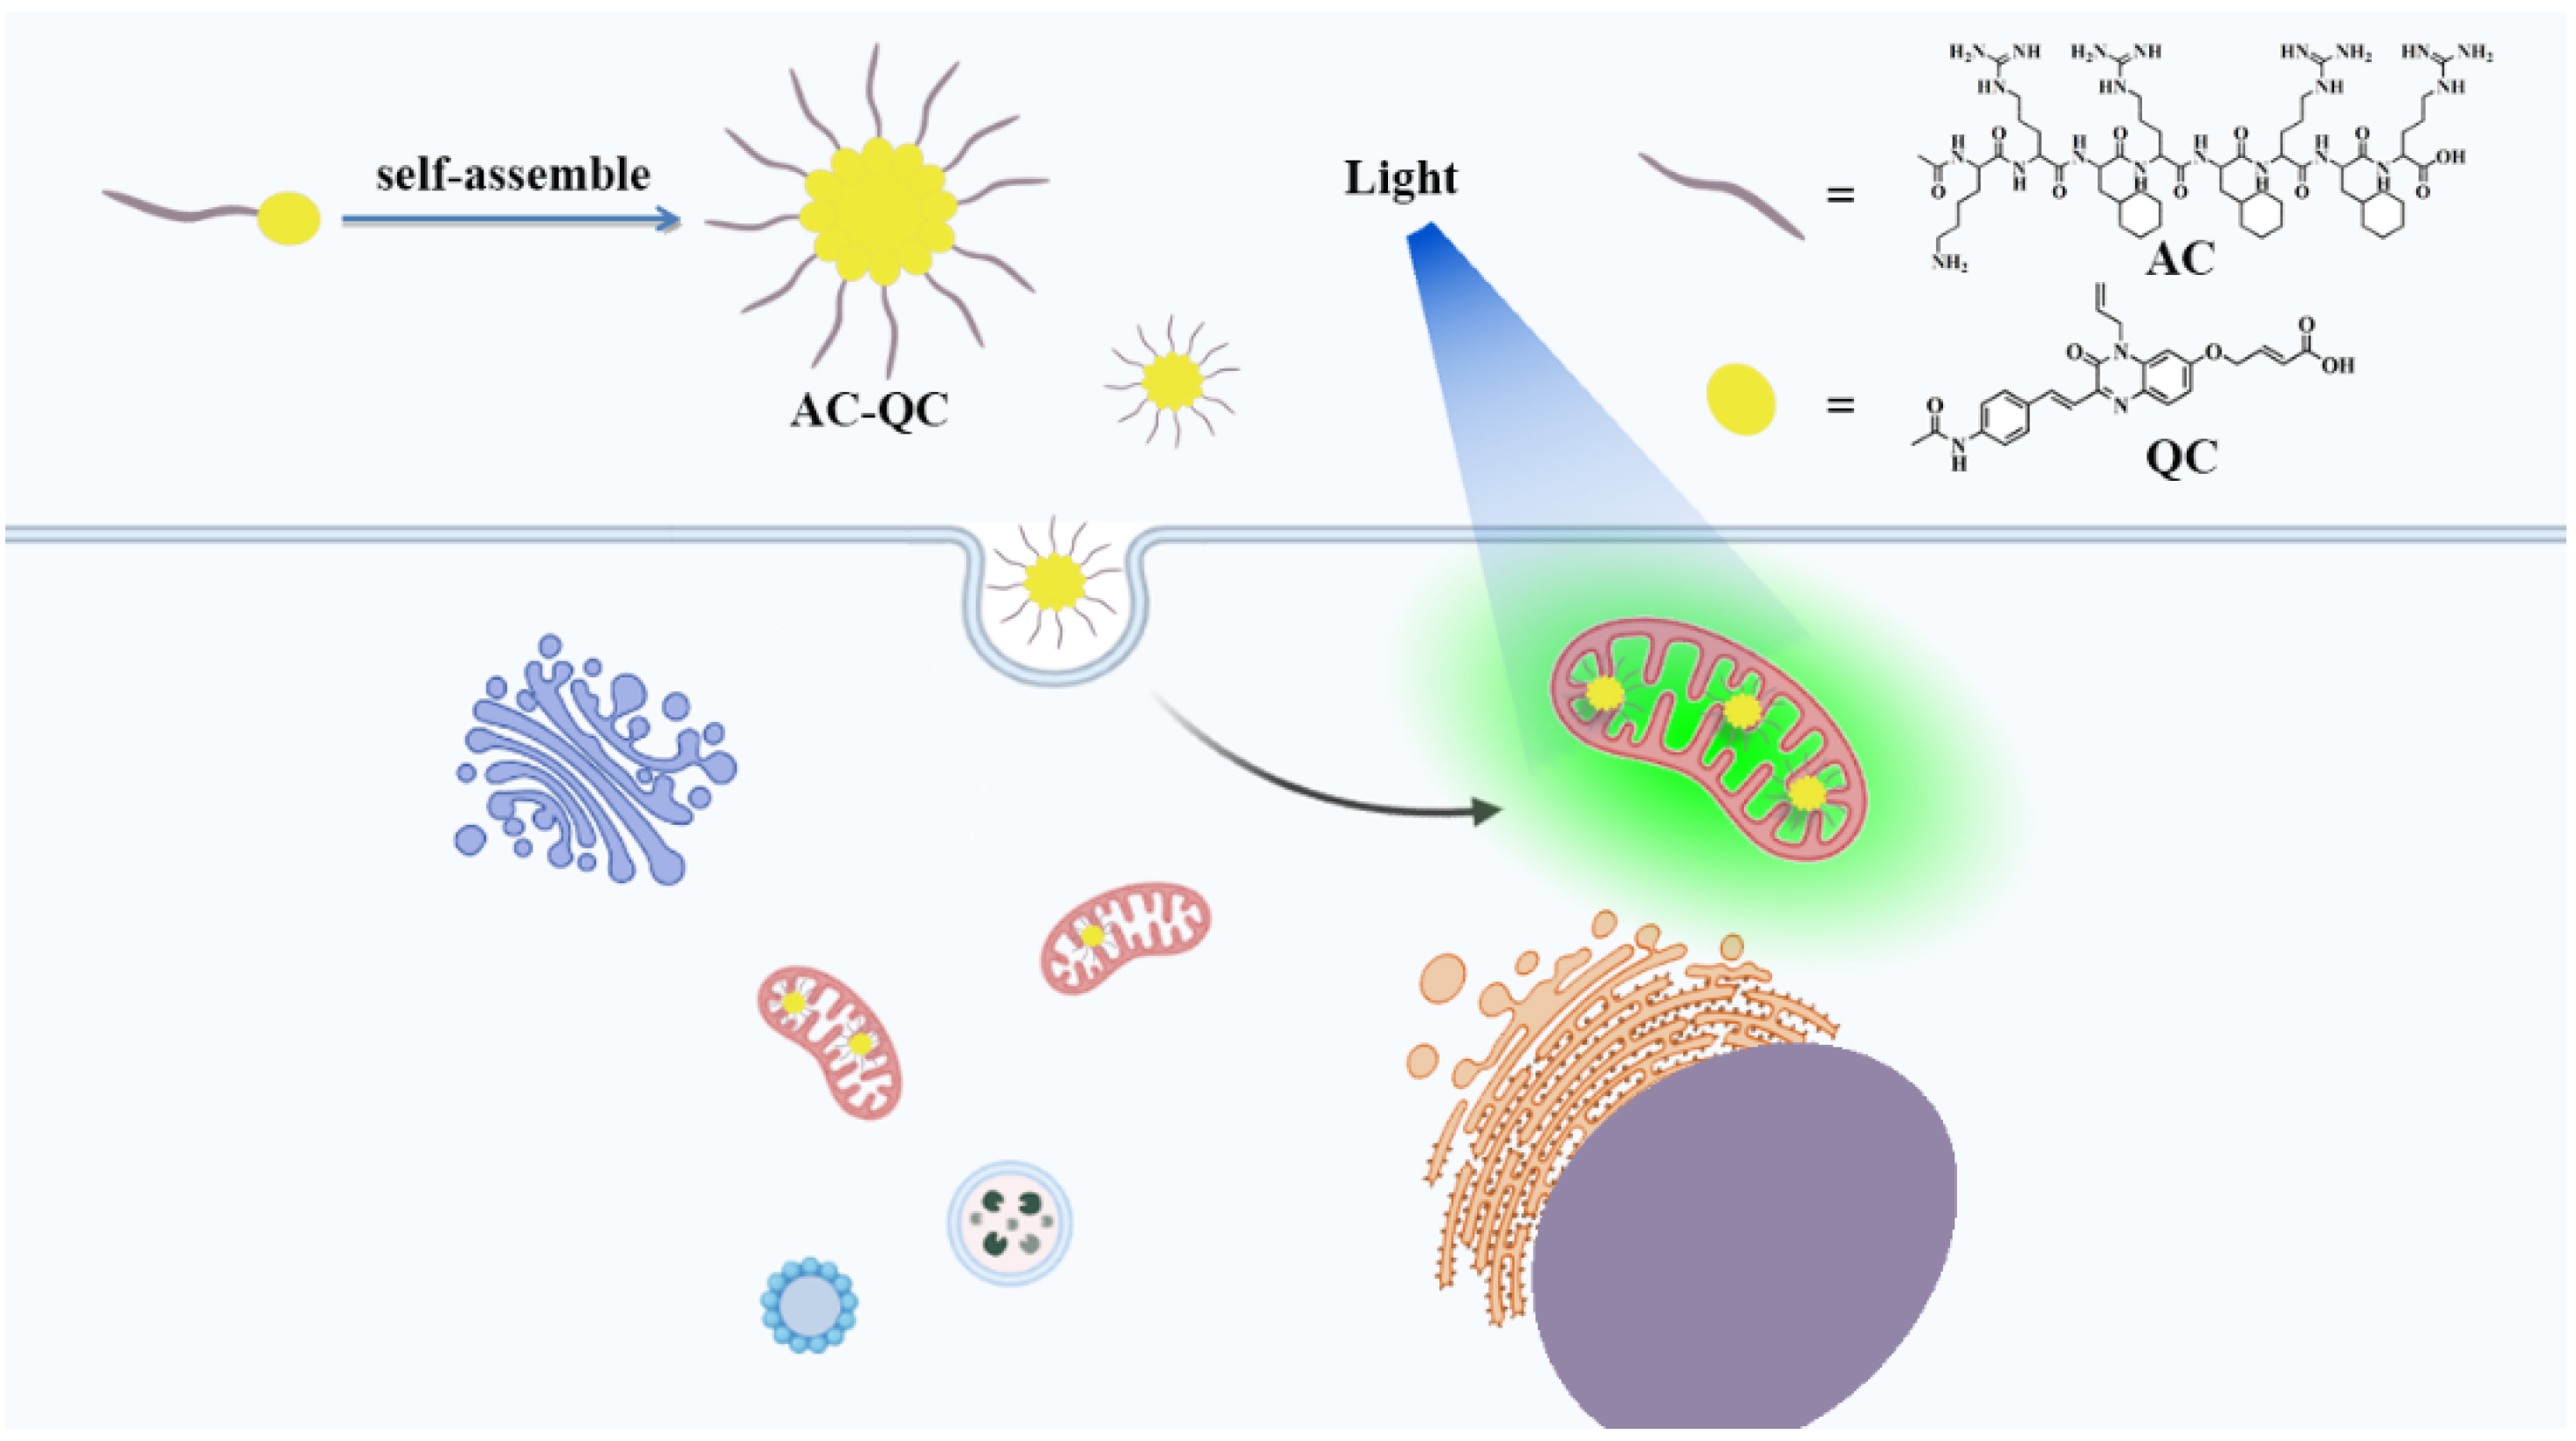
Abstract
1. Introduction
2. Results
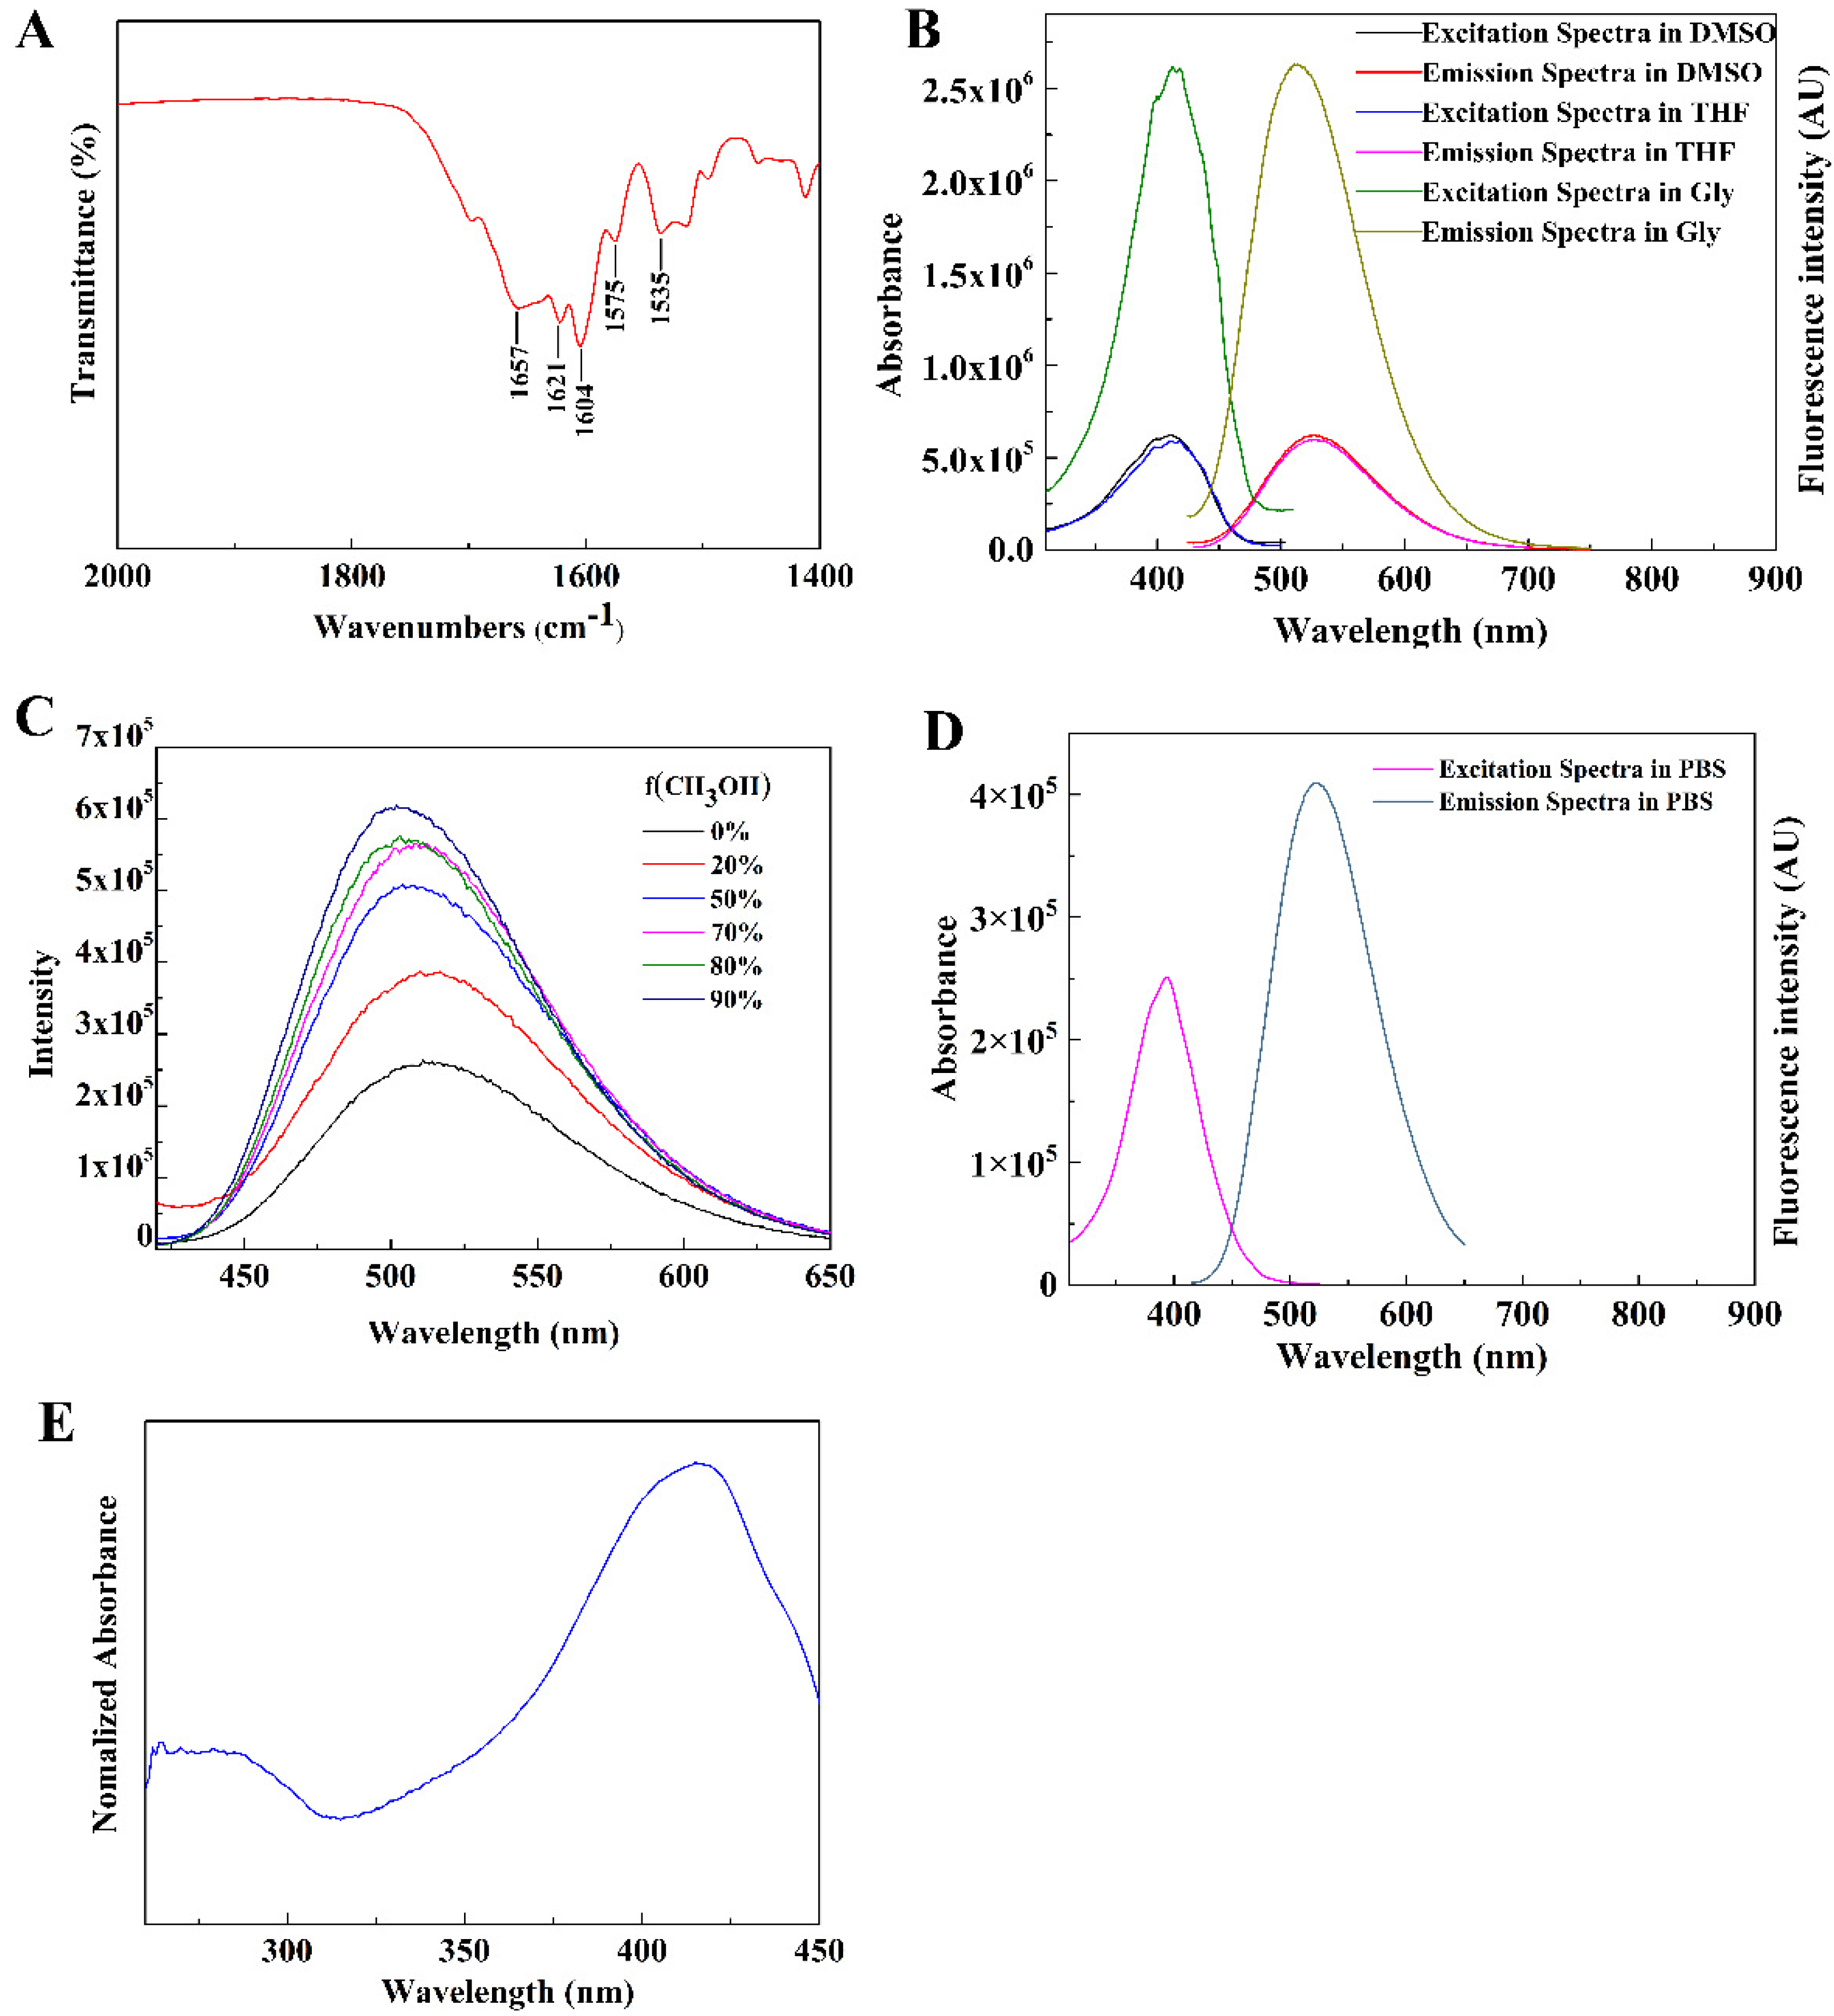
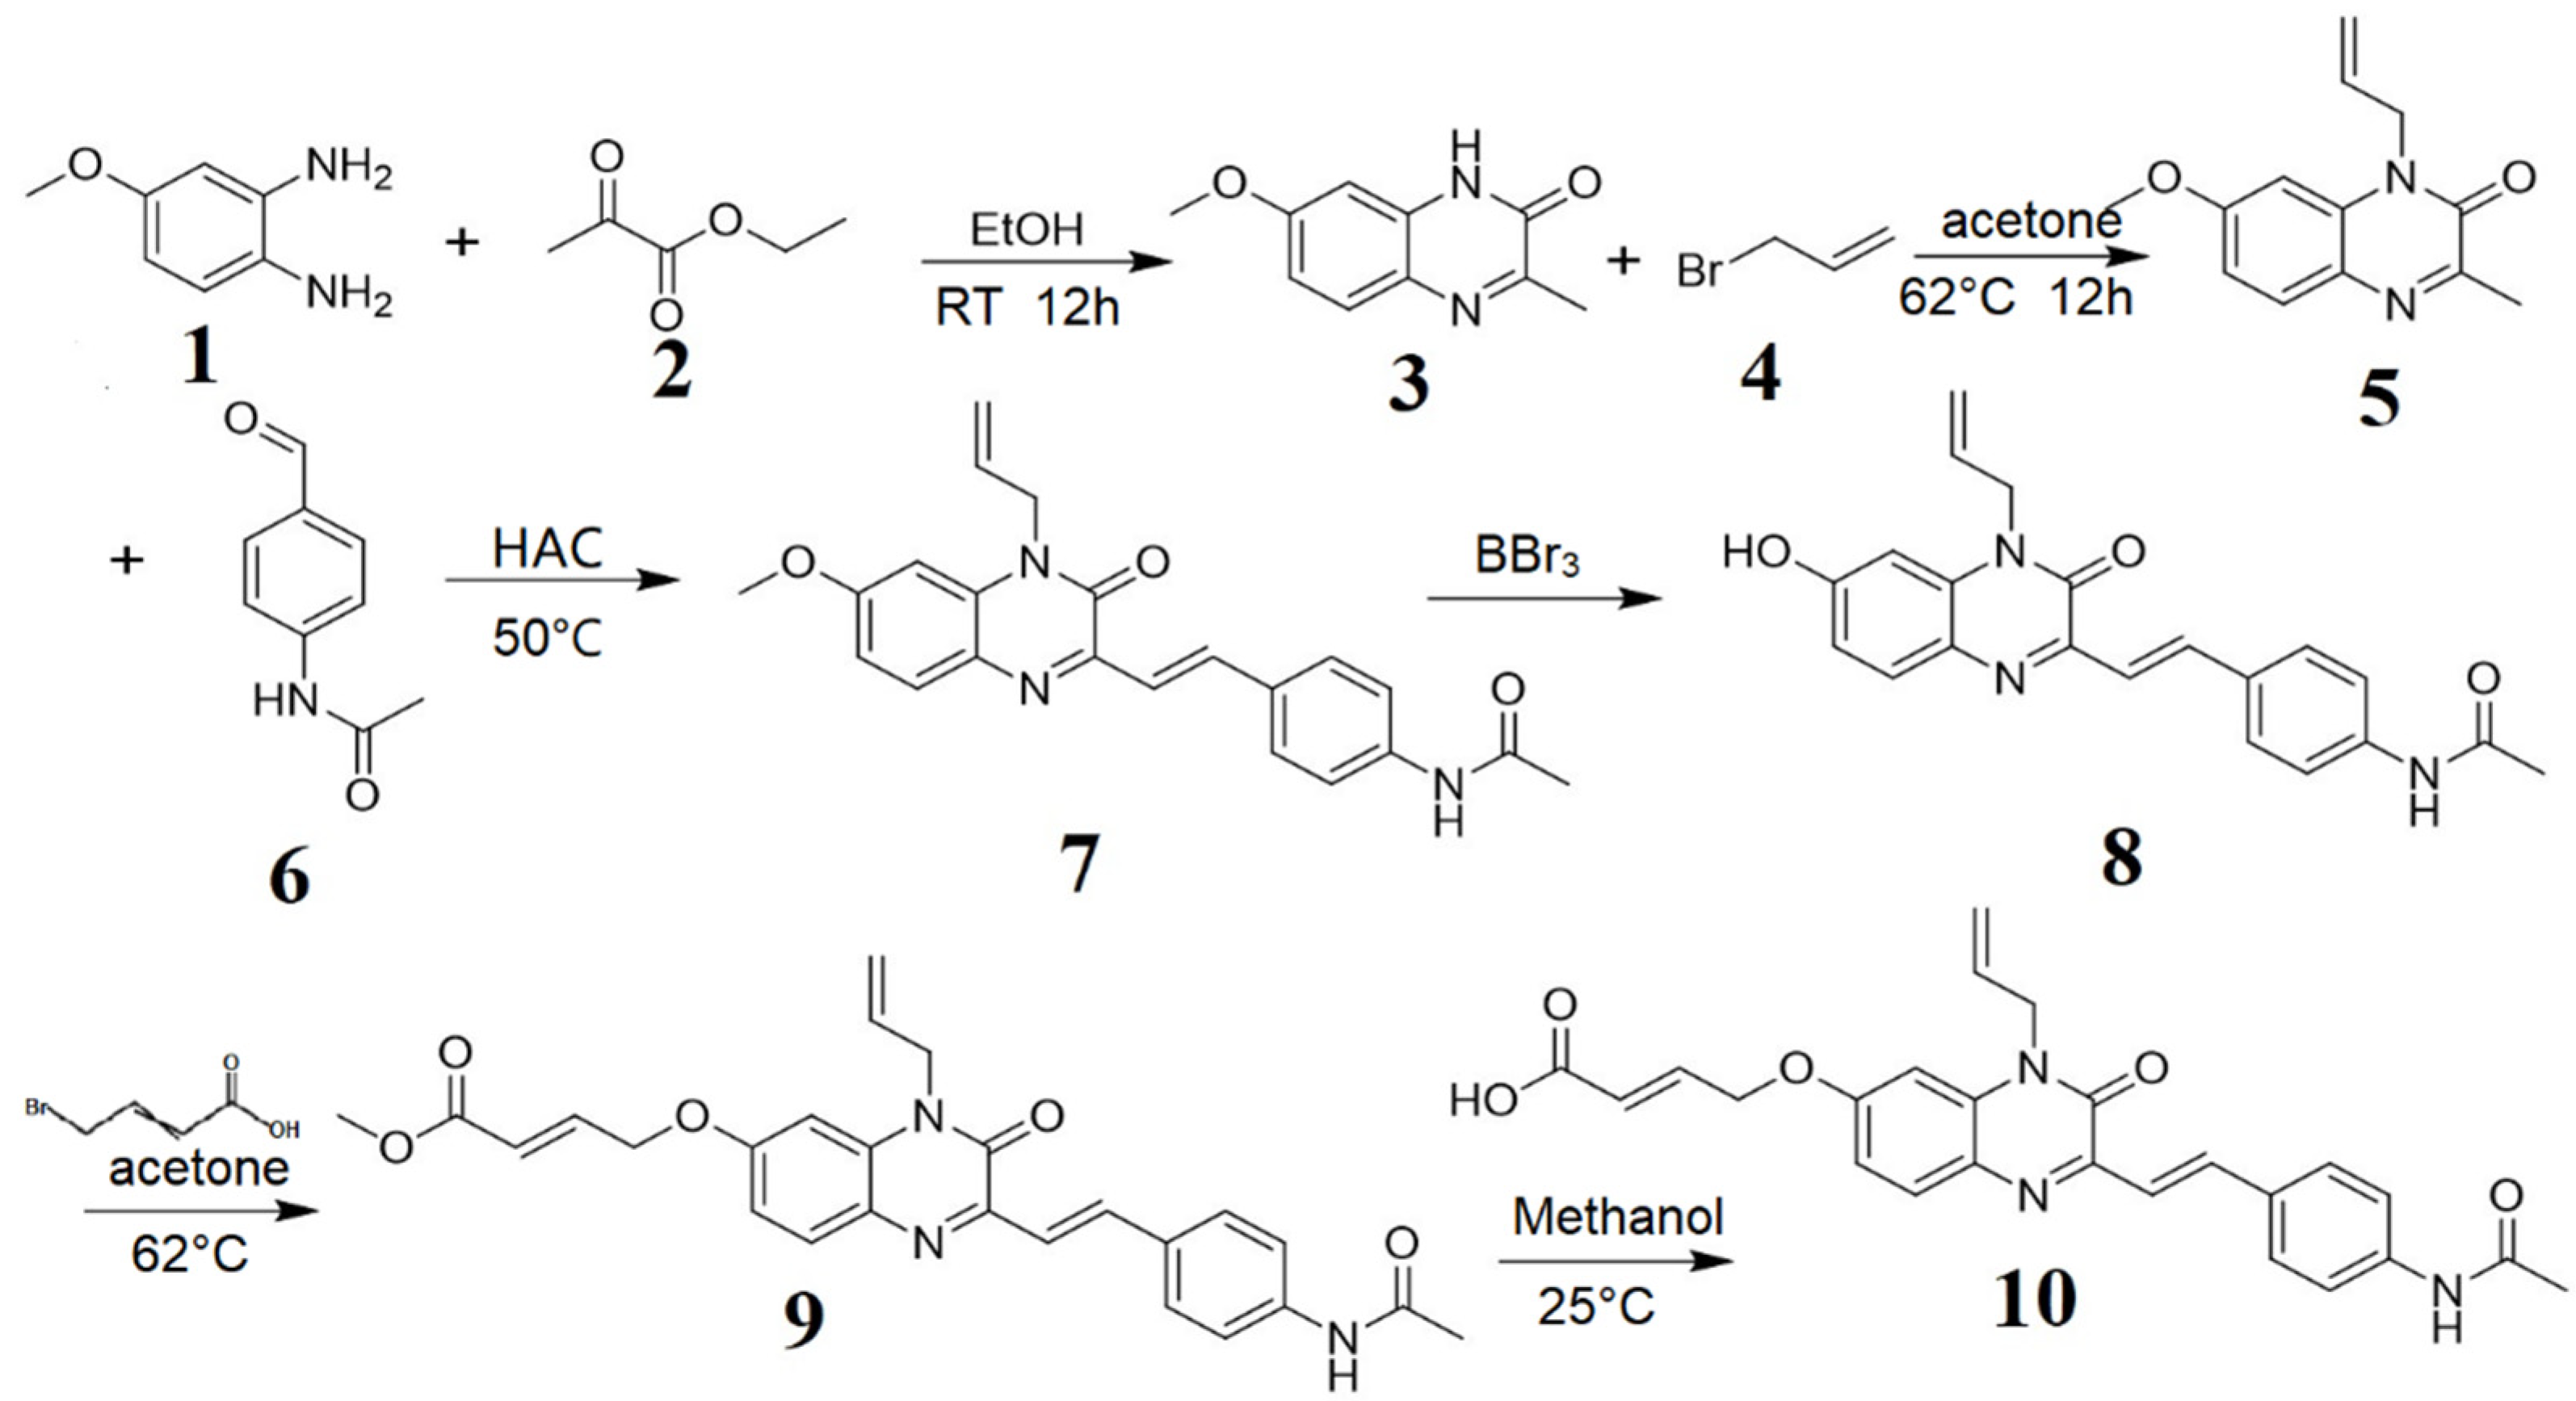
2.1. Development and Depiction of AIE Dye (QC)
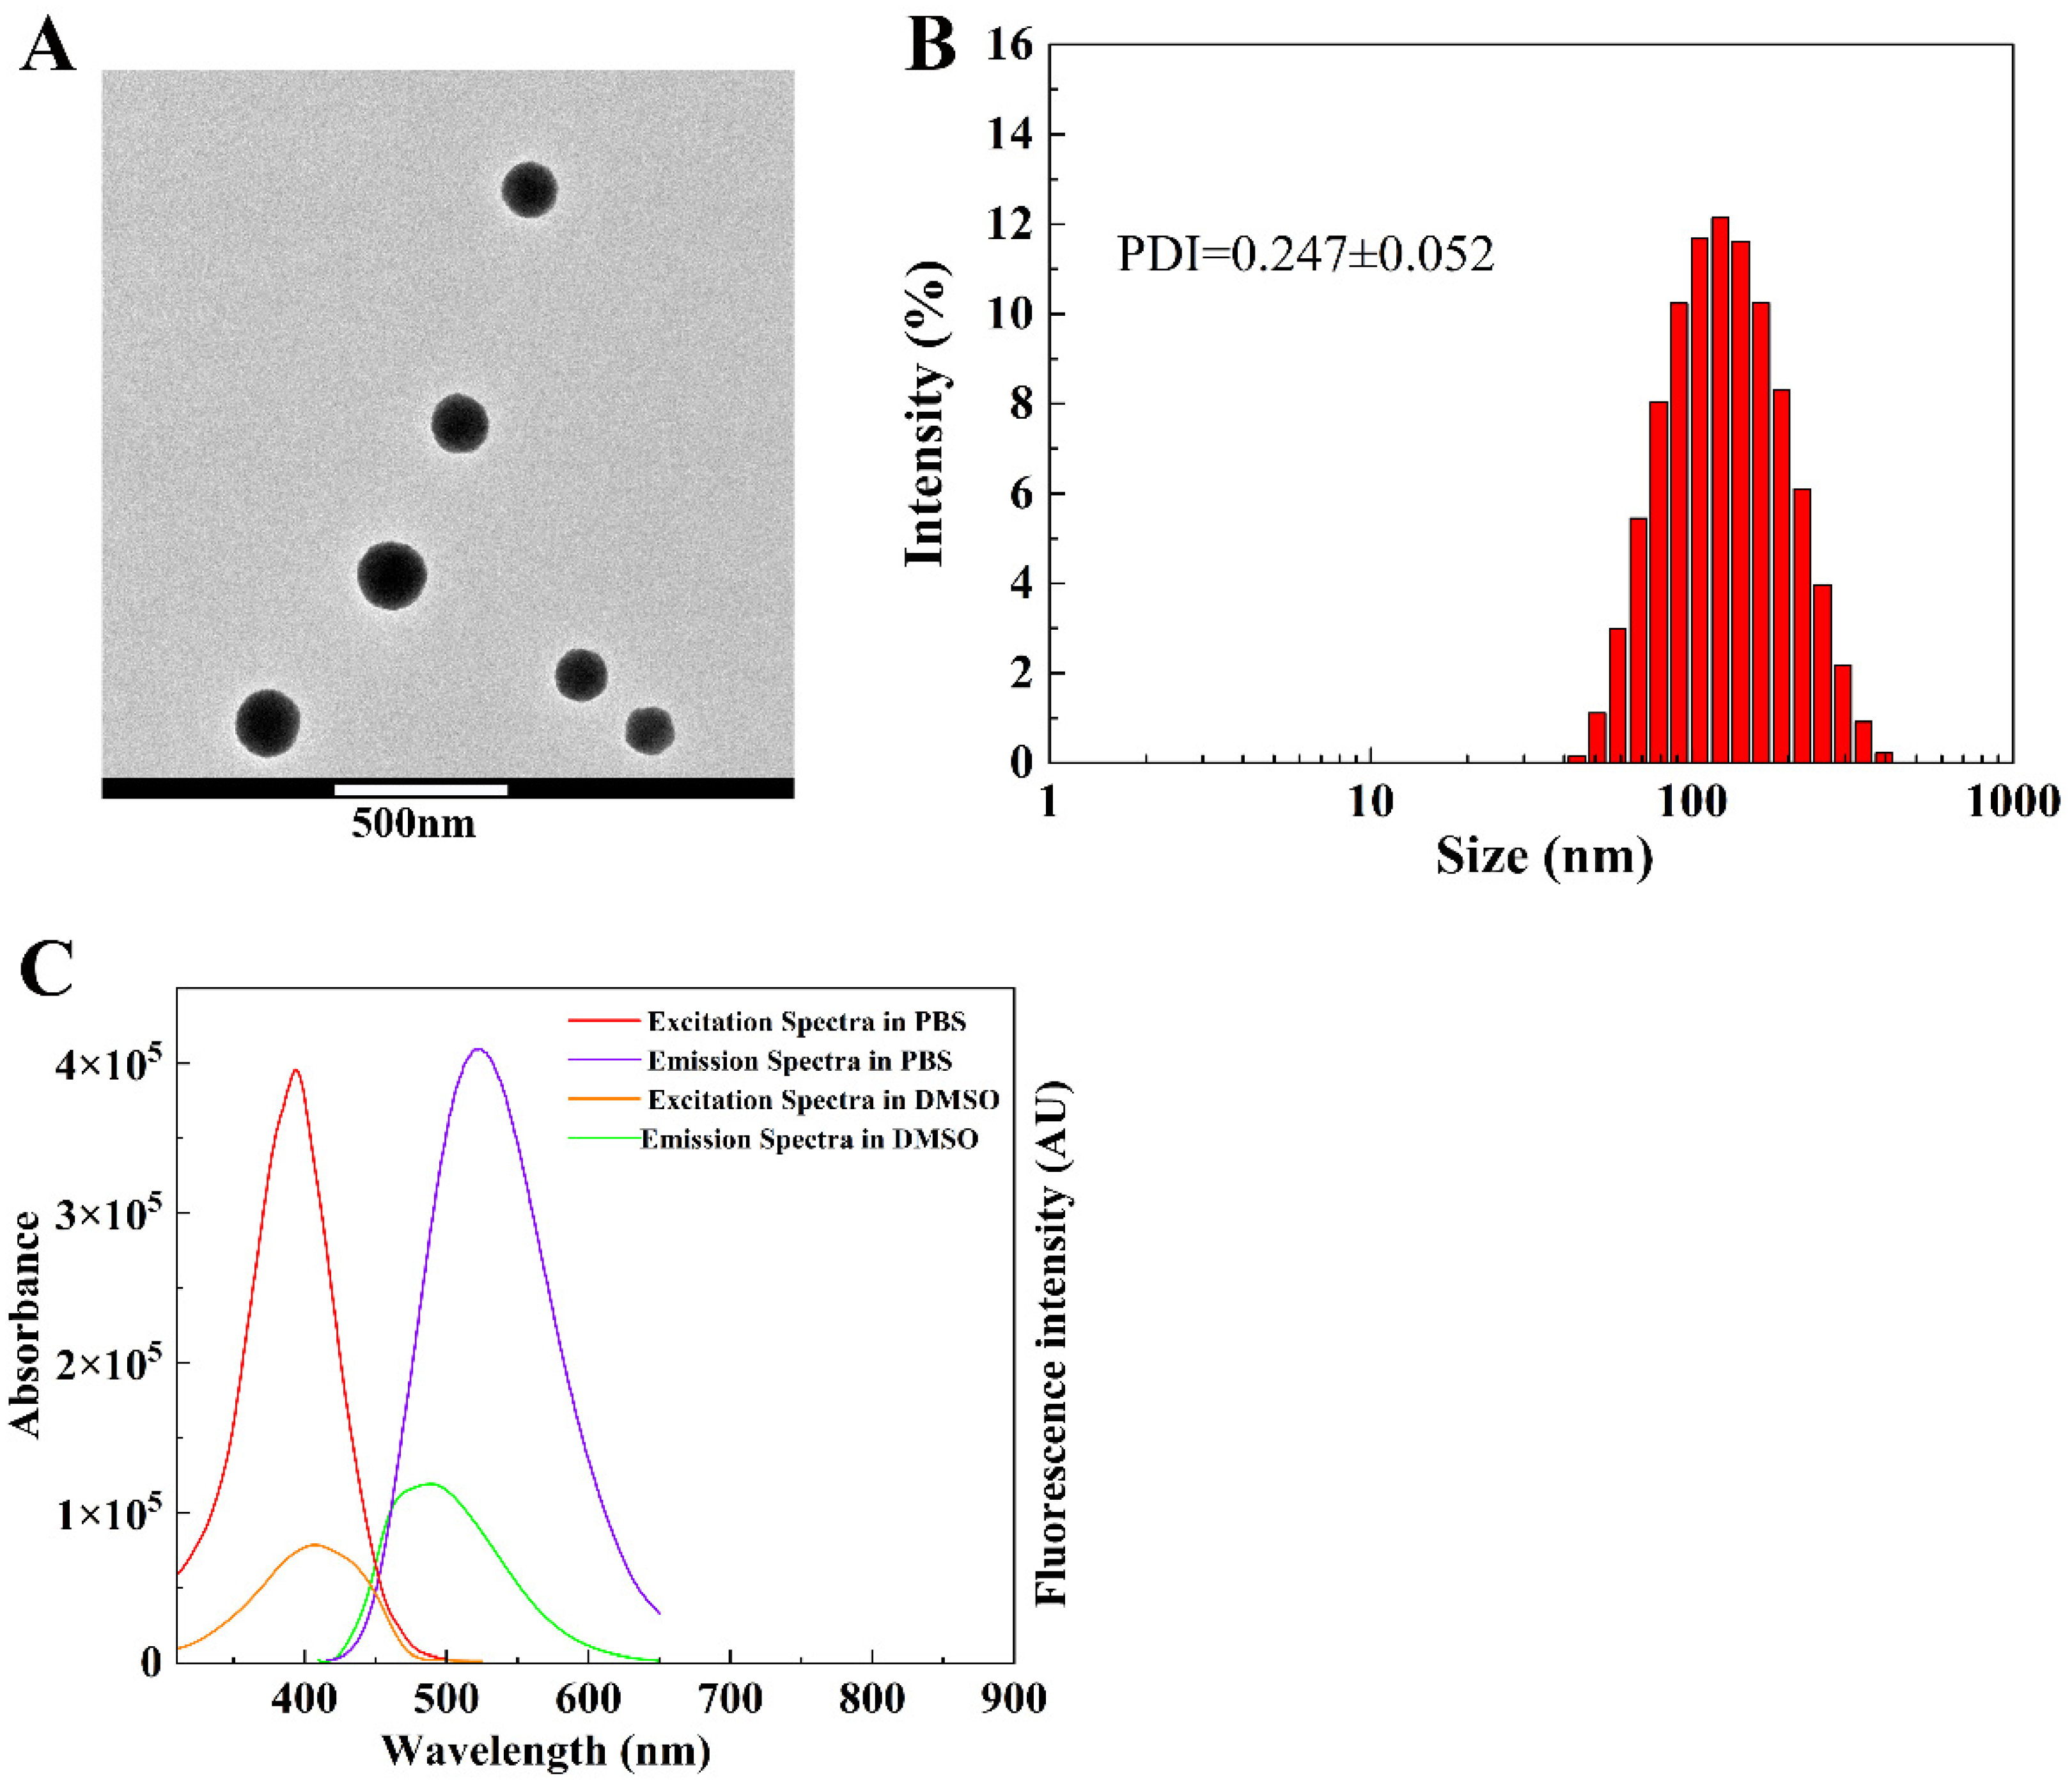
2.2. Development and Depiction of AC-QC Nanoparticles
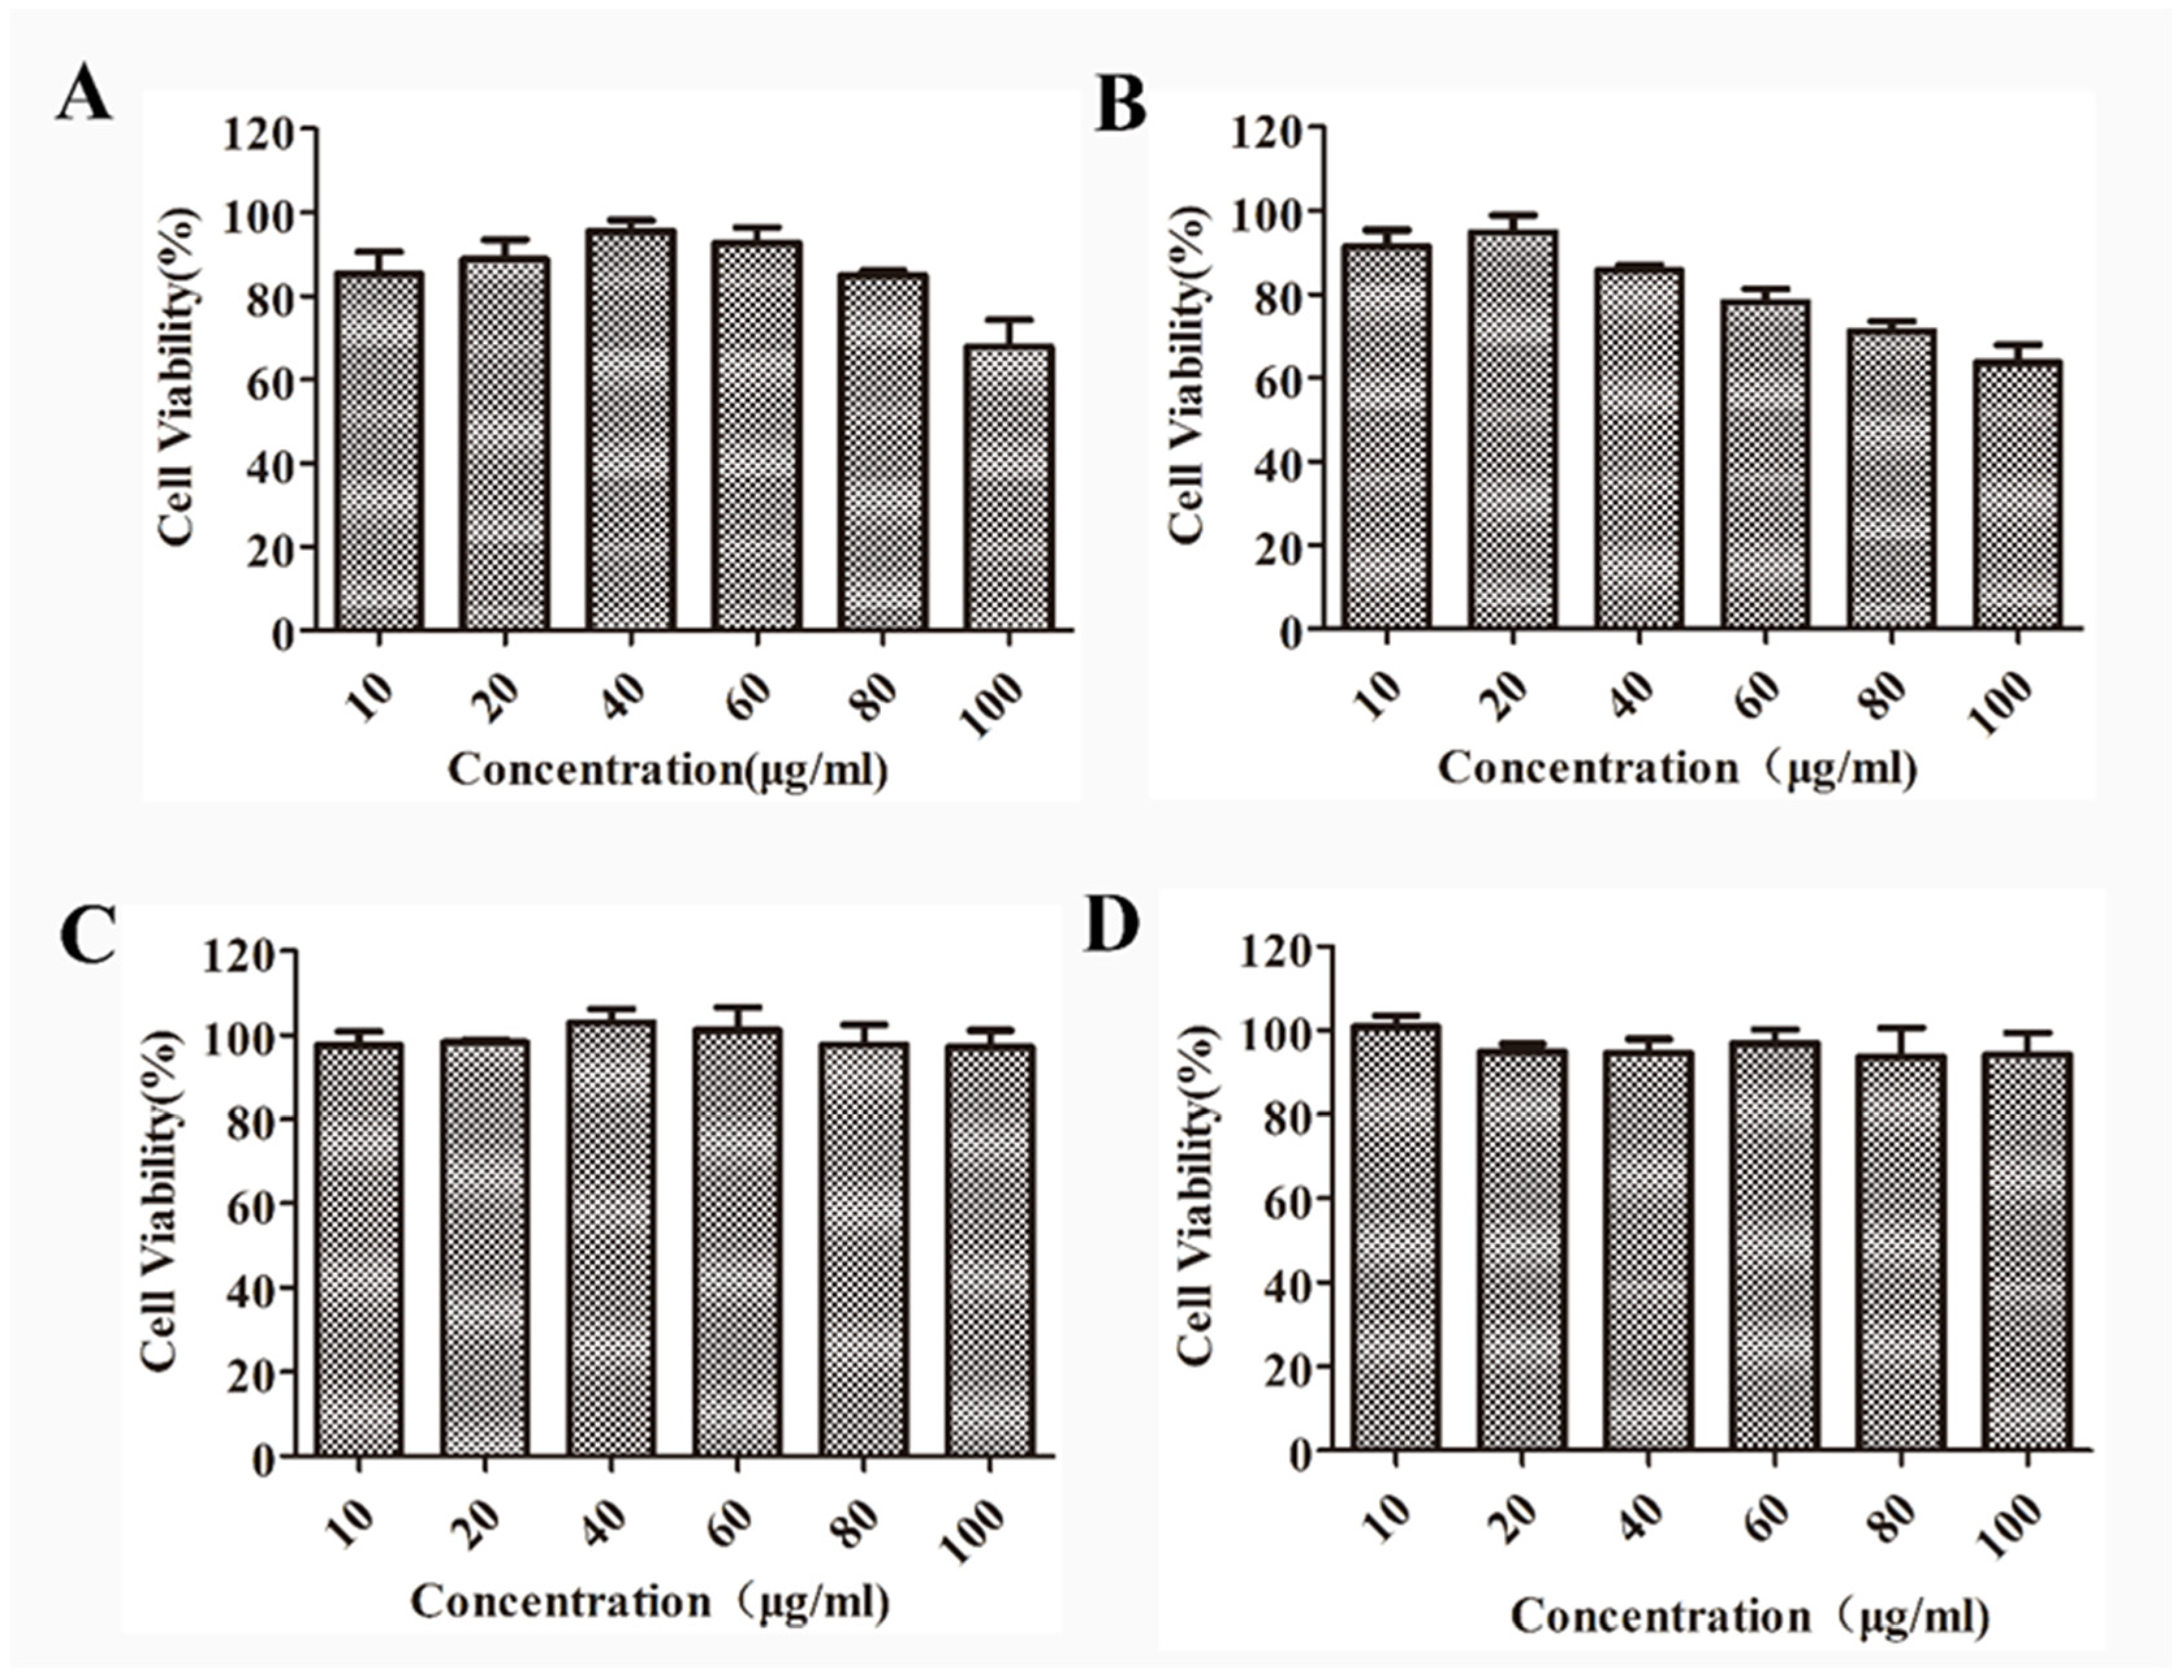
2.3. In Vitro Cell Toxicity
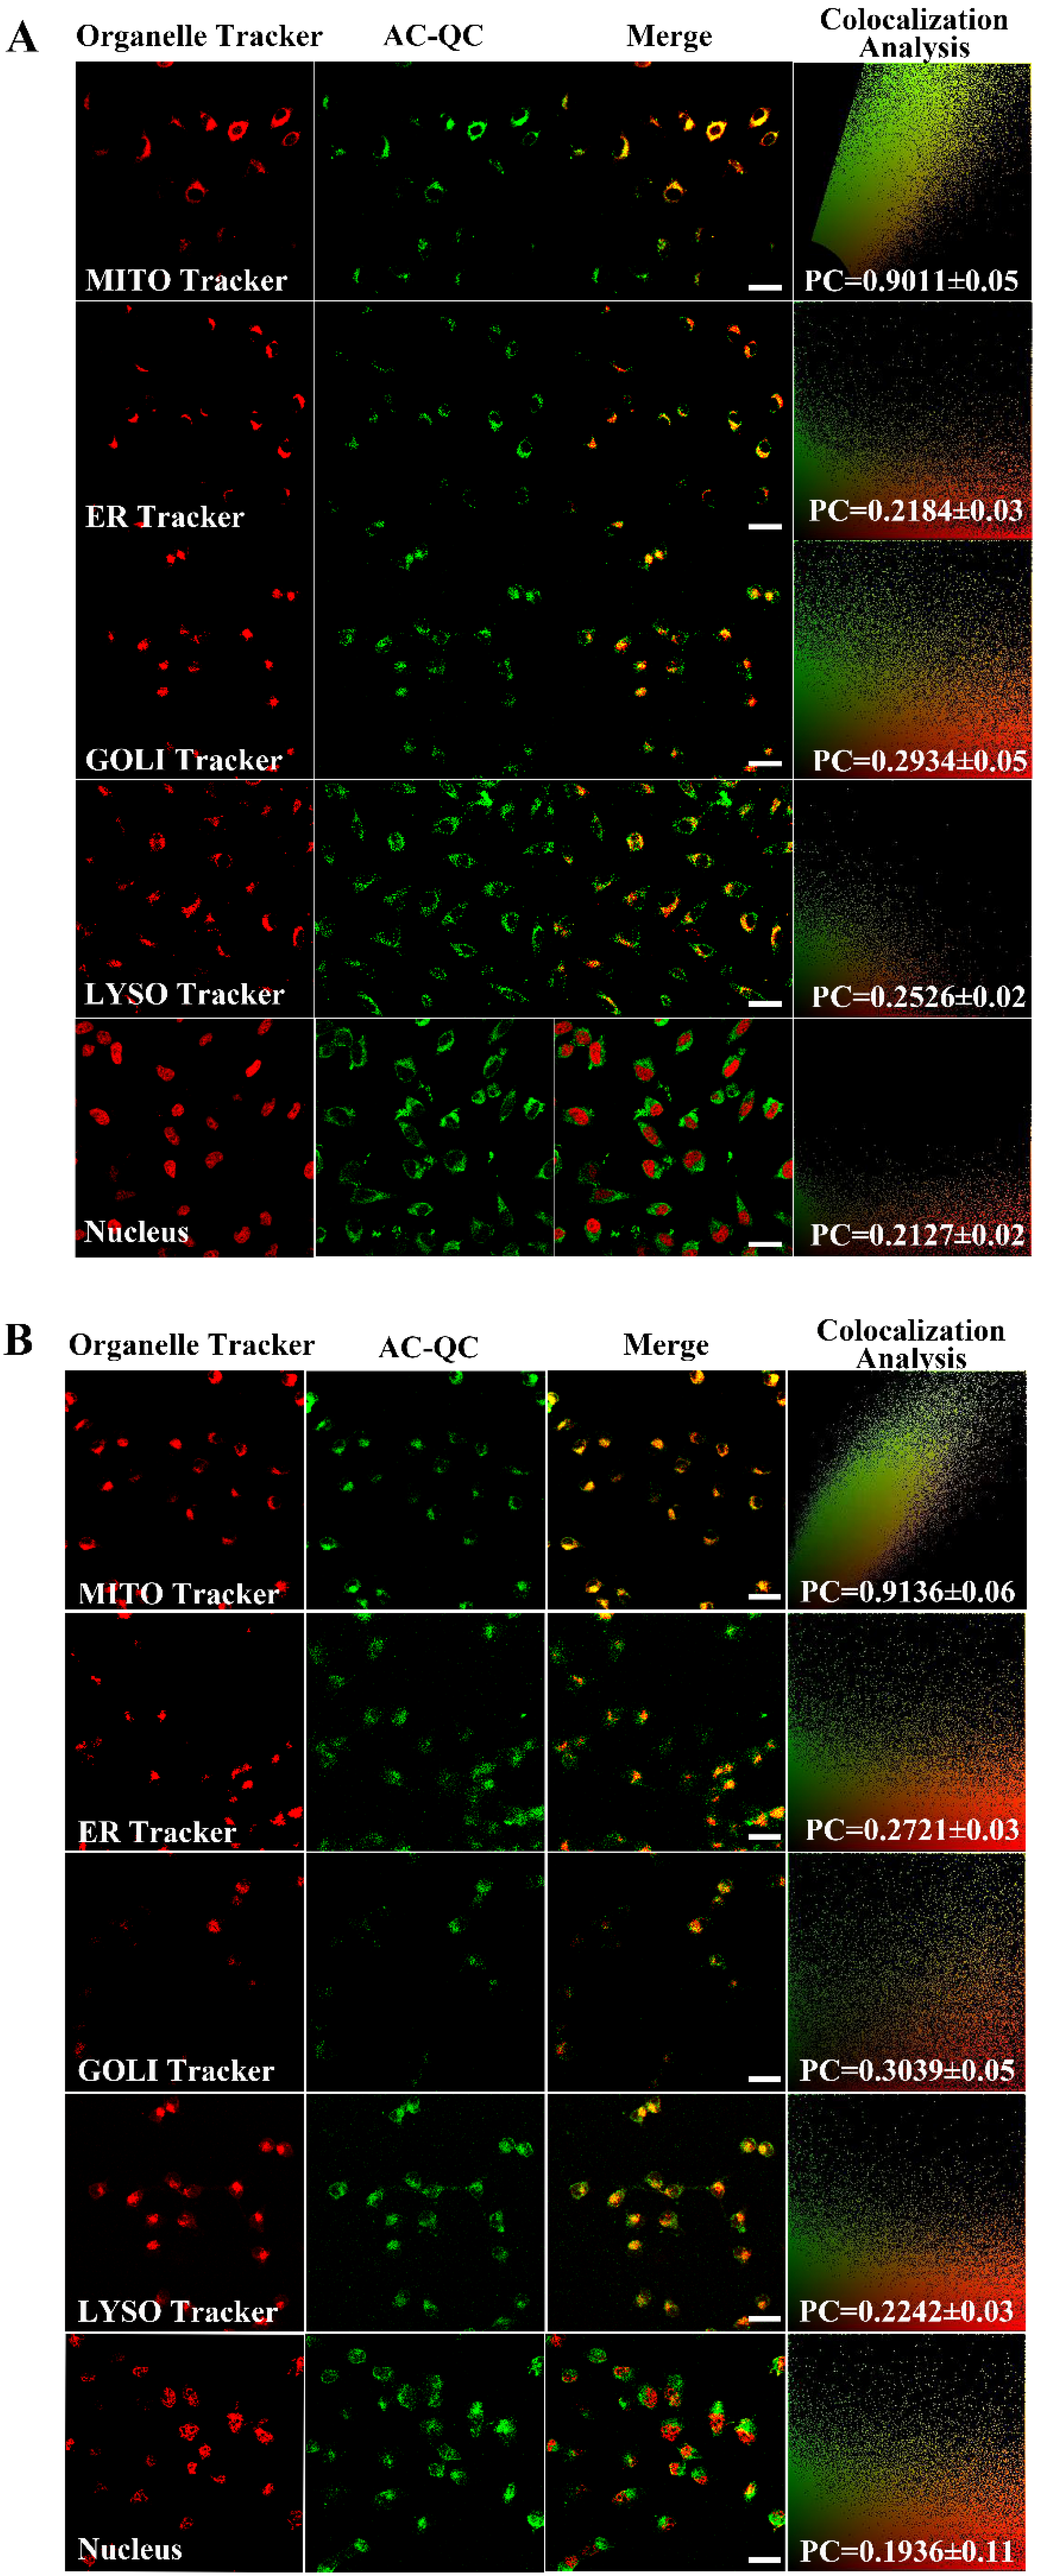
2.4. Colocalization Study
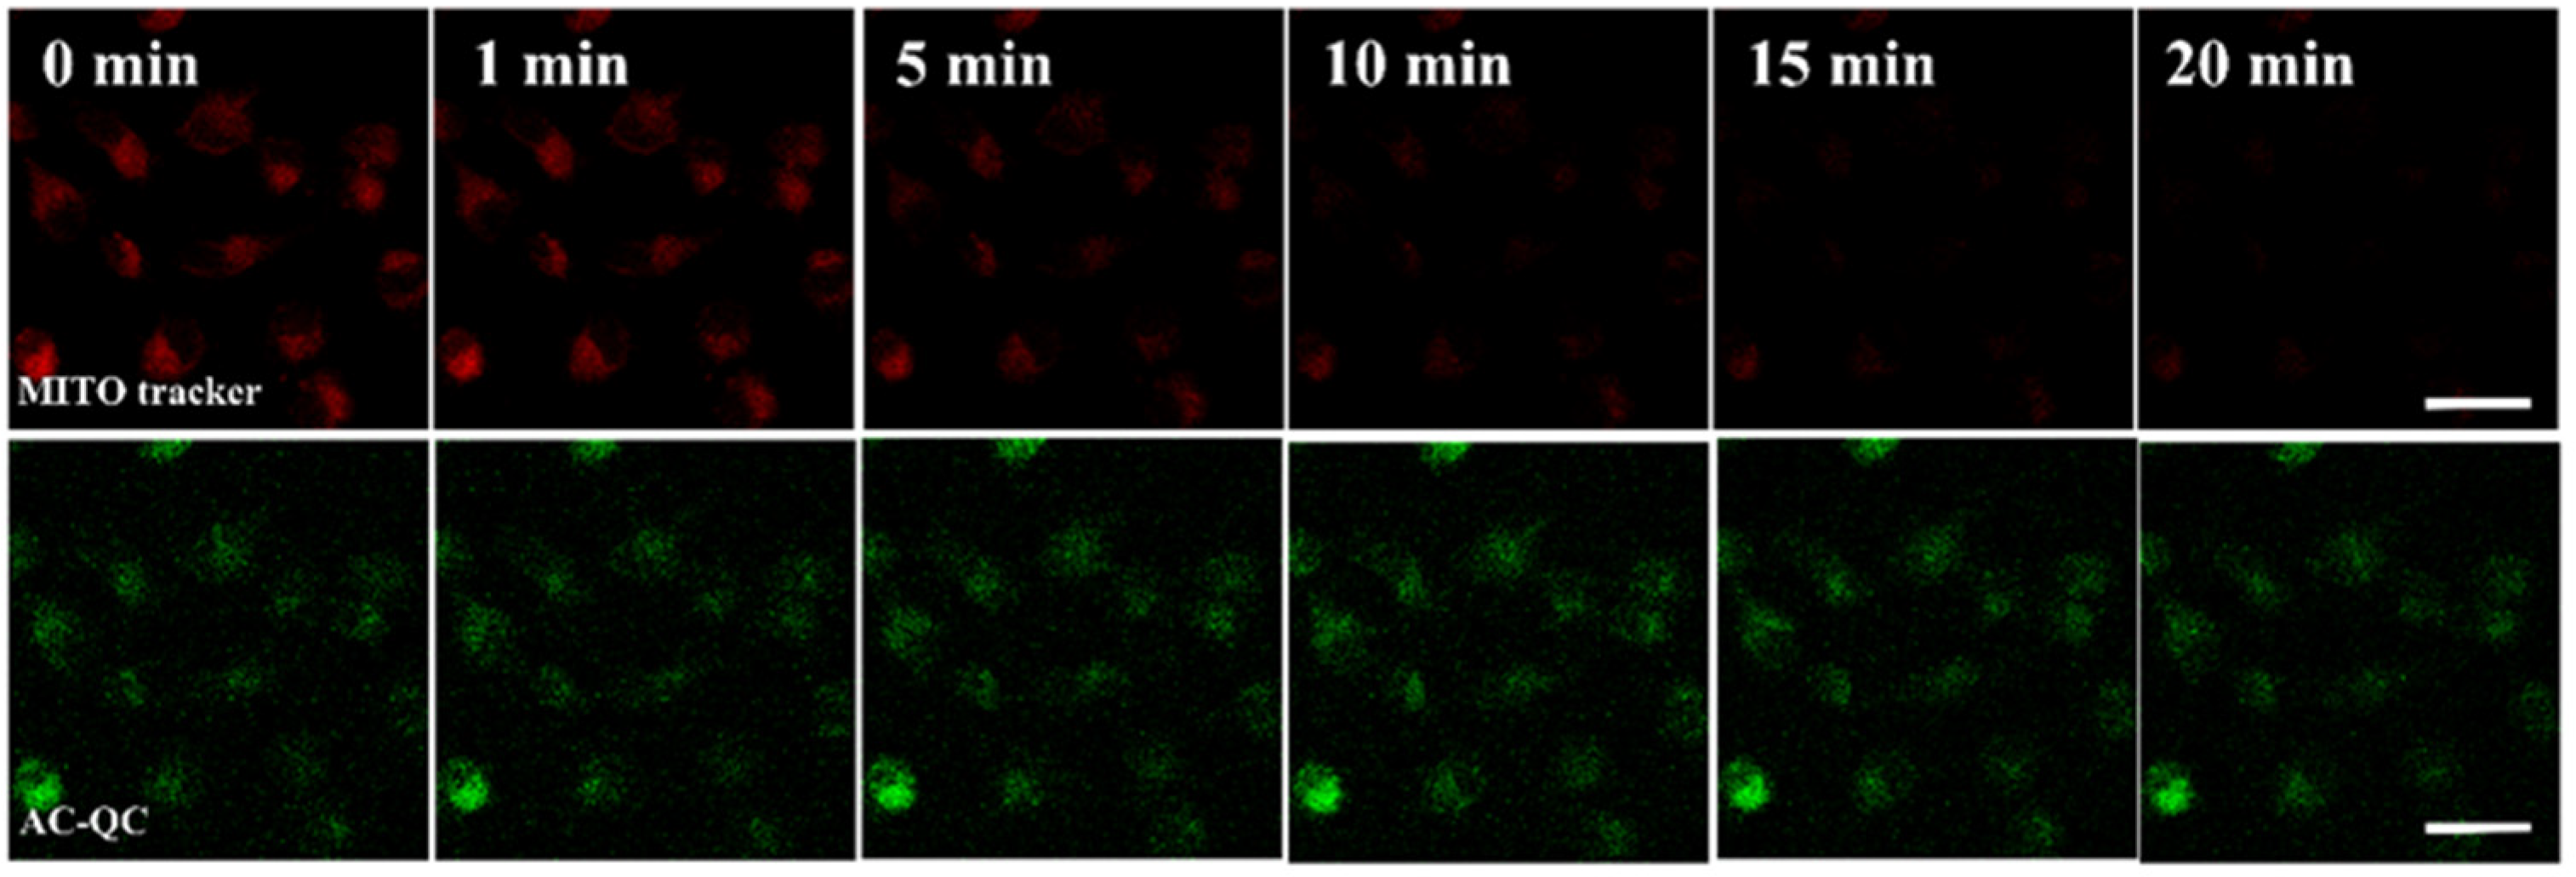
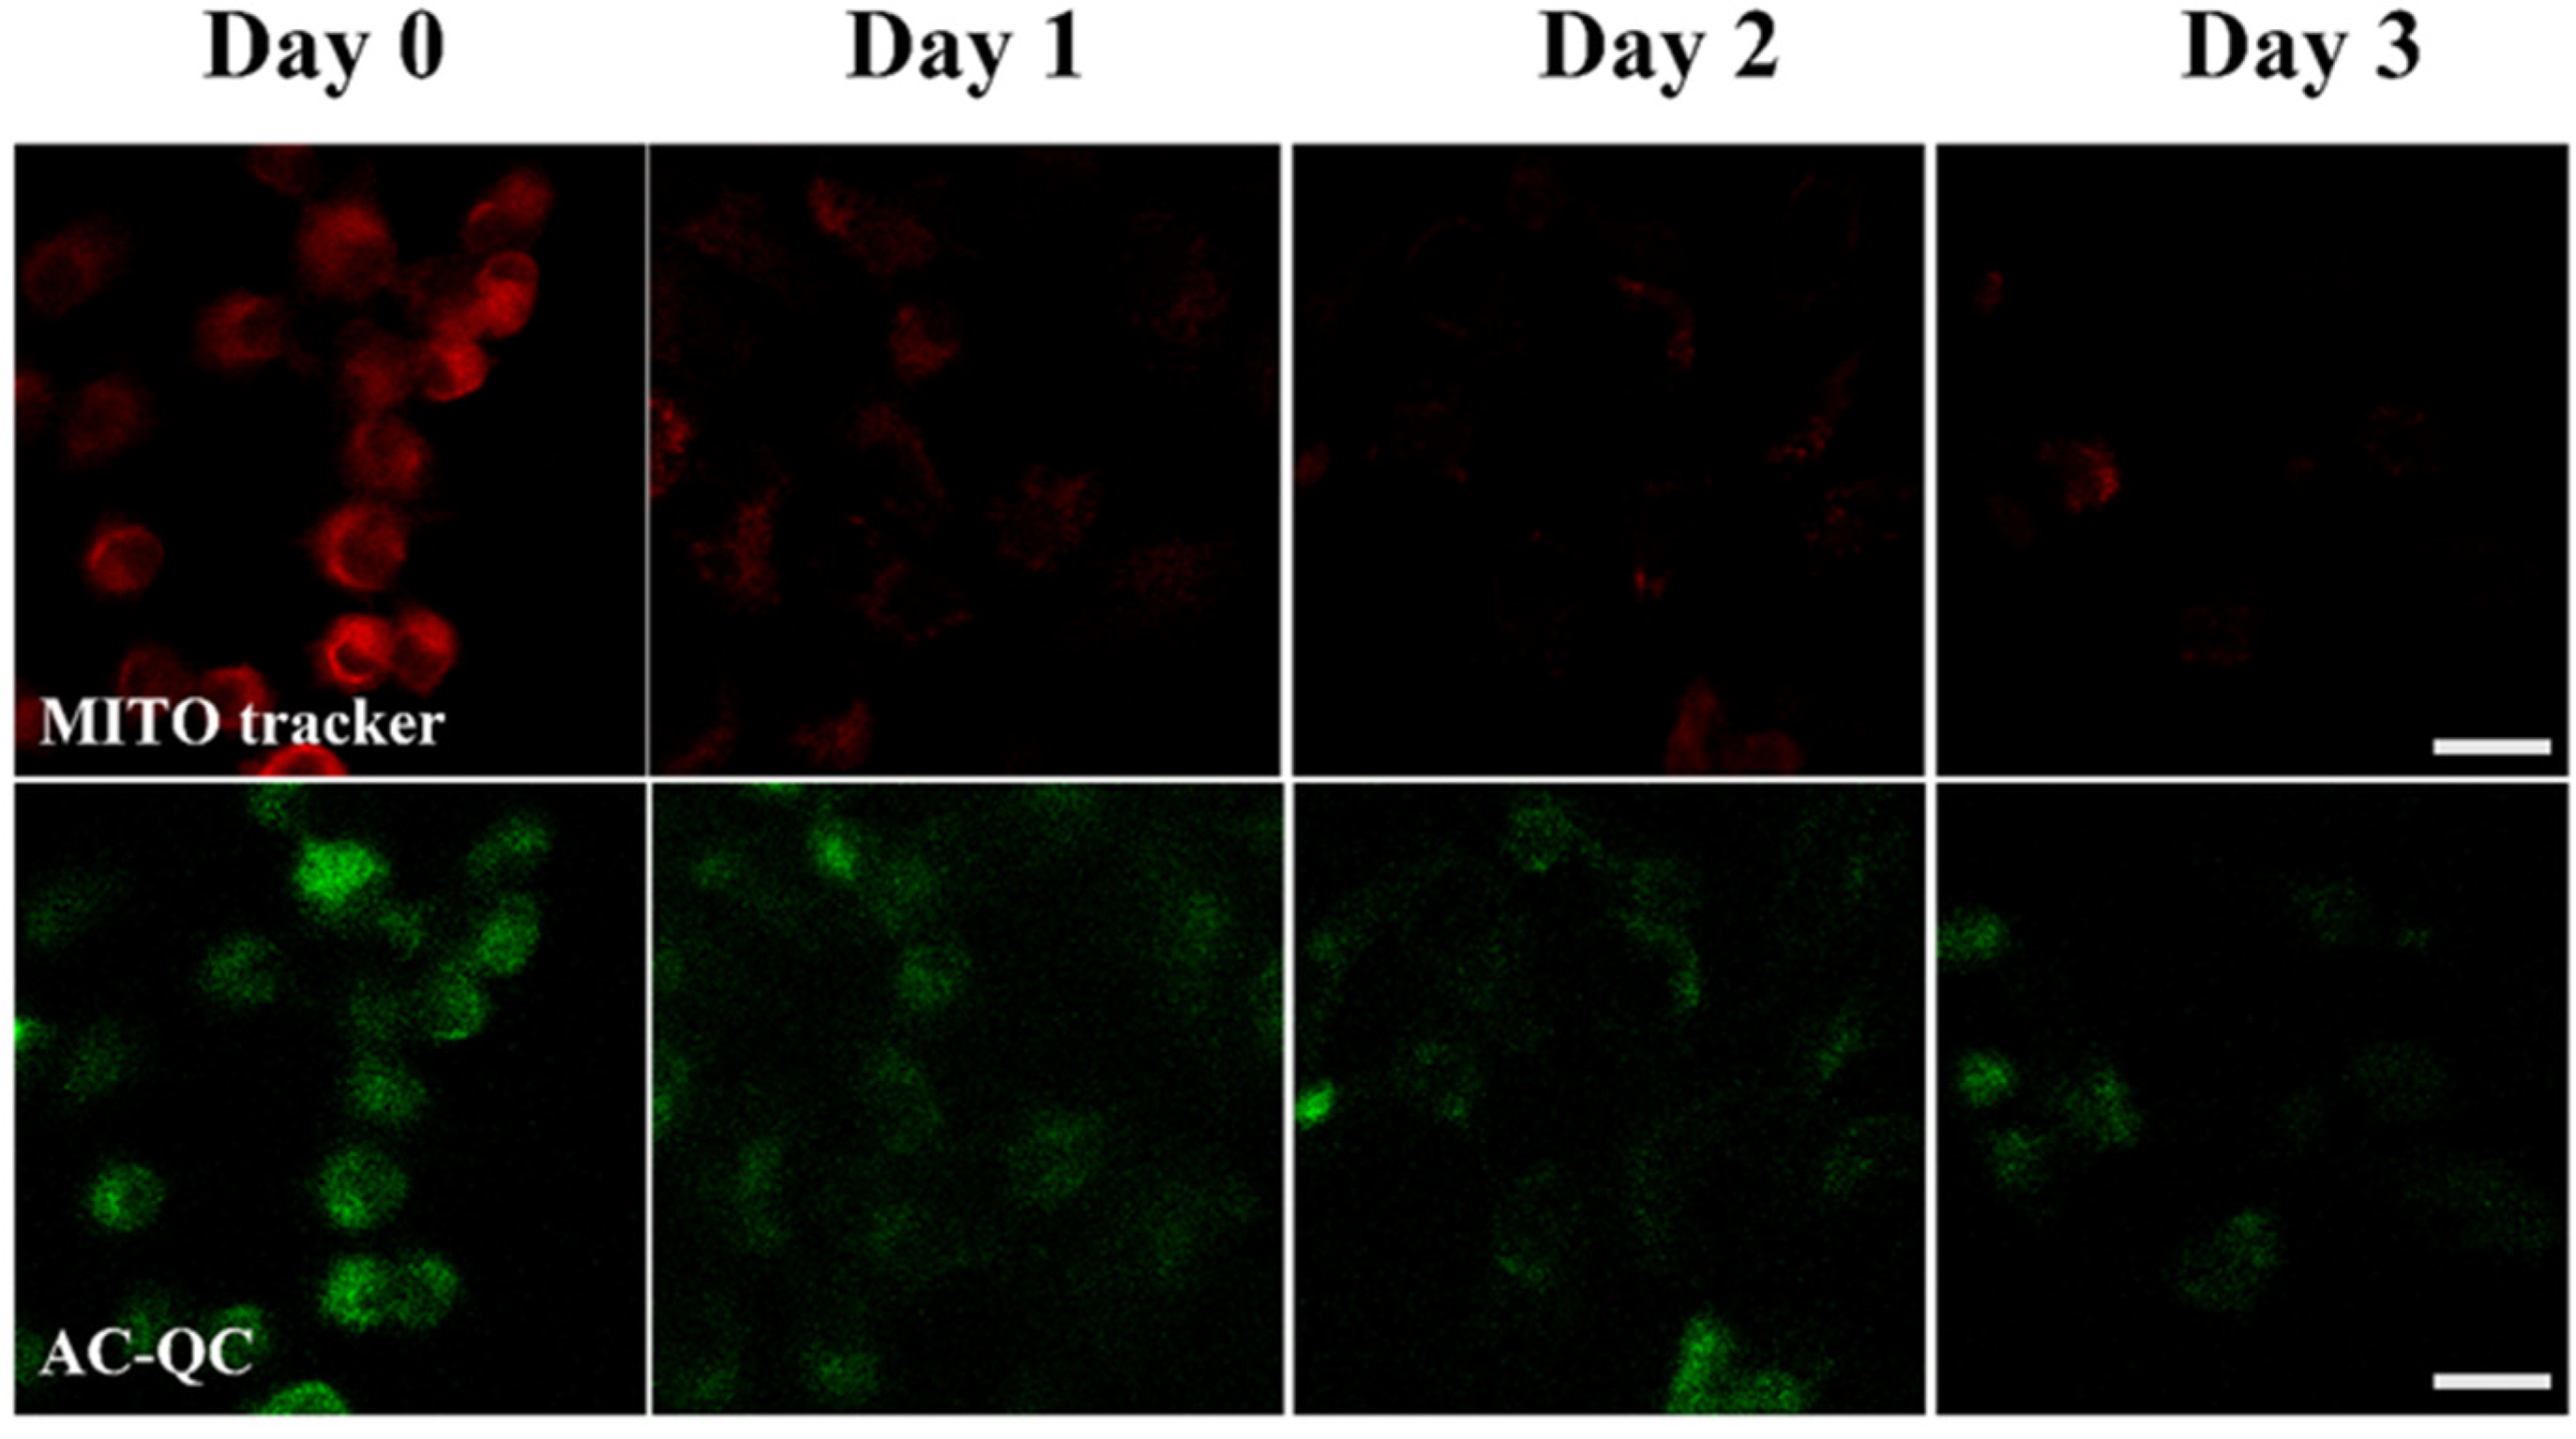
2.5. Photostability of AC-QC Nanoparticles
3. Discussion
4. Materials and Methods
4.1. Development of AIE Dye (QC)
4.2. Production of AC-QC Nanoparticles
4.3. Absorption Spectra
4.4. Fluorescence Analysis
4.5. Cell Culture and Internalization
4.6. Cytotoxicity Measurements
4.7. Confocal Imaging of QC and AC-QC in Living Cells
5. Conclusions
Supplementary Materials
Author Contributions
Funding
Institutional Review Board Statement
Informed Consent Statement
Data Availability Statement
Acknowledgments
Conflicts of Interest
Sample Availability
References
- Xiao, H.; Li, P.; Zhang, W.; Tang, B. An ultrasensitive near-infrared ratiometric fluorescent probe for imaging mitochondrial polarity in live cells and in vivo. Chem. Sci. 2016, 7, 1588–1593. [Google Scholar] [CrossRef]
- Hoye, A.T.; Davoren, J.E.; Wipf, P.; Fink, M.P.; Kagan, V.E. Targeting mitochondria. Acc. Chem. Res. 2008, 41, 87–97. [Google Scholar] [CrossRef] [PubMed]
- Kroemer, G.; Galluzzi, L.; Brenner, C. Mitochondrial membrane permeabilization in cell death. Physiol. Rev. 2007, 87, 99–163. [Google Scholar] [CrossRef] [PubMed]
- Hajnóczky, G.; Csordás, G.; Das, S.; Garcia-Perez, C.; Saotome, M.; Roy, S.S.; Yi, M. Mitochondrial calcium signalling and cell death: Approaches for assessing the role of mitochondrial Ca2+ uptake in apoptosis. Cell Calcium 2006, 40, 553–560. [Google Scholar] [CrossRef] [PubMed]
- Deliconstantinos, G.; Villiotou, V.; Stavrides, J.C. Modulation of particulate nitric oxide synthase activity and peroxynitrite synthesis in cholesterol enriched endothelial cell membranes. Biochem. Pharmacol. 1995, 49, 1589–1600. [Google Scholar] [CrossRef]
- Zubenko, G.S.; Kopp, U.; Seto, T.; Firestone, L.L. Platelet membrane fluidity individuals at risk for Alzheimer’s disease: A comparison of results from fluorescence spectroscopy and electron spin resonance spectroscopy. Psychopharmacology 1999, 145, 175–180. [Google Scholar] [CrossRef]
- Hell, S.W. Toward fluorescence nanoscopy. Nat. Biotechnol. 2003, 21, 1347–1355. [Google Scholar] [CrossRef]
- Chalfie, M.; Kain, S.R. (Eds.) Green Fluorescent Protein: Properties, Applications and Protocols; John Wiley & Sons: Hoboken, NJ, USA, 2005. [Google Scholar]
- Sauer, M.; Hofkens, J.; Enderlein, J. Handbook of Fluorescence Spectroscopy and Imaging: From Ensemble to Single Molecules; John Wiley & Sons: Hoboken, NJ, USA, 2010. [Google Scholar]
- Sample, V.; Newman, R.H.; Zhang, J. The structure and function of fluorescent proteins. Chem. Soc. Rev. 2009, 38, 2852–2864. [Google Scholar] [CrossRef]
- Sauer, M.; Heilemann, M. Single-molecule localization microscopy in eukaryotes. Chem. Rev. 2017, 117, 7478–7509. [Google Scholar] [CrossRef]
- Chen, M.H.; Wang, F.X.; Cao, J.J.; Tan, C.-P.; Ji, L.-N.; Mao, Z.-W. Light-up mitophagy in live cells with dual-functional theranostic phosphorescent iridium (III) complexes. ACS Appl. Mater. Interfaces 2017, 9, 13304–13314. [Google Scholar] [CrossRef]
- Hu, F.; Manghnani, P.N.; Kenry; Feng, G.; Wu, W.; Teh, C.; Liu, B. Visualize embryogenesis and cell fate using fluorescent probes with aggregation-induced emission. ACS Appl. Mater. Interfaces 2019, 11, 3737–3744. [Google Scholar] [CrossRef] [PubMed]
- Li, X.; Hu, Y.; Li, X.; Ma, H. Mitochondria-immobilized near-infrared ratiometric fluorescent pH probe to evaluate cellular mitophagy. Anal. Chem. 2019, 91, 11409–11416. [Google Scholar] [CrossRef] [PubMed]
- Liu, Y.; Zhou, J.; Wang, L.; Hu, X.; Liu, X.; Liu, M.; Cao, Z.; Shangguan, D.; Tan, W. A cyanine dye to probe mitophagy: Simultaneous detection of mitochondria and autolysosomes in live cells. J. Am. Chem. Soc. 2016, 138, 12368–12374. [Google Scholar] [CrossRef] [PubMed]
- Liu, Y.; Teng, L.; Chen, L.; Ma, H.; Liu, H.W.; Zhang, X.B. Engineering of a near-infrared fluorescent probe for real-time simultaneous visualization of intracellular hypoxia and induced mitophagy. Chem. Sci. 2018, 9, 5347–5353. [Google Scholar] [CrossRef]
- Ma, D.; Huang, C.; Zheng, J.; Zhou, W.; Tang, J.; Chen, W.; Li, J.; Yang, R. Azoreductase-responsive nanoprobe for hypoxia-induced mitophagy imaging. Anal. Chem. 2018, 91, 1360–1367. [Google Scholar] [CrossRef]
- Niu, L.-Q.; Huang, J.; Yan, Z.-J.; Men, Y.-H.; Luo, Y.; Zhou, X.-M.; Wang, J.-M.; Wang, J.-H. Fluorescence detection of intracellular pH changes in the mitochondria-associated process of mitophagy using a hemicyanine-based fluorescent probe. Spectrochim. Acta Part A Mol. Biomol. Spectrosc. 2019, 207, 123–131. [Google Scholar] [CrossRef]
- Ye, Z.; Wei, L.; Geng, X.; Wang, X.; Li, Z.; Xiao, L. Mitochondrion-Specific Blinking Fluorescent Bioprobe for Nanoscopic Monitoring of Mitophagy. ACS Nano 2019, 13, 11593–11602. [Google Scholar] [CrossRef]
- Zhang, W.; Kwok, R.T.K.; Chen, Y.; Chen, S.; Zhao, E.; Yu, C.Y.Y.; Lam, J.W.Y.; Zheng, Q.; Tang, B.Z. Real-time monitoring of the mitophagy process by a photostable fluorescent mitochondrion-specific bioprobe with AIE characteristics. Chem. Commun. 2015, 51, 9022–9025. [Google Scholar] [CrossRef]
- Zhang, R.; Niu, G.; Li, X.; Guo, L.; Zhang, H.; Yang, R.; Chen, Y.; Yu, X.; Tang, B.Z. Reaction-free and MMP-independent fluorescent probes for long-term mitochondria visualization and tracking. Chem. Sci. 2018, 10, 1994–2000. [Google Scholar] [CrossRef]
- Zou, Z.; Yan, Q.; Ai, S.; Qi, P.; Yang, H.; Zhang, Y.; Qing, Z.; Zhang, L.; Feng, F.; Yang, R. Real-Time Visualizing Mitophagy-Specific Viscosity Dynamic by Mitochondria-Anchored Molecular Rotor. Anal. Chem. 2019, 91, 8574–8581. [Google Scholar] [CrossRef]
- Butkevich, A.N.; Lukinavičius, G.; D’este, E.; Hell, S.W. Cell-Permeant Large Stokes Shift Dyes for Transfection-Free Multicolor Nanoscopy. J. Am. Chem. Soc. 2017, 139, 12378–12381. [Google Scholar] [CrossRef] [PubMed]
- Shi, L.; Gao, X.; Yuan, W.; Xu, L.; Deng, H.; Wu, C.; Yang, J.; Jin, X.; Zhang, C.; Zhu, X. Endoplasmic Reticulum-Targeted Fluorescent Nanodot with Large Stokes Shift for Vesicular Transport Monitoring and Long-Term Bioimaging. Small 2018, 14, 1800223. [Google Scholar] [CrossRef] [PubMed]
- Araneda, J.F.; Piers, W.E.; Heyne, B.; Parvez, M.; McDonald, R. High Stokes Shift Anilido-Pyridine Boron Difluoride Dyes. Angew. Chem. Int. Ed. 2011, 50, 12214–12217. [Google Scholar] [CrossRef]
- Shcherbakova, D.M.; Hink, M.A.; Joosen, L.; Gadella, T.W.J.; Verkhusha, V.V. An Orange Fluorescent Protein with a Large Stokes Shift for Single-Excitation Multicolor FCCS and FRET Imaging. J. Am. Chem. Soc. 2012, 134, 7913–7923. [Google Scholar] [CrossRef]
- Wu, X.; Sun, X.; Guo, Z.; Tang, J.; Shen, Y.; James, T.D.; Tian, H.; Zhu, W. In Vivo and in Situ Tracking Cancer Chemotherapy by Highly Photostable NIR Fluorescent Theranostic Prodrug. J. Am. Chem. Soc. 2014, 136, 3579–3588. [Google Scholar] [CrossRef] [PubMed]
- Wu, I.-C.; Yu, J.; Ye, F.; Rong, Y.; Gallina, M.E.; Fujimoto, B.S.; Zhang, Y.; Chan, Y.-H.; Sun, W.; Zhou, X.-H.; et al. Squaraine-Based Polymer Dots with Narrow, Bright Near-Infrared Fluorescence for Biological Applications. J. Am. Chem. Soc. 2014, 137, 173–178. [Google Scholar] [CrossRef]
- Mei, J.; Leung, N.L.C.; Kwok, R.T.K.; Lam, J.W.Y.; Tang, B.Z. Aggregation-Induced Emission: Together We Shine, United We Soar! Chem. Rev. 2015, 115, 11718–11940. [Google Scholar] [CrossRef]
- Hu, R.; Leung, N.L.; Tang, B.Z. AIE macromolecules: Syntheses, structures and functionalities. Chem. Soc. Rev. 2014, 43, 4494–4562. [Google Scholar] [CrossRef]
- Luo, J.; Xie, Z.; Xie, Z.; Lam, J.W.Y.; Cheng, L.; Chen, H.; Qiu, C.; Kwok, H.S.; Zhan, X.; Liu, Y.; et al. Aggregation-Induced Emission of 1-Methyl-1,2,3,4,5-Pentaphenylsilole. Chem. Commun. 2001, 1740–1741. [Google Scholar] [CrossRef]
- Yuan, Y.; Zhang, C.-J.; Gao, M.; Zhang, R.; Tang, B.Z.; Liu, B. Specific Light-Up Bioprobe with Aggregation-Induced Emission and Activatable Photoactivity for the Targeted and Image-Guided Photodynamic Ablation of Cancer Cells. Angew. Chem. Int. Ed. 2014, 54, 1780–1786. [Google Scholar] [CrossRef]
- Kwok, R.T.K.; Leung, C.W.T.; Lam, J.W.Y.; Tang, B.Z. Biosensing by luminogens with aggregation-induced emission characteristics. Chem. Soc. Rev. 2014, 44, 4228–4238. [Google Scholar] [CrossRef] [PubMed]
- Shi, H.; Liu, J.; Geng, J.; Tang, B.Z.; Liu, B. Specific detection of integrin αvβ3 by light-up bioprobe with aggregation-induced emission characteristics. J. Am. Chem. Soc. 2012, 134, 9569–9572. [Google Scholar] [CrossRef] [PubMed]
- Leung, C.W.T.; Hong, Y.; Chen, S.; Zhao, E.; Lam, J.W.Y.; Tang, B.Z. A Photostable AIE Luminogen for Specific Mitochondrial Imaging and Tracking. J. Am. Chem. Soc. 2012, 135, 62–65. [Google Scholar] [CrossRef]
- Chen, S.; Hong, Y.; Liu, Y.; Liu, J.; Leung, C.W.T.; Li, M.; Kwok, R.T.K.; Zhao, E.; Lam, J.W.E.; Yu, Y.; et al. Full-range intracellular pH sensing by an aggregation-induced emission-active two-channel ratiometric fluorogen. J. Am. Chem. Soc. 2013, 135, 4926–4929, Corrected in J. Am. Chem. Soc. 2014, 136, 11196. [Google Scholar] [CrossRef]
- Qi, J.; Fang, Y.; Kwok, R.T.K.; Zhang, X.; Hu, X.; Lam, J.W.Y.; Ding, D.; Tang, B.Z. Highly Stable Organic Small Molecular Nanoparticles as an Advanced and Biocompatible Phototheranostic Agent of Tumor in Living Mice. ACS Nano 2017, 11, 7177–7188. [Google Scholar] [CrossRef] [PubMed]
- Zhang, C.-J.; Feng, G.; Xu, S.; Zhu, Z.; Lu, X.; Wu, J.; Liu, B. Structure-Dependent cis/trans Isomerization of Tetraphenylethene Derivatives: Consequences for Aggregation-Induced Emission. Angew. Chem. Int. Ed. 2016, 55, 6192–6196. [Google Scholar] [CrossRef]
- Yuan, Y.; Xu, S.; Cheng, X.; Cai, X.; Liu, B. Bioorthogonal Turn-On Probe Based on Aggregation-Induced Emission Characteristics for Cancer Cell Imaging and Ablation. Angew. Chem. Int. Ed. 2016, 55, 6457–6461. [Google Scholar] [CrossRef]
- Hu, F.; Xu, S.; Liu, B. Photosensitizers with Aggregation-Induced Emission: Materials and Biomedical Applications. Adv. Mater. 2018, 30, e1801350. [Google Scholar] [CrossRef]
- Feng, G.; Liu, B. Aggregation-Induced Emission (AIE) Dots: Emerging Theranostic Nanolights. Accounts Chem. Res. 2018, 51, 1404–1414. [Google Scholar] [CrossRef]
- He, X.; Xiong, L.-H.; Zhao, Z.; Wang, Z.; Luo, L.; Lam, J.W.Y.; Kwok, R.T.K.; Tang, B.Z. AIE-based theranostic systems for detection and killing of pathogens. Theranostics 2019, 9, 3223–3248. [Google Scholar] [CrossRef]
- Wang, D.; Lee, M.S.; Xu, W.; Kwok, R.T.K.; Lam, J.W.Y.; Tang, B.Z. Theranostics based on AIEgens. Theranostics 2018, 8, 4925–4956. [Google Scholar] [CrossRef] [PubMed]
- Gao, M.; Tang, B.Z. Aggregation-induced emission probes for cancer theranostics. Drug Discov. Today 2017, 22, 1288–1294. [Google Scholar] [CrossRef] [PubMed]
- Gu, X.; Kwok, R.T.; Lam, J.W.; Tang, B.Z. AIEgens for biological process monitoring and disease theranostics. Biomaterials 2017, 146, 115–135. [Google Scholar] [CrossRef]
- Li, K.; Liu, B. Polymer-encapsulated organic nanoparticles for fluorescence and photoacoustic imaging. Chem. Soc. Rev. 2014, 43, 6570–6597. [Google Scholar] [CrossRef] [PubMed]
- Chen, C.; Ni, X.; Jia, S.; Liang, Y.; Wu, X.; Kong, D.; Ding, D. Massively Evoking Immunogenic Cell Death by Focused Mitochondrial Oxidative Stress Using An AIE Luminogen with A Twisted Molecular Structure. Adv. Mater. 2019, 31, 1904914. [Google Scholar] [CrossRef] [PubMed]
- Chen, C.; Ni, X.; Tian, H.; Liu, Q.; Guo, D.; Ding, D. Calixarene-Based Supramolecular AIE Dots with Highly Inhibited Nonradiative Decay and Intersystem Crossing for Ultrasensitive Fluorescence Image-Guided Cancer Surgery. Angew. Chem. Int. Ed. 2020, 59, 10008–10012. [Google Scholar] [CrossRef]
- Ni, X.; Zhang, X.; Duan, X.; Zheng, H.-L.; Xue, X.-S.; Ding, D. Near-Infrared Afterglow Luminescent Aggregation-Induced Emission Dots with Ultrahigh Tumor-to-Liver Signal Ratio for Promoted Image-Guided Cancer Surgery. Nano Lett. 2019, 19, 318–330. [Google Scholar] [CrossRef]
- Klimpel, A.; Neundorf, I. Bifunctional peptide hybrids targeting the matrix of mitochondria. J. Control. Release 2018, 291, 147–156. [Google Scholar] [CrossRef]
- Schneider, C.A.; Rasband, W.S.; Eliceiri, K.W. NIH Image to ImageJ: 25 Years of image analysis. Nat. Methods 2012, 9, 671–675. [Google Scholar] [CrossRef]
- Manickam, R.; Tur, J.; Badole, S.L.; Chapalamadugu, K.C.; Sinha, P.; Wang, Z.; Russ, D.W.; Brotto, M.; Tipparaju, S.M. Nampt activator P7C3 ameliorates diabetes and improves skeletal muscle function modulating cell metabolism and lipid mediators. J. Cachex Sarcopenia Muscle 2022, 13, 1177–1196. [Google Scholar] [CrossRef]


Disclaimer/Publisher’s Note: The statements, opinions and data contained in all publications are solely those of the individual author(s) and contributor(s) and not of MDPI and/or the editor(s). MDPI and/or the editor(s) disclaim responsibility for any injury to people or property resulting from any ideas, methods, instructions or products referred to in the content. |
© 2023 by the authors. Licensee MDPI, Basel, Switzerland. This article is an open access article distributed under the terms and conditions of the Creative Commons Attribution (CC BY) license (https://creativecommons.org/licenses/by/4.0/).
Share and Cite
Li, X.; Zhang, T.; Diao, X.; Yu, L.; Su, Y.; Yang, J.; Shang, Z.; Liu, S.; Zhou, J.; Li, G.; et al. Mitochondria-Targeted Fluorescent Nanoparticles with Large Stokes Shift for Long-Term BioImaging. Molecules 2023, 28, 3962. https://doi.org/10.3390/molecules28093962
Li X, Zhang T, Diao X, Yu L, Su Y, Yang J, Shang Z, Liu S, Zhou J, Li G, et al. Mitochondria-Targeted Fluorescent Nanoparticles with Large Stokes Shift for Long-Term BioImaging. Molecules. 2023; 28(9):3962. https://doi.org/10.3390/molecules28093962
Chicago/Turabian StyleLi, Xiao, Tao Zhang, Xuebo Diao, Li Yu, Yue Su, Jiapei Yang, Zibo Shang, Shuai Liu, Jia Zhou, Guolin Li, and et al. 2023. "Mitochondria-Targeted Fluorescent Nanoparticles with Large Stokes Shift for Long-Term BioImaging" Molecules 28, no. 9: 3962. https://doi.org/10.3390/molecules28093962
APA StyleLi, X., Zhang, T., Diao, X., Yu, L., Su, Y., Yang, J., Shang, Z., Liu, S., Zhou, J., Li, G., & Chi, H. (2023). Mitochondria-Targeted Fluorescent Nanoparticles with Large Stokes Shift for Long-Term BioImaging. Molecules, 28(9), 3962. https://doi.org/10.3390/molecules28093962