Abstract
To study the effect of growth temperature on the nutritional components and metabolites of the wild soybean (Glycine soja), we analyzed the nutritional components and metabolic gases of the wild soybean in six accumulated temperature regions of the Heilongjiang Province, China, by gas chromatography–time-of-flight mass spectrometry (GC-TOF-MS). A total of 430 metabolites, including organic acids, organic oxides, and lipids, were identified and analyzed using multivariate statistical analysis, orthogonal partial least squares discriminant analysis, principal component analysis, and cluster analysis. Eighty-seven metabolites significantly differed in the sixth accumulated temperature region compared with the other five accumulated temperature regions. The 40 metabolites (such as threonine (Thr) and lysine (Lys)) were found to be elevated in soybeans from the sixth accumulated temperature zone compared with the other five accumulated temperature zones. Through analyzing the metabolic pathways of these metabolites, amino acid metabolism had the greatest influence on wild soybean quality. The results of the amino acid analysis were consistent with those of the GC-TOF-MS and showed that amino acids in wild soybeans from the sixth accumulated temperature zone significantly differed from those of the other zones. Threonine and lysine were the main substances driving these differences. The growth temperature affected the type and concentrations of metabolites in wild soybeans, and the GC-TOF-MS analysis of the effect of growth temperature on wild soybean metabolites was shown to be feasible.
1. Introduction
Wild soybean (Glycine soja Sieb. et Zucc.), also known as the horse seed bean or black bean, is the ancestor of the cultivated soybean Glycine max [1]. Wild soybeans have desirable properties, such as being light-loving, humidity-tolerant, shade-tolerant, drought-resistant, disease-resistant, and barren-resistant [2]. They grow especially well on saline-alkali soils with a soil pH of 9.18–9.23 and can survive winter at −41 °C [3]. With their strong salt-alkaline and cold resistance characteristics, wild soybeans have unique genetic advantages and are important germplasm resources for improving the traits of cultivated soybeans and simultaneously have ecological significance for maintaining species diversity [4]. Wild sojas are distributed across all of China except the Xinjiang, Qinghai, and Hainan Provinces [5]. As the Heilongjiang Province is located in the high latitude region of China, its climate conditions are complex and temperatures vary greatly [6]. However, the soil is fertile and pollution-free and the concentrations of trace elements are the best in the country. As a result, the quality of wild soybean resources that grow naturally in this black soil is higher.
Cultivated soybean is an important dual-use crop, which is an important source of plant protein and plant oil, and the northeast region is the main production area of cultivated soybean [7]. With the continuous improvement of people’s living standards, more attention is focused on increasing the quality of soybeans and their by-products. Product quality is reflected in the form of crop quality, which is the result of the combined action of the genetic characteristics of a variety and environmental conditions. For a specific genetic basis, the role of the environment is very important. Previous studies on the relationship between environmental factors and crop quality have focused on light, temperature, moisture, carbon dioxide, cultivation system, and other factors [8,9]. In 2017–2021, breeders have increased their efforts to develop the sixth temperate zone, which is also emerging as an important soybean-growing region; this shows that Heilongjiang has started to increase the breeding of varieties in the low accumulated temperature zone [10]. Many researchers have examined the quality of wild soybeans, majorly focusing on the characteristics of wild soybean quality indicators, the physiological mechanisms of quality formation, and the genetic characteristics of quality traits [11,12]. However, there are few reports on the differences in the metabolites of wild soybeans from different accumulative temperature zones. The Heilongjiang Province spans 14 longitudes from east to west and 10 latitudes from north to south. Its geographical position is the northernmost point in China. It has a cold climate and the shortest frost-free period. However, what are the effect of accumulated temperature in different accumulated temperature zones on the quality of wild soybean in Heilongjiang Province? The different metabolites among these soybeans need to be further studied and explored. Therefore, based on previous studies, in this experiment, wild soybeans from different accumulated temperature zones in the Heilongjiang Province were selected for metabolomics research, as the determining metabolic differences of wild soybeans originating from different areas can contribute to improving the cultivation of high-quality protein soybean varieties and cultivated soybean germplasm resources.
2. Results
2.1. The Main Nutritional Components
The nutritional contents of wild soybeans from different accumulated temperature zones are shown in Table 1. The crude protein (CP) contents increased gradually with the increase in the accumulated temperature zone except in the fourth accumulated temperature zone, which may be due to the influence of different accumulated temperatures on the CP content in the crop growth period. The amounts of crude fat (EE) content and CP content of the wild soybeans were contrasting, with the EE content decreasing as the accumulated temperature zone; this result was the same as that of cultivated soybeans. The crude fiber, crude ash (CA), and nitrogen-free extract (NFE) of the wild soybean protein were not affected by the accumulated temperature zone.

Table 1.
Analysis of nutritional components (mean ± standard deviation) of wild soybeans from different accumulated temperature zones.
2.2. The Amino Acid Composition
Table 2 summarizes the types and concentrations of amino acids in wild soybeans from different accumulated temperature zones. As shown in Table 2, the amino acid contents of the wild soybeans from each accumulated temperature zone were different. The amino acid contents of wild soybeans from the sixth accumulated temperature zone was notably higher than those from the other accumulated temperature zones. This result may be because the average temperature in the sixth accumulated temperature zone is lower and has a dark brown soil, and as wild soybeans have strong cold resistance and can thrive in black and newly accumulated soils, they are able to develop excellent characteristics in this zone. This result is consistent with the highest protein contents occurring in wild soybeans from the sixth accumulated temperature (Table 1).

Table 2.
Amino acid contents of wild soybean protein isolates.
The amino acid analysis of the wild soy protein isolates also showed that the cysteine (Cys) and methionine (Met) contents were low, which is mainly due to the loss of these two amino acids caused by acid hydrolysis in the amino acid determination. All nine essential amino acids were much higher than the recommended values from the FAO, which indicates that wild soybean protein isolates are plant proteins with rich nutritional and development value.
2.3. Gas Chromatography-Time of Flight Mass Spectrometry
Using the ChromaTOF software and using the LECO-Fiehn Rtx5 database, 430 metabolites were analyzed. The TIC stack diagram of all quality control (QC) samples are shown in Figure 1, which suggests that the peak area and retention time of the TIC of the QC samples overlap well, indicating that the results of the instrument were stable and the analysis by the instrument was reliable. The results showed that 255 metabolites were accurately identified in the sixth accumulated temperature zone, whereas 397 metabolites were annotated in the other five accumulated temperature zones. These metabolites were mainly amino acids, organic acids, organic oxides, lipids, and lipid-like molecules.
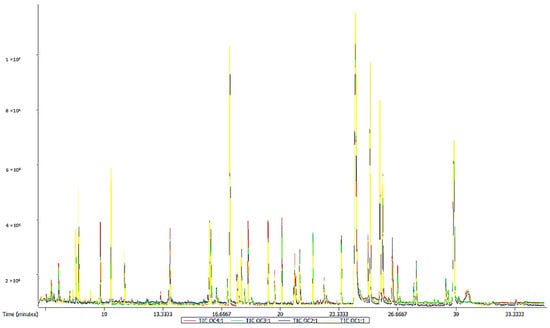
Figure 1.
TIC overlay of all quality control (QC) samples.
2.4. OPLS-DA Result
The results of the principal component analysis showed that no significant difference was present in metabolism between samples from the sixth accumulated temperature zone and those from the other accumulated temperature zones. Through OPLS-DA analysis, orthogonal variables that were not related to categorical variables in the metabolites were filtered out, and non-orthogonal and orthogonal variables could be analyzed separately, thus resulting in the highly reliable intergroup differences of the metabolites and the correlation degree information of the experimental groups. Figure 2 shows the OPLS-DA score diagram of the sixth accumulated temperature zone and the other five accumulated temperature zones. All samples were within the confidence intervals. The difference between the two groups was evident (Figure 2). No overlap was present between the samples and the separation was high. The clustering of samples from the first to fifth accumulative temperature zones was strong, which may be because wild soybeans from these different accumulative temperature zones were affected by different growth temperatures, but most of their metabolites were the same and the metabolite composition of these samples was similar, resulting in the sample points being close or clustered.
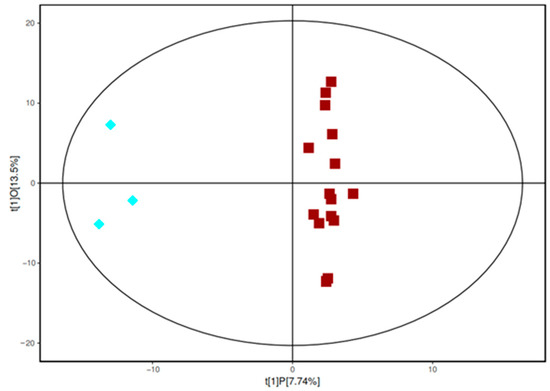
Figure 2.
The OPLS-DA model of the sixth accumulative temperature zone (blue diamonds) and the other accumulative temperature zone samples (red squares).
Figure 3 shows the permutation test results of the OPLS-DA model. Each group of models had two principal components. The cumulative values were R2X = 0.213, R2Y = 0.983, and Q2 = 0.543. Model R2Y was very close to 1, which demonstrated that the established model conformed to the real situation of the sample data. The original model can better explain the difference between the two groups of samples. Simultaneously, with the decrease in the permutation retention, the proportion of the permutation Y variable increased, whereas the Q2 of the stochastic model decreased gradually. This result showed that the original model had good robustness and no over-fitting phenomena were present.
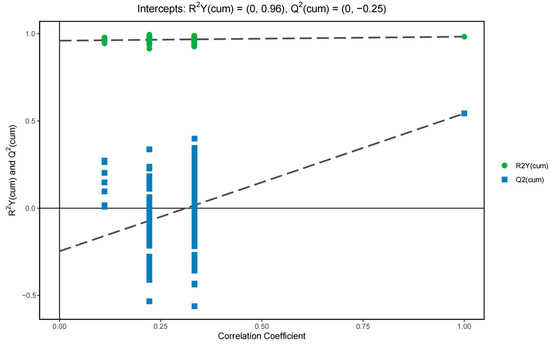
Figure 3.
Permutation test results of the OPLS-DA model of the sixth accumulative temperate zone against other accumulative temperate zones.
2.5. Mining and Identification of Differential Metabolites
Differential metabolites were identified if the variable projection importance of principal component 1 of the OPLS-DA model was greater than 1 and the p value of the t test was ≤0.05. As shown in Table 3, 87 differential metabolites were screened out after comparing the sixth accumulated temperature zone with the other five accumulated temperature zones, which mainly included amino acids, sugars, fatty acids, organic acids, polyols, and other secondary metabolites. Amino acids were the main factors affecting differences in the nutritional composition of wild soybeans from different zones. Among the 87 differential metabolites, 40 metabolites (such as threonine (Thr) and lysine (Lys)) were found to be elevated in soybeans from the sixth accumulated temperature zone compared with the other five accumulated temperature zones. The results showed that wild soybeans from the sixth accumulative temperature zone differed greatly in their amino acid composition and content compared with wild soybeans from the other five accumulative temperature zones. The concentrations of the other 47 metabolites in wild soybeans from the sixth accumulated temperature zone were lower than those in the other five accumulated temperature zones. Additionally, the contents of the differential metabolites varied greatly between different samples, which shows that the metabolism of the wild soybean was highly variable. The metabolites were significantly affected by growth temperature, indicating that the wild soybean metabolites carried information specific to their accumulated temperature zone and that the differential metabolites can be used as the basis for distinguishing between accumulated temperature zones.

Table 3.
Different metabolites of wild soybeans from the sixth accumulative temperature zone compared with wild soybeans from the other five accumulative temperature zones.
2.6. Cluster Analysis of the Differential Metabolites
Figure 4 shows the hierarchical cluster thermogram of the total metabolites in the six accumulated temperature zones. The highly expressed substances were amino acids, such as alanine, aspartic acid, and glycine, which is consistent with the results in Table 3. The left side of the figure represents the sixth accumulated temperature zone and the right side represents the other five accumulated temperature zones. The sixth accumulated temperature zone was a single sample with a significant clustering effect, whereas the other five accumulated temperature zones, as a whole, displayed no significant clustering effect, which demonstrates that the metabolites of wild soybeans from different accumulated temperature zones contain information about their accumulated temperature zone. Furthermore, distinguishing the accumulated temperature zones of wild soybeans is feasible using their metabolite differences.
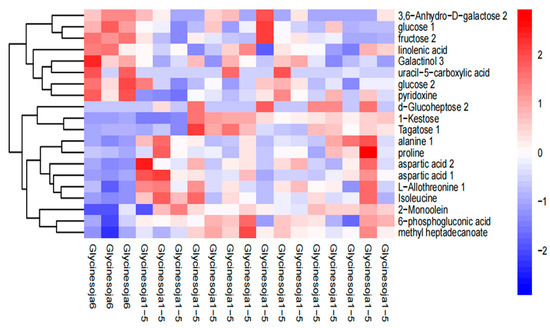
Figure 4.
Hierarchical cluster heatmap of the metabolites.
2.7. Metabolite Pathway
The MetPA database was used to analyze the metabolic pathways of the differential metabolites between groups under the conditions of p value = 1 after false positive correction. Through metabolic pathway concentration and topological analysis, the metabolic pathways that may be biodisturbed were identified. Figure 5 shows the metabolic pathway influencing factor map. Each point represents a total of 20 points in a metabolic pathway map. These 20 metabolic pathways can be found in the KEGG database, which includes 10 amino acid metabolic pathways. Both synthetic pathways and decomposition pathways are numbered 1–10 in Table 4. A total of 49 differential metabolites involved in these metabolic pathways are shown in Table 5.
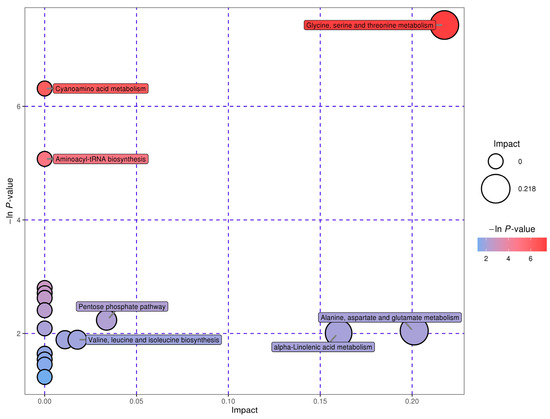
Figure 5.
Factors affecting metabolic pathways.

Table 4.
List of factors affecting metabolic pathways.

Table 5.
Details of the differential metabolites and metabolic pathways.
Table 5 shows that these substances are the hubs connecting each pathway at the nodes of the metabolic pathway network. Amino acid metabolic pathways comprise half of all the retrieved metabolic pathways.
3. Discussion
The average temperature is the main climatic factor affecting the phenological period of most soybeans [13]. The differences between the accumulated zones led to different qualities of wild soybean. This study confirmed that there are significant differences in metabolites of the same variety of wild soybean growing in different accumulated zones. The analysis results showed that among the 87 different metabolites identified in this study, 40 metabolites, such as Thr and Lys, were higher in soybeans from the sixth accumulated temperature zone than in the other five accumulated temperature zones. Threonine and Lys are essential amino acids for the human body. Therefore, the amino acid composition and the contents of wild soybeans in the sixth accumulated temperature zone are different from those in the other five accumulated temperature zones.
Amino acids are the basic components of proteins, and these substances are at the nodes of metabolic pathways and are the hubs connecting these pathways. Half of all the metabolic pathways identified in this study involved amino acids. The nutritional value of wild soybeans is mainly reflected in their amino acid contents, and wild soybeans are rich in nine essential amino acids required by the human body: leucine (Leu), phenylalanine (Phe), valine (Val), Thr, isoleucine, tyrosine, Lys, cysteine (Cys), and methionine (Met), which are much higher than the recommended values from the FAO. Among these, Leu had the highest concentration. Leucine can enhance immunity, activate human cells, and resist harmful bacteria and microorganisms. Isoleucine, Leu, Thr, Phe, Lys, Val, and Met are essential amino acids that are also important contributors to the nutritional value of wild soybeans.
It was found that amino acid was the main metabolic pathway of wild soybean in different accumulated temperate zones in Heilongjiang Province. Lin H et al. also identified 169 differential metabolites from soybeans, which were mainly involved in key pathways, such as amino acid biosynthesis and catabolism, lipid oxidation, and secondary metabolite accumulation [14]; amino acid was the main pathway; and environmental factors had a great impact on the metabolism of wild soybean. Some studies have found that amino acid metabolites, such as proline, is also able to act as osmotic factors in plants to improve survival when exposed to stressors including drought and salt stress [15,16]. The differences of temperature, environment, and other factors in different accumulated temperate zones in Heilongjiang Province lead to significant differences in their metabolites. In addition, amino acid metabolism and lipid metabolism were reported to play key roles in the drought resistance of different soybean varieties [17]. In summary, the metabolites of different accumulated temperate zones in Heilongjiang Province mainly concentrated on amino acids. Amino acids are not only important nutritionally but are also regulatory factors involved in adapting to local environmental conditions.
4. Materials and Methods
4.1. Materials and Chemicals
For this study, wild soybeans were collected in 2019 from the first accumulated temperature zone (Daqing city), the second accumulated temperature zone (Jiamusi city), the third accumulated temperature zone (Muling city), the fourth accumulated temperature zone (Yichun city), the fifth accumulated temperature zone (Heihe city), and the sixth accumulated temperature zone (Greater Higgnan Mountains.). These six accumulated temperature zones are beneficial to northeast China and were identified by Professor Mu Liqiang of the Northeast Forestry University. The plants with good growth and similar height were selected, and some mature seeds of good appearance and with no infections, diseases, or pests were cut and stored in air-permeable bags. Three samples were collected from each accumulated temperature zone, totaling 18 samples.
Chromatographic grade methanol was purchased from the CNW Technology Company of Germany (Germany). 3-Benzoylpyridine(Adamas) was purchased from Sigma-Aldrich Co. (Shanghai, China). Methoxyamine salt was purchased from Zhejiang Huafang Pharmaceutical Co., Ltd. (Tai Zhou, China). Ribonitol was purchased from Sigma-Aldrich Co. (Shanghai, China). BSTFA was purchased from Regis Technologies, Inc. (Wilmington, DE, USA). Saturated fatty acid methyl esters were purchased from Dr. Ehrenstorfer (Augsburg, Germany). Pure water was purchased from Watsons of China (Harbin, China).
4.2. A Breakdown of the Division of the Heilongjiang Temperate Zone
A breakdown of the division of the Heilongjiang temperate zone are shown in Table 6 [18].

Table 6.
A breakdown of the division of the Heilongjiang temperate zone.
4.3. Determination of Basic Nutrients
Rules for agricultural seed testing: the determination of moisture content (GB/T 3543.6-1995); the determination of protein in foods (GB/T 5009.5-2016); the determination of fat in foods (GB/T 5009.6-2016); the determination of crude fiber in plant foods (GB/T 5009.10-2003); and the determination of ash in food (GB 5009.4-2016).
Determination of dry matter [19]:
Dry matter (%) = 100-Moisture%
Method for calculation of nitrogen-free extract [19]:
Nitrogen free extract (%) = Dry matter% − (Crude protein% + Crude fat% + Crude fiber% + Crude ash%)
4.4. Analysis of Amino Acid Composition of Wild Soybean Protein Isolates
The amino acid determination method was as follows: a certain mass of the protein sample was added to 6 mol/L of hydrochloric acid, hydrolyzed at 110 °C for 24 h, then filtered and evaporated. The residue was dissolved in citric acid buffer solution with a pH 2.2, and Hitachi HITACHI835 -50 automatic amino acid analyzer was used for analysis.
4.5. Metabolite Extraction
The collected wild soybean samples with pods were air dried until the seeds cracked, after which the seeds were threshed naturally. After preliminary hulling, wild soybeans with full grains and no pests were selected and stored at −80 °C.
Derivation processing: 20 ± 1 mg of the sample was placed in a 2 mL EP tube, then 500 μL of pre-cooled extraction solution (methanol: chloroform volume ratio = 3:1) was added. Next, 10 μL of ribitol was added and was vortexed for 30 s. Porcelain beads were added and the samples was processed in a 45 Hz grinder for 4 min and the ultrasonic for 5 min (in an ice water bath). The samples were centrifuged at 4 °C and 12,000 rpm for 15 min. Subsequently, 100 μL of the supernatant was carefully pipetted into a 1.5 mL EP tube, while 40 μL of each sample was mixed to form a QC sample. The metabolites was dried in a vacuum concentrator. After evaporation in a vacuum concentrator, 50 μL of methoxyamination hydrochloride (20 mg/mL in pyridine) was added and then incubated at 80 °C for 30 min, then derivatized by 70 μL of BSTFA regent (1% TMCS, v/v) at 70 °C for 1.5 h. Gradually cooling samples to room temperature, 5 μL of FAMEs (in chloroform) was added to the QC sample. All samples were then analyzed by gas chromatograph coupled with a time-of-flight mass spectrometer (GC-TOF-MS) [20].
4.6. Computer Detection
Agilent 7890 gas chromatography-time-of-flight mass spectrometry (GC-TOF-MS) was equipped with an Agilent DB-5MS capillary column (30 m × 250 μm × 0.25 μm, J & W Scientific, Folsom, CA, USA). The GC-TOF-MS specific analysis conditions are provided in Table 7.

Table 7.
Instrument parameters.
4.7. Statistical Analysis
Raw data analysis, including peak extraction, baseline adjustment, deconvolution, alignment, and integration [21], was finished with Chroma TOF (V 4.3x, LECO) software and LECO-Fiehn Rtx5 database was used for metabolite identification by matching the mass spectrum and retention index. Finally, the peaks detected in less than half of QC samples or RSD > 30% in QC samples was removed [22].
5. Conclusions
Based on GC-TOF-MS and other techniques, the nutritional components and metabolomics of wild soybeans from different accumulated temperature areas in the Heilongjiang Province were analyzed. The results showed that the different metabolites of wild soybean were present in the samples from different accumulative temperature zone in Heilongjiang. Wild soybean metabolite results revealed that 430 metabolites were identified and 87 differential metabolites were observed in the sixth accumulative temperature zone, while 40 metabolites (such as threonine (Thr) and lysine (Lys)) were found to be elevated in soybeans from the sixth accumulated temperature zone compared with the other five accumulated temperature zones. The results of different metabolite hierarchical clustering showed that the metabolites of different accumulative temperature zones were mainly expressed in amino acids, including alanine, aspartic acid, and glycine. Additionally, the signaling pathways of the differential metabolites also confirmed that their metabolic differentials were dominated by amino acid metabolisms, as they included 10 amino acid metabolic pathways (amino acid synthesis and catabolic pathways).
Author Contributions
G.B. was mainly responsible for the overall conception of the article and also undertook the work of data analysis and writing, L.M. guided and supervised the experimental design and article writing, Y.W. was responsible for the collection of different varieties of beans and the proofreading and improvement of the manuscript. All authors have read and agreed to the published version of the manuscript.
Funding
This study was financially supported by the Science and Technology Basic Resources Investigation Program of China (No. 2019FY100505), this work was supported by the National Key R&D Plan Project (No. 2020YFD1001400) and the Talent Cultivation Program of Heilongjiang Bayi Agricultural University (No. ZRCPY201819).
Institutional Review Board Statement
Not applicable.
Informed Consent Statement
Not applicable.
Data Availability Statement
Not applicable.
Conflicts of Interest
The authors declare no conflict of interest.
Sample Availability Statement
Samples of the compounds are not available from the authors.
References
- Wang, Y.H.; Zhang, X.J.; Fan, S.J. Genetic diversity of wild soybean populations in Dongying, China, by simple sequence repeat analysis. Genet. Mol. Res. 2015, 14, 11613–11623. [Google Scholar] [CrossRef] [PubMed]
- Du, H.; Qin, R.; Li, H.; Du, Q.; Li, X.; Yang, H.; Kong, F.; Liu, B.; Yu, D.; Wang, H. Genome-wide association studies reveal novel loci for herbivore resistance in wild soybean (Glycine soja). Int. J. Mol. Sci. 2022, 14, 8016. [Google Scholar] [CrossRef] [PubMed]
- Xu, J.; Wang, X.; Fan, J. Salt stress induces physiological and photosynthetic changes in glycine max. Plant Sci. J. 2022, 40, 829–838. [Google Scholar]
- Guo, J.; Liu, Y.; Wang, Y. Population structure of the wild soybean (Glycine soja) in China: Implications from microsatellite analyses. Ann. Bot. 2012, 110, 777–785. [Google Scholar] [CrossRef] [PubMed]
- Chen, L.; Yue, L. A review on the utilization of wild soybean resources. Exp. Study 2022, 11, 15–18. [Google Scholar]
- Yang, F.; Tian, B.; Chen, J. Impact of climate change on rice production in Heilongjiang and countermeasures. Agric. Meteorol. 2016, 33, 148. [Google Scholar]
- Zhao, S.; Xu, X.; Wei, D.; Lin, X.; Qiu, S.; Ciampitti, I.; He, P. Soybean yield, nutrient uptake and stoichiometry under different climate regions of northeast China. Sci. Rep. 2020, 10, 8431. [Google Scholar] [CrossRef]
- Zhang, Q.; Hong, J.; Zhang, T.; Tian, X.; Geng, Y.; Chen, W.; Zhai, Y.; Liu, W.; Shen, X.; Bai, Y. Environmental footprints of soybean production in China. Environ. Dev. Sustain. 2022, 22, 1–19. [Google Scholar]
- Wang, X.; Komatsu, S. Improvement of soybean products through the response mechanism analysis using proteomic technique. Adv. Food Nutr. Res. 2017, 82, 117–148. [Google Scholar]
- Xu, J.; Guo, T.; Wang, Z. Analysis on quality breeding of common soybean varieties approved by Heilongjiang. Seed Ind. China 2022, 8, 11–16. [Google Scholar]
- Liu, Y.; Du, H.; Li, P. Pan-genome of wild and cultivated soybeans. Cell 2020, 182, 162–176. [Google Scholar] [CrossRef] [PubMed]
- Lam, H.M.; Xu, X.; Liu, X. Resequencing of 31 wild and cultivated soybean genomes identifies patterns of genetic diversity and selection. Nat. Genet. 2010, 42, 1053–1059. [Google Scholar] [CrossRef] [PubMed]
- Ainsworth, E.A.; Yendrek, C.R.; Skoneczka, J.A.; Long, S.P. Accelerating yield potential in soybean: Potential targets for biotechnological improvement. Plant Cell Environ. 2012, 35, 38–52. [Google Scholar] [CrossRef] [PubMed]
- Lin, H.; Rao, J.; Shi, J.; Hu, C.; Cheng, F.; Wilson, Z.A.; Zhang, D.; Quan, S. Seed metabolomic study reveals significant metabolite variations and correlations among different soybean cultivars. J. Integr. Plant Biol. 2014, 56, 826–836. [Google Scholar] [CrossRef] [PubMed]
- Kaplan, F.; Kopka, J.; Sung, D.Y. Transcript and metabolite profiling during cold acclimation of Arabidopsis reveals an intricate relationship of cold-regulated gene expression with modifications in metabolite content. Plant J. 2007, 50, 967–981. [Google Scholar] [CrossRef] [PubMed]
- Jin, Z.; Ding, M.; Tian, C. Determination of nutritional components in Flammulina velutipes. Anal. Test. 2018, 21, 127–131. [Google Scholar]
- Lugan, R.; Niogret, M.F.; Leport, L. Metabolome and water homeostasis analysis of Thellungiella salsuginea suggests that dehydration tolerance is a key response to osmotic stress in this halophyte. Plant J. 2010, 64, 215–229. [Google Scholar] [CrossRef]
- Cao, M.; Li, Q.; Zhang, L. Spatio-temporal variation of accumulated temperature in Heilongjiang and reclassification of accumulated temperature zone. Chin. J. Agrometeorol. 2014, 35, 492–496. [Google Scholar]
- Wang, X.; Li, Y.; Wang, X.; Li, X.; Dong, S. Physiology and metabonomics reveal differences in drought resistance among soybean varieties. Bot. Stud. 2022, 63, 8. [Google Scholar] [CrossRef]
- Gu, E.J.; Kim, D.W.; Jang, G.J.; Song, S.H.; Lee, J.I.; Lee, S.B.; Kim, B.M.; Cho, Y.; Lee, H.J.; Kim, H.J. Mass-based metabolomic analysis of soybean sprouts during germination. Food Chem. 2017, 217, 311–319. [Google Scholar] [CrossRef]
- Kind, T.; Wohlgemuth, G.; Lee, D.Y. FiehnLib: Mass spectral and retention index libraries for metabolomics based on quadrupole and time-of-flight gas chromatography/mass spectrometry. Anal. Chem. 2009, 81, 10038–10048. [Google Scholar] [CrossRef] [PubMed]
- Dunn, W.B.; Broadhurst, D.; Begley, P. Procedures for large-scale metabolic profiling of serum and plasma using gas chromatography and liquid chromatography coupled to mass spectrometry. Nat. Protoc. 2011, 6, 1060–1083. [Google Scholar] [CrossRef] [PubMed]
Disclaimer/Publisher’s Note: The statements, opinions and data contained in all publications are solely those of the individual author(s) and contributor(s) and not of MDPI and/or the editor(s). MDPI and/or the editor(s) disclaim responsibility for any injury to people or property resulting from any ideas, methods, instructions or products referred to in the content. |
© 2023 by the authors. Licensee MDPI, Basel, Switzerland. This article is an open access article distributed under the terms and conditions of the Creative Commons Attribution (CC BY) license (https://creativecommons.org/licenses/by/4.0/).