
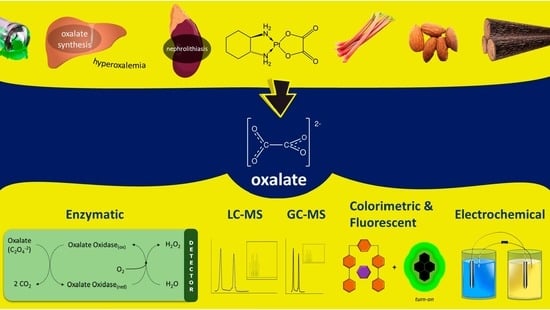
Analytical Methods for Oxalate Quantification: The Ubiquitous Organic Anion


Abstract
1. Introduction
1.1. Oxalate in Clinical Science
1.2. Inflammation/Immunology
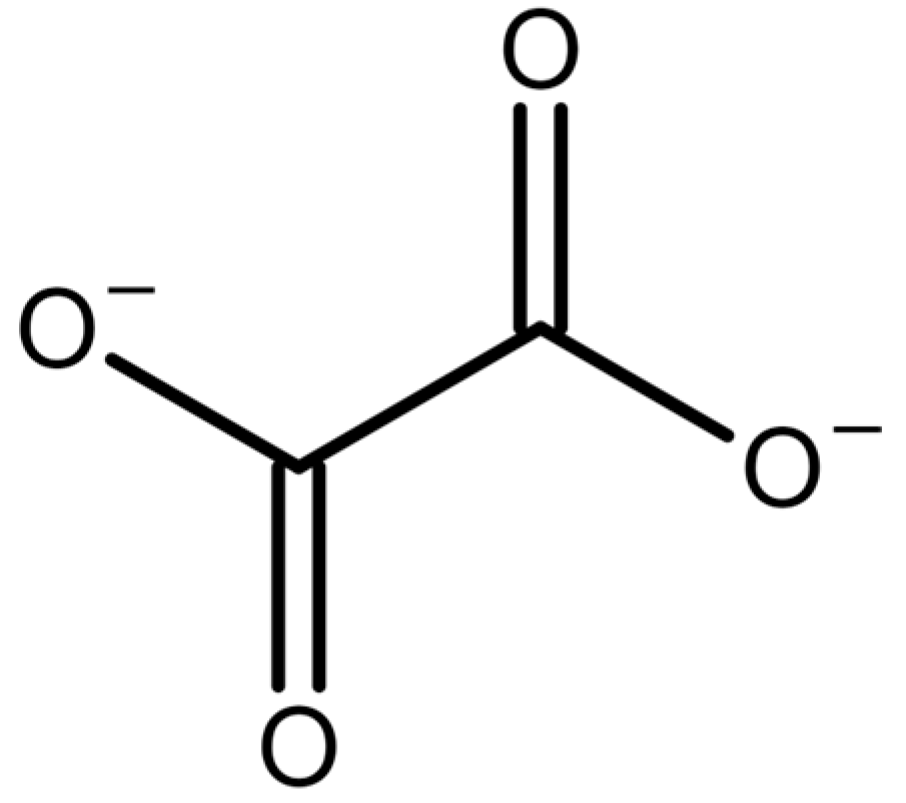
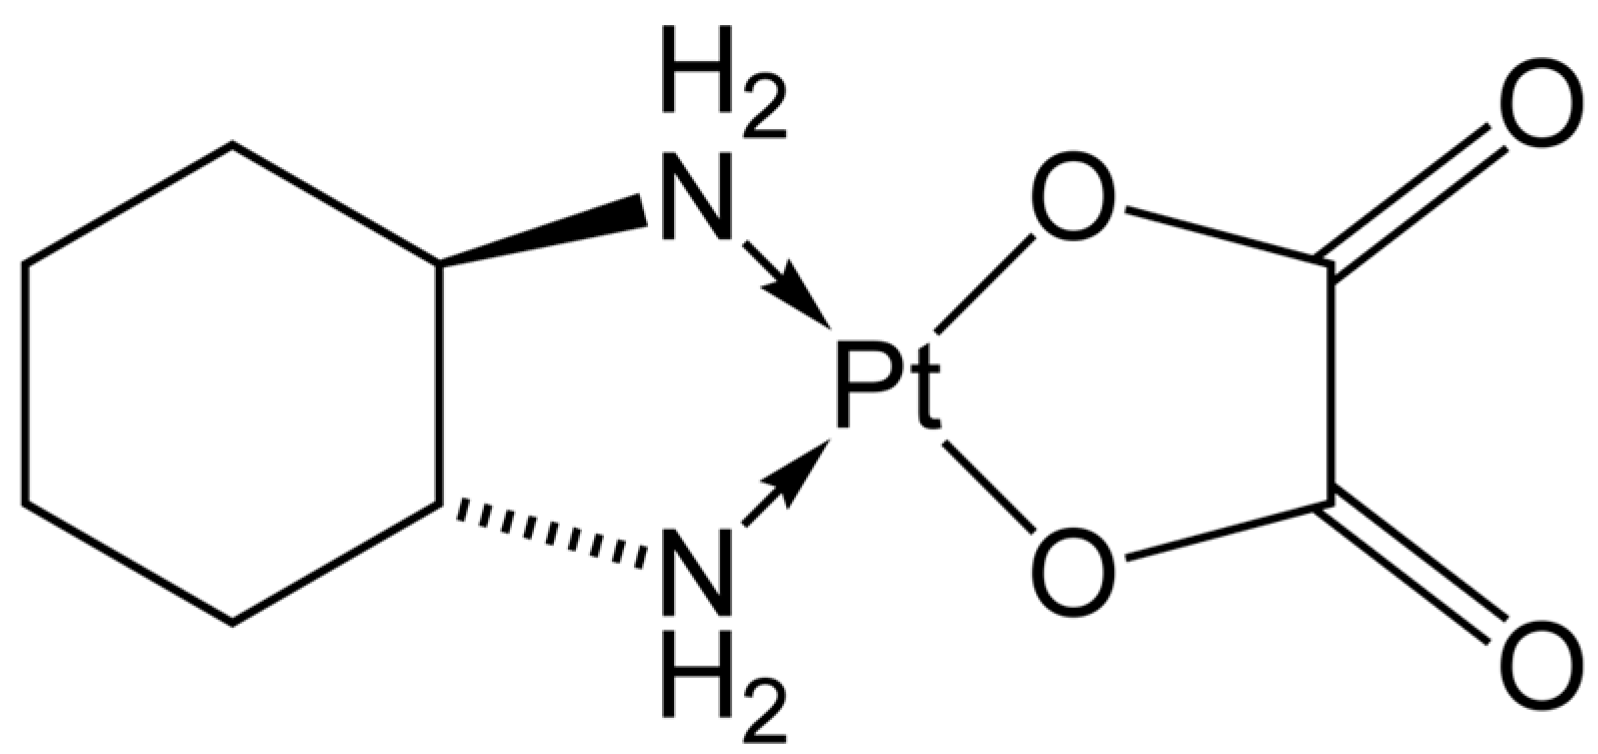
1.3. Drugs and Nutrients Containing Oxalate or Metabolized to Oxalate (Oxaliplatin, Vitamin C)
1.4. Oxalate in Food Science
1.5. Relevance of Oxalate in Plants/Fungi
1.6. Oxalate in Industrial Processes
1.7. Need for a Review on the Current State of Analytical Methods for Oxalate/Oxalic Acid
2. Methods for Detection and Quantification of Oxalate
2.1. Enzyme-Based Methods
2.2. Liquid Chromatography–Mass Spectrometry-Based Methods
2.3. Gas-Chromatography-Based Methods
2.4. Electrochemical Non-Enzymatic Methods
2.5. Indicator-Displacement-Based UV, Colorimetric, and Fluorescence Methods
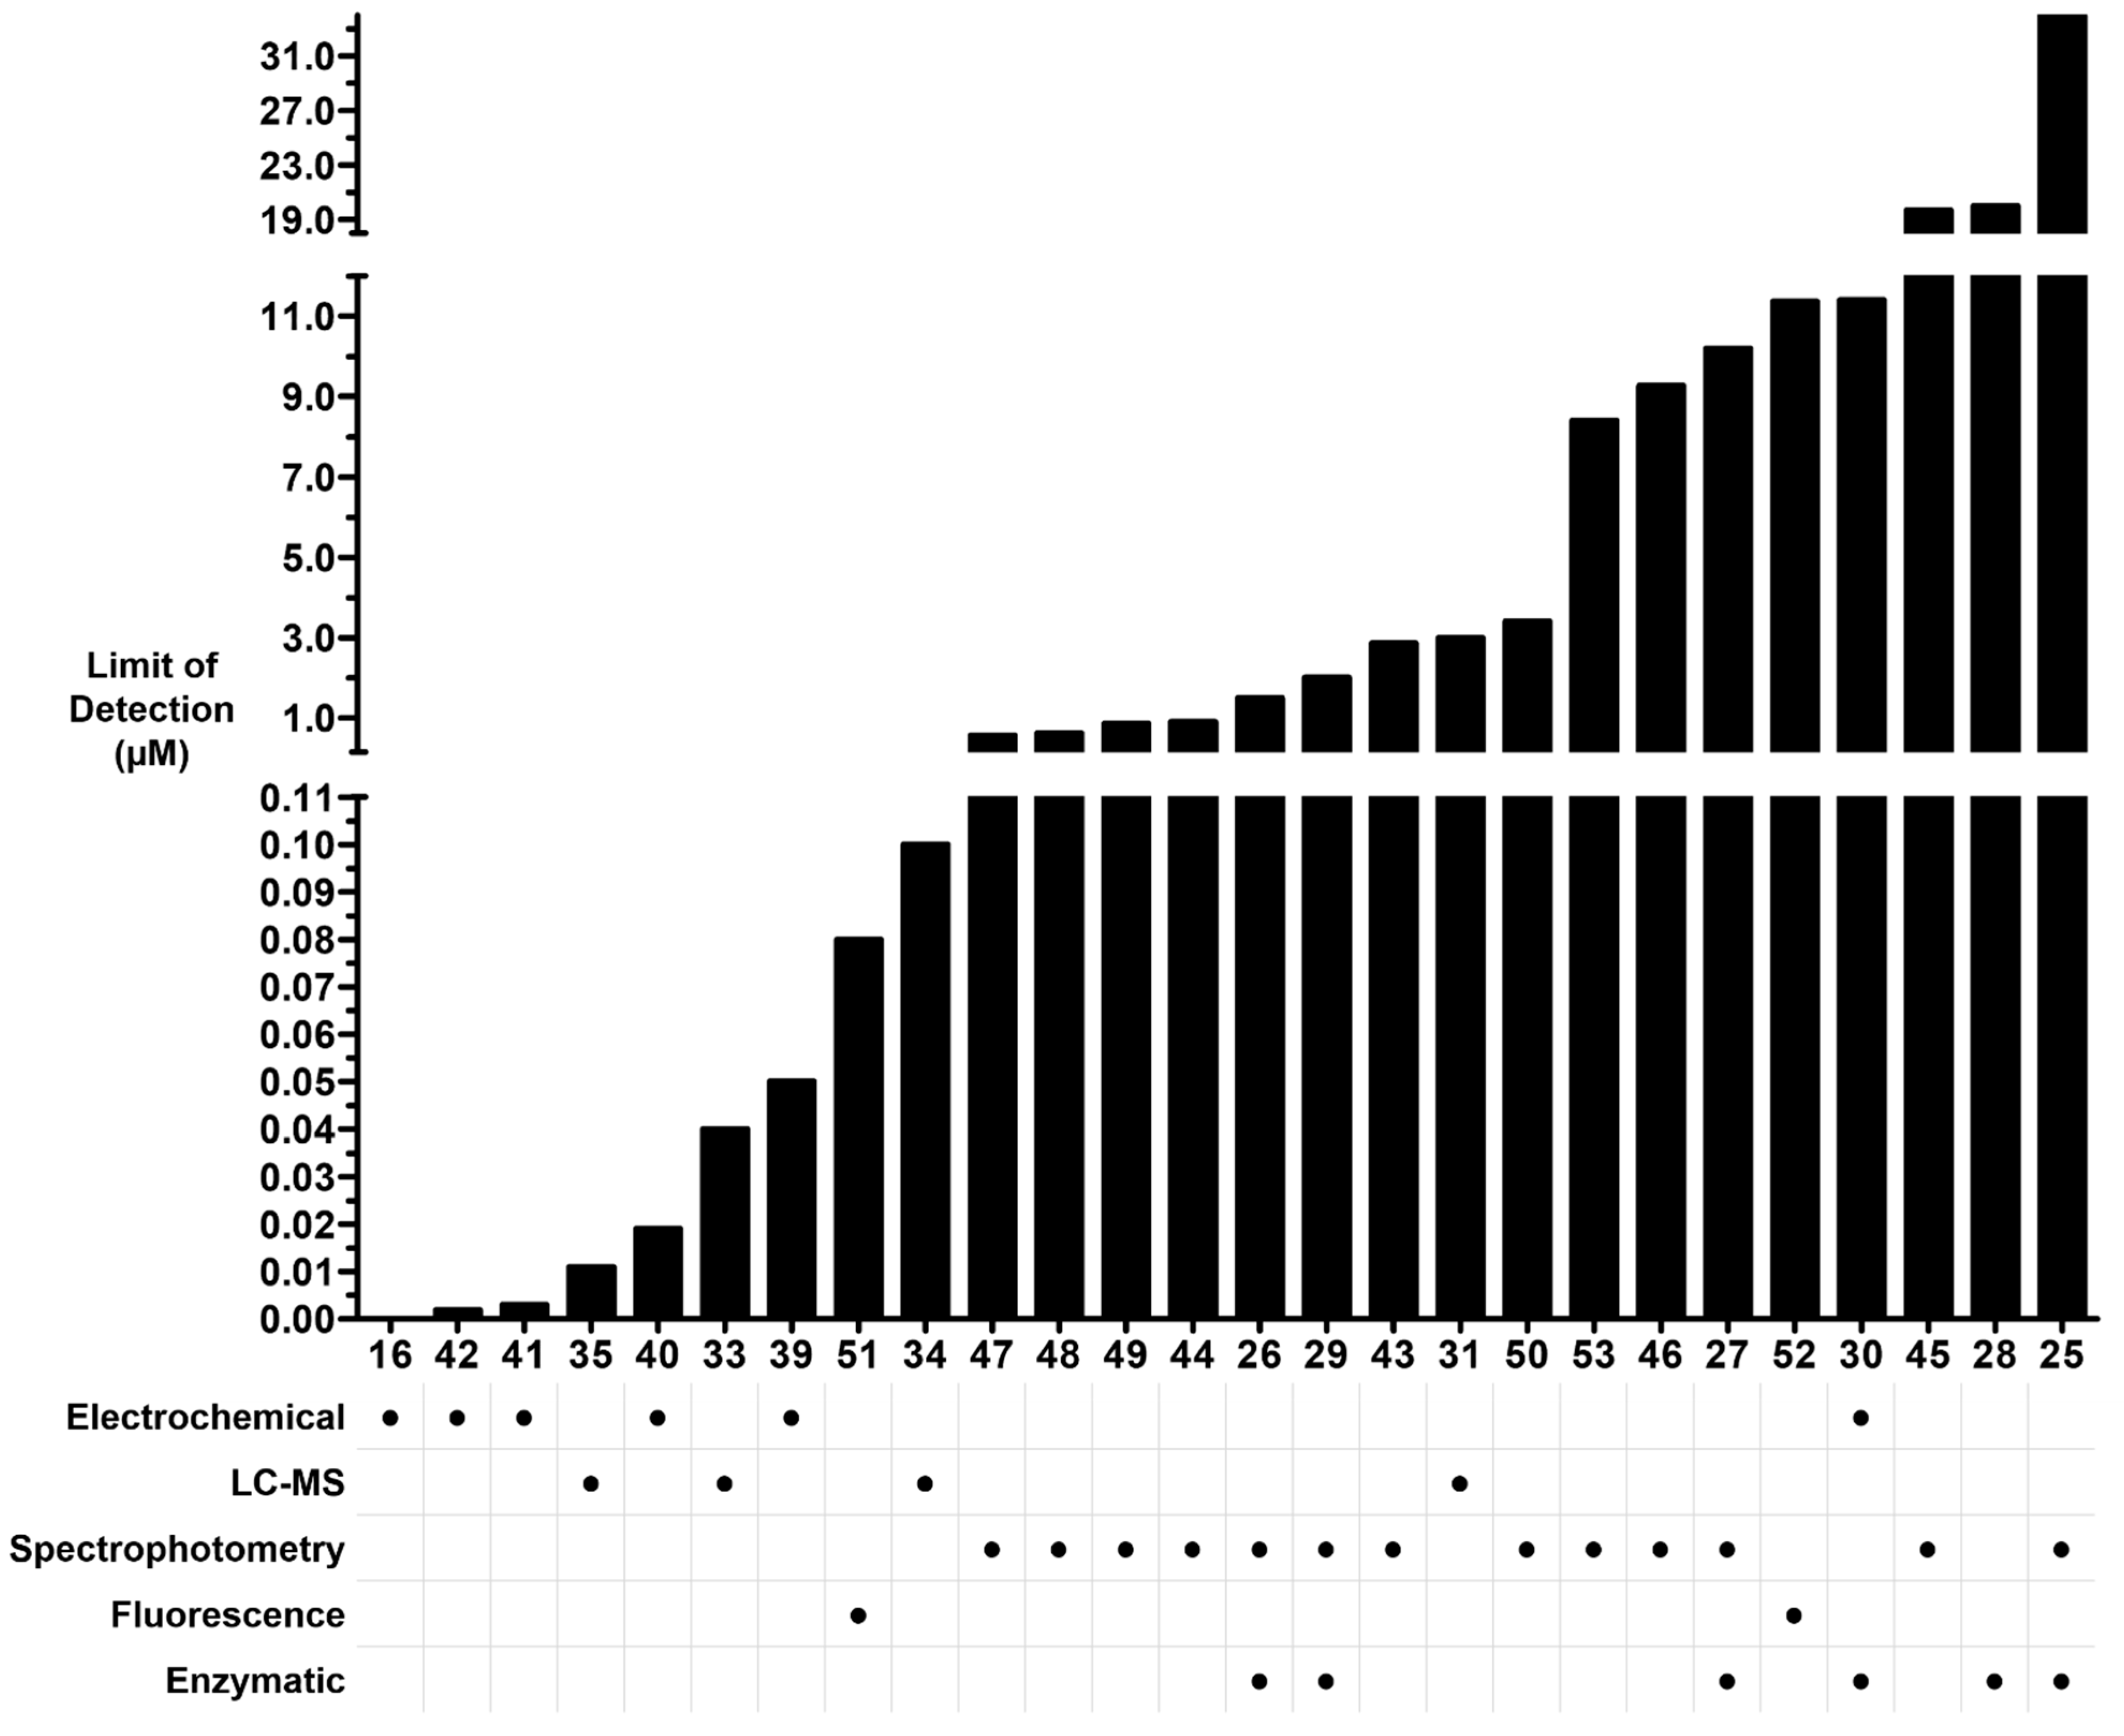
2.6. Summary of Analytical Methods for Quantifying Oxalate
3. Conclusions and Future Perspective
Author Contributions
Funding
Data Availability Statement
Conflicts of Interest
References
- Khan, S.R.; Canales, B.K.; Dominguez-Gutierrez, P.R. Randall’s plaque and calcium oxalate stone formation: Role for immunity and inflammation. Nat. Rev. Nephrol. 2021, 17, 417–433. [Google Scholar] [CrossRef]
- Kumar, P.; Patel, M.; Oster, R.A.; Yarlagadda, V.; Ambrosetti, A.; Assimos, D.G.; Mitchell, T. Dietary Oxalate Loading Impacts Monocyte Metabolism and Inflammatory Signaling in Humans. Front. Immunol. 2021, 12, 617508. [Google Scholar] [CrossRef] [PubMed]
- Centers for Disease Control and Prevention. National Diabetes Statistics Report Website. Available online: https://www.cdc.gov/diabetes/data/statistics-report/index.html (accessed on 3 April 2023).
- Huang, Y.; Zhang, Y.H.; Chi, Z.P.; Huang, R.; Huang, H.; Liu, G.; Zhang, Y.; Yang, H.; Lin, J.; Yang, T.; et al. The Handling of Oxalate in the Body and the Origin of Oxalate in Calcium Oxalate Stones. Urol. Int. 2020, 104, 167–176. [Google Scholar] [CrossRef] [PubMed]
- Kiela, P.R.; Ghishan, F.K. Physiology of Intestinal Absorption and Secretion. Best Pract. Res. Clin. Gastroenterol. 2016, 30, 145–159. [Google Scholar] [CrossRef]
- Sakhaee, K. Recent advances in the pathophysiology of nephrolithiasis. Kidney Int. 2009, 75, 585–595. [Google Scholar] [CrossRef]
- Small, K.W.; Letson, R.; Scheinman, J. Ocular findings in primary hyperoxaluria. Arch. Ophthalmol. 1990, 108, 89–93. [Google Scholar] [CrossRef] [PubMed]
- Wang, J.; Wang, W.; Wang, H.; Tuo, B. Physiological and Pathological Functions of SLC26A6. Front. Med. 2021, 7, 618256. [Google Scholar] [CrossRef] [PubMed]
- Lieske, J.C.; Mehta, R.A.; Milliner, D.S.; Rule, A.D.; Bergstralh, E.J.; Sarr, M.G. Kidney stones are common after bariatric surgery. Kidney Int. 2015, 87, 839–845. [Google Scholar] [CrossRef] [PubMed]
- Hatch, M.; Freel, R.W. Angiotensin II involvement in adaptive enteric oxalate excretion in rats with chronic renal failure induced by hyperoxaluria. Urol. Res. 2003, 31, 426–432. [Google Scholar] [CrossRef]
- Kim, W. Effect of Oxaliplatin on Voltage-Gated Sodium Channels in Peripheral Neuropathic Pain. Processes 2020, 8, 680. [Google Scholar] [CrossRef]
- Grolleau, F.; Gamelin, L.; Boisdron-Celle, M.; Lapied, B.; Pelhate, M.; Gamelin, E. A Possible Explanation for a Neurotoxic Effect of the Anticancer Agent Oxaliplatin on Neuronal Voltage-Gated Sodium Channels. J. Neurophysiol. 2001, 85, 2293–2297. [Google Scholar] [CrossRef]
- Office of Dietary Supplements. Vitamin C. Available online: https://ods.od.nih.gov/factsheets/VitaminC-HealthProfessional/ (accessed on 26 April 2022).
- Knight, J.; Madduma-Liyanage, K.; Mobley, J.A.; Assimos, D.G.; Holmes, R.P. Ascorbic acid intake and oxalate synthesis. Urolithiasis 2016, 44, 289–297. [Google Scholar] [CrossRef] [PubMed]
- Thomas, L.D.K.; Elinder, C.-G.; Tiselius, H.-G.; Wolk, A.; Akesson, A. Ascorbic acid supplements and kidney stone incidence among men: A prospective study. JAMA Intern. Med. 2013, 173, 386–388. [Google Scholar] [CrossRef]
- Holmes, R.P.; Kennedy, M. Estimation of the oxalate content of foods and daily oxalate intake. Kidney Int. 2000, 57, 1662–1667. [Google Scholar] [CrossRef] [PubMed]
- Franceschi, V.R.; Nakata, P.A. Calcium Oxalate in Plants: Formation and Function*. Annu. Rev. Plant Biol. 2005, 56, 41–71. [Google Scholar] [CrossRef] [PubMed]
- King, A.G. Research Advances: Floating Metals; Oxalate Fights Phytotoxin; A Taste of Success in the Search for an Electronic Tongue. J. Chem. Educ. 2006, 83, 1578. [Google Scholar] [CrossRef]
- Dutton, M.V.; Evans, C.S. Oxalate production by fungi: Its role in pathogenicity and ecology in the soil environment. Can. J. Microbiol. 1996, 42, 881–895. [Google Scholar] [CrossRef]
- Sheta, H.M.; Al-Najami, I.; Christensen, H.D.; Madsen, J.S. Rapid Diagnosis of Ethylene Glycol Poisoning by Urine Microscopy. Am. J. Case Rep. 2018, 19, 689–693. [Google Scholar] [CrossRef]
- Oxalic Acid: The Magic of Bar Keepers Friend-Bar Keepers Friend n.d. Available online: https://www.barkeepersfriend.com/oxalic-acid-magic-of-bkf/ (accessed on 26 April 2022).
- Weerasinghe Mohottige, T.N.; Kaksonen, A.H.; Cheng, K.Y.; Sarukkalige, R.; Ginige, M.P. Kinetics of oxalate degradation in aerated packed-bed biofilm reactors under nitrogen supplemented and deficient conditions. J. Clean. Prod. 2019, 211, 270–280. [Google Scholar] [CrossRef]
- Cassland, P.; Sjöde, A.; Winestrand, S.; Jönsson, L.J.; Nilvebrant, N.-O. Evaluation of Oxalate Decarboxylase and Oxalate Oxidase for Industrial Applications. Appl. Biochem. Biotechnol. 2010, 161, 255–263. [Google Scholar] [CrossRef]
- de Castro, M.D. Determination of oxalic acid in urine: A review. J. Pharm. Biomed. Anal. 1988, 6, 1–13. [Google Scholar] [CrossRef] [PubMed]
- Hansen, E.H.; Winther, S.K.; Gundstrup, M. Enzymatic Assay of Oxalate in Urine by Flow Injection Analysis Using Immobilized Oxalate Oxidase and Chemiluminescence Detection. Anal. Lett. 1994, 27, 1239–1253. [Google Scholar] [CrossRef]
- Hönow, R.; Bongartz, D.; Hesse, A. An improved HPLC-enzyme-reactor method for the determination of oxalic acid in complex matrices. Clin. Chim. Acta 1997, 261, 131–139. [Google Scholar] [CrossRef]
- Goyal, L.; Thakur, M.; Pundir, C.S. Quantification of Urinary Oxalate with Alkylamine Glass Bound Amaranthus Leaf Oxalate Oxidase. Anal. Lett. 1999, 32, 633–647. [Google Scholar] [CrossRef]
- Hong, F.; Nilvebrant, N.-O.; Jönsson, L.J. Rapid and convenient determination of oxalic acid employing a novel oxalate biosensor based on oxalate oxidase and SIRE technology. Biosens. Bioelectron. 2003, 18, 1173–1181. [Google Scholar] [CrossRef]
- Zuo, G.; Jiang, X.; Liu, H.; Zhang, J. A novel urinary oxalate determination method via a catalase model compound with oxalate oxidase. Anal. Methods 2010, 2, 254–258. [Google Scholar] [CrossRef]
- Rodriguez, J.A.; Hernandez, P.; Salazar, V.; Castrillejo, Y.; Barrado, E. Amperometric Biosensor for Oxalate Determination in Urine Using Sequential Injection Analysis. Molecules 2012, 17, 8859–8871. [Google Scholar] [CrossRef]
- Keevil, B.G.; Thornton, S. Quantification of Urinary Oxalate by Liquid Chromatography–Tandem Mass Spectrometry with Online Weak Anion Exchange Chromatography. Clin. Chem. 2006, 52, 2296–2299. [Google Scholar] [CrossRef]
- Marshall, D.J.; Adaway, J.E.; Keevil, B.G. A combined liquid chromatography tandem mass spectrometry assay for the quantification of urinary oxalate and citrate in patients with nephrolithiasis. Ann. Clin. Biochem. 2018, 55, 461–468. [Google Scholar] [CrossRef]
- Mu, Y.; Wu, Y.; Wang, X.; Hu, L.; Ke, R. Determination of 10 organic acids in alcoholic products by ion chromatography-tandem mass spectrometry. Se Pu Chin. J. Chromatogr. 2022, 40, 1128–1135. [Google Scholar] [CrossRef] [PubMed]
- Li, W.; Zheng, J.; Chen, M.; Liu, B.; Liu, Z.; Gong, L. Simultaneous determination of oxalate and citrate in urine and serum of calcium oxalate kidney stone rats by IP-RP LC-MS/MS. J. Chromatogr. B Anal. Technol. Biomed. Life Sci. 2022, 1208, 123395. [Google Scholar] [CrossRef] [PubMed]
- Gómez, I.B.; Ramos, M.J.G.; Rajski, Ł.; Flores, J.M.; Jesús, F.; Fernández-Alba, A.R. Ion chromatography coupled to Q-Orbitrap for the analysis of formic and oxalic acid in beehive matrices: A field study. Anal. Bioanal. Chem. 2022, 414, 2419–2430. [Google Scholar] [CrossRef] [PubMed]
- Koolstra, W.; Wolthers, B.G.; Hayer, M.; Elzinga, H. Development of a reference method for determining urinary oxalate by means of isotope dilution—Mass spectrometry (ID-MS) and its usefulness in testing existing assays for urinary oxalate. Clin. Chim. Acta 1987, 170, 227–235. [Google Scholar] [CrossRef]
- France, N.C.; Holland, P.T.; McGhie, T.K.; Wallace, M.R. Measurement of plasma oxalate by capillary gas chromatography and its validation by isotope dilution mass spectrometry. J. Chromatogr. B: Biomed. Sci. Appl. 1988, 433, 1–7. [Google Scholar] [CrossRef]
- van Harskamp, D.; Garrelfs, S.F.; Oosterveld, M.J.S.; Groothoff, J.W.; van Goudoever, J.B.; Schierbeek, H. Development and Validation of a New Gas Chromatography–Tandem Mass Spectrometry Method for the Measurement of Enrichment of Glyoxylate Metabolism Analytes in Hyperoxaluria Patients Using a Stable Isotope Procedure. Anal. Chem. 2020, 92, 1826–1832. [Google Scholar] [CrossRef] [PubMed]
- Ardakani, M.M.; Jalayer, M.; Naeimi, H.; Heidarnezhad, A.; Zare, H.R. Highly selective oxalate-membrane electrode based on 2,2′-[1,4-butandiyle bis(nitrilo propylidine)]bis-1-naphtholato copper(II). Biosens. Bioelectron. 2006, 21, 1156–1162. [Google Scholar] [CrossRef] [PubMed]
- Noblitt, S.D.; Schwandner, F.M.; Hering, S.V.; Collett, J.L.; Henry, C.S. High-sensitivity microchip electrophoresis determination of inorganic anions and oxalate in atmospheric aerosols with adjustable selectivity and conductivity detection. J. Chromatogr. A 2009, 1216, 1503–1510. [Google Scholar] [CrossRef]
- Moura, A.V.; Silva, A.A.R.; da Silva, J.D.S.; Pedroza, L.A.L.; Bornhorst, J.; Stiboller, M.; Schwerdtle, T.; Gubert, P. Determination of ions in Caenorhabditis elegans by ion chromatography. J. Chromatogr. B Anal. Technol. Biomed. Life Sci. 2022, 1204, 123312. [Google Scholar] [CrossRef]
- Kotani, A.; Ishikawa, H.; Shii, T.; Kuroda, M.; Mimaki, Y.; Machida, K.; Yamamoto, K.; Hakamata, H. Determination of oxalic acid in herbal medicines by semi-micro hydrophilic interaction liquid chromatography coupled with electrochemical detection. Anal. Sci. 2023, 39, 441–446. [Google Scholar] [CrossRef]
- Zhai, Q.-Z.; Zhang, X.-X.; Liu, Q.-Z. Catalytic kinetic spectrophotometry for the determination of trace amount of oxalic acid in biological samples with oxalic acid-rhodamine B-potassium dichromate system. Spectrochim. Acta A Mol. Biomol. Spectrosc. 2006, 65, 1–4. [Google Scholar] [CrossRef]
- Chamjangali, M.A.; Keley, V.; Bagherian, G. Kinetic Spectrophotometric Method for the Determination of Trace Amounts of Oxalate by an Activation Effect. Anal. Sci. 2006, 22, 333–336. [Google Scholar] [CrossRef]
- Zhai, Q.-Z.; Zhang, X.-X.; Liu, Q.-Z. Spectrophotometric determination of trace oxalic acid with zirconium(IV)-dibromochloroarsenazo complex. Bull. Chem. Soc. Ethiop. 2007, 21, 297–301. [Google Scholar] [CrossRef]
- Zhai, Q.-Z. Determination of trace amount of oxalic acid with zirconium(IV)-(DBS-arsenazo) by spectrophotometry. Spectrochim. Acta A Mol. Biomol. Spectrosc. 2008, 71, 332–335. [Google Scholar] [CrossRef]
- Arab Chamjangali, M.; Sharif-Razavian, L.; Yousefi, M.; Amin, A.H. Determination of trace amounts of oxalate in vegetable and water samples using a new kinetic-catalytic reaction system. Spectrochim. Acta A Mol. Biomol. Spectrosc. 2009, 73, 112–116. [Google Scholar] [CrossRef]
- Tavallali, H.; Deilamy-Rad, G.; Mosallanejad, N. Development of a New Colorimetric Chemosensor for Selective Determination of Urinary and Vegetable Oxalate Concentration Through an Indicator Displacement Assay (IDA) in Aqueous Media. Food Technol. Biotechnol. 2018, 56, 329–336. [Google Scholar] [CrossRef] [PubMed]
- Pourreza, N.; Lotfizadeh, N.; Golmohammadi, H. Colorimetric sensing of oxalate based on its inhibitory effect on the reaction of Fe (III) with curcumin nanoparticles. Spectrochim. Acta Part A Mol. Biomol. Spectrosc. 2018, 192, 251–256. [Google Scholar] [CrossRef]
- Rocha, D.P.; Pinto, G.F.; Silva, S.M.; Squissato, A.L.; Silva, S.G. A multi-pumping flow system for spectrophotometric determination of oxalate in tea. Microchem. J. 2020, 157, 104938. [Google Scholar] [CrossRef]
- Chen, P.; Bai, Y.; Tang, Y.; Yan, S.; Wang, X.; Wei, W.; Wang, J.; Zhang, M.; Ying, B.; Geng, J. Rapid and highly sensitive visual detection of oxalate for metabolic assessment of urolithiasis via selective recognition reaction of CdTe quantum dots. J. Mater. Chem. B 2020, 8, 7677–7684. [Google Scholar] [CrossRef] [PubMed]
- Shi, H.; Li, X.; Li, Y.; Feng, S. Wild jujube-based fluorescent carbon dots for highly sensitive determination of oxalic acid. RSC Adv. 2022, 12, 28545–28552. [Google Scholar] [CrossRef]
- Wu, L.; Li, F.; Yu, H.; Shen, L.; Wang, M. Facile and rapid determination of oxalic acid by fading spectrophotometry based on Fe(III)-sulfosalicylate as colorimetric chemosensor. Spectrochim. Acta A Mol. Biomol. Spectrosc. 2023, 284, 121784. [Google Scholar] [CrossRef]
- Hontz, D.; Hensley, J.; Hiryak, K.; Lee, J.; Luchetta, J.; Torsiello, M.; Venditto, M.; Lucent, D.; Terzaghi, W.; Mencer, D.; et al. A Copper(II) Macrocycle Complex for Sensing Biologically Relevant Organic Anions in a Competitive Fluorescence Assay: Oxalate Sensor or Urate Sensor? ACS Omega 2020, 5, 19469–19477. [Google Scholar] [CrossRef]
- Tang, L.; Park, J.; Kim, H.-J.; Kim, Y.; Kim, S.J.; Chin, J.; Kim, K.M. Tight Binding and Fluorescent Sensing of Oxalate in Water. J. Am. Chem. Soc. 2008, 130, 12606–12607. [Google Scholar] [CrossRef] [PubMed]
- Emami, E.; Mousazadeh, M.H. Green synthesis of carbon dots for ultrasensitive detection of Cu2+ and oxalate with turn on-off-on pattern in aqueous medium and its application in cellular imaging. J. Photochem. Photobiol. A Chem. 2021, 418, 113443. [Google Scholar] [CrossRef]
- Rhaman, M.M.; Fronczek, F.R.; Powell, D.R.; Hossain, M.A. Colourimetric and fluorescent detection of oxalate in water by a new macrocycle-based dinuclear nickel complex: A remarkable red shift of the fluorescence band. Dalton Trans. 2014, 43, 4618–4621. [Google Scholar] [CrossRef] [PubMed]
- Tang, L.; Wu, D.; Huang, Z.; Bian, Y. A fluorescent sensor based on binaphthol-quinoline Schiff base for relay recognition of Zn2+ and oxalate in aqueous media. J. Chem. Sci. 2016, 128, 1337–1343. [Google Scholar] [CrossRef]
- Chen, P.; Cen, L.; Wang, Y.; Bai, Y.; Shi, T.; Chen, X. Rapid binary visual detection of oxalate in urine samples of urolithiasis patients via competitive recognition and distance reading test strips. J. Mater. Chem. B 2023, 11, 2530–2537. [Google Scholar] [CrossRef]


| Method Type | LOD µM | LOD µg/mL | LOQ µM | Other Figures of Merit | Sample Preparation | Summary | Strengths | Limitations | Ref. Year |
|---|---|---|---|---|---|---|---|---|---|
| Enzymatic—flow injection analysis | 34.0 | 2.99 | NR, but linearity was shown from 5 to 50 µM | Recovery mean: >85% Precision not reported. Accuracy vs. other methods not reported. | Urine samples were acidified with HCl to pH 2–3 for storage, then diluted 10 × with citrate buffer (pH 3.5) prior to analysis. | Flow injection analysis (FIA) was used to measure oxalate in urine. A column reactor of immobilized oxalate oxidase was used. Generated H2O2 was measured by chemiluminescence via a reaction of luminol with hexacyanoferrate(III). L-ascorbic acid interference with the assay was unable to be eliminated with the use of sodium nitrite. | Highly specific for oxalate. | L-ascorbic acid interference was a potential problem, but was avoided by diluting the urine samples. | [25] 1994 |
| Enzymatic—with HPLC-UV | 1.5 | 0.13 | NR, but linearity was shown up to 700 µM | Within-run precision: ≤6.7% CV Between-batch precision: ≤8.6% CV Recovery mean: 102% (10.5% CV) Accuracy: reported as statistically equivalent to commercial enzyme kit (no r value provided) | 24 h urine samples were preserved with 5 mL 5% thymol-isopropanol. Blood was heparinized, centrifuged to obtain plasma, then plasma deproteinized (2 mL plasma, 40 µL concentrated HCl). Precipitated protein was removed by centrifugation. Supernatant was used directly for HPLC. | An anion exchange column was used prior to reaction of oxalate with barley oxalate oxidase in the flow path. Product, H2O2, was measured with an amperometric detector. | Oxalate was resolved in 8.2 min, with comparable accuracy to commercial enzyme-based kits. Higher sensitivity than enzyme-based kits. | Requirement for immobilization of oxalate oxidase. | [26] 1997 |
| Enzymatic/Spectrophotometric—alkylamine glass-bound oxalate oxidase measured by a color reagent | 10.2 | 0.9 | NR, but linearity was shown up to 300 µM | Within-run precision: ≤4.0% CV Between-batch precision: ≤3.0% CV Recovery mean: ~98% Accuracy: r = 0.98 vs. commercial enzyme kit | 24 h urine samples were acidified with HCl, then pH adjusted to 5–7 using NaOH. Urine was diluted 1:1 with 0.1 M potassium phosphate buffer (pH 7.0). Sodium nitrite (35 mg/10 mL) was added to avoid ascorbate interference. | Urinary oxalate was measured with an alkylamine glass-bound oxalate oxidase purified from leaves of Amaranthus spinosus. H2O2 is generated from urinary oxalate, which is measured with a colored reagent containing 4-aminophenazone, phenol, and horseradish peroxidase. The chromogen formed is read at 520 nm. Recovery of oxalate was 98%. Results were comparable to the Sigma kit method (r = 0.98). | Oxalate-oxidase beads were reusable up to at least 300 times. | 48 h reaction time required. Use of hazardous reagents (glutaraldehyde and phenol). | [27] 1999 |
| Enzymatic—oxalate-oxidase-based biosensor | 20.0 | 1.76 | NR, but linearity was shown up to 5 mM | Within-run precision: ≤6.5% RSD. Between-batch precision: ≤12% RSD. Recovery: not reported Accuracy: r = 0.952 vs. colorimetric method | EDTA was mixed with urine to 10 mM. pH was adjusted to 5.0 with succinic acid, then samples were diluted with equal volume of diluent (succinic acid and NaOH to pH 5.0). Diluted urine was mixed with 200 g/L activated charcoal, filtered, and analyzed. | Oxalate oxidase was used with SIRE (sensors based on injection of the recognition element) technology. Analysis was selective, simple, and inexpensive. Linear between 0–5 mM or more with a shorter reaction time. Results were comparable to a colorimetric method. | Minimal enzyme degradation and correction for matrix-related interferences. Rapid analysis time (2–9 min) | Limit of detection relatively high. | [28] 2003 |
| Enzymatic—catalase model compound with oxalate oxidase quantified by UV-vis | 2.0 | 0.176 | 0.5 Linear from 0.5 to 25 µM (R = 0.996) | Within-run precision: ≤4% CV Recovery mean: ~96% Accuracy: mean oxalate concentration was ~95% of that with enzyme method (no regression was performed vs. enzyme method) | Urine samples treated with HCl to pH 1–2. EDTA was added to 10 mM to prevent calcium oxalate precipitation. pH was adjusted to 5 with succinic acid, diluted, then mixed with activated charcoal before filtration and storage at −20 °C. | Urinary oxalate was determined based on a catalase model compound MnL(H2O)2(ClO4)2 (L = bis(2-pyridylmethyl)amino)propionic acid). Oxalate is decomposed with oxalate oxidase into CO2 and H2O2. H2O2 is converted to H2O and O2 by the catalase model compound, forming a color compound. Absorbance of the formed compound is measured. Linear from 0.002–20 mM oxalate. Results are consistent with enzymatic and HPLC methods. The compound modeled off catalase avoids the need for enzymes. | High sensitivity. | Real urine samples yielded a higher oxalate concentration than expected. | [29] 2009 |
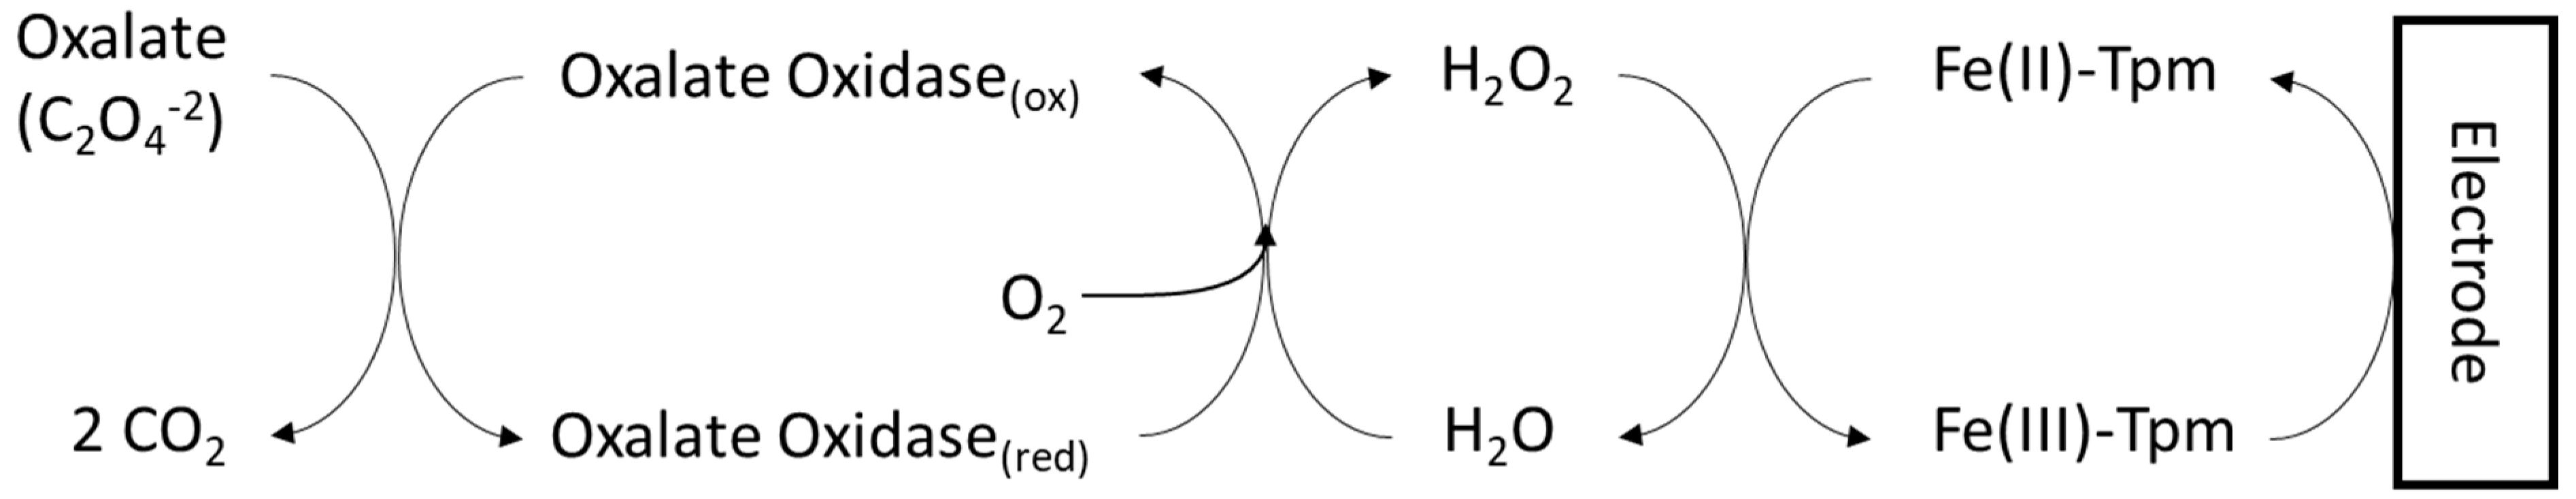
| Enzymatic/Electrochemical—amperometric biosensor used on urine | 11.4 | 1.0 | 34.1 Linear from 3.0 to 50.0 mg/L (r2 = 0.999) | Within-run precision: ≤2.0% RSD. Between-batch precision: ≤2.2% RSD. Recovery: not reported Accuracy: not significantly different from spectrophotometric detection. | Urine was mixed with a saturated CaCl2 solution, centrifuged to collect precipitate. Precipitate was dissolved in H2SO4 0.1 M for direct analysis. | Oxalate oxidase enzyme was immobilized on a magnetic solid containing an electrode modified with Fe (III)-tris-(2-thiopyridone) borate. Oxalate quantification was linear between 3.0–50.0 mg∙L−1. | No sample treatment, small volume, and simple instrumentation. | Relatively high limit of quantification. | [30] 2012 |
| LC-MS/MS and anion exchange chromatography | 3.0 | 0.264 | 100.0 Linear from 100.0 to 2212 µM (R2 = 0.999) | Within-run precision: ≤4.0% CV Between-batch precision: ≤5.0% CV Recovery mean: 95% Accuracy: r = 0.964 vs. enzymatic assay | Urine samples (10 µL) were added to 10 µL internal standard (13C2-oxalic acid) solution and 400 µL water for injection from a microtiter plate. | Urinary oxalate was quantified using weak anion exchange chromatography and MS/MS. Used a Waters OASIS WAX column, and detected oxalate 88.6 > 60.5 m/z transition and a 90.5 > 61.5 transition for 13C2-oxalate. Electrospray negative ion mode was used. Oxalate eluted at 1.2 min, 95% recovery; LOQ was 100 umol/L. Linear to 2212 umol/L. Oxalate eluted away from area of ion suppression. No interference from organic acids. Quantitative results were comparable to enzyme assay | Retention time afforded resolution from areas of ion suppression. Short (1.2 min) retention time. | Relatively high limit of quantification. | [31] 2006 |
| LC-MS/MS and WAX solid-phase extraction | NR | NR | 60.0 Linear from 60 to 1388 µM (R2 > 0.99) | Within-run precision: ≤11.1% CV Between-batch precision: ≤5.4% CV Recovery mean: 100% Accuracy: individual samples were −34% to +74.2% different from enzymatic method (attributed to ion suppression by sample matrix) | Urine was pipetted into 96-well plate, internal standard (pH 1.6 in PBS) was added prior to 2% formic acid. Plate was mixed before well contents were pushed through a methanol/water pre-treated WAX-SPE plate, followed by several washes. Flow-through was discarded. Contents were eluted with ammonia in methanol, evaporated, dissolved in 100 µL water, centrifuged, and injected directly from plate. | Measured urine citrate and oxalate after a simple weak anion exchange solid-phase extraction (WAX-SPE) clean-up procedure. Detected with electrospray-negative ion mode. Linear from 60 to 1388 umol/L. | Reaction monitoring of oxalate 88.9 > 60.85 allows for more confident identification. Oxalate eluted at 0.29 min. 100% oxalate recovery. | Manual SPE plate loading, eluent evaporation, and reconstitution. Required 13C use as an internal standard to correct for matrix-derived ion suppression. | [32] 2018 |
| Ion chromatography-MS/MS and solid-phase extraction | 0.040 | 0.0035 | 0.137 | Within-run precision: 4.7 to 6.2% RSD Recovery: 96.5% to 107.5% Accuracy: not compared to other methods, but spiking and recovery was performed. | Liquor or wine was purified through solid-phase extraction and used directly for analysis. | Samples were separated on a Dionex IonPac AS11-HC anion analysis column with increasing KOH strength in eluent. K+ was removed with an in-line cation exchange-based suppressor prior to ESI-MS/MS in negative ion mode. | Simple sample preparation. High sensitivity. | Specialized instrumentation and technical skill. Separation time may be a limitation compared to indicator-based multi-well plate methods. | [33] 2022 |
| Ion-pairing reversed-phase LC-MS/MS | 0.10 | 0.0088 | 0.25 Linear from 0.25 to 1000 µM (R2 > 0.99) | Intra-day precision: ≤5.82% Inter-day precision: ≤10.32% RSD Recovery: 90% to 102% Accuracy: ≤17.38% Matrix effect: max signal suppression was 7.28%. | Urine or serum was diluted with water, deproteinized with methanol, supernatant evaporated, and reconstituted with water containing 13C2 oxalate as a standard. | An Agilent 1290 UHPLC LC system was coupled to an Agilent 6490 triple quadrupole MS system with electrospray ionization. Ion-pairing reversed-phase (IP-RP) LC-MS/MS was used for simultaneous citrate and oxalate quantitation. A Waters Acquity UPLC BEH C18 column used with an ion-pairing buffer containing 5 mM N,N-dimethylcyclohexylamine (DMCHA) and 25 mM hexafluoro-2-isopropanol (HFIP). | Simple sample preparation. High sensitivity. Short retention times (<4 min run time). | Specialized instrumentation and technical skill. | [34] 2022 |
| Ion chromatography with quadrupole Orbitrap mass analyzer | 0.011 µmol/kg | 0.001 mg/kg | 20 mg/kg Linear from 20 to 1000 mg/kg (R2 = 0.999) | Within-run precision: <20% RSD Recovery: 67% (beeswax) to 82% (bee) Matrix suppression: <10% for beeswax, and enhancement for other samples Accuracy: not compared to other methods | Bees disrupted via ultrasonic probe extraction in water, then dispersive solid-phase extraction. Filtrate was added to a tube with Bondesil-C18 (lipid removal) and acetonitrile (deproteinization), vortexed, centrifuged, and supernatant collected. Honey was diluted with water, heated to 35 °C, and agitated. It was then centrifuged, and supernatant collected. Bee bread (fermented pollen) or beeswax was added to water, vortexed, shaken, then centrifuged. Supernatant was mixed with Bondesil-C18 and acetonitrile, vortexed, centrifuged, and supernatant collected. | A Thermo ScientificTM DionexTM IntegrionTM HPICTM system was used with water and an increasing KOH gradient as mobile phase. An AS11-HC column was used for separation. An AERS 500es 2 mm suppressor was used to remove K+. A Thermo ScientificTM Orbitrap ExplorisTM 240 mass spectrometer with an OptaMaxTM NG (H-ESI II) ion source was used. Oxalic acid was analyzed with simultaneous MS and targeted MS2 modes. The retention time of oxalic acid was ~12.25 min. | Sensitive. Specific. Low matrix effect. | Poor recovery. Specialized instrumentation and training required. | [35] 2022 |
| GC-MS | NR, but 25 nmol mass was reported as detectable | Within-run precision: ≤2.6% CV Between-batch precision: ≤3.0% CV Recovery mean: 103–109% Accuracy: r = 0.919 vs. enzyme assay kit, r = 0.9906 vs. HPLC. | Urine was acidified with HCl to pH < 3 and stored at −20 °C until analysis. 100 µL urine was mixed with 50 µL of a 1 mM [13C]oxalic acid solution. 0.5 mL saturated CaSO4 solution and 3 mL absolute ethanol was added. Samples were mixed and allowed to stand for 3 h. Precipitate was centrifuged, supernatant discarded, and precipitate was dried under N2 prior to adding 75 µL of propane-2-ol-HCl and incubating for 75 min at 80 °C. Then, 1 mL each, chloroform and water, were added. Samples were vortexed, centrifuged, and aqueous layer was collected. The wash was repeated twice. 1 µL of the organic later was injected for GC-MS. | Used a stable isotope (13C) of oxalate as an internal standard added to urine. Oxalate was converted to its isopropyl ester using propane-2-ol-HCl. | N/A | Requires a 3 h precipitation step and drying step. Uses chloroform. | [36] 1987 | ||
| Capillary GC-flame ionization vs. GC-MS | NR, but oxalate was quantified as low as 1.5 µM | Between-batch precision: CV was ≤15.9% for GC and ≤14.9% for GC-MS Recovery mean: 57.9% Accuracy: r = 0.938 (GC-flame ionization vs. GC-MS) | 0.5 mL plasma was mixed with 0.25 g NaCl and 250 µL 0.1 M HCl. Samples were then extracted twice with 2 mL ethyl acetate. Ethyl acetate fractions were dried over anhydrous sodium carbonate. Malonic acid was added as an internal standard for GC-flame ionization. Sodium [13C2]oxalate was added as an internal standard for the GC-MS method. Then, 1.5 mL portions were evaporated to ~50 µL under nitrogen prior to derivatization with 30 µL MBSTFA at 50 °C for 30 min. | Plasma oxalate was extracted and derivatized with MTBSTFA prior to capillary gas chromatography and flame ionization. GC-MS showed a 0.938 correlation coefficient with the method, wherein 13C-oxalate was used as an internal standard. | Reported quantifying oxalate as low as 1.5 µM. | 24 h derivatization step, and a 57.9% oxalate recovery when extracted with ethyl acetate. | [37] 1988 | ||
| GC-MS/MS | NR | Within-run precision: ≤4.2% CV Between-batch precision: ≤6.3% CV Recovery mean: not determined Accuracy: absolute oxalate concentration not determined | 200 µL plasma samples were mixed with 30 µL 12 M HCl. Then, 50 µL 100 mg/mL ethoxylamine solution in water, and 100 µL water were added. Mixtures were incubated at 80 °C for 30 min before 50 µL NaCl-saturated water was added. 1 mL ethyl acetate was added before vortexing and centrifuging. The upper later was transferred to a GC vial. The extraction was repeated and combined. Samples were evaporated before adding 25 µL MBSTFA and 25 µL acetonitrile. The mixture was incubated for 30 min at 80 °C, cooled, and analyzed. | Stable isotopes (13C) of oxalate and glycolate were continuously infused into human subjects to monitor tracer-to-tracee ratios (hepatic metabolism). Plasma samples were derivatized with MTBSTFA and analyzed by GC-MS/MS. | Ideal for determining efficacy of therapeutic interventions for treating primary hyperoxaluria (hepatic oxalate synthesis). | Not designed for quantifying absolute oxalate concentrations. | [38] 2020 | ||
| Electrochemical—anion exchange column chromatography with conductivity detection | NR | NR | 0.2 mg/100 g in food Linear from 5.68 × 10⁻⁶ to 1.14 × 10⁻⁴ µM (r2 = 0.99) | Within-run precision: 0.8% to 4.0% CV depending on the food. Recovery mean: 98–100% Accuracy: r = 0.99 vs. capillary electrophoresis | 2–3 g food was chopped and homogenized with 9 volumes of 0.2 M HCl. Homogenates were incubated at 60 °C for 1 h prior to centrifugation. Supernatants were filtered through a 0.2 µm pore PTFE filter. Samples were then diluted 50–500 x with water prior to analysis. | Anion exchange chromatography with conductivity detection was shown to be superior to capillary electrophoresis for estimating low oxalate concentrations. | Very high sensitivity. Complete oxalate recovery. Linear response. | Retention time of oxalate was up to 15.2 min. Column “poisoning” was reported, wherein food components altered column chemistry over time. Oxalate appeared to elute on a broader peak (not baseline resolved) in apple extract. However, this was not observed in foods of higher oxalate content. | [16] 2000 |
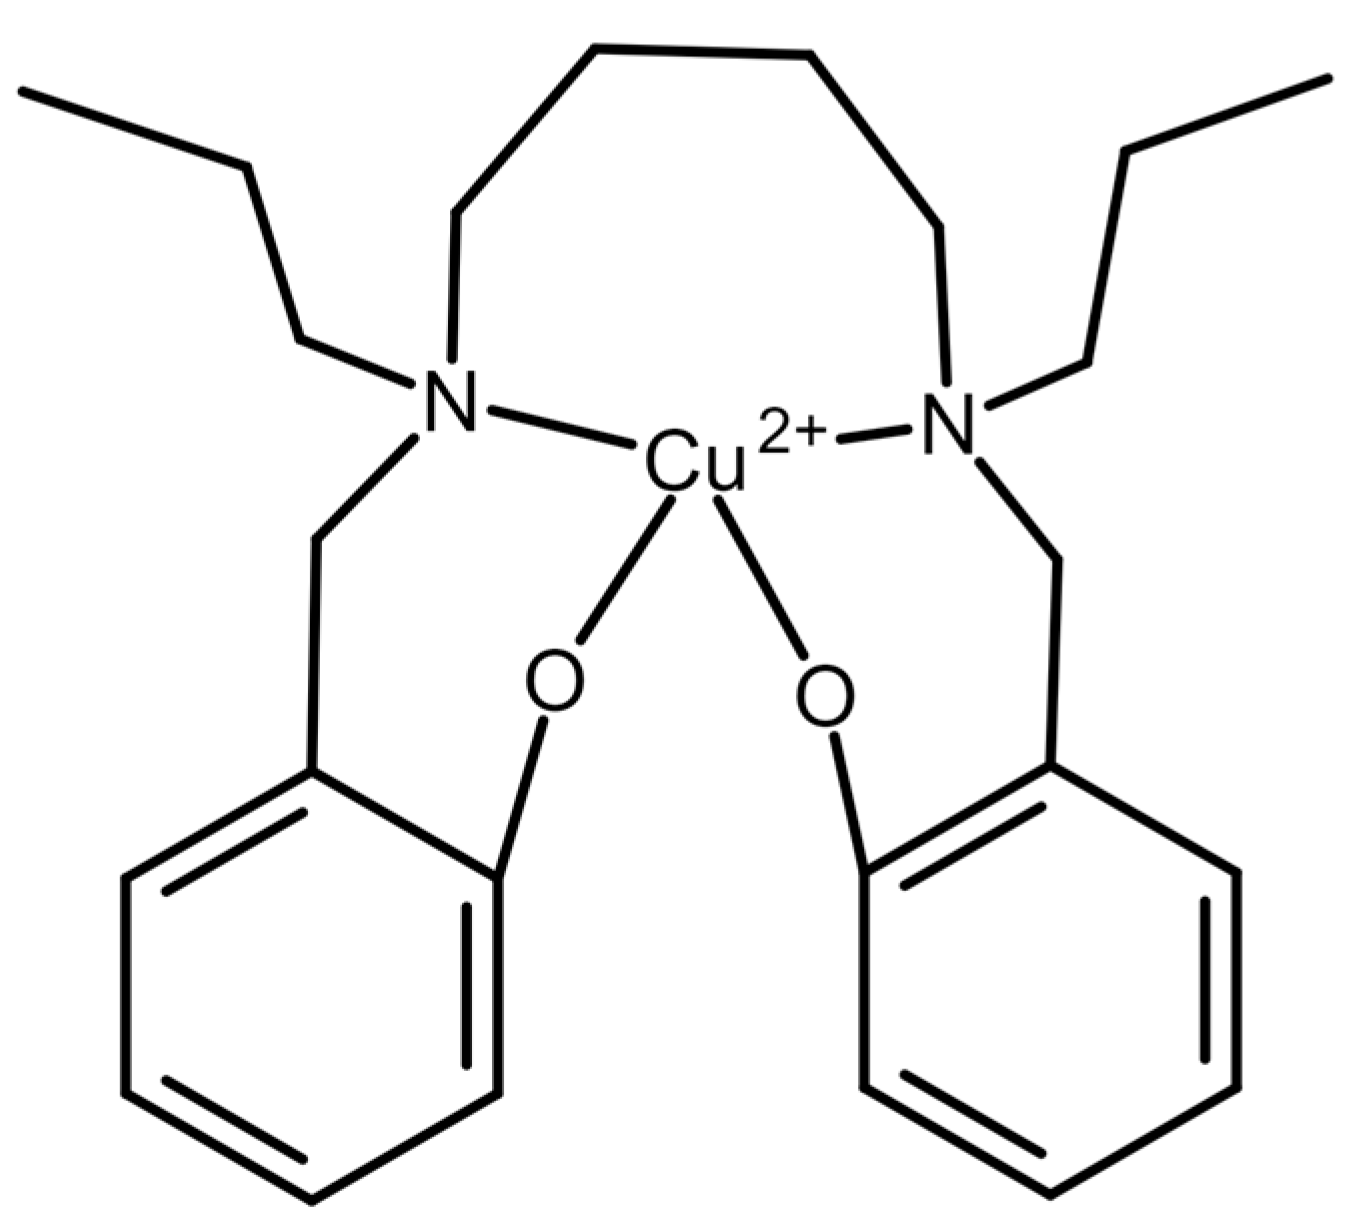
| Electrochemical—oxalate-selective membrane electrode | 0.05 | 4.4 × 10⁻³ | 0.05 | Not reported | Oxalate was prepared in water. | Used 2,2′-[1,4-butandiyle bis(nitrilo propylidine)]bis-1-naphtholato copper(II). Linear detection of oxalate from 0.05 to 100,000 µM | Sensitive. Fast response time (10–15 s) and could be used for more than 3 months. | Only used in water samples. | [39] 2006 |
| Electrochemical—ion chromatography and microchip electrophoresis | 0.180, down to 0.019 with field-amplified sample stacking. | 1.67 × 10⁻³ | 0.04 Linear from 0.04 to 300 µM (r2 = 0.9997) | Precision not reported. No comparison was made to determine accuracy against other methods. | Aerosols from air samples were collected in an outdoor mountainous region using an automated annular denuder/filter pack system. Denuders coated in sodium chloride or phosphorous acid, in series, were used to remove gaseous HNO3, SO2, and NH3. A filter pack with nylon filter was used to collect fine particles. The filter was extracted with water and sonication. Extracts were used in ion chromatography or microchip capillary electrophoresis with a conductivity detector. | Used a zwitterionic surfactant with affinity for solvated anions (N-tetradecyl,N,N-dimethyl-3-ammonio-1-propanesulfonate). Separation was performed at pH 4.7, permitting pH manipulation of oxalate’s mobility. | Sensitive. 1 min separation. Allows continuous online monitoring of aerosol composition. | Tested with atmospheric aerosols, but not biological samples. Poor resolution of oxalate and the internal standard at higher concentrations. Loss of linearity above 300 µM oxalate. Change in bulk solution conductivity with higher analyte concentrations, requiring internal standard-based correction. | [40] 2009 |
| Electrochemical—ion chromatography with conductivity detection | 0.003 | 2.729 × 10⁻⁴ | 0.009 Linear from 0.011 to 1.14 µM (R2 = 0.9999) | Within-run precision: ≤5.68% RSD Between-batch precision: ≤0.97% RSD Recovery: 71–83% Accuracy: not compared to alternative methods Matrix effect: method was not susceptible to matrix effect | C. elegans worms were digested with 35% H2O2 and microwave radiation, dried, resuspended in water, and filtered. | Ion chromatography using a Dionex™ Inegrion™ HPIC™ System with a Dionex IonPac AS19 column was performed, and detection was with double-channel conductivity detector to quantify anions or cations. Gradient elution with increasing KOH was used for oxalate and other anions. Pre-detector K+ suppression was achieved with an in-line suppressor (AERS-500 2 mm) | Highest sensitivity of all methods. Simple sample preparation. | ~30 min run time. Not amenable to high-throughput analysis. Specialized instrumentation and technical skill. | [41] 2022 |
| Electrochemical—semi-micro hydrophilic LC (HILIC) with electrochemical detection | 0.0019 | 1.7 × 10⁻⁴ | Linear from 4.5 × 10⁻⁴ to 1.8 µg/mL (r = 0.999) | Within-run precision: 0.3% to 2.9% RSD depending on herbal product Recovery: 88.7% to 104.2% | Crude herbal medicines were heated in HCl solution for 30 min at 90 °C centrifuged, supernatant diluted with HCl solution, then further diluted with acetonitrile-phosphate buffer (65:35, v/v). Sample was filtered through 0.45 µM PTFE filter, and 5 µL loaded into HILIC-ECD system. | Hydrophilic interaction liquid chromatography coupled with electrochemical detection (HILIC–ECD) was used. An Intersil Amide column was used at 50 °C. Retention time for oxalic acid was 8.1 min. Applied potential was +1.1 V vs. Ag/AgCl. | High sensitivity. Simple sample preparation. | Without mass spectrometry, cannot confirm that peak was pure oxalic acid. However, shape did not indicate any impurities. | [42] 2023 |
| Spectrophotometric—capillary electrophoresis coupled with 254 nm UV absorbance | NR | NR | 0.2 mg/100 g in food Linear from 5.68 × 10⁻⁶ to 1.14 × 10⁻⁴ µM (r2 = 0.99) | Within-run precision: 9.4% to 26.8% CV depending on the food. Recovery mean: 99–114% depending on the food Accuracy: r2 = 0.99 vs. ion chromatography | 2–3 g food was chopped and homogenized with 9 volumes of 0.2 M HCl. Homogenates were incubated at 60 °C for 1 h prior to centrifugation. Supernatants were filtered through a 0.2 µm pore PTFE filter. Samples were then diluted 50–500 × with water prior to analysis. | Various foods were processed and heated to extract oxalate. Oxalate was resolved using capillary electrophoresis, and quantified by measuring change in UV absorbance of oxalate-displaced chromate. | Very high sensitivity. Complete oxalate recovery. Linear response. | Less specific compared to mass spectrometry or enzyme-based methods. Electrolyte concentration required adjustment for oxalate concentration. Sample heating for 1 h required. Poor precision compared to anion exchange chromatography. | [16] 2000 |
| Spectrophotometric—oxalic acid-mediated catalysis of rhodamine B fading | 2.87 | 0.252 | Linear from 0.40 to 6.0 µg/mL (γ = 0.999) | Within-run precision: 2.4% RSD Recovery: 95.8% to 102.8% | Tea leaves were added to 100 °C water, soaked, and filtered. Spinach was boiled in water for 1 h, then filtered. Urine was diluted and used directly. | Sulfuric acid, rhodamine B, and potassium dichromate were mixed in an aqueous solution. Oxalic acid-containing samples were added, and the reaction was heated at 50 °C for 10 min. After cooling, NaOH was added, then absorbance measured at 552 nm to monitor oxidation of rhodamine B by oxalic acid. | Reaction can be easily terminated with NaOH. Absorbance stable for >3 h. | Interference from several inorganic ions causing >5% error at concentrations lower than oxalate. | [43] 2006 |
| Spectrophotometric—oxalate activation of Fe(II) oxidation of iodide by bromate | 0.91 | 0.08 | Linear from 0.10 to 7.0 µg/mL (r = 0.9989), but data not shown. | Within-run precision: 1.8% to 4.0% RSD Recovery from spiked water: 94.5% to 103% Accuracy: was compared to reference method, but details on reference method not provided. | Spinach or mushroom was pulverized in a mortar, mixed with water, and boiled for 20 min prior to filtration. | Oxalate-containing solutions were mixed with acetate buffer (pH 5.0) and Fe(II) and potassium iodide. Sodium bromate was added, and solutions were read in a spectrophotometer at 352 nm absorbance, which increased over time proportionally with the oxalate concentration. | Simple sample preparation. | Interference from divalent and trivalent cations via precipitation with oxalate. Overcome by acidification and cation exchange resin. Not tested against other divalent organic anions. | [44] 2006 |
| Spectrophotometric—oxalic acid replacement of of dibromochloroarsenazo in Zr(IV) complex | 19.7 | 1.73 | Linear from 50 to 300 µM (r = 0.9994) | Within-run precision: 0.24% to 1.78% RSD depending on tea type Recovery: 98.8% to 102% Accuracy: results were comparable to method in [43] | Tea leaf was soaked with boiled water for 30 min, and filtered. | An HCl solution, zirconium solution (ZrOCl2·8H2O), and DBC-arsenazo (C22H14AsBr2ClN4O11S2) solution, were mixed prior to addition of oxalic acid-containing samples. After 20 min incubation, absorbance was read at 500 nm. | Simple sample preparation | Low sensitivity. Interference from several organic acids (e.g., tartaric) and divalent and trivalent cations. | [45] 2006 |
| Spectrophotometry—oxalic acid replacement of DBS-arsenazo in Zr(IV) complex | 9.27 | 0.815 | Linear from 9 to 500 µM (r = 0.9995) | Within-run precision: 1.27% to 2.14% RSD Recovery: 99.2% to 99.6% Accuracy: results were comparable to method in [43] | Tomato sample was boiled in water for 30 min, cooled, and filtered. | An HCl solution containing zirconium(IV)-(DBS-arsenazo) was prepared. Oxalic acid replaces the DBS-arsenazo to produce a hyperchromic effect at 520 nm. | Simple sample preparation | High limit of detection. Interference from several organic acids (e.g., salicylic, tartaric and malic) and divalent and trivalent cations. | [46] 2008 |
| Spectrophotometric—oxalate catalysis of crystal violet oxidation by dichromate | 0.57 | 0.05 | Linear from 0.2 to 5.5 µg/mL (r = 0.9964) | Within-run precision: 1.8% to 6.0% Recovery: 92% to 108% for tap water, and 96% to 115% for foods. Accuracy: results were comparable to a standard method (standard method not described) | Spinach or mushroom were pulverized in a mortar, boiled in water for 45 min, and filtered. Iron cations were removed by alkalinization to pH 10 and centrifugation. The solution was neutralized with HCl. | A solution of crystal violet, potassium dichromate, and sulfuric acid was combined with the oxalate-containing sample. The increase in absorbance intensity at 630 nm was recorded from 30 to 250 s. | Sensitive. Simple sample preparation. | Interference from divalent and trivalent cations (reduced by precipitation as metal hydroxides). Interferences form other organic anions not tested. | [47] 2009 |
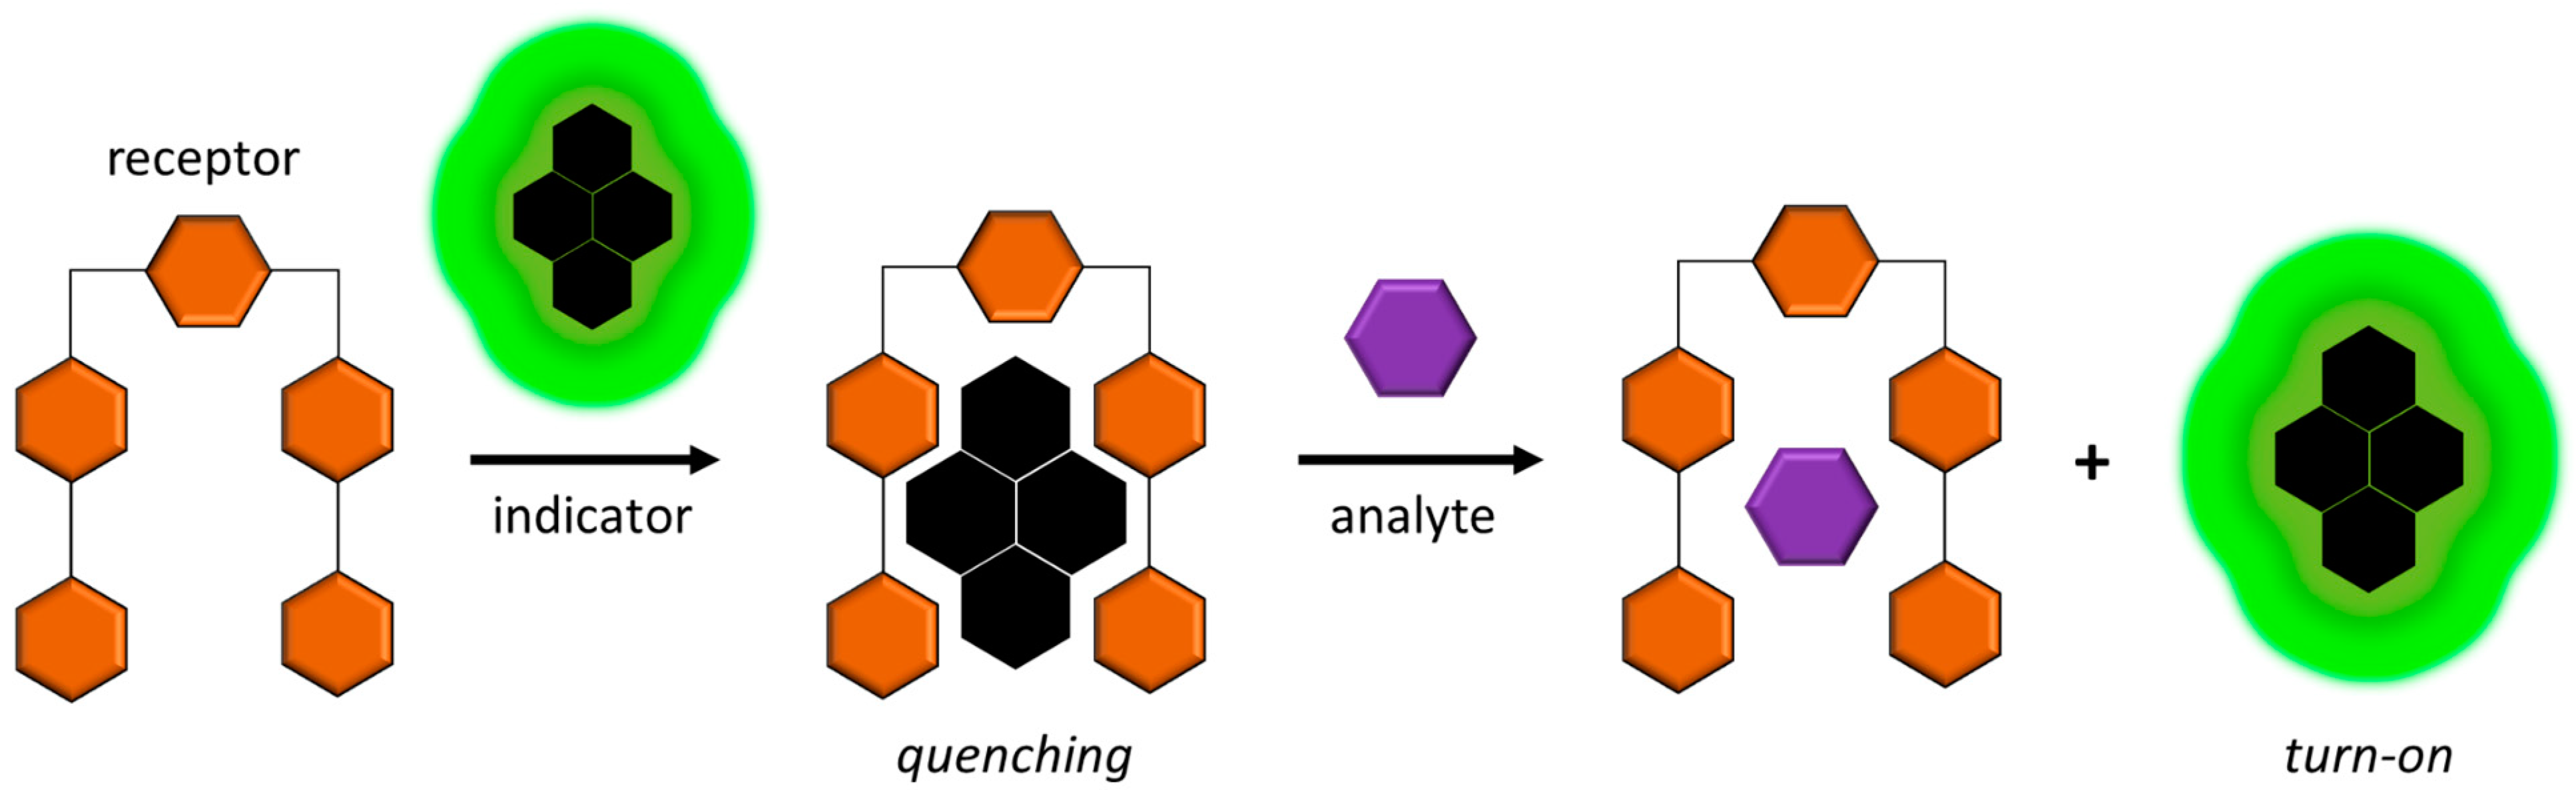
| Spectrophotometric—oxalate sequesters Cu(II) ion from Reactive Blue 4 | 0.62 | 0.055 | 2.07 Linear from 1.76 to 49.4 µM (R2 = 0.9983) | Within-run precision: 0.8% to 2.7% RSD Recovery: 97.9% to 101.2% Accuracy: results were comparable to reference method (reference method used not reported) | Urine was used directly. Mushroom and spinach samples were pulverized in a mortar, diluted with water, boiled, and filtered. NaOH was added to remove iron cations (centrifugation) prior to neutralization with HCl. | Reactive Blue (RB4) was complexed with Cu(II) in 10 mM HEPES buffer (pH 7). Oxalate-containing samples were added, and absorbance increase at 607 nm was monitored. | Simple sensor production from commercially available RB4. Simple sample preparation. <1 min response time. | Selectivity for oxalate was tested only against ascorbic acid and inorganic anions, not other multivalent organic anions (e.g., citrate and succinate) | [48] 2018 |
| Spectrophotometric—oxalate inhibition of reaction of curcumin nanoparticles with Fe(III)—colorimetric | 0.87 | 0.077 | 1.70 1.70 to 19.32 µM (r = 0.996) | Within-run precision: RSD = 4.27% (0.40 µg/mL oxalate) and 2.71% (1.05 µg/mL oxalate) Recovery: 95–105% Accuracy: not compared to other methods, but known mass of oxalate added yielded 95–105% recovery. | Food was cut and crushed to form a paste that was then boiled in water for 45 min. Filtrate was diluted with water to 100 mL. pH was adjusted to 10 with NaOH to eliminate interference from iron cations. Solutions were centrifuged, and supernatant decanted and neutralized with HCl. River water samples were filtered before adding HCl to remove carbonate and bicarbonate, then filtered again and neutralized with NaOH. Urine was diluted with water and used directly without further preparation. | Oxalate inhibited the reaction of curcumin nanoparticles (CURN) with Fe (III) in acidic media. Oxalate was measured by absorbance of CURN with Fe (III) at 427 nm. Absorbance intensity was linear with oxalate from 0.15 to 1.70 ug/mL. The method was used for detection of oxalate in water, food, and urine. | Sensitive and simple. Effective for water, food, and urine samples. | Interference from copper and carbonate/bicarbonate. Unknown if there is interference from other substances. | [49] 2018 |
| Spectrophotometric—oxalate sequestration of Zr(IV) from zirconium | 3.41 | 0.3 | Linear from 1.0 to 6.0 µM (R = 0.997) | Within-run precision = 2.6% CV Recovery: 83% to 108% | Tea was prepared, filtered, and diluted in water prior to analysis. | Three solenoid micropumps (10–40 µL per pump) were coupled with a multi-channel CCD spectrophotometer. 1,8-dihydroxy-2-(4-sulfophenylazo)-naphthalene-3,6-disulphonic acid and oxizirconium chloride were mixed in HCl to create red colored zirconium-SPADNS. Oxalate was able to complex with Zr(IV), decreasing absorbance at 570 nm. | Simple sample preparation. | Interference from organic and inorganic anions not tested (other than fluoride). Narrow linear range. Instrumentation requires technical skill. | [50] 2020 |
| Fluorescence—CdTe-based fluorescence quenching by oxalate reduction of Cu2+ | 0.08 | 0.007 | 0.100 0.100 to 1 × 10⁴ µM (R2 = 0.995) | Precision not reported, but linearity demonstrated from 100 nM to 10 mM. Recovery: 96–105% Accuracy: results were similar to LC-MS (r2 not reported) | Urine samples were centrifuged, supernatant was transferred and diluted 200 × with water. 40 µL of diluted sample was mixed with a solution containing 5 µL CuSO4 (100 µm) and 50 µL 10 mM MOPS buffer (100 mM NaNO3, 2.5 mM Mg(NO3)2, pH 7.4). Then, 1 µL CdTe quantum dot solution was added and incubated for 2.5 min. The solution was diluted with 200 µL water before fluorometry (365 nm ex., 570–720 nm em.) | Cadmium telluride (CdTe) fluorescence intensity was measured in urine samples. Oxalate-mediated reduction of Cu2+ to Cu+ increased quenching of CdTe fluorescence, as Cu+ was a more efficient quencher than Cu2+. The method was able to distinguish between urine with calcium oxalate stones or uric acid stones. | Simple protocol with low technical skill requirement. High sensitivity and upper limit of quantitation. | Not tested for interference with other organic anions found in urine (e.g., citrate) | [51] 2020 |
| Fluorescence—carbon dots | 0.65 (reported LOD, but data shows no response to oxalate below 11.37 µM) | 0.057 (reported LOD, but data shows no response to oxalate below 1.0 µg/mL) | Linear from 11.4–227 µM (r = 0.9994) | Within-run precision: 0.14% to 0.34% RSD Recovery: 91.07–105.3% | Tomato or cherry samples were cut up and boiled in water, then filtered and diluted with water, and used directly for the assay. | Fluorescent carbon dots were produced from wild jujube and DL-tryptophan by heating in water for 9 h at 170 °C. Hg2+ caused static quenching of fluorescence (ex. 365 nm, em. 455 nm), which was recovered by sequestration of Hg2+ by oxalic acid. | Simple sample preparation and instrumentation. | Reported LOD not consistent with data shown. Chemically undefined wild jujube may lead to variable carbon dot fluorescence. | [52] 2022 |
| Spectrophotometric—Fe(III)-sulfosalicylate-based colorimetric chemosensor | 8.41 | 0.74 | Linear from 0.80–160 µg/mL (r = 0.999) | Within-run precision ≤1.88% RSD Recovery = 98.99% to 104.53% | Oxalic acid-containing model wastewater was mixed with P25 TiO2 and subjected to simulated sunlight and ozone. Catalyst was removed, and assay was performed directly on solutions. | 505-nm light absorbance by Fe(III)-sulfosalicylate was measured. Absorbance decreased proportionally with an increase in oxalate. | Interference from malonic acid, methylmalonic acid, and succinic acid was tested. No interference from various inorganic cations and anions. | Some reduction in fluorescence was caused by malonic acid and methylmalonic acid, albeit with less potency than oxalic acid. | [53] 2023 |
Disclaimer/Publisher’s Note: The statements, opinions and data contained in all publications are solely those of the individual author(s) and contributor(s) and not of MDPI and/or the editor(s). MDPI and/or the editor(s) disclaim responsibility for any injury to people or property resulting from any ideas, methods, instructions or products referred to in the content. |
© 2023 by the authors. Licensee MDPI, Basel, Switzerland. This article is an open access article distributed under the terms and conditions of the Creative Commons Attribution (CC BY) license (https://creativecommons.org/licenses/by/4.0/).
Share and Cite
Misiewicz, B.; Mencer, D.; Terzaghi, W.; VanWert, A.L. Analytical Methods for Oxalate Quantification: The Ubiquitous Organic Anion. Molecules 2023, 28, 3206. https://doi.org/10.3390/molecules28073206
Misiewicz B, Mencer D, Terzaghi W, VanWert AL. Analytical Methods for Oxalate Quantification: The Ubiquitous Organic Anion. Molecules. 2023; 28(7):3206. https://doi.org/10.3390/molecules28073206
Chicago/Turabian StyleMisiewicz, Bryan, Donald Mencer, William Terzaghi, and Adam L. VanWert. 2023. "Analytical Methods for Oxalate Quantification: The Ubiquitous Organic Anion" Molecules 28, no. 7: 3206. https://doi.org/10.3390/molecules28073206
APA StyleMisiewicz, B., Mencer, D., Terzaghi, W., & VanWert, A. L. (2023). Analytical Methods for Oxalate Quantification: The Ubiquitous Organic Anion. Molecules, 28(7), 3206. https://doi.org/10.3390/molecules28073206