Article

Click Triazole as a Linker for Pretargeting Strategies: Synthesis, Docking Investigations, Fluorescence Diagnosis, and Antibacterial Action Studies

1
Department of Veterinary Medicine, Shanxi Agricultural University, Jinzhong 030801, China
2
Department of Mining Engineering, Shanxi Institute of Engineering and Technology, Yangquan 045000, China
*
Author to whom correspondence should be addressed.
Molecules 2023, 28(6), 2758; https://doi.org/10.3390/molecules28062758
Submission received: 8 January 2023 / Revised: 13 March 2023 / Accepted: 14 March 2023 / Published: 18 March 2023

Abstract

:
In this study, three compounds A1, A2, and A3 and fluorescent probes T1, T2, T3, and T4 were designed and synthesized. 1H NMR, 13C NMR, and MS characterization and elemental analysis were used to confirm A1A3 and T1T4. A1A3 and T1T4 formed diagnostic molecules by “click” reactions. A1A3 and T1T4 did not significantly increase cell death at concentrations of 80 μmol/L. Preliminary screening of the compounds for antibacterial activity revealed that A2 has better antibacterial activity against Agrobacterium tumefaciens. The synthesized compounds and fluorescent probes can be targeted and combined in the physiological condition to form diagnostic molecules for fluorescence detection of Agrobacterium tumefaciens. The binding sites of A1A3 were deduced theoretically using the AutoDock Vina software docking tool. Further study of the mechanism of the antibacterial action of these compounds is likely to identify new agents against resistant bacterial strains.

1. Introduction

Diagnostic technology has always been an important direction in the research of pathogenic diseases [1,2,3,4]. With the development of molecular biology, some common pathogens have been quickly and accurately diagnosed [5,6]. At present, the diagnostic methods of pathogenic bacteria can be roughly divided into four categories: pathogenic diagnostic methods, serological diagnosis, molecular biological diagnosis, and immunological diagnosis, and detection methods that use organic small molecule fluorescent probes to target specific proteins of pathogenic bacteria through biological orthogonal targeting [7,8,9,10,11,12].
Most of the methods of detecting pathogens with organic small molecule fluorescent probes use their bioorthogonal reactions to target specific virulence proteins of pathogens or design and synthesize specific fluorescent probes according to the microenvironment of pathogens [9,10,13,14]. Usually, the “click” reaction in click chemistry is used to modify the target protein by bioorthogonal method to achieve the “click” reaction combined with the fluorescent probe in the physiological condition in order to achieve pathogen detection [15,16]. During the past decades, the seminal work on “click chemistry” by Huisgen, followed by further independent development by Meldal et al. and Sharpless-Fokin [17,18,19,20], has significantly impacted the fields of chemical biology, sensing and diagnosis, materials chemistry, drug discovery, and drug delivery [21,22,23].
Bioorthogonal chemistry realizes the pretargeting approach [24,25,26,27,28]. B8I-2 was discovered by Smith Mark A. et al. to be able to attach to VirB8’s surface groove close to the dimerization site and prevent the assembly of the T4SS system [29,30,31,32,33]. According to B8I-2, we designed and synthesized three compounds A1, A2, and A3 targeting VirB8 and A1, A2, and A3 “click” with the four fluorescent probes T1, T2, T3, and T4. In this study, we use pretargeting strategies to form an integrated diagnostic molecule for targeted fluorescence detection of Agrobacterium tumefaciens.

2. Results and Discussion

2.1. Design and Synthesis of B8I-2 Derivatives and Fluorescent Probes

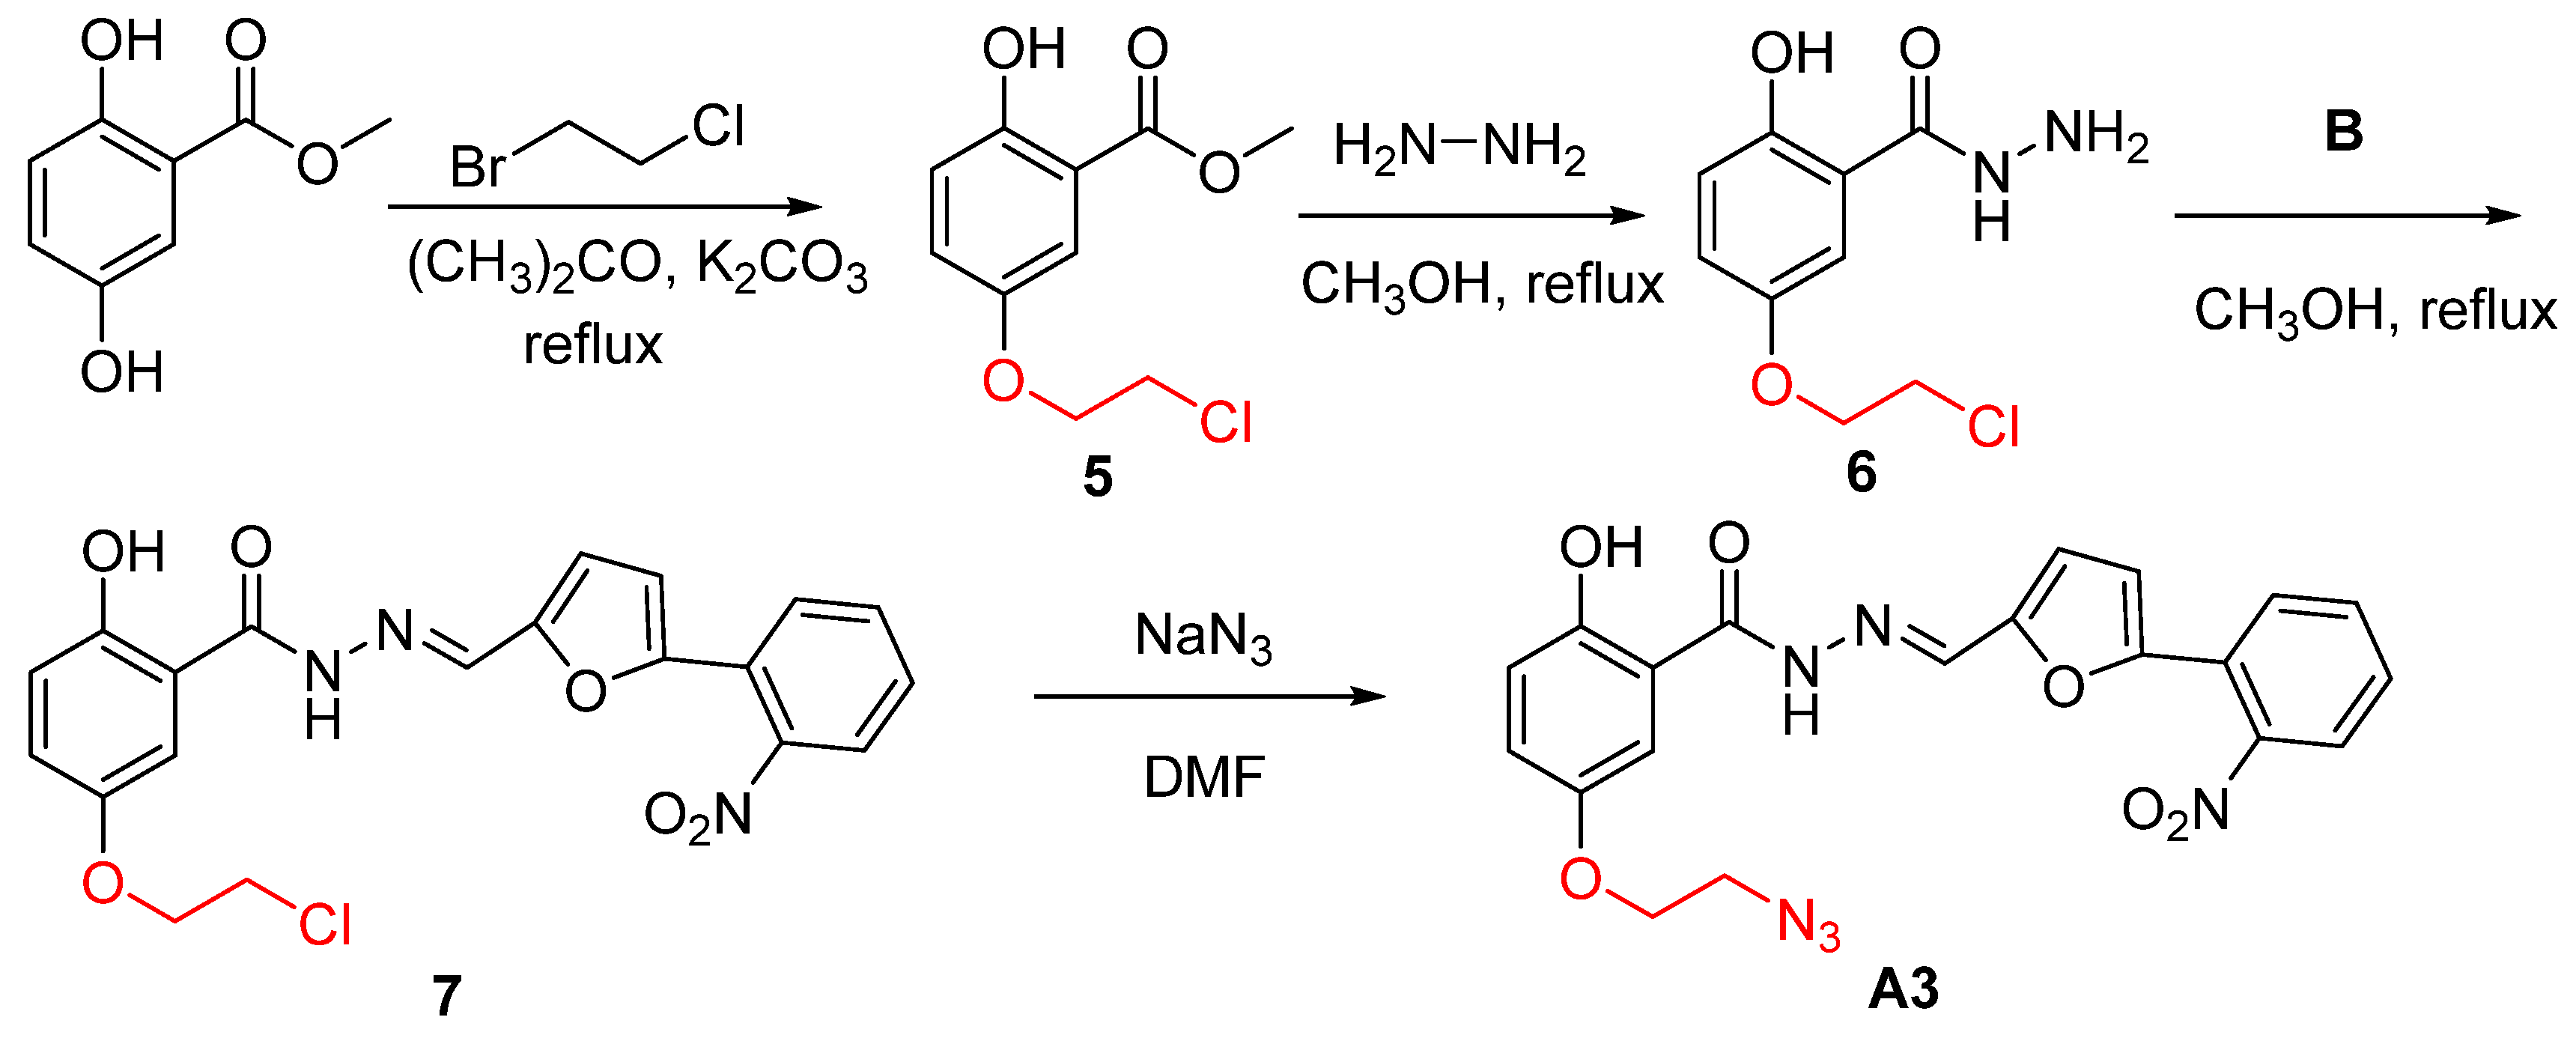
According to the literature [34,35,36,37], the compounds A1, A2, and A3 were designed (Figure 1). Using Methyl 2,5-dihydroxybenzoate and Ethyl 3-aminobenzoate as the starting material, the reaction with 3-bromopropyne and 1,2-Dibromoethane eliminated a hydrogen bromide molecule, and then reacted with hydrazine hydrate to produce a compound containing N-N-hydrazide, and finally combined with o-nitroaniline and furfural products. The compounds A1, A2, and A3 targeting the T4SS were synthesized. The structures of A1A3 were confirmed by 1H NMR, 13C NMR, and MS characterization and elemental analysis (Figures S1–S3 in the Supplementary Materials).
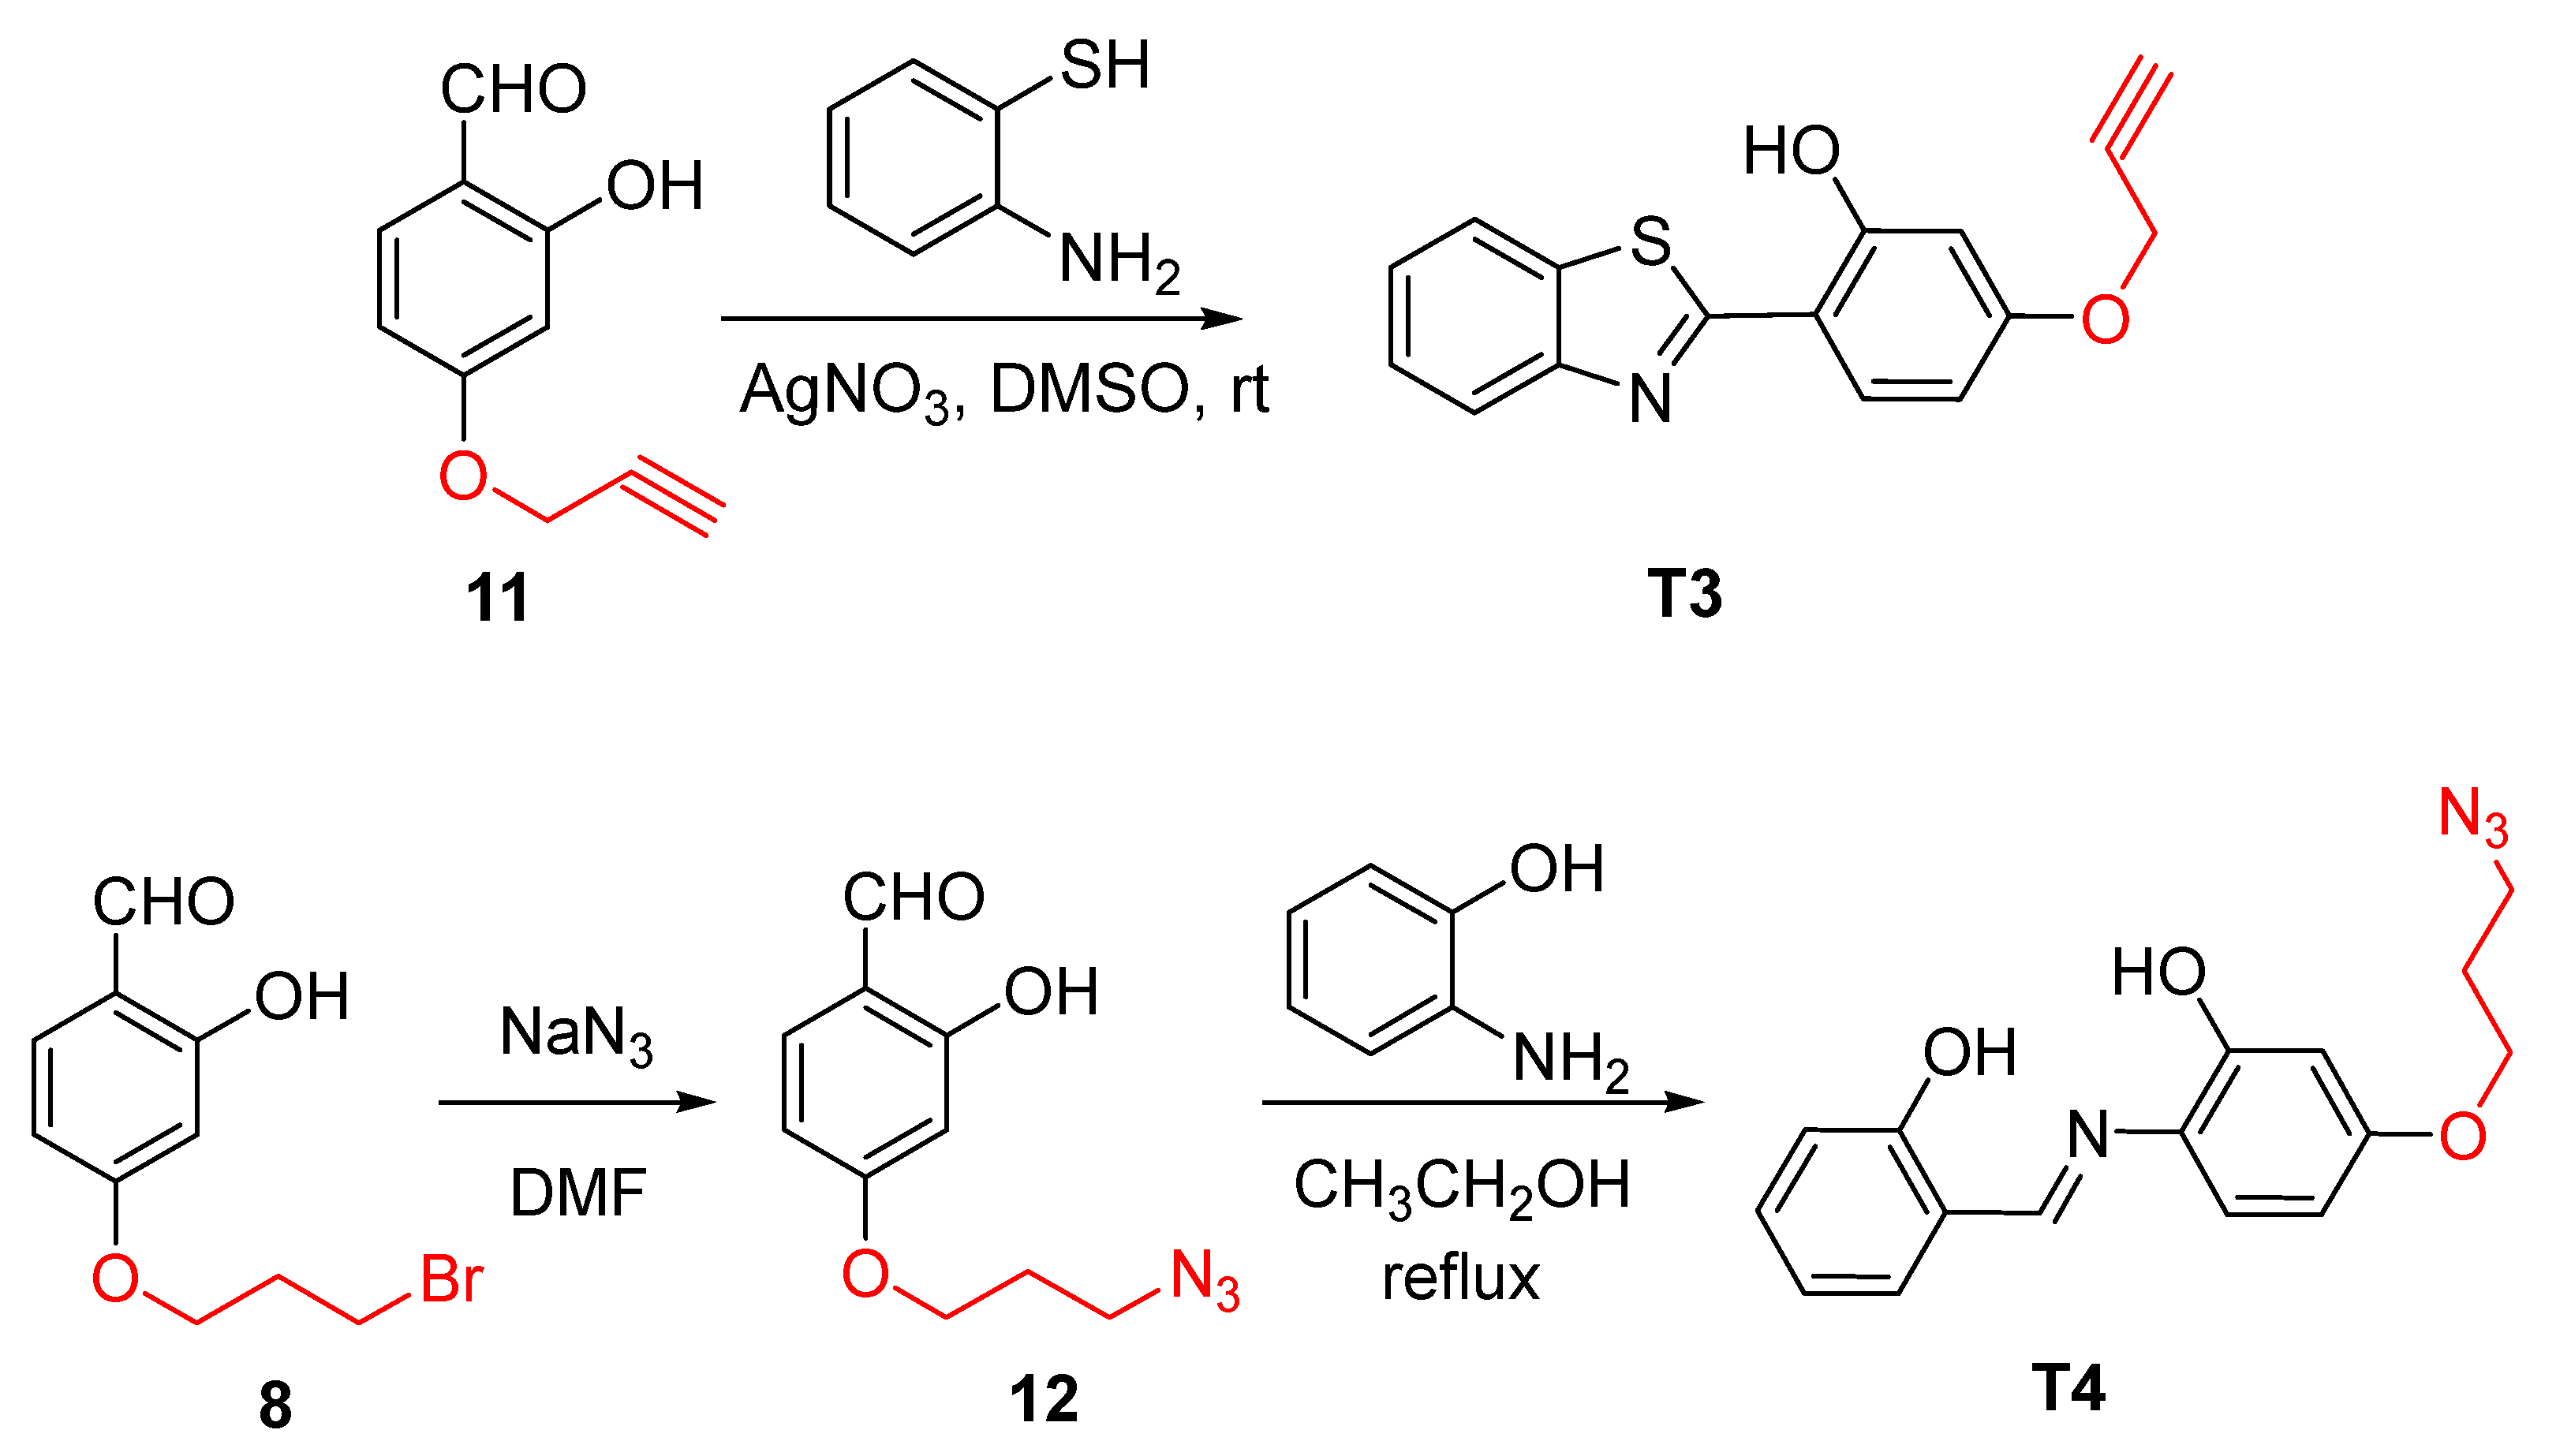
According to the literature [38,39,40,41,42,43,44], 2,5-Dihydroxybenzaldehyde is used as the raw material, and the alkyne group or azide is connected to the hydroxyl position at the fifth position (Figure 2). Then, the probes T1, T2, T3, and T4 containing alkyne groups or azide groups are obtained by reacting with 2-Aminophenthiol and 2-Aminothiophenol, respectively. The structures of T1T4 were confirmed by 1H NMR, 13C NMR, and MS characterization and elemental analysis (Figures S4–S7 in the Supplementary Materials).

2.2. UV-Visible Absorption Spectroscopy and Fluorescence Spectroscopic

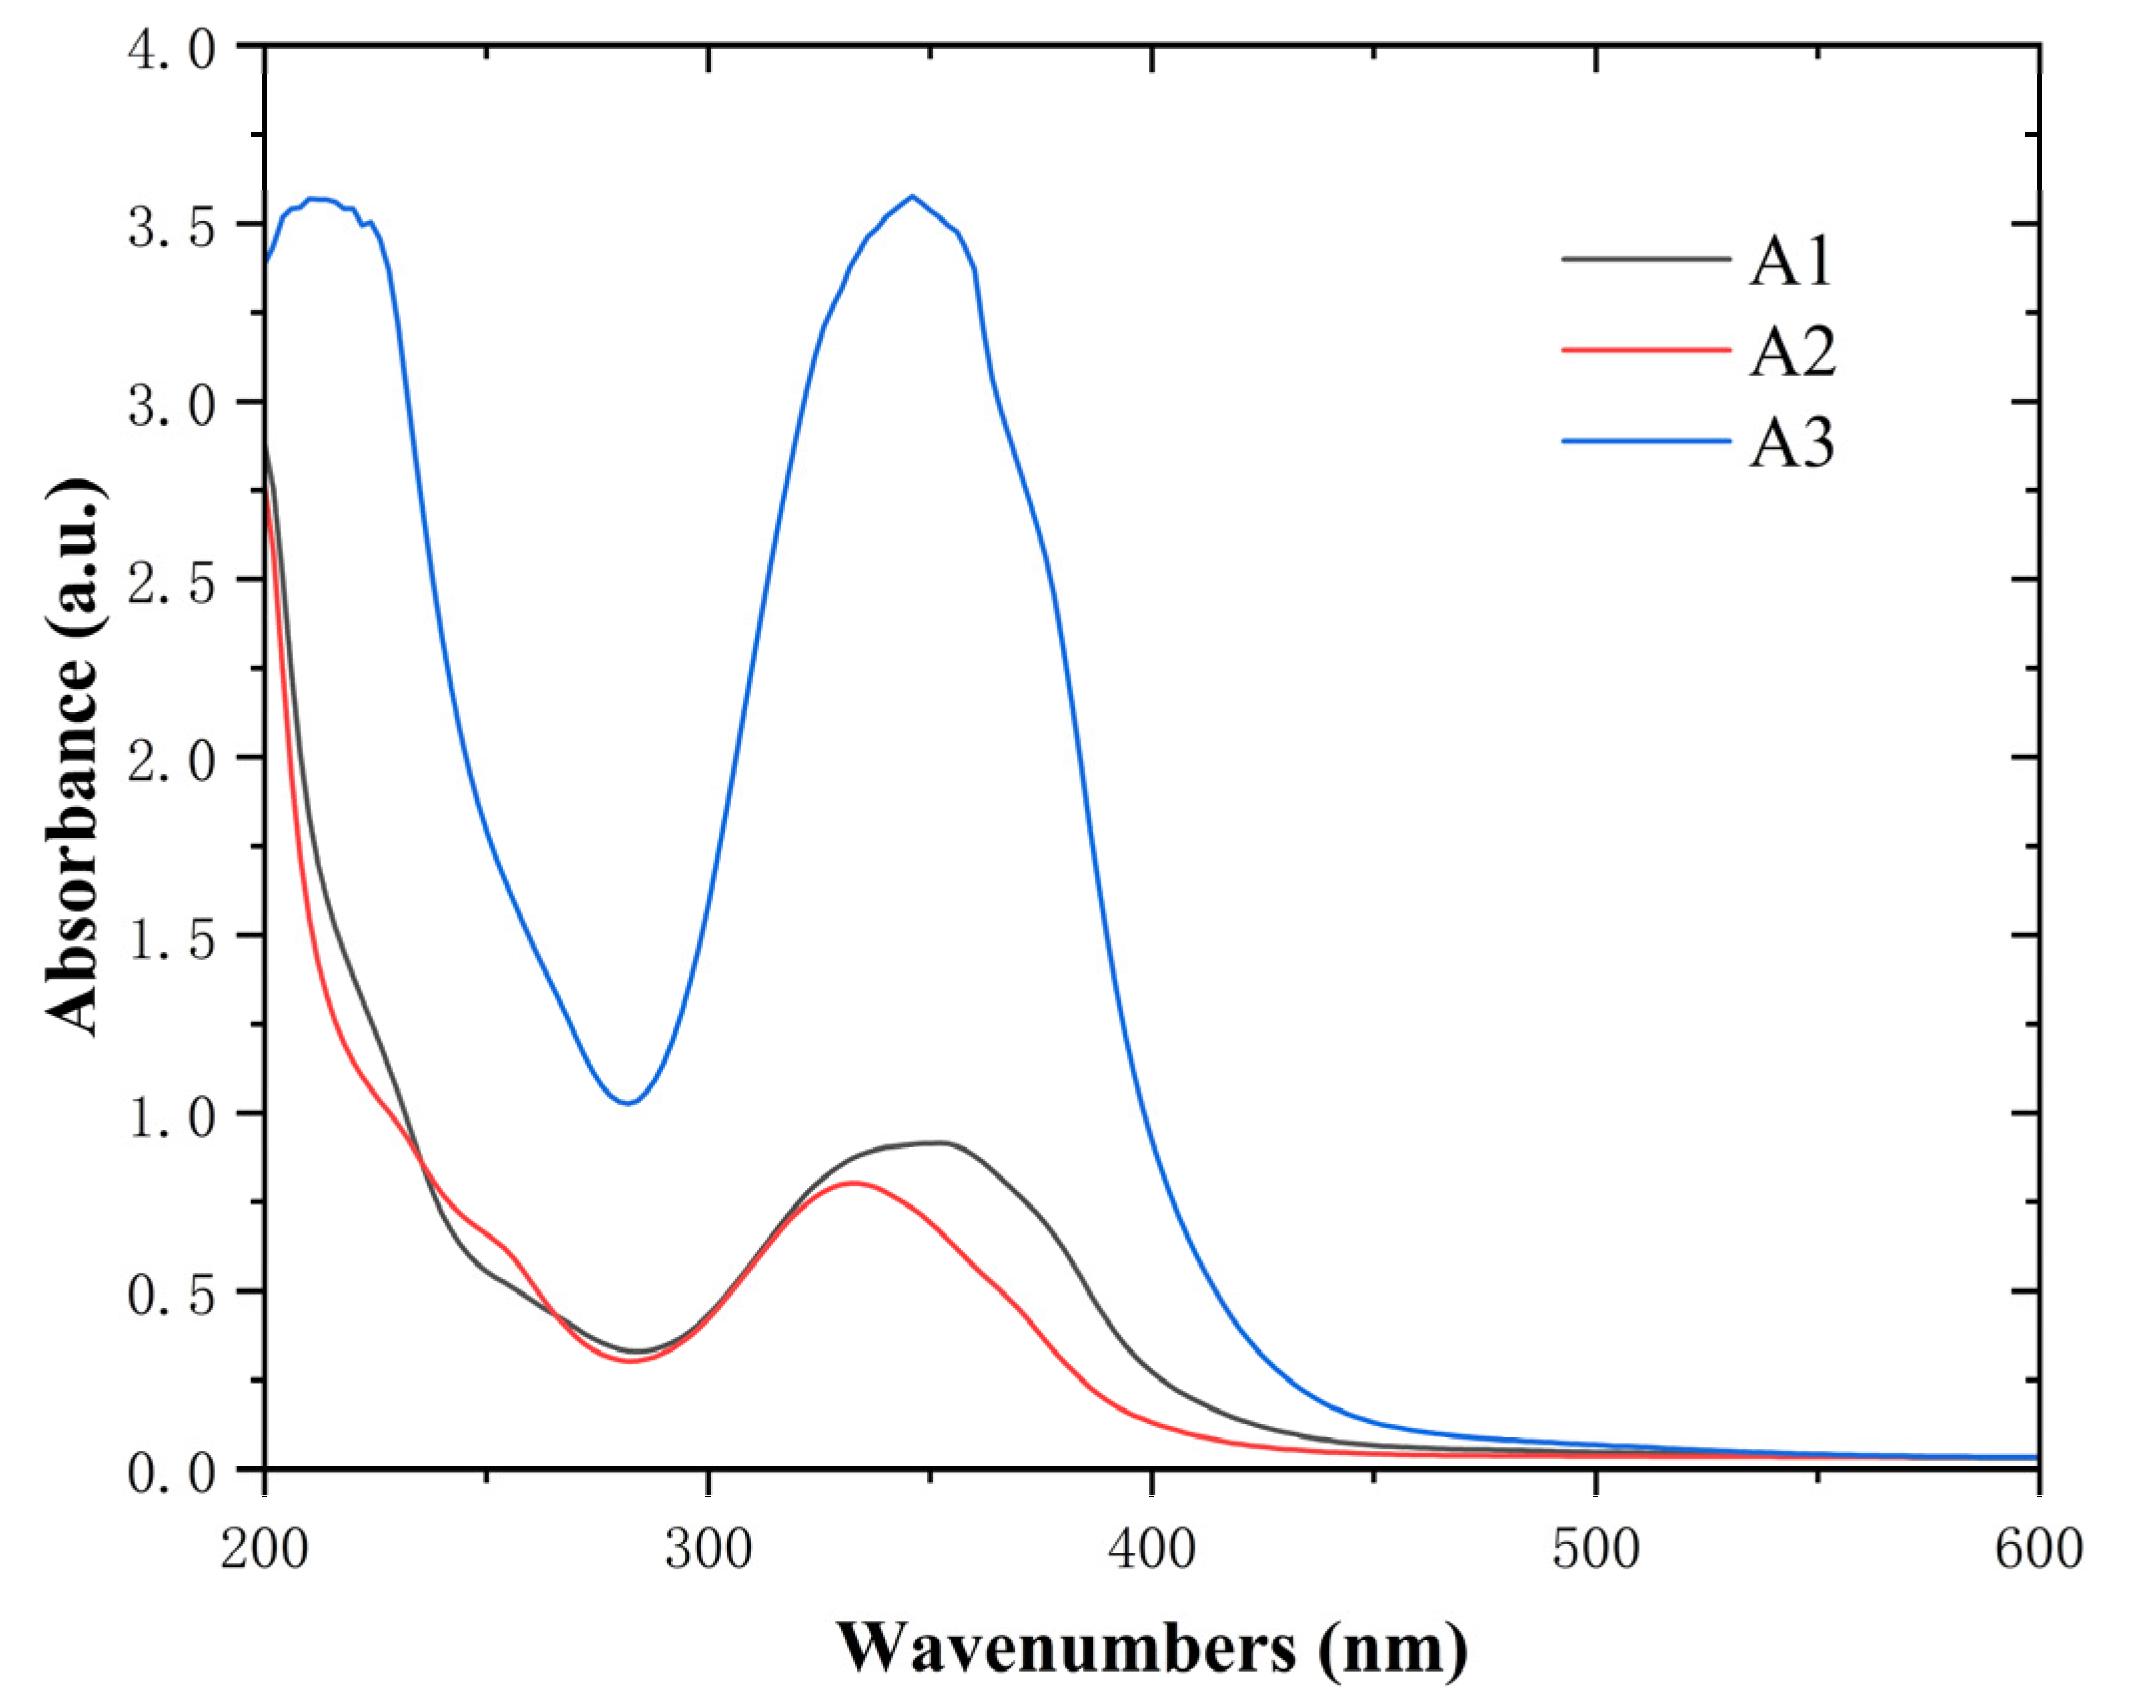
To obtain the optical properties, UV-Vis analyses of A1, A2, and A3 were carried out. As shown in the UV–Vis absorption spectrum (Figure 3), the UV-Vis spectra for compounds A1A3 were measured in methanol. The absorption maxima (λmax) for A1, A2, and A3 lie at 352 nm, 332 nm, and 346 nm. The absorption spectra of A1A3 are almost identical.
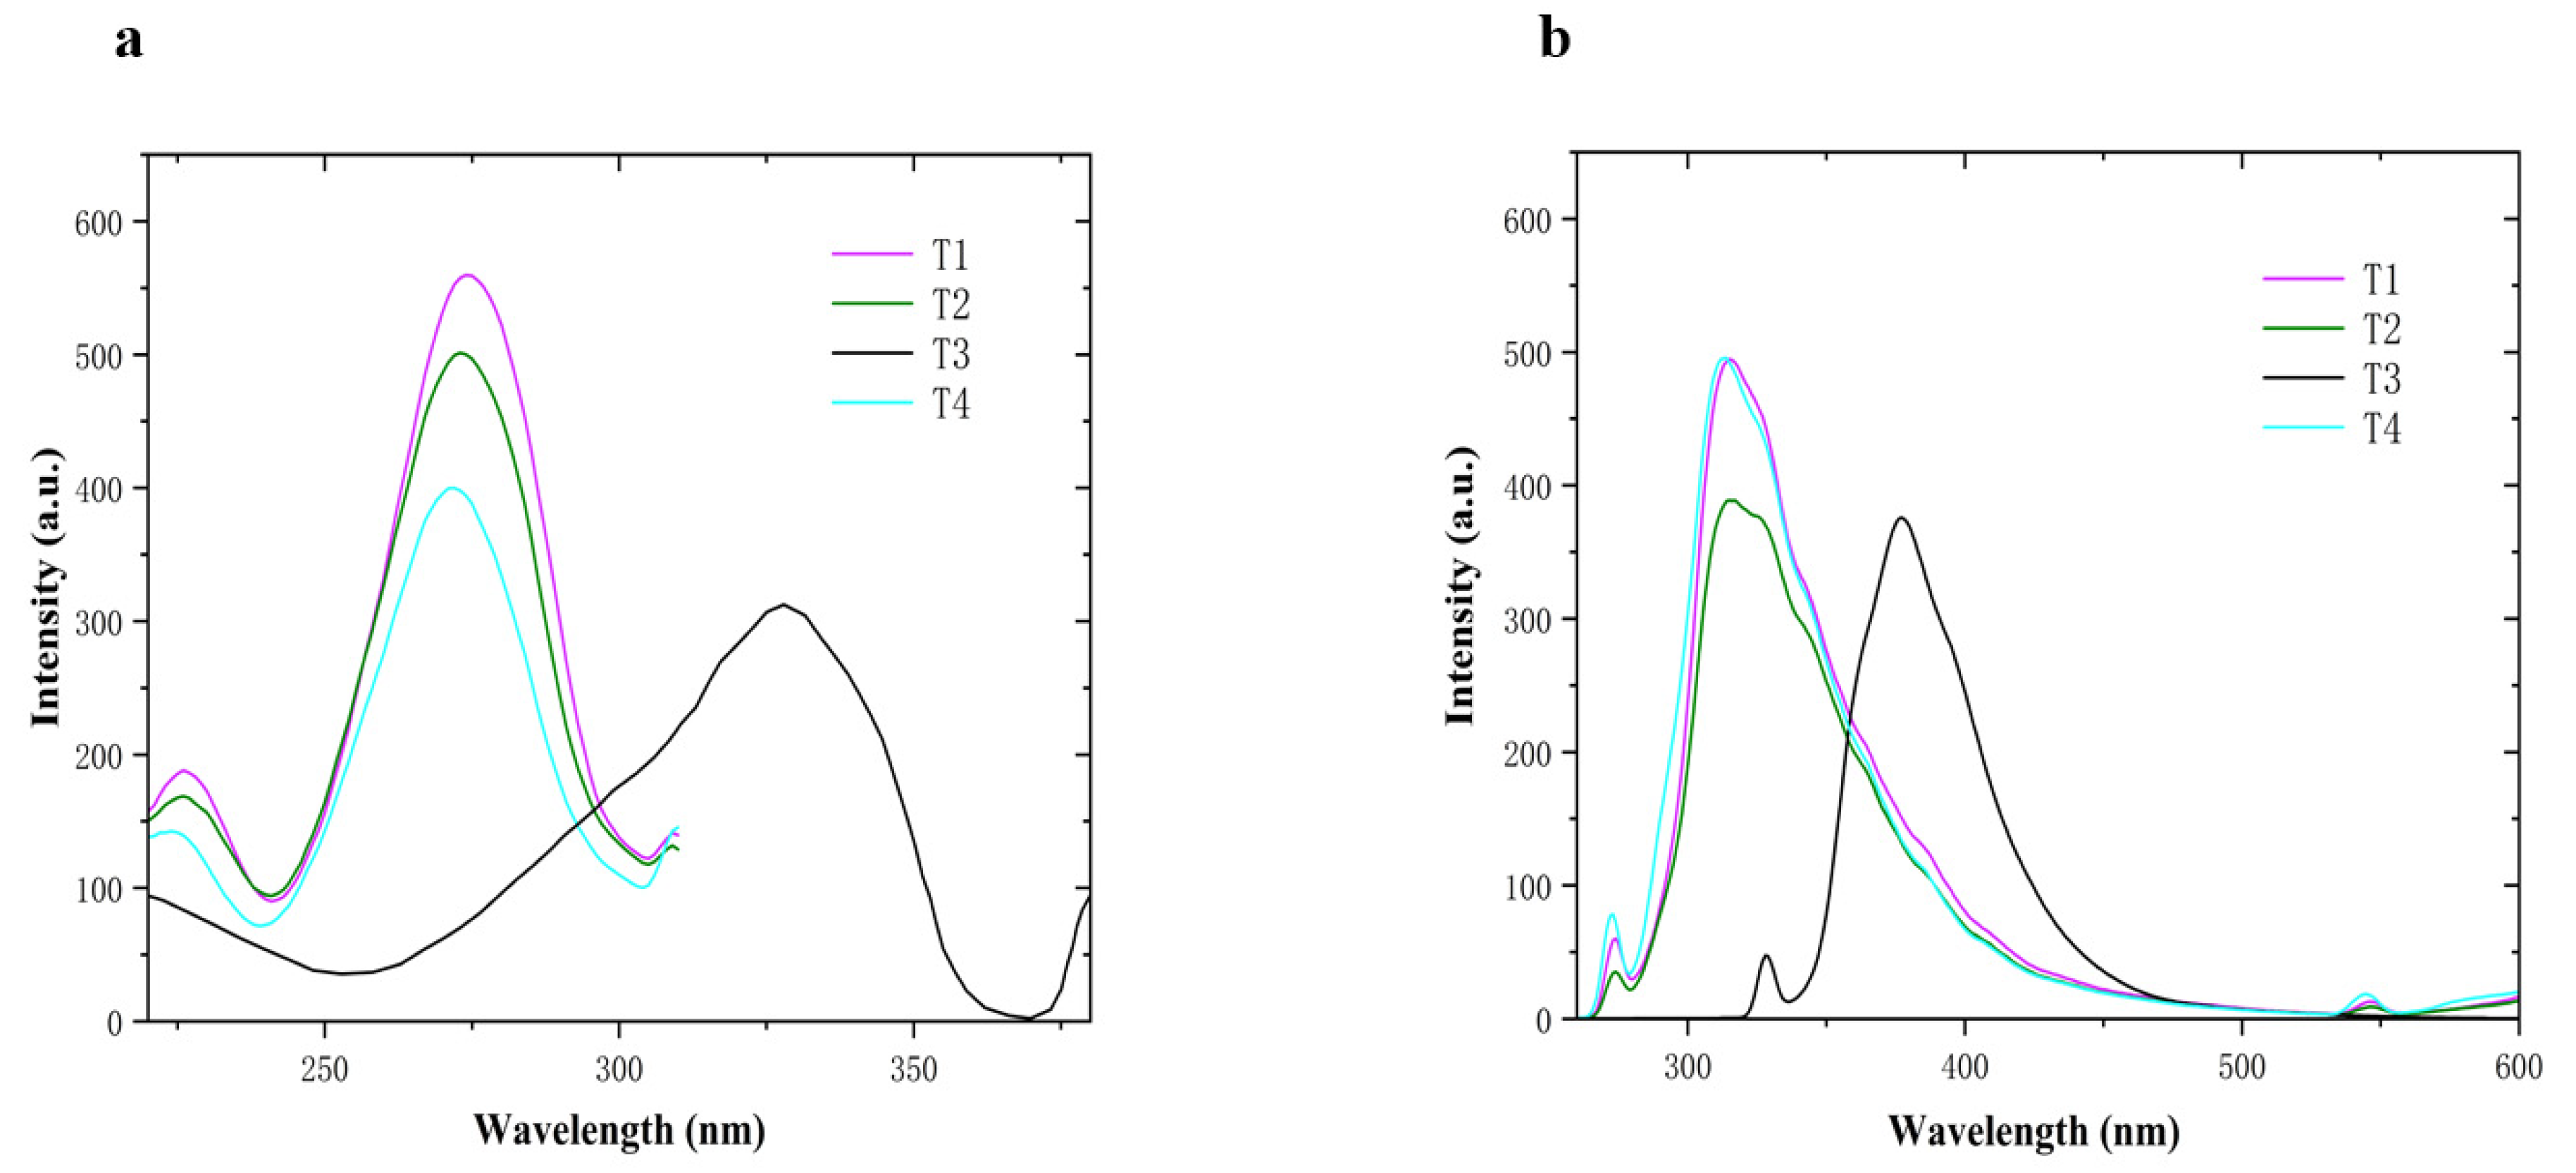
The excitation wavelength and emission wavelength are essential parameters for fluorescence detection. Choosing the appropriate excitation and emission wavelengths is important for both sensitivity and selectivity of detection. The best excitation wavelength of T1, T2, T3, and T4 is 273, 273, 327, and 272 nm, respectively, which corresponds to Figure 4a. The best emission wavelength of T1, T2, T3, and T4 is 310, 315, 377, and 313 nm, respectively, which corresponds to Figure 4b.

2.3. The HPLC-MS Results for the “Click” Reactions

The HPLC-MS results of the “click” reactions are shown in the Supplementary Materials, and the results of click 1 are shown in Figure S8. The results of click 2 are shown in Figure S9 and the results of click 3 are shown in Figure S10. Based on the HPLC-MS results, the optimal reaction time of the three “click” reactants were determined to be 60 min and the optimal reaction ratio was 1:1.

2.4. Determination of the Maximum Safe Concentration of the Drugs

The test results are shown in Figure 5. The cell survival rate was 80% when the copper sulfate concentration was 12 µmol/L. The IC50 values of A1, A2, A3, T1, T2, T3, and T4 on RAW264.7 cell are shown in Table 1. The IC50 values of the seven compounds on RAW264.7 cell were all above 80 µmol/L, indicating that they had no obvious toxicity to normal cells at 80 µmol/L. The cytotoxicity test indicated the safety and reliability of the obtained compounds as chemical diagnostic drugs to a certain extent and laid a foundation for subsequent experiments.

2.5. Antibacterial Activity on Agrobacterium Tumefaciens

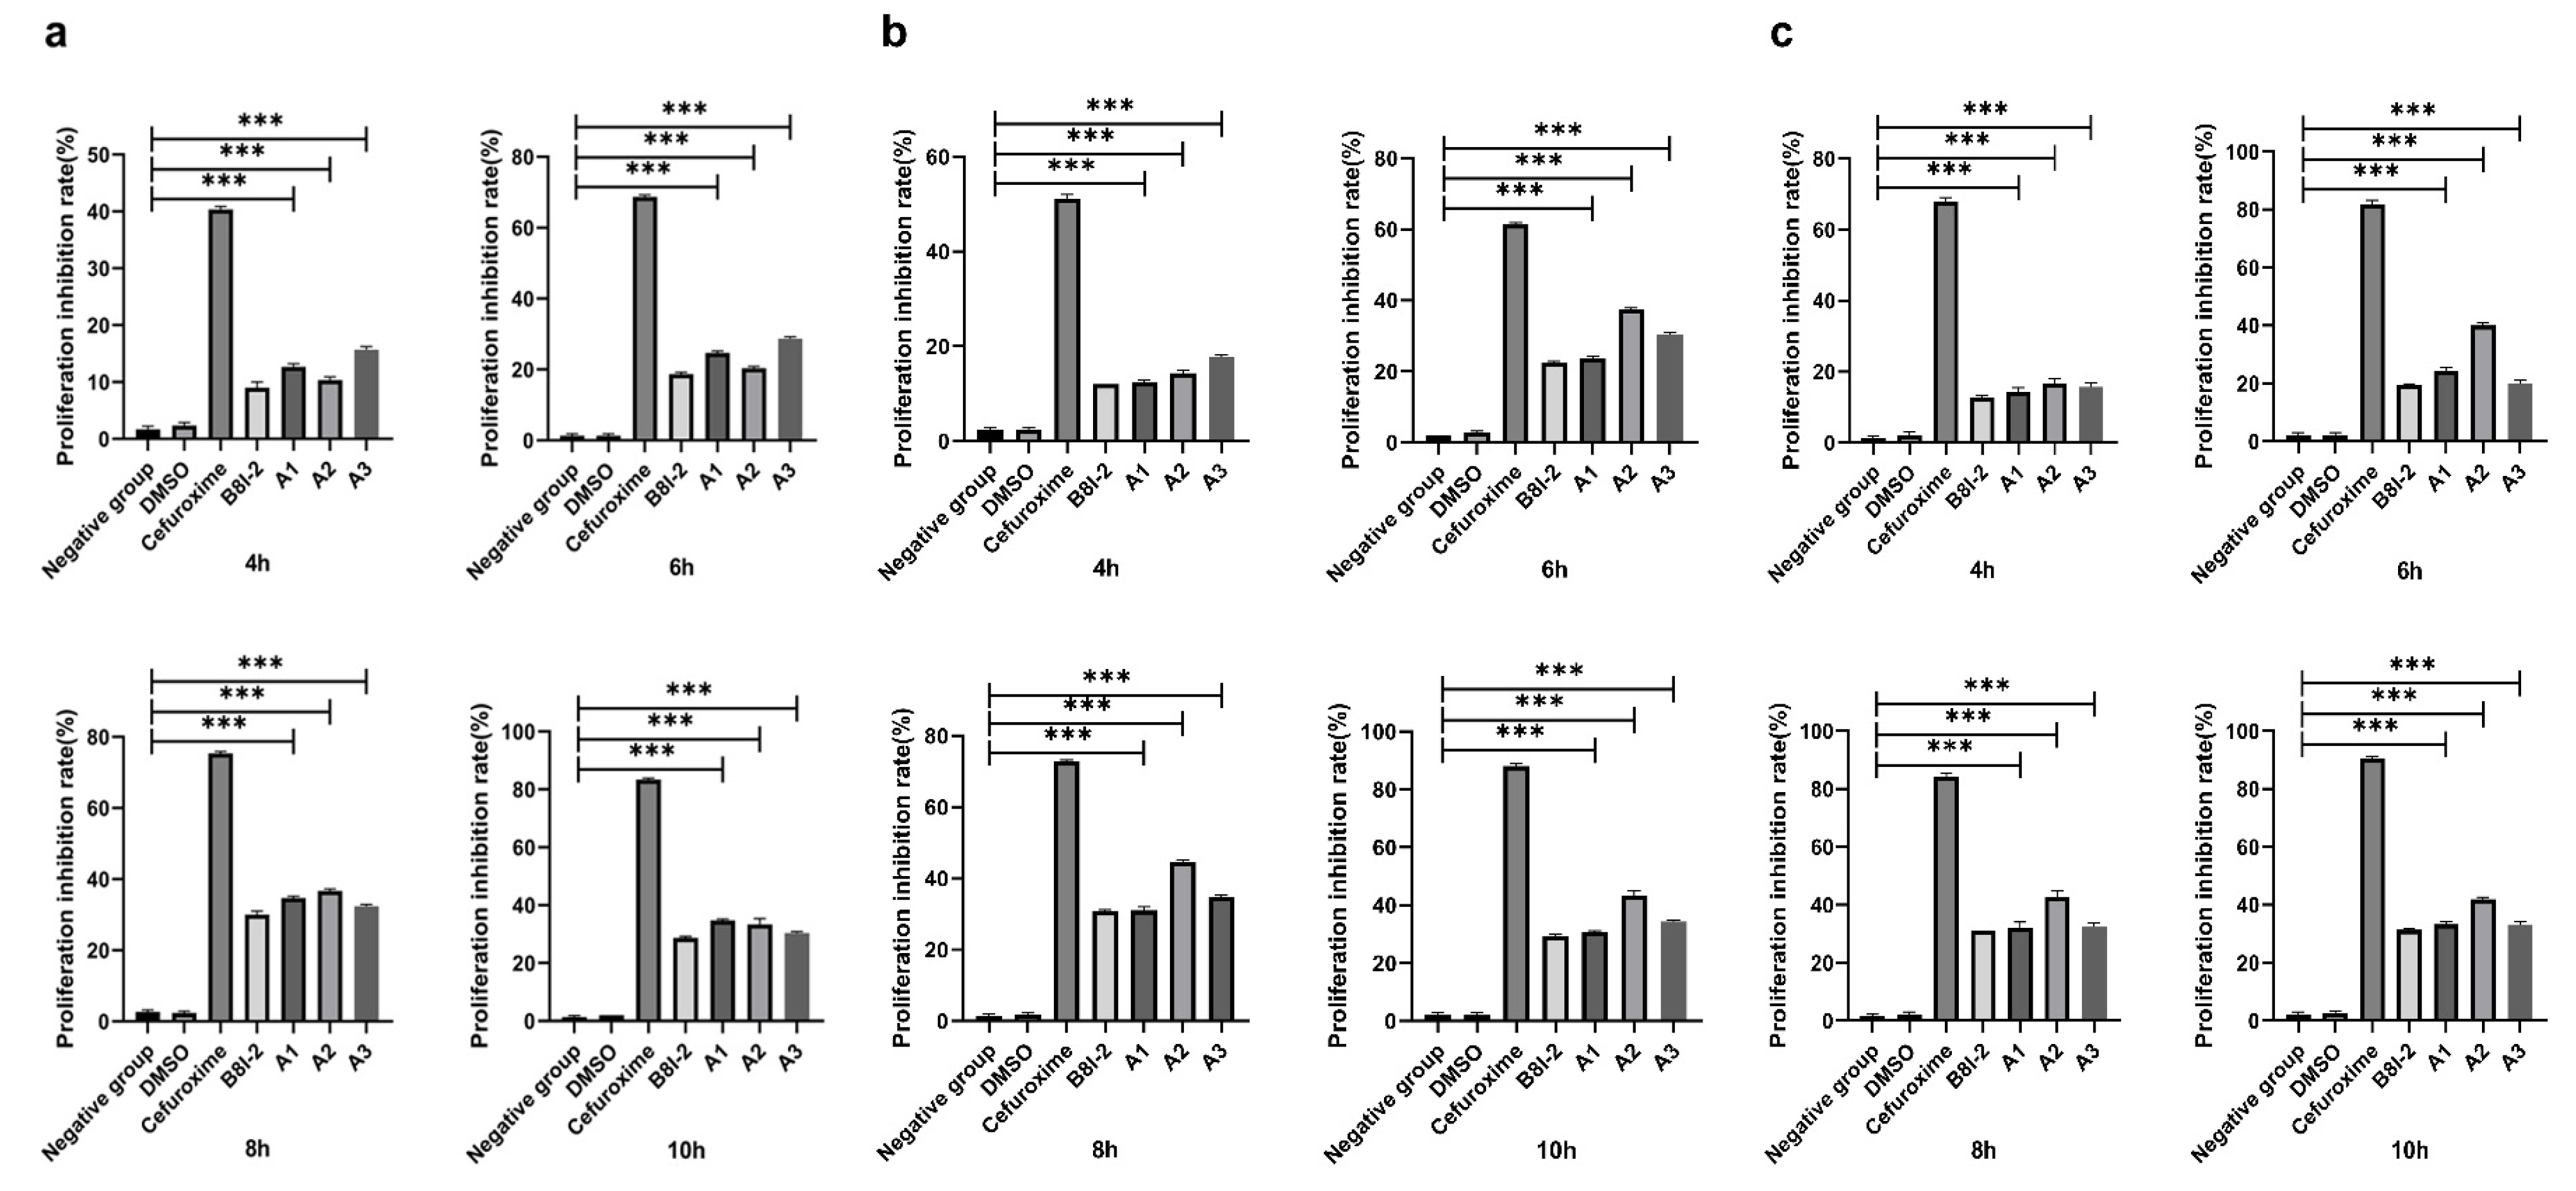
The antibacterial screening of A1A3 was evaluated by lysogeny broth (LB) microdilution assays. The results indicated an antibacterial effect exhibited by A1A3 against Agrobacterium tumefaciens. To judge the influence of antibacterial activity and reaction time on bacteriostatic effect, the data were obtained after exposure for 4, 6, 8, and 10 h at concentrations of 30, 50, and 100 µmol/L (Figure 6). There were significant differences between A1A3 and the negative control group (p < 0.001). Among them, all groups showed the highest difference at 8 h of culture, indicating that the antibacterial effect of the three inhibitors was relatively good at 8 h. After 8 h, the antibacterial rates of A1A3 tended to be stable or decreased. The antibacterial activity of A2 and A3 at a concentration of 50 µmol/L was relatively good when cultured for 8 h. The antibacterial activities of A2 and A3 were 45% and 35%, respectively. The antibacterial activity of A1 was the best when cultured for 8 h at a concentration of 30 µmol/L, and the antibacterial activity was 35%. In general, A2 had a better antibacterial activity than A1 and A3. From the overall trend of antibacterial activity, the antibacterial activity time of the A1A3 was 4–10 h.

2.6. Fluorescence Detection of Agrobacterium tumefaciens by Diagnostic Molecules

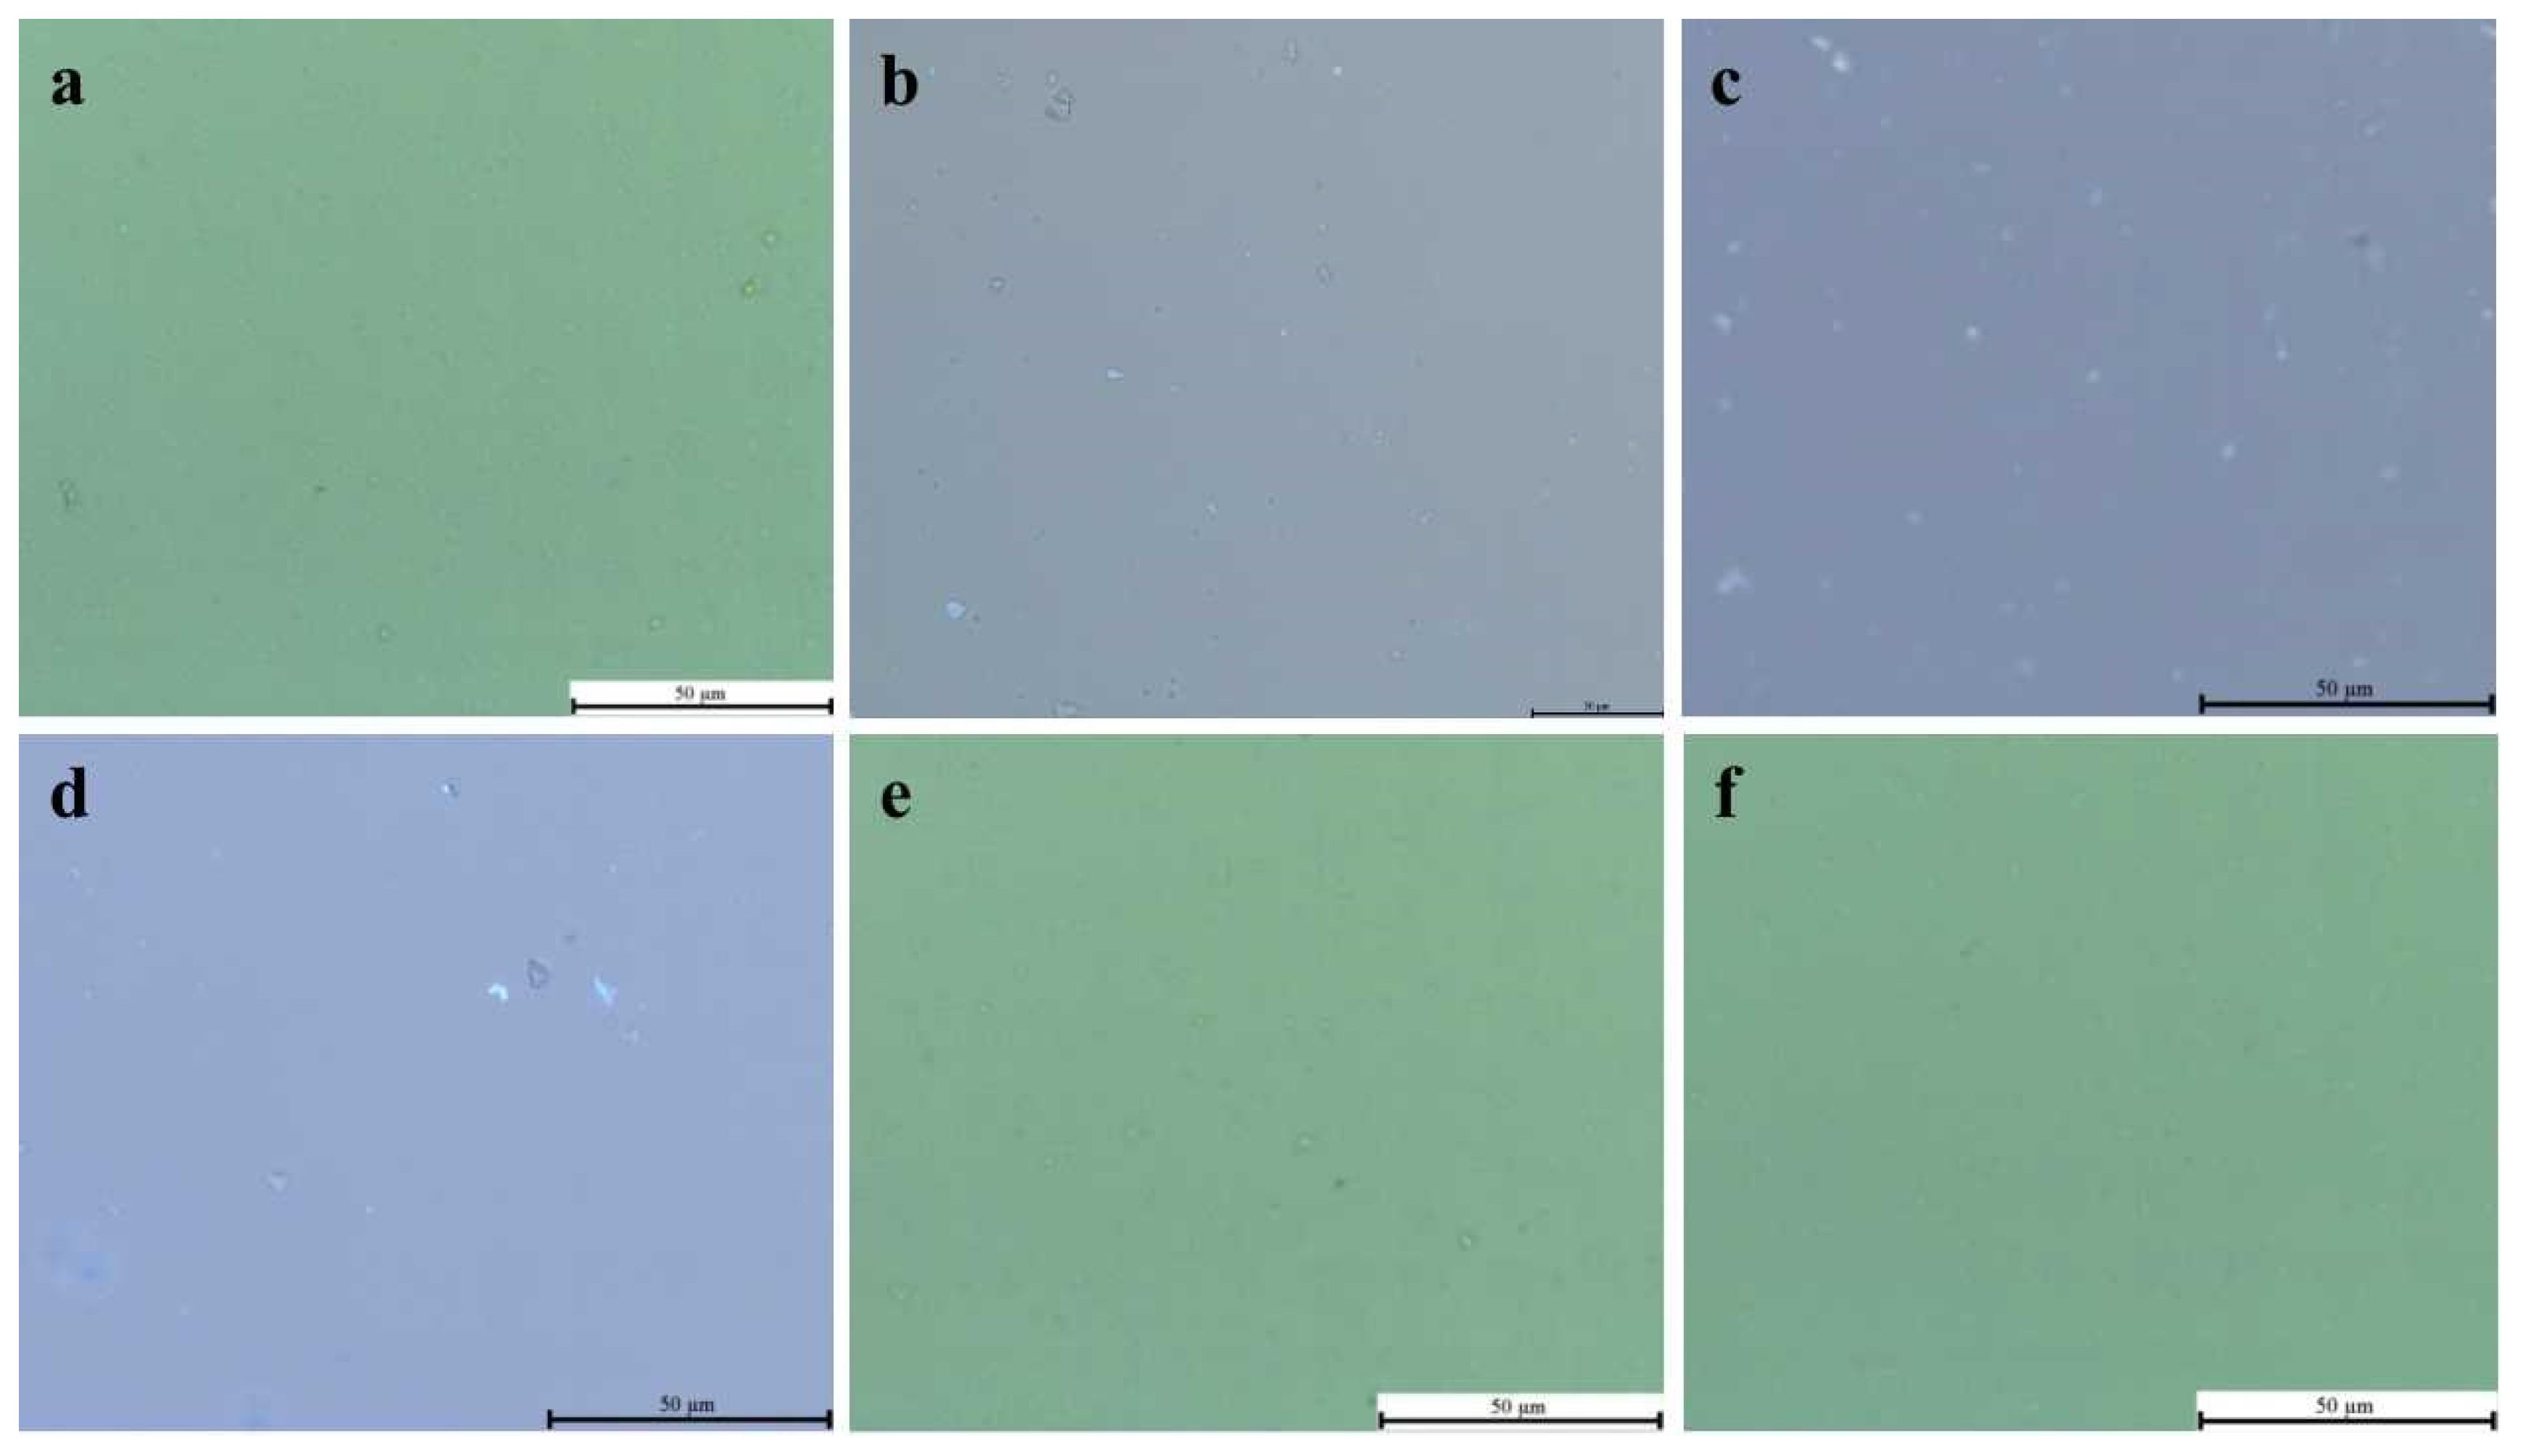
According to the results (Figure 7), the synthesized compound and fluorescent probe can be targeted and combined in the physiological condition to form diagnostic molecules for fluorescence detection of Agrobacterium tumefaciens. The blank group did not emit fluorescence, and the influence of Agrobacterium tumefaciens itself on the test was eliminated (Figure 7a). The results show that the diagnostic molecules formed by A1 and T4 emit fluorescence targeting Agrobacterium tumefaciens, but the fluorescence intensity is not strong; there is only weak fluorescence (Figure 7b). The diagnostic molecule formed by A2 and T4 had a better effect in targeting the fluorescence of Agrobacterium tumefaciens (Figure 7c). The diagnostic molecules formed by A3 and T3 emitted strong fluorescence targeting Agrobacterium tumefaciens (Figure 7d). The Agrobacterium tumefaciens with only T3 and T4 in the two groups did not emit fluorescence, so the influence of the fluorescent probe alone on the production of Agrobacterium tumefaciens was excluded (Figure 7e,f). It can be preliminarily judged that among the three diagnostic molecules, the diagnostic molecule formed by A3 and T3 has a better detection effect.

2.7. Docking of A1A3 to VirB8

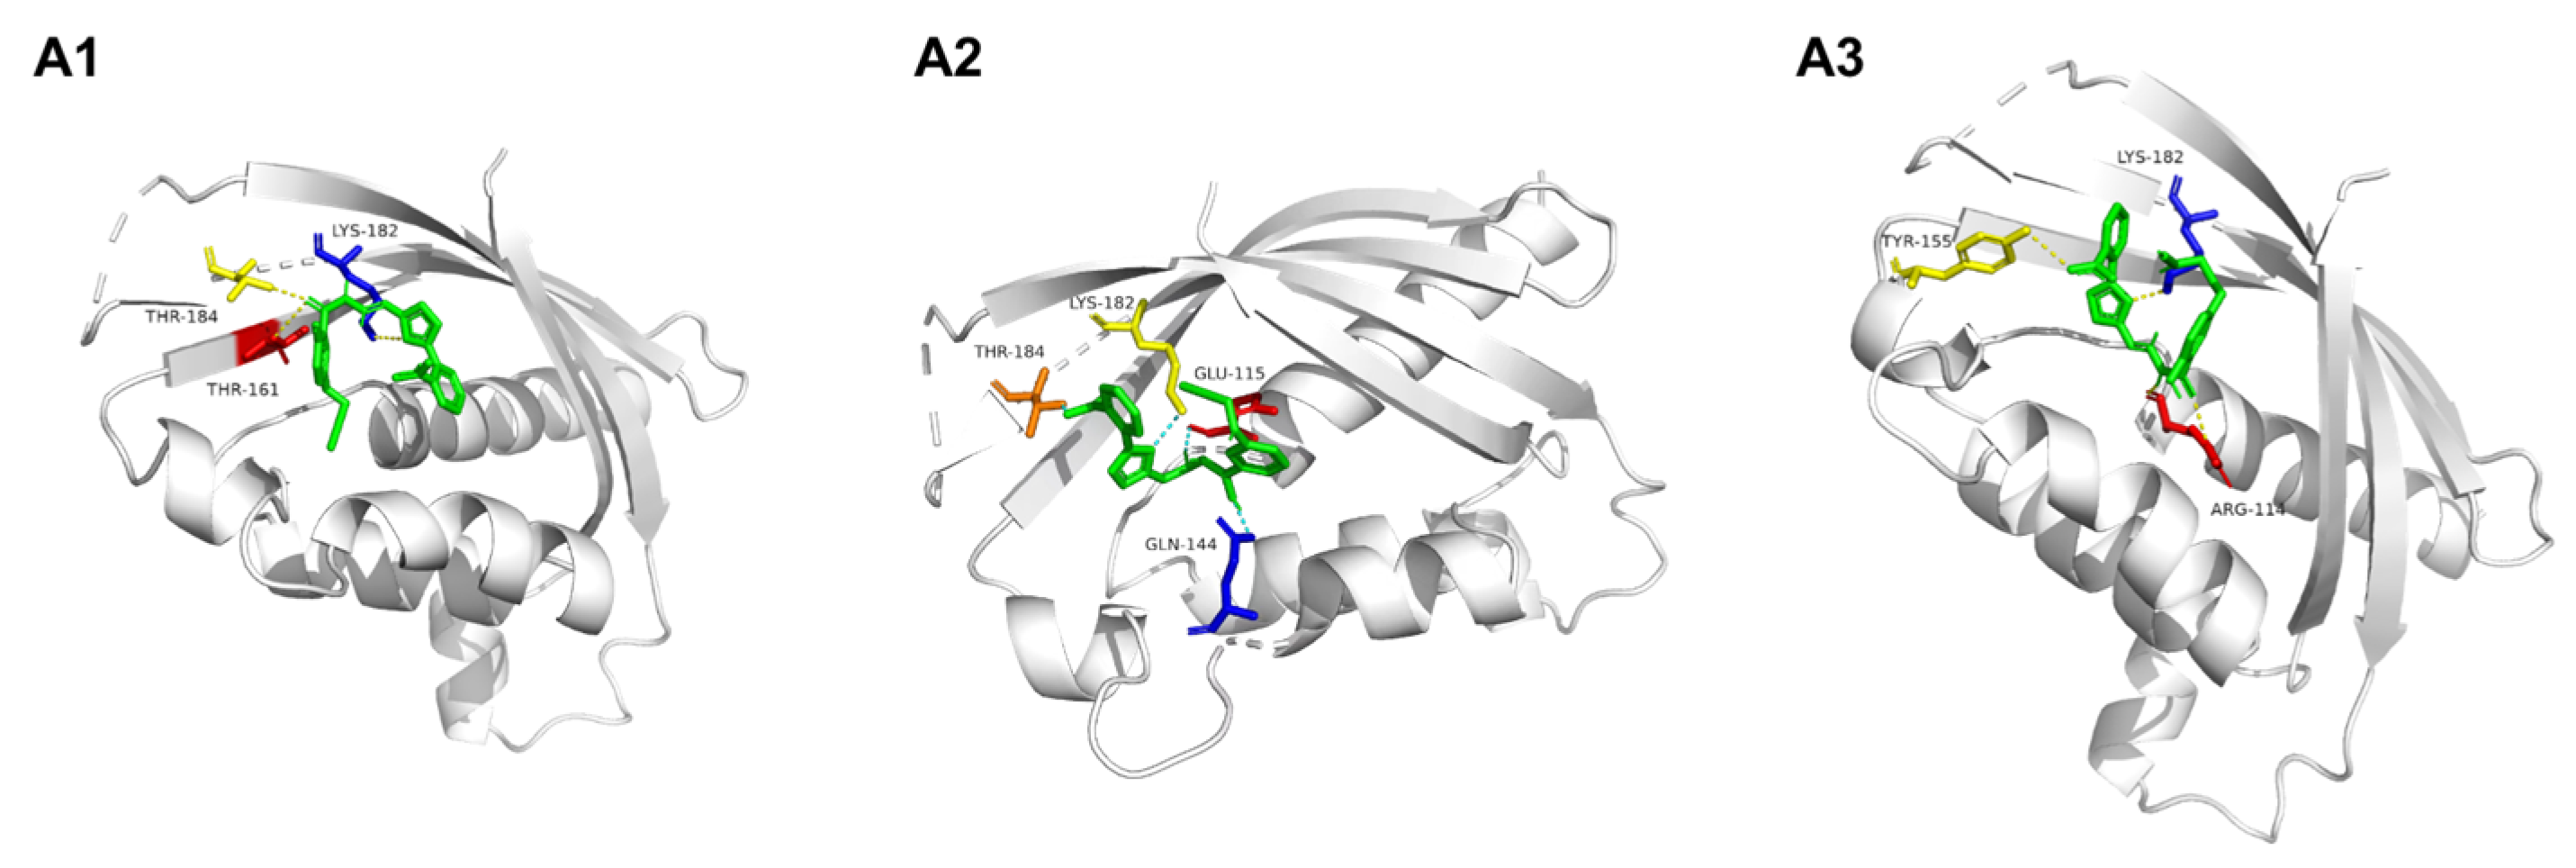
The compounds A1A3 were docked with the receptor VirB8 by AutoDock Vina software, and the docking pocket selected the binding pocket according to the crystal structure of 4AKY (Figure 8 and Table 2). The docking results showed that the binding energy of VirB8 to A1 was −6.4 kcal/mol, and A1 interacts with THR 161, LYS 182, and THR184 of VirB8 through hydrogen bonding. The binding energy of VirB8 to A2 is −7.3 kcal/mol. A2 interacts with GLU 115, GLN 144, LYS 182, and THR 184 of VirB8 through hydrogen bonding. The binding energy of VirB8 to A3 is −7.1 kcal/mol, which is hydrogen-bonded to ARG 114, TYR 155, and LYS 182 of VirB8. After docking, all compounds formed three to four hydrogen bonds with amino acid residues in the docking pocket of the VirB8 target protein, among which LYS 182 was the key amino acid residue, which could form hydrogen bond interactions with all compounds. The interaction between A2 and VirB8 was much stronger than that between A1 and A3.

3. Materials and Methods

3.1. Apparatus and Characterization

The 1H NMR and 13C NMR spectra were recorded at 25 °C in a Nuclear Magnetic Resonance Spectrophotometer (DRX-400, Bruker, Bremerhaven, Germany) at 400 MHz for 1H NMR in DMSO-d6 and 100 MHz for 13C NMR in CDCl3. Thin layer chromatography (TLC) was carried out on silica gel (GF254, Qingdao Haiyang Chemical Co., Ltd., Qingdao, China), and the spots were visualized with UV light at 254 nm. Fluorescence spectra were recorded on a fluorescence spectrophotometer (F-2710, Hitachi, Tokyo, Japan). UV-Vis spectrophotometer (UH5300, Hitachi, Tokyo, Japan) was used for the absorption measurements and the spectra were typically measured in the range of 190–1100 nm.

3.2. Synthesis

3.2.1. General Procedure for Synthesis of the Compounds (A1A3)

(E)-2-hydroxy-N’-((5-(2-nitrophenyl)furan-2-yl)methylene)-5-(prop-2-ynyloxy)benzohydrazide (A1)

O-Nitroaniline (690.65 mg, 5 mmol), 15% hydrochloric acid solution (3 mL), and distilled water (4.5 mL) were heated in an oil bath at 100 °C for 1 h. After cooling to room temperature, 30% NaNO2 (1.2 mL) was added dropwise in an ice bath. Next, the mixture of furfural (480.4 µL, 5 mmol) and copper chloride (134 mg, 1 mmol) was added, and it reacted overnight. After filtering, the residual solid species were removed by extraction in anhydrous ethanol and a crude residue B (582 mg, 84%) was acquired.
Methyl 2,5-dihydroxybenzoate (3.36 g, 20 mmol), anhydrous acetone (50 mL), K2CO3 (6.63 mg, 48 mmol), and 3-bromopropyne (0.86 mL, 10 mmol) were stirred and heated under reflux for 12 h (monitored by TLC). The residual K2CO3 was removed by filtering, and the solvent was removed by vacuum spin evaporation; the organic mixture was purified by column chromatography over silica gel (ethyl acetate/petroleum ether = 1/3), and product 1 (2.31 g, 85%) was acquired.
Product 1 (2.3 mg, 11.2 mmol), hydrazine hydrate (1 mL, 20 mmol), and anhydrous methanol (20 mL) were stirred and heated under reflux overnight (monitored by TLC). After cooling down to room temperature, distilled water (20 mL) was added. The reaction mixture was extracted with CH2Cl2 (3 × 20 mL). The combined organic layers were dried over MgSO4, and a crude residue product 2 (1.8 g, 92%) was acquired.
Product 2 (1.5 g, 7 mmol), product B (1.519 g, 7 mmol), and anhydrous methanol (10 mL) were stirred under reflux for 2 h. After filtering, the residual solid species were removed by extraction in anhydrous ethanol and acquired compound A1 (1.1 g, 92%).
Yellow solid; m.p. 161–163 °C; 1H NMR (400 MHz, DMSO-d6): δ 11.80 (s, 1H, NH), 11.31 (s, 1H, OH), 8.38 (s, 1H, CH), 7.97 (d, J = 8.00 Hz, 1H, CH), 7.91 (d, J = 7.60 Hz, 1H, CH), 7.80 (t, J = 7.60 Hz, 1H, ArH), 7.65 (t, J = 7.60 Hz, 1H, ArH), 7.47 (s, 1H, ArH), 7.13–7.16 (m, 1H, ArH), 7.05 (s, 1H, ArH), 6.94 (d, J = 9.20 Hz, 1H, CH), 4.78 (s, 2H, CH2), 3.58 (s, 1H, CH); 13C NMR (100 MHz, DMSO-d6) δ: 161.11, 148.09, 138.71, 133.74, 130.03, 124.66, 123.01, 118.62, 116.97, 112.96, 70.03, 22.18, 11.16, 1.03; MS calculated value: 405.10; MS-ESI (m/z): 404.30 {[M − H]}; Anal. calcd for C21H15N3O6: C 62.22, H 3.73, N 10.37, O 23.68; found C 62.28, H 3.92, N 10.93, O 23.91.

(E)-N’-((5-(2-nitrophenyl)furan-2-yl)methylene)-3-(prop-2-ynylamino)benzohydrazide (A2)

Ethyl 3-aminobenzoate (3.3 g, 20 mmol), K2CO3 (6.63 mg, 48 mmol), 3-bromopropyne (1.72 mL, 20 mmol), and anhydrous acetone (30 mL) were heated for 12 h (monitored by TLC). The residual K2CO3 was removed by filtering, and the solvent was removed by vacuum spin evaporation; the organic mixture was purified by column chromatography over silica gel (ethyl acetate/petroleum ether = 1/3), and product 3 (2.31 g, 75%) was acquired.
Product 3 (2.3 g, 11.3 mmol), hydrazine hydrate (1 mL, 20 mmol), and anhydrous methanol (30 mL) were stirred and heated under reflux overnight (monitored by TLC). After cooling down to room temperature, distilled water (30 mL) was added. The reaction mixture was extracted with CH2Cl2 (3 × 20 mL). The combined organic layers were dried over Na2SO4, and a crude residue product 4 (1.5 g, 68%) was acquired.
Product 4 (1.5 g, 7.8 mmol), product B (1.519 g, 7 mmol), and anhydrous methanol (10 mL) were stirred under reflux for 2 h. After filtering, the residual solid species were removed by extraction in anhydrous ethanol, and compound A2 (1.1 g, 92%) was acquired.
Yellow solid; m.p. 190–191 °C; 1H NMR (400 MHz, DMSO-d6): δ 11.74 (s, 1H, NH), 8.38 (s, 1H, ArH), 7.89–7.97 (m, 2H, ArH), 7.79 (t, J = 7.2 Hz, 1H,ArH), 7.65 (t, J = 7.2 Hz, 1H, ArH), 7.65 (t, J = 7.2 Hz, 1H, ArH), 7.26 (t, J = 7.2 Hz, 1H, ArH), 7.05–7.14 (m, 4H, ArH, CH), 6.86 (s, 1H, ArH), 6.72 (s, 1H, NH), 6.85 (d, J = 7.2 Hz, 1H, CH), 6.30 (s, 1H, NH), 3.94 (s, 2H, CH2), 3.09 (s, 1H, CH); 13C NMR (100 MHz, DMSO-d6) δ:151.29, 149.86, 148.34, 147.45, 137.38, 136.28, 133.23, 129.79, 129.31, 124.72, 122.87, 116.40, 115.95, 114.99, 112.72, 82.37, 73.61, 32.40; MS calculated value: 388.12; MS-ESI (m/z): 387.21 {[M − H]}; Anal. calcd for C21H16N4O4: C 64.94, H 4.15, N 14.43, O 16.48; found C 65.13, H 4.22, N 14.53, O 16.71.

(E)-5-(2-azidoethoxy)-2-hydroxy-N’-((5-(2-nitrophenyl)furan-2-yl)methylene)benzohydrazide (A3)

Methyl 2,5-dihydroxybenzoate (3.36 g, 20 mmol), 1-Bromo-2-chloroethane (844 µL, 10 mmol), K2CO3 (2.76 g, 20 mmol), and anhydrous acetone (30 mL) were stirred under reflux for 14 h (monitored by TLC). The residual K2CO3 was removed by filtering, and the solvent was removed by vacuum spin evaporation; the organic mixture was purified by column chromatography over silica gel (ethyl acetate/petroleum ether = 1/5), and product 5 (2.87 g, 84%) was acquired.
Product 5 (2.5 g, 11 mmol), hydrazine hydrate (500 µL, 11 mmol), and anhydrous methanol (30 mL) were stirred under reflux overnight. After cooling down to room temperature, distilled water (20 mL) was added, and the reaction mixture was extracted with CH2Cl2 (3 × 20 mL). The combined organic layers were dried over Na2SO4, and a crude residue product 6 (1.8 g, 78%) was acquired.
Product 6 (1.5 g, 6.5 mmol), product B (1.5 g, 7 mmol), and anhydrous methanol (10 mL) were stirred under reflux for 2 h and filtered, and product 7 (1.2 g, 92%) was acquired.
Product 7 (1 g, 2.32 mmol), sodium azide (325 mg, 5 mmol), and N,N-dimethylformamide (15 mL) were stirred at 60 °C overnight; distilled water (20 mL) was added. The reaction mixture was extracted with CH2Cl2 (3 × 20 mL). The combined organic layers were dried over Na2SO4. The solvent was removed by vacuum spin evaporation. The organic mixture was purified by column chromatography over silica gel (ethyl acetate/petroleum ether = 1/5), and compound A3 (800 mg, 80%) wasd acquired.
Brown solid; m.p. 202–204 °C; 1H NMR (400 MHz, DMSO-d6): δ 11.82 (s, 1H, CH), 11.35 (s, 1H, NH), 8.39 (s, 1H ArH), 7.98 (d, J = 5.2 Hz, 1H, ArH), 7.91 (d, J = 5.2 Hz, 1H, CH), 7.80 (t, J = 5.2 Hz, 1H, ArH), 7.65 (t, J = 5.2 Hz, 1H, ArH), 7.45 (s, 1H, ArH), 7.10–7.14 (m, 2H, ArH), 7.06 (s, 1H ArH), 6.95 (d, J = 6.0 Hz, 1H, CH), 4.16 (m, 2H, CH2), 3.66 (m, 2H, CH2); 13C NMR (100 MHz, DMSO-d6) δ: 164.62, 153.63, 150.34, 147.52, 138.54, 133.27, 130.41, 129.86, 124.70, 121.72, 118.69, 115.86, 113.83, 112.80, 67.96, 50.13; MS calculated value: 436.11; MS-ESI (m/z): 435.33 {[M − H]}; Anal. calcd for C20H16N6O6: C 55.05, H 3.70, N 19.26, O 22.00; found C 55.23, H 3.92, N 19.93, O 23.31.

3.2.2. General Procedure for the Synthesis of the Probes (T1T4)

(E)-2-((2-(2-nitrobenzyloxy)phenylimino)methyl)-5-(2-azidoethoxy)phenol (T1)

2,4-Dihydroxybenzaldehyde (828.72 mg, 6 mmol), 1,3-Dibromopropane (1.6 g, 8 mmol), NaHCO3 (504 mg, 6 mmol), and anhydrous acetone (30 mL) were stirred at 60 °C for 48 h. After cooling down to room temperature, the residual NaHCO3 was removed by filtering, and the solvent was removed by vacuum spin evaporation; the organic mixture was purified by column chromatography over silica gel (ethyl acetate/petroleum ether = 1/5), and product 8 (723 mg, 84%) was acquired.
In the presence of formic acid (2 d), product 8 (700 mg, 2.7 mmol), 2-Aminophenol (294.3 mg, 2.7 mmol), and anhydrous ethanol (15 mL) were stirred under reflux at 90 °C for 2 h and filtered, and product 9 (650 mg, 86%) was acquired.
Product 9 (600 mg, 1.7 mmol), K2CO3 (264 mg, 1.7 mmol), 2-Nitrobenzyl Bromide (363.8 mg, 1.7 mmol), and anhydrous acetone (15 mL) were stirred under reflux with N2 for 12 h, cooled down to room temperature, and evaporated under vacuum; the mixture of sodium hydroxide (0.2 mmol) and water (100 mL) was added. The reaction mixture was extracted with ethyl acetate. The combined organic layers were washed with saturated brine until neutral and dried over Na2SO4. Filtered and evaporated, the organic mixture was purified by column chromatography over silica gel (ethyl acetate/petroleum ether = 1/5), and product 10 (459 mg, 73%) was acquired.
Product 10 (400 mg, 0.94 mmol), sodium azide (292.5 mg, 4.5 mmol), and N, N-dimethylformamide (10 mL) were stirred at 60 °C for 8 h. After cooling down to room temperature, distilled water (20 mL) was added; the reaction mixture was extracted with CH2Cl2 (3 × 20 mL). The combined organic layers were dried over Na2SO4, and probe T1 (380 mg, 84%) was acquired.
Brown red solid; m.p. 160–161 °C; 1H NMR (400 MHz, DMSO-d6): δ 9.00 (s, 1H, OH), 7.67 (d, J = 8.0 Hz, 1H, ArH), 7.59 (t, J = 8.0 Hz, 1H, ArH), 7.52 (d, J = 8.0 Hz, 1H, ArH), 7.43 (d, J = 8.0 Hz, 1H, ArH), 6.97–7.02 (m, 1H, ArH), 6.92–6.96 (m, 1H, ArH), 6.85–6.89 (m, 1H, ArH), 6.44 (s, 1H, CH), 6.20(s, J = 2.4 Hz, 1H, ArH), 6.08–6.14 (m, 1H, ArH), 4.49 (t, J = 6.0 Hz, 2H, CH2), 4.01 (d, J = 6.0 Hz, 2H, CH2), 3.51 (t, J = 8.0 Hz, 2H, CH2), 2.01–2.07 (m, 2H, CH2); 13C NMR (100 MHz, DMSO-d6) δ: 154.01 (t, J = 6.0 Hz, 2H, CH2), 9.18, 156.34, 149.66, 142.96, 135.17, 132.79, 130.27, 129.84, 129.72, 123.97, 122.01, 117.31, 117.17, 116.35, 115.16, 105.71, 101.87, 74.78, 64.86, 48.16, 40.26, 40.12, 39.38, 39.84, 39.70, 39.56, 28.54; MS calculated value: 437.14; MS-ESI (m/z): 438.0146 {[M + H]+}; Anal. calcd for C23H21N5O5: C 61.74, H 4.73, N 15.65, O 17.88; found C 62.23, H 4.92, N 15.93, O 18.01.

(E)-2-((2-hydroxyphenylimino)methyl)-5-(prop-2-ynyloxy)phenol (T2)

2,4-Dihydroxybenzaldehyde (414 mg, 3 mmol), 3-bromopropyne (238 µL, 3 mmol), Na2CO3 (504 mg, 6 mmol), and anhydrous acetone (10 mL) were stirred under reflux at 60 °C for 12 h. After cooling down to room temperature, the residual Na2CO3 was removed by filtering and the solvent was removed by vacuum spin evaporation. The organic mixture was purified by column chromatography over silica gel (ethyl acetate/petroleum ether = 1/5), and product 11 (323 mg, 83%) was acquired.
In the presence of formic acid (2 d), product 11 (300 mg, 1.7 mmol), 2-Aminophenol (294.3 mg, 2.7 mmol), and anhydrous ethanol (15 mL) were stirred under reflux at 90 °C for 2 h and filtered, and probe T2 (254 mg, 96%) was acquired.
Golden yellow solid; m.p. 242–244 °C; 1H NMR (400 MHz, CDCl3): δ 14.42 (s, 1H, OH), 9.75 (s, 1H, OH), 8.87 (s, 1H, CH), 7.49 (d, 1H, J = 8.8 Hz, ArH), 7.35 (d, 1H, J = 8.0 Hz, ArH), 7.10 (t, 1H, J = 7.2 Hz, ArH), 6.95 (d, 1H, J = 7.6 Hz, ArH), 6.87 (t, 1H, J = 7.6 Hz, ArH), 6.41–6.52 (m, 2H, ArH), 4.85 (s, 1H, CH2), 3.62 (s, 1H, CH); 13C NMR (100 MHz, DMSO-d6) δ: 165.62, 162.01, 160.47, 150.98, 134.43, 134.30, 127.92, 120.09, 119.54, 116.86, 113.97, 107.39, 102.54, 79.31, 79.05, 56.08; MS calculated value: 267.09; MS-ESI (m/z): 268.0332 {[M + H]+}; Anal. calcd for C16H13NO3: C 71.90, H 4.90, N 5.24, O 17.96; found C 72.03, H 4.98, N 5.93, O 18.21.

2-(benzo[d]thiazol-2-yl)-5-(prop-2-ynyloxy)phenol (T3)

Product 11 (700 mg, 4 mmol), 2-Aminophenol (500 mg, 4 mmol), DMSO (10 mL), and AgNO3 (18 mg) were stirred. A change in color of the solution to reddish brown after the inferred irradiation was observed. Filtered and put under infrared light to dry overnight, the organic mixture was purified by column chromatography over silica gel (ethyl acetate/petroleum ether = 1/5), and probe T3 (603 mg, 82%) was acquired.
Yellow solid; m.p. 179–180 °C; 1H NMR (400 MHz, CDCl3): δ 7.88 (d, J = 8.00 Hz, 1H, ArH), 7.81 (d, J = 7.60 Hz, 1H, ArH), 7.54 (d, J = 8.80 Hz, 1H, ArH), 7.42 (t, J = 8.00 Hz, 1H, ArH), 7.31 (t, J = 7.20 Hz, 1H, ArH), 6.61 (s, 1H, ArH), 6.54 (d, J = 8.80 Hz, 1H, ArH), 4.68 (s, 2H, CH2), 2.50 (s, 1H, CH); 13C NMR (100 MHz, DMSO-d6) δ: 166.00, 161.07, 158.44, 151.84, 133.98, 130.27, 125.26, 122.42, 122.14, 112.20, 108.18, 102.29, 79.30, 79.10, 55.75; MS calculated value: 281.05; MS-ESI (m/z): 280.0267 {[M − H]}; Anal. calcd for C16H11NO2S: C 68.31, H 3.94, N 4.98, O 11.37, S 11.40; found C 68.53, H 4.12, N 5.03, O 11.41, S 11.61.

(E)-5-(3-azidopropoxy)-2-((2-hydroxyphenylimino)methyl)phenol (T4)

Product 8 (400 mg, 1.55 mmol), sodium azide (292.5 mg, 4.5 mmol), and N, N-dimethylformamide (10 mL) were stirred at 60 °C for 8 h. After cooling down to room temperature, distilled water (20 mL) was added; the reaction mixture was extracted with CH2Cl2 (3 × 20 mL). The combined organic layers were dried over Na2SO4, and product 12 (350 mg, 84%) was acquired.
In the presence of formic acid (2 d), product 12 (300 mg, 1.45 mmol), 2-Aminophenol (158 mg, 1.45 mmol), and anhydrous ethanol (10 mL) were stirred under reflux at 90 °C for 2 h, filtered, and put under infrared light to dry overnight, and probe T4 (230 mg, 86%) was acquired.
Yellow solid; m.p. 181–183 °C; 1H NMR (400 MHz, CDCl3): δ 8.57 (s, 1H, CH), 7.32 (d, J = 8.40 Hz, 1H, ArH), 7.19 (t, J = 7.60 Hz, 1H, ArH), 7.14 (d, J = 6.80 Hz, 1H, ArH), 7.05 (d, J = 8.40 Hz, 1H, ArH), 6.95 (t, J = 7.60 Hz, 2H, ArH), 6.51–6.55 (m, 2H, ArH), 4.11 (t, J = 6.00 Hz, 2H, CH2), 3.53 (t, J = 6.40 Hz, 2H, CH2), 2.08 (m, 2H, CH2); 13C NMR (100 MHz, DMSO-d6) δ: 165.83, 163.22, 160.41, 150.95, 134.43, 134.24, 127.77, 119.91, 119.40, 116.82, 113.56, 107.22, 102.00, 65.26, 48.11, 28.47; MS calculated value: 312.12; MS-ESI (m/z): 311.22 {[M − H]}; Anal. calcd for C16H16N4O3: C 61.53, H 5.16, N 17.94, O 15.37; found C 61.93, H 5.92, N 13.23, O 15.71.

3.3. Determination of the UV Absorption Wavelength of Inhibitors

The sample of the compounds (A1A3) was diluted to 1 × 10⁻⁵ mg/mL. After thorough mixing, the target molecules were detected using a UV spectrophotometer at UV absorption wavelengths. The volume of the sample needed to be greater than 2/3 of the cuvette volume. All experiments were performed in triplicate.

3.4. Fluorescence Intensity Measurement by Fluorescence Spectrophotometer

The sample of probes (T1T4) was diluted to 1 × 10⁻⁵ mg/mL for fluorescence, excitation, and emission spectra measurement by a fluorescence spectrophotometer. All experiments were performed in triplicate.

3.5. In Vitro Validation of the “Click” Reaction and Optimization of Conditions

In this study, the “click” reaction was successfully completed in the organism by simulating the environment. The ratio of reactant concentration, reaction time, and catalyst dosage was investigated in 0.5% PBS solution at 37 °C.
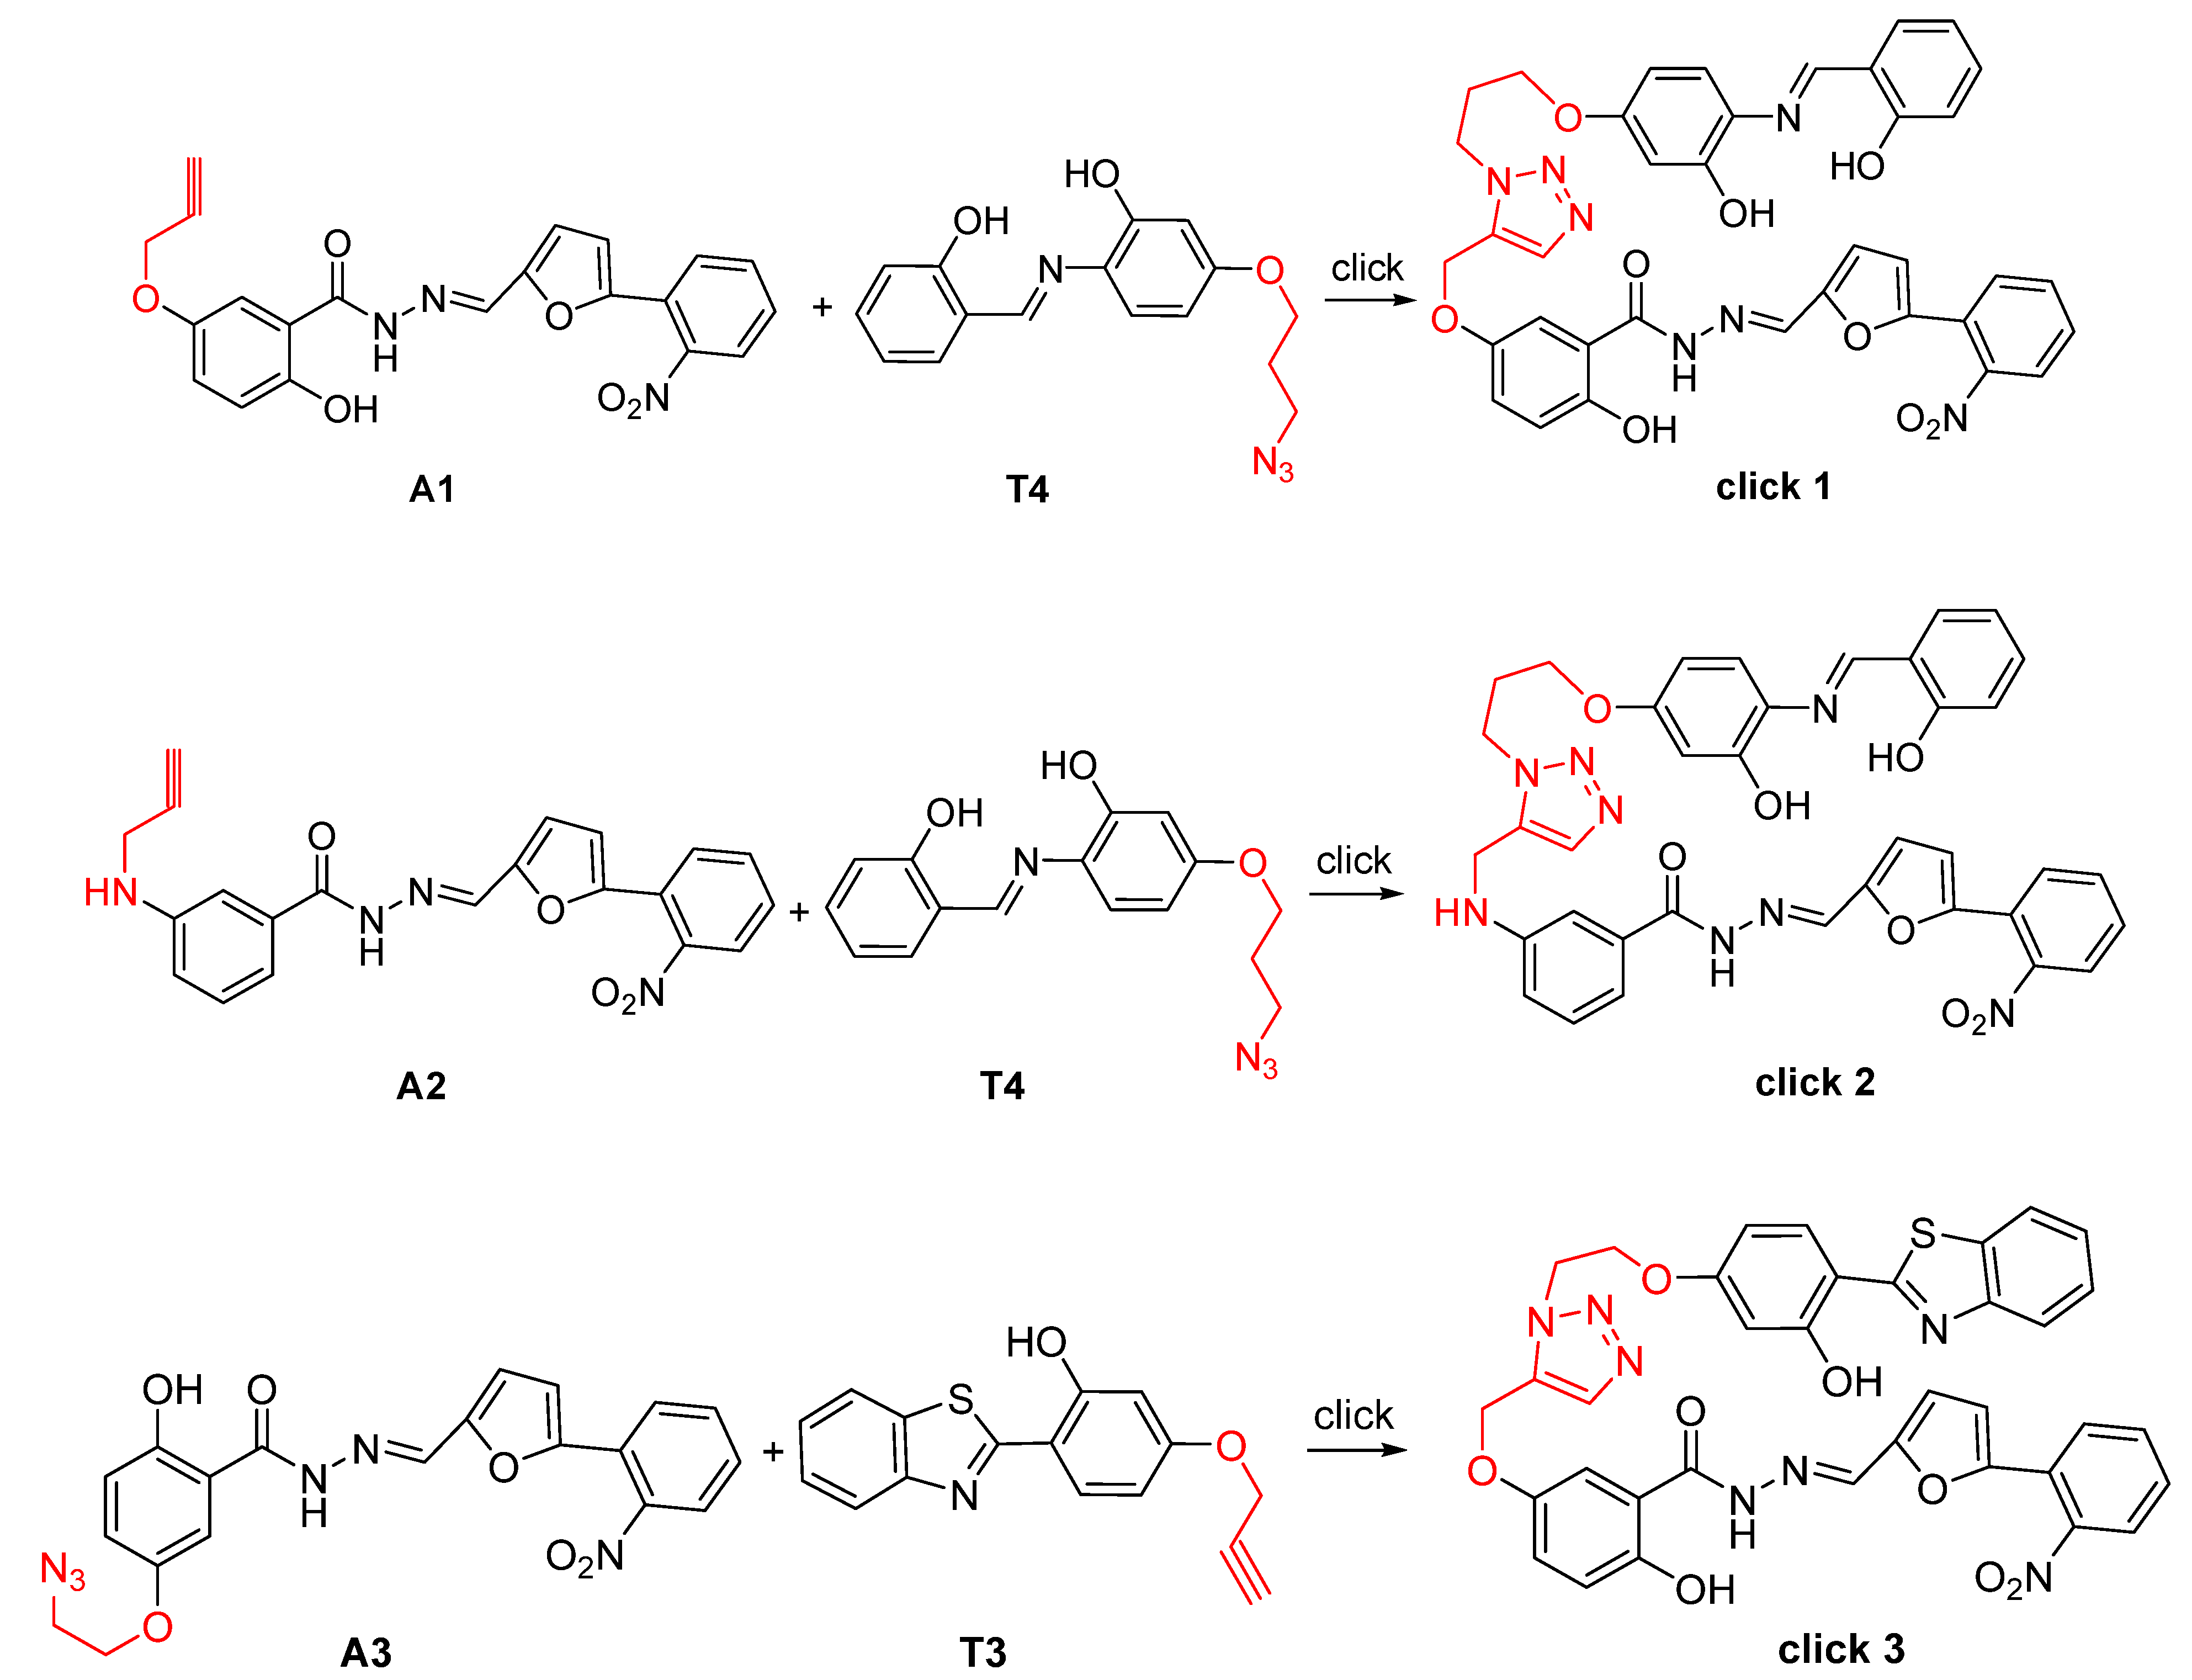
First, 10 µL T4 solutions with different molar concentrations were prepared, i.e., 30, 60, and 90 µmol/L and mixed with 10 μL A1 (30 µmol/L) in the 0.5 mL of 0.5% PBS, respectively. Then, 15 µL of sodium ascorbate (10 µmol/L) and 15 µL of copper sulfate solution (10 µmol/L) were successively added. After mixing, the reaction was carried out at 37 °C for 30 min and 60 min, and click 1 reaction formation was detected by HPLC-MS, respectively. The responses of click 2 and click 3 were the same as above, and three replicates were set in parallel for each group. HPLC was used to test the peak area under different ratios of reactant concentration, reaction time, and catalyst dosage (Figure 9).

3.6. Cytotoxicity: MTT Cell Proliferation Assay

The “click” reaction conditions in click chemistry require copper sulfate and sodium ascorbate as catalysts, and the copper sulfate concentration is generally too high, which causes certain damage to the body. RAW264.7 cells were used as test cells to explore the safe concentration of copper sulfate, compounds A1A3, and probes T1T4. The macrophage suspension of RAW264.7 cells in the logarithmic growth stage was adjusted to 5 × 10⁴ cells/mL and seeded in 96-well plates with 100 µL in each well. The cells were incubated at 37 °C and 5% CO2 for 24 h and then treated with different concentrations of copper sulfate solution (each concentration was repeated three times). After being treated with copper sulfate for 36 h, 10 µL MTT (5 mg/mL) was added to each well, and the cells were incubated at 37 °C and 5% CO2 for 4 h. Then, the MTT in the well was discarded, and 100 µL DMSO was added to each well and incubated at 37 °C for 0.5 h until the crystals were completely dissolved. The microplate reader read the OD490 nm of each well. The cytotoxicity assays of compounds A1A3 and probes T1T4 were the same as above. The cell proliferation inhibition rate (IC50) was calculated using SPSS 16.0 software.

3.7. Antibacterial Activity on Agrobacterium tumefaciens

The compounds A1A3 were evaluated through the plate microdilution test according to the guidelines of the Clinical and Laboratory Standards Institute (CLSI). A colony of Agrobacterium tumefaciens grown on lysogeny broth (LB) agar plates was inoculated in lysogeny broth (LB) and incubated in an aerobic environment at 28 °C overnight (ON). The bacterial suspension was diluted to 5 × 10⁷ CFU/mL, and 200 µL was added to each well, obtaining a final density of 2.5 × 10⁷ CFU/well. Meanwhile, A1A3 were serially diluted in 1X PBS at concentrations of 30, 50, and 100 µmol/L. Cefuroxime was used as an antibiotic control and DMSO as a solvent control. Subsequently, the plates were incubated at 28 °C in aerobiosis, and the growth rate was evaluated after 4, 6, 8, and 10 h using an ultraviolet (UV) detector.

3.8. Fluorescent Detection of Agrobacterium tumefaciens by Diagnostic Molecules

An amount of 3 mL of the standby Agrobacterium solution at a concentration of 5 × 10³ CFU/mL was added to the shaker tube. Then, 200 µL of A1 at a concentration of 30 µmol/L, A2 at a concentration of 50 µmol/L, and A3 at a concentration of 50 µmol/L were added at 28 °C. After incubation at 200 RPM/min for 8 h, the upper layer of the medium was poured off after centrifugation and washed three times with PBS, and the bacterial solution was resuspended by adding 1 mL of medium. Then, the same amount of probe was added, and 15 µL copper sulfate and sodium ascorbate were added at a concentration of 10 µmol/L. The control group was treated with only the corresponding probe, and the concentration of each probe was the same as that of the corresponding inhibitor. After adding probes to each group, the “click” reaction was complete for 1 h. After centrifugation, the upper layer of the medium was poured off and washed three times with PBS. Then, 1 mL of the medium was added to resuspend the bacterial solution, and 10 µL was added to the slide for fluorescence microscope detection and observation of the fluorescence of Agrobacterium in each group.

3.9. Molecular Docking

The crystal structure of VirB8 (PDB ID: 4AKY) came from the PDB database. The compounds A1A3 as input for the docking study were drawn by ChemDraw 22, and the PDB file of A1A3 was generated by StoneMIND Collector. It was connected to the interaction between A1A3 and VirB8 (PDB ID: 4AKY) through AutoDock Vina 1.2.3 and analyzed by PyMOL 4.6.

4. Conclusions

In this study, the compounds A1A3 were designed and synthesized according to B8I-2 as the basic skeleton, and four fluorescent probes T1T4 were designed and synthesized according to the excited state intramolecular proton transfer mechanism. The structures of the seven compounds synthesized in this study were confirmed by 1H NMR, 13C NMR, MS characterization, and elemental analysis. The docking results between the A1A3 and the receptor VirB8 molecule showed that the docking between A1A3 and VirB8 was successful, which was basically consistent with the binding sites in the literature, and the binding energy between A2 and VirB8 was the largest.
The compounds A1A3 synthesized in this paper had antibacterial activity against Agrobacterium tumefaciens. The antibacterial activity of compound A1A3 was better than that of B8I-2. A1A3 and T1T4 underwent the “click” reaction in the physiological condition to form diagnostic molecules. This laid a foundation for the detection of animal pathogenic bacteria in the later stage.

Supplementary Materials

The following supporting information can be downloaded at: https://www.mdpi.com/article/10.3390/molecules28062758/s1; Figures S1–S7: 1H, 13C NMR, and MS of all products; Figures S8–S10: in vitro validation of the “click” reaction and optimization of conditions.

Author Contributions

The experiment in this paper is conducted under the guidance of professors J.J. and M.Z.; Q.L. is responsible for writing the original draft, J.J. and M.Z. helped with writing, reviewing, and editing; Q.L., J.S., J.T. and J.J. performed and analyzed the design and synthesis of the seven compounds (A1–A3, T1–T4) test, UV-visible absorption spectroscopy and fluorescence spectroscopic, and the HPLC-MS results for the “click” reactions. Q.L., C.S. and B.S. performed the determination of the maximum safe concentration of the drugs, antibacterial activity on agrobacterium tumefaciens, and fluorescence detection of agrobacterium tumefaciens by diagnostic molecules; Q.L. performed and analyzed the docking of A1–A3 to VirB8; Q.L., J.T. and M.Z. analyzed the determination of the maximum safe concentration, antibacterial activity of compounds, and fluorescence detection of agrobacterium tumefaciens by diagnostic molecules. Conceptualization, Q.L. and J.J.; data curation, J.S. and J.T.; formal analysis, Q.L. and B.S.; funding acquisition, M.Z. and J.J.; investigation, C.S. and J.T.; methodology, C.S. and J.S.; project administration, M.Z. and J.J.; resources, M.Z. and J.J.; software, Q.L.; supervision, J.J.; validation, Q.L., J.S. and B.S.; writing—original draft, Q.L.; writing—review and editing, M.Z. and J.J. All authors have read and agreed to the published version of the manuscript.

Funding

This research was funded by the Shanxi Province Graduate Education Innovation Project [2021Y352], Fundamental Research Program of Shanxi Province [202103021224335], Yangquan Key Research and Development Project [2022JH067], and Scientific and Technologial Innovation Programs of Higher Education Institutions in Shanxi [2022L595].

Institutional Review Board Statement

Not applicable.

Informed Consent Statement

Not applicable.

Data Availability Statement

Not applicable.

Conflicts of Interest

The authors declare no conflict of interest.

Sample Availability

Samples of the compounds are available from the authors.

References

  1. Wang, C.; Liu, M.; Wang, Z.; Li, S.; Deng, Y.; He, N. Point-of-care diagnostics for infectious diseases: From methods to devices. Nano Today 2021, 37, 101092. [Google Scholar]
  2. Cascella, M.; Rajnik, M.; Aleem, A.; Dulebohn, S.C.; Di Napoli, R. Features, Evaluation, and Treatment of Coronavirus (COVID-19); Statpearls: Orlando, FL, USA, 2022. [Google Scholar]
  3. Kinimi, E.; Odongo, S.; Muyldermans, S.; Kock, R.; Misinzo, G. Paradigm shift in the diagnosis of peste des petits ruminants: Scoping review. Acta Vet. Scand. 2020, 62, 7. [Google Scholar] [CrossRef] [Green Version]
  4. Zhang, L.; Zhang, Y.; Wang, C.; Feng, Q.; Fan, F.; Zhang, G.; Kang, X.; Qin, X.; Sun, J.; Li, Y. Integrated microcapillary for sample-to-answer nucleic acid pretreatment, amplification, and detection. Anal. Chem. 2014, 86, 10461–10466. [Google Scholar] [CrossRef] [PubMed]
  5. Zhu, L.; Zhu, C.; Deng, G.; Zhang, L.; Zhao, S.; Lin, J.; Li, L.; Jiao, P.; Liao, M.; Liu, Y. Rapid identification of H5 avian influenza virus in chicken throat swab specimens using microfluidic real-time RT-PCR. Anal. Methods 2014, 6, 2628–2632. [Google Scholar] [CrossRef]
  6. Chekli, Y.; Peron-Cane, C.; Dell’Arciprete, D.; Allemand, J.-F.; Li, C.; Ghigo, J.-M.; Gautier, A.; Lebreton, A.; Desprat, N.; Beloin, C. Visualizing the dynamics of exported bacterial proteins with the chemogenetic fluorescent reporter FAST. Sci. Rep. 2020, 10, 15791. [Google Scholar] [CrossRef] [PubMed]
  7. Tabb, J.; Rapoport, E.; Han, I.; Lombardi, J.; Green, O. An antigen-targeting assay for Lyme disease: Combining aptamers and SERS to detect the OspA protein. Nanomedicine 2022, 41, 102528. [Google Scholar] [CrossRef]
  8. Zhang, X.; Wang, L.; Li, N.; Xiao, Y. Assessing chromatin condensation for epigenetics with a DNA-targeting sensor by FRET and FLIM techniques. Chin. Chem. Lett. 2021, 32, 2395–2399. [Google Scholar] [CrossRef]
  9. Radkov, A.D.; Hsu, Y.-P.; Booher, G.; VanNieuwenhze, M.S. Imaging bacterial cell wall biosynthesis. Annu. Rev. Biochem. 2018, 87, 991. [Google Scholar] [CrossRef] [PubMed]
  10. Brown, A.R.; Wodzanowski, K.A.; Santiago, C.C.; Hyland, S.N.; Follmar, J.L.; Asare-Okai, P.; Grimes, C.L. Protected N-acetyl muramic acid probes improve bacterial peptidoglycan incorporation via metabolic labeling. ACS Chem. Biol. 2021, 16, 1908–1916. [Google Scholar] [CrossRef]
  11. Liu, C.; Zhou, L.; Xie, L.; Zheng, Y.; Man, H.; Xiao, Y. Forthrightly monitoring ferroptosis induced by endoplasmic reticulum stresses through fluorescence lifetime imaging of microviscosity increases with a specific rotor. Chin. Chem. Lett. 2022, 33, 2537–2540. [Google Scholar] [CrossRef]
  12. Zhang, Y.; Lin, Q.; Wang, T.; Shi, D.; Fu, Z.; Si, Z.; Xu, Z.; Cheng, Y.; Shi, H.; Cheng, D. Targeting Infiltrating Myeloid Cells in Gastric Cancer Using a Pretargeted Imaging Strategy Based on Bio-Orthogonal Diels-Alder Click Chemistry and Comparison with Zr-Labeled Anti-CD11b Positron Emission Tomography Imaging. Mol. Pharm. 2022, 19, 246–257. [Google Scholar] [CrossRef] [PubMed]
  13. Wang, Z.; Xing, B. Small-molecule fluorescent probes: Big future for specific bacterial labeling and infection detection. Chem. Commun. 2022, 58, 155–170. [Google Scholar] [CrossRef]
  14. Siegrist, M.S.; Swarts, B.M.; Fox, D.M.; Lim, S.A.; Bertozzi, C.R. Illumination of growth, division and secretion by metabolic labeling of the bacterial cell surface. FEMS Microbiol. Rev. 2015, 39, 184–202. [Google Scholar] [CrossRef] [Green Version]
  15. Banahene, N.; Kavunja, H.W.; Swarts, B.M. Chemical reporters for bacterial glycans: Development and applications. Chem. Rev. 2021, 122, 3336–3413. [Google Scholar] [CrossRef]
  16. Nibin Joy, M.; Bodke, Y.D.; Telkar, S.; Bakulev, V.A. Synthesis of coumarins linked with 1, 2, 3-triazoles under microwave irradiation and evaluation of their antimicrobial and antioxidant activity. J. Mex. Chem. Soc. 2020, 64, 53–73. [Google Scholar]
  17. Tornøe, C.W.; Christensen, C.; Meldal, M. Peptidotriazoles on solid phase: [1, 2, 3]-triazoles by regiospecific copper (I)-catalyzed 1, 3-dipolar cycloadditions of terminal alkynes to azides. J. Org. Chem. 2002, 67, 3057–3064. [Google Scholar] [CrossRef]
  18. Rostovtsev, V.V.; Green, L.G.; Fokin, V.V.; Sharpless, K.B. A stepwise huisgen cycloaddition process: Copper (I)-catalyzed regioselective “ligation” of azides and terminal alkynes. Angew. Chem. 2002, 114, 2708–2711. [Google Scholar] [CrossRef]
  19. Pachón, L.D.; van Maarseveen, J.H.; Rothenberg, G. Click chemistry: Copper clusters catalyse the cycloaddition of azides with terminal alkynes. Adv. Synth. Catal. 2005, 347, 811–815. [Google Scholar] [CrossRef]
  20. Shankaraiah, N.; Sakla, A.; Laxmikeshav, K.; Tokala, R. Reliability of Click Chemistry on Drug Discovery: A Personal Account. Chem. Rec. 2020, 20, 253–272. [Google Scholar] [CrossRef]
  21. Kolb, H.C.; Sharpless, K.B. The growing impact of click chemistry on drug discovery. Drug Discov. Today 2003, 8, 1128–1137. [Google Scholar] [CrossRef] [PubMed]
  22. Giffin, M.J.; Heaslet, H.; Brik, A.; Lin, Y.-C.; Cauvi, G.; Wong, C.-H.; McRee, D.E.; Elder, J.H.; Stout, C.D.; Torbett, B.E. A copper (I)-catalyzed 1, 2, 3-triazole azide− alkyne click compound is a potent inhibitor of a multidrug-resistant HIV-1 protease variant. J. Med. Chem. 2008, 51, 6263–6270. [Google Scholar] [CrossRef] [PubMed]
  23. Xiong, X.; Tang, Z.; Sun, Z.; Meng, X.; Song, S.; Quan, Z. Supported copper (I) catalyst from fish bone waste: An efficient, green and reusable catalyst for the click reaction toward N-substituted 1, 2, 3-TRIAZOLES. Appl. Organomet. Chem. 2018, 32, e3946. [Google Scholar] [CrossRef]
  24. Chen, Z.; Chen, M.; Zhou, K.; Rao, J. Pre-targeted imaging of protease activity through in situ assembly of nanoparticles. Angew. Chem. 2020, 132, 7938–7944. [Google Scholar] [CrossRef]
  25. Poulie, C.; Sporer, E.; Hvass, L.; Jørgensen, J.; Kempen, P.; Lopes van den Broek, S.; Shalgunov, V.; Kjaer, A.; Jensen, A.; Herth, M. Bioorthogonal Click of Colloidal Gold Nanoparticles to Antibodies In vivo. Chemistry 2022, 28, e202201847. [Google Scholar] [CrossRef]
  26. Taiariol, L.; Chaix, C.; Farre, C.; Moreau, E. Click and bioorthogonal chemistry: The future of active targeting of nanoparticles for nanomedicines? Chem. Rev. 2022, 122, 340–384. [Google Scholar] [CrossRef] [PubMed]
  27. Summer, D.; Petrik, M.; Mayr, S.; Hermann, M.; Kaeopookum, P.; Pfister, J.; Klingler, M.; Rangger, C.; Haas, H.; Decristoforo, C. Hybrid Imaging Agents for Pretargeting Applications Based on Fusarinine C—Proof of Concept. Molecules 2020, 25, 2123. [Google Scholar] [CrossRef]
  28. Teng, Y.; Zhang, R.; Yang, B.; Yang, H.; Li, X.; Yin, D.; Feng, X.; Tian, Y. Bio-orthogonally activated tetraphenylene-tetrazine aggregation-induced emission fluorogenic probes. J. Mater. Chem. B 2022, 10, 8642–8649. [Google Scholar] [CrossRef]
  29. Paschos, A.; den Hartigh, A.; Smith, M.A.; Atluri, V.L.; Sivanesan, D.; Tsolis, R.M.; Baron, C. An in vivo high-throughput screening approach targeting the type IV secretion system component VirB8 identified inhibitors of Brucella abortus 2308 proliferation. Infect. Immun. 2011, 79, 1033–1043. [Google Scholar] [CrossRef] [Green Version]
  30. Smith, M.A.; Coinçon, M.; Paschos, A.; Jolicoeur, B.; Lavallée, P.; Sygusch, J.; Baron, C. Identification of the binding site of Brucella VirB8 interaction inhibitors. Chem. Biol. 2012, 19, 1041–1048. [Google Scholar] [CrossRef] [PubMed] [Green Version]
  31. Ogawara, H. Possible drugs for the treatment of bacterial infections in the future: Anti-virulence drugs. J. Antibiot. 2021, 74, 24–41. [Google Scholar] [CrossRef]
  32. Altamirano-Silva, P.; Cordero-Serrano, M.; Méndez-Montoya, J.; Chacón-Díaz, C.; Guzmán-Verri, C.; Moreno, E.; Chaves-Olarte, E. Intracellular passage triggers a molecular response in Brucella abortus that increases its infectiousness. Infect. Immun. 2021, 89, e00004-21. [Google Scholar] [CrossRef]
  33. Blasey, N.; Rehrmann, D.; Riebisch, A.K.; Mühlen, S. Targeting bacterial pathogenesis by inhibiting virulence-associated Type III and Type IV secretion systems. Front. Cell. Infect. Microbiol. 2023, 12, 1955. [Google Scholar] [CrossRef] [PubMed]
  34. Brown, A.B.; Whitlock, H.W., Jr. Syntheses and Synthetic Studies of 2-Hydroxy-5-(propargyloxy) benzoic Acid. Synth. Commun. 1993, 23, 23–34. [Google Scholar] [CrossRef]
  35. Pringle, W.; Sharpless, K.B. The osmium-catalyzed aminohydroxylation of Baylis-Hillman olefins. Tetrahedron Lett. 1999, 40, 5151–5154. [Google Scholar] [CrossRef]
  36. Zhou, Y.; Sun, W.; Peng, J.; Yan, H.; Zhang, L.; Liu, X.; Zuo, Z. Design, synthesis and biological evaluation of novel copper-chelating acetylcholinesterase inhibitors with pyridine and N-benzylpiperidine fragments. Bioorg. Chem. 2019, 93, 103322. [Google Scholar] [CrossRef] [PubMed]
  37. Kobayashi, T.; Komatsu, T.; Kamiya, M.; Campos, C.U.; González-Gaitán, M.; Terai, T.; Hanaoka, K.; Nagano, T.; Urano, Y. Highly activatable and environment-insensitive optical highlighters for selective spatiotemporal imaging of target proteins. J. Am. Chem. Soc. 2012, 134, 11153–11160. [Google Scholar] [CrossRef] [PubMed]
  38. Kumari, P.; Prakash, S.; Prakash, D. Synthesis and characterization of some hetero binuclear Ni-II Schiff base complexes. J. Indian Chem. Soc. 2012, 89, 19–23. [Google Scholar]
  39. Ma, X.; Cheng, J.; Liu, J.; Zhou, X.; Xiang, H. Ratiometric fluorescent pH probes based on aggregation-induced emission-active salicylaldehyde azines. New J. Chem. 2015, 39, 492–500. [Google Scholar] [CrossRef]
  40. Nehra, P.; Khungar, B.; Singh, R.P.; Sivasubramanian, S.; Jha, P.N.; Saini, V. Synthesis, characterization and applications of imidazolium ionic liquid-tagged zinc (II) complex. Inorg. Chim. Acta 2018, 478, 260–267. [Google Scholar] [CrossRef]
  41. Al-Jorani, K.R.; Atia, A.J.K.; Lafta, S.J.; Al-Bayti, R.I.; Kadhem, S.A.; Baqer, S.M. Antibacterial activity of new benzimidazole moiety synthesis via a acid chloride and related heterocyclic chalcones. J. Pharm. Sci. Res. 2019, 11, 1195–1203. [Google Scholar]
  42. Dias, G.G.; Paz, E.R.; Kadooca, J.Y.; Sabino, A.A.; Cury, L.A.; Torikai, K.; De Simone, C.A.; Fantuzzi, F.; da Silva Junior, E.N. Rhodium (III)-Catalyzed C–H/N–H Alkyne Annulation of Nonsymmetric 2-Aryl (Benz) imidazole Derivatives: Photophysical and Mechanistic Insights. J. Org. Chem. 2020, 86, 264–278. [Google Scholar] [CrossRef] [PubMed]
  43. Li, M.; Zheng, N.; Li, J.; Zheng, Y.; Song, W. Iridium-catalyzed orthogonal and regioselective synthesis of triazole disulfides in aqueous media under mild conditions. Green Chem. 2020, 22, 2394–2398. [Google Scholar] [CrossRef]
  44. Chu, N.; Wang, Y.; Jia, H.; Han, J.; Wang, X.; Hou, Z. Design, Synthesis and Biological Evaluation of New Carbohydrate-Based Coumarin Derivatives as Selective Carbonic Anhydrase IX Inhibitors via “Click” Reaction. Molecules 2022, 27, 5464. [Google Scholar] [CrossRef] [PubMed]
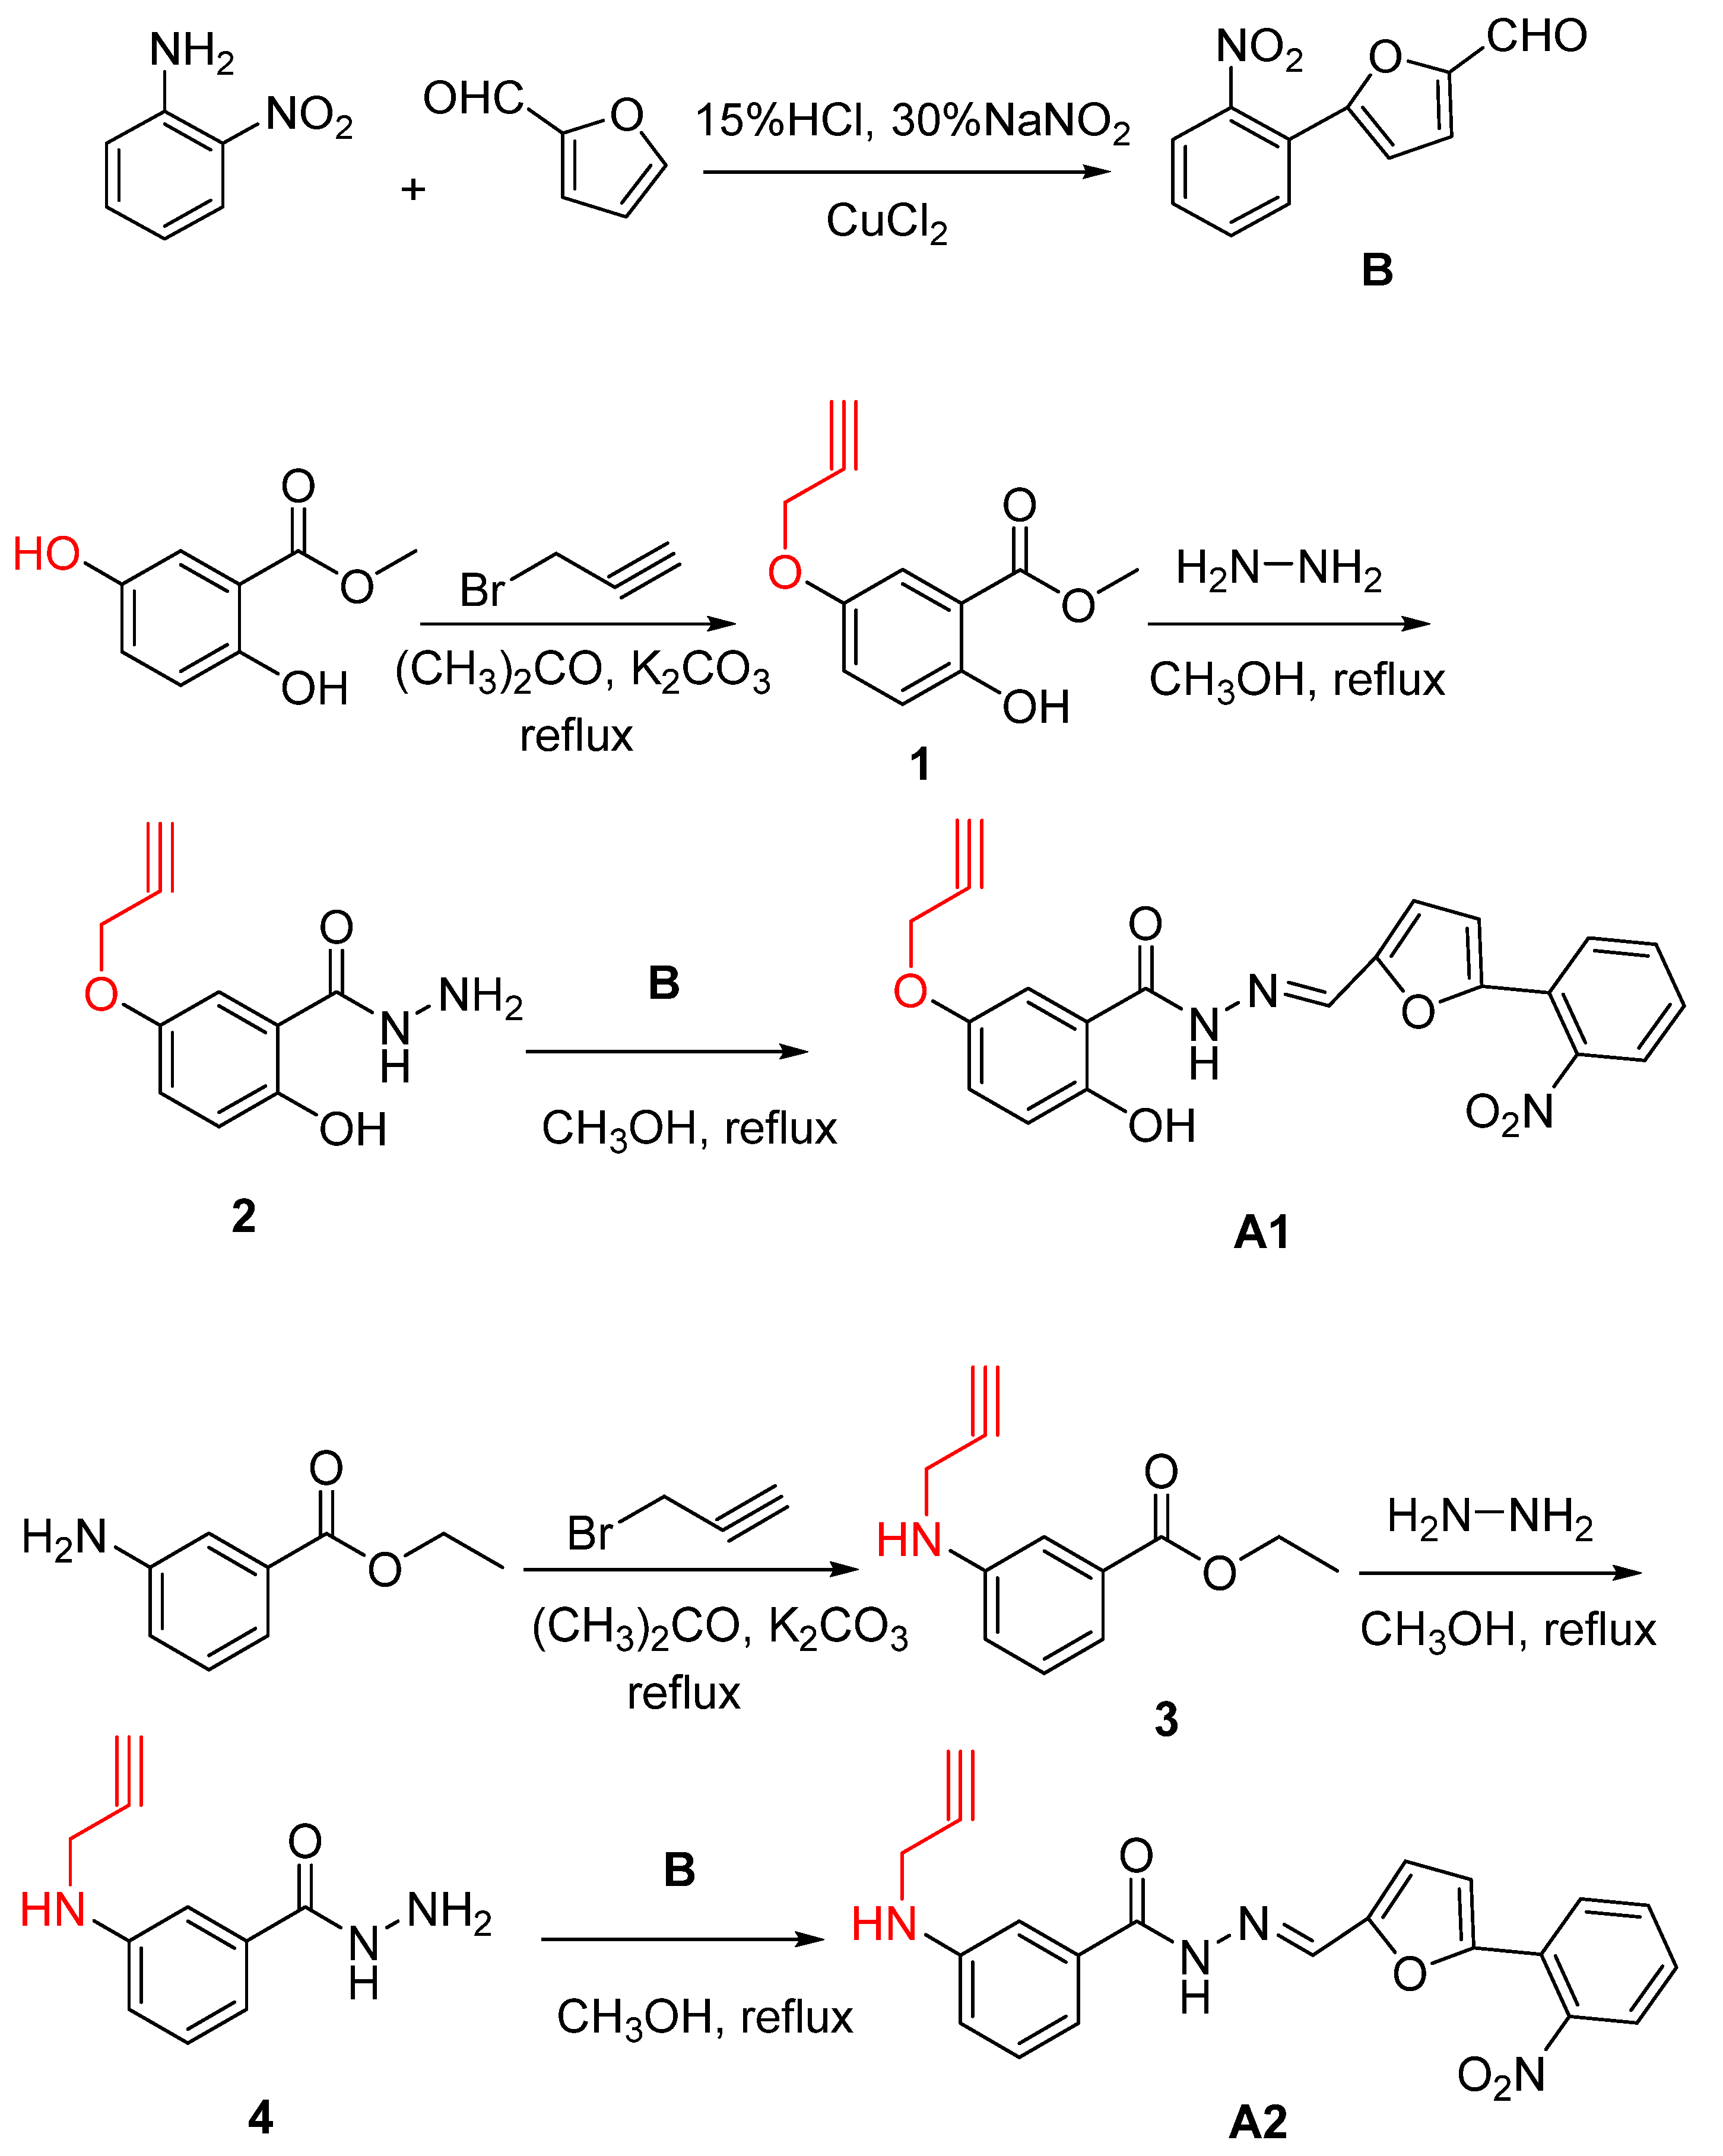
Figure 1. Synthesis routes of compounds A1A3.
Molecules 28 02758 g001aMolecules 28 02758 g001b
Figure 2. Synthesis routes of the probes T1T4.
Molecules 28 02758 g002aMolecules 28 02758 g002b
Figure 3. Experimental absorption spectra of A1 (black), A2 (red), and A3 (blue).
Molecules 28 02758 g003
Figure 4. (a) The excitation wavelengths of T1T4 (b). The emission wavelengths of T1T4.
Molecules 28 02758 g004
Figure 5. Effects of different concentrations of copper sulfate solution on the survival rate of RAW264.7 cell.
Molecules 28 02758 g005
Figure 6. Antibacterial activity rate (%) of A1A3 treatment: (a) the antibacterial activity of the A1A3 on Agrobacterium tumefaciens with different times at 30 µmol/L; (b) the antibacterial activity of the A1A3 on Agrobacterium tumefaciens with different times at 50 µmol/L; and (c) the antibacterial activity of the A1A3 on Agrobacterium tumefaciens with different times at 100 µmol/L. Data represent the mean ± standard deviation (SD) of three independent experiments; *** represents p < 0.001.
Molecules 28 02758 g006
Figure 7. Diagnostic molecular targeted Agrobacterium tumefaciens fluorescence assay: (a) fluorescence detection of Agrobacterium tumefaciens without inhibitor and probe; (b) agrobacterium fluoresce was detected by adding inhibitor A1 and probe T4; (c) fluorescence detection of Agrobacterium with inhibitor A2 and probe T4; (d) agrobacterium fluorescence detection with inhibitor A3 and probe T3; (e) only Agrobacterium tumefacien probe T4 was added for fluorescence detection; (f) only Agrobacterium tumefacien probe T3 was added for fluorescence detection.
Molecules 28 02758 g007
Figure 8. Docked view of compounds A1, A2, and A3 at the active site of the enzyme PDB: 4AKY.
Molecules 28 02758 g008
Figure 9. The chemical synthesis routes of the click reactions.
Molecules 28 02758 g009
Table 1. Results of the cytotoxicity test.
CompA1A2A3T1T2T3T4
IC50/μmol·L−1>98>96>100>100>92>100>87
Table 2. The binding free energy.
CompA1A2A3
4AKY6.4 kcal/mol7.3 kcal/mol7.1 kcal/mol
Disclaimer/Publisher’s Note: The statements, opinions and data contained in all publications are solely those of the individual author(s) and contributor(s) and not of MDPI and/or the editor(s). MDPI and/or the editor(s) disclaim responsibility for any injury to people or property resulting from any ideas, methods, instructions or products referred to in the content.