Abstract
To improve the crystal quality of 4,8-bis(2,4,6-trinitrophenyl)difurazolo [3,4-b:3′,4′-e] pyrazine (TNBP), the solubility of TNBP in organic solvents (six pure and four mixed solvents) was determined by the laser monitoring technique from 293.15 to 353.15 K. The results showed that the solubility was positively correlated with the increase in the experimental temperature and the main solvent content, except for the co-solvent phenomenon in the DMSO + ethyl acetate solvent mixture. To explain the dissolution behavior of TNBP, the KAT-SER model was analyzed for pure solvent systems, and it was found that hydrogen bonding alkalinity and self-cohesiveness were the main influencing factors. The free energy of solvation and radial distribution function of TNBP in mixed solvents were also obtained by molecular dynamics simulation, and the effect of solute–solvent and solvent–solvent interactions on the solubility trend was analyzed. The experimental data were correlated using three empirical equations (van’t Hoff equation, modified Apelblat equation, and λh equation), and the deviation analysis showed the good applicability of the modified Apelblat model. Furthermore, the dissolution of TNBP was heat-absorbing and not spontaneous, according to the thermodynamic characteristics estimated by the van’t Hoff equation.
1. Introduction
4,8-Di(2,4,6-trinitrophenyl) difurazano [3,4-b:3′,4′-e]pyrazine (TNBP, Figure 1), first synthesized by Russian scientists in the 1990s [1], has become an ideal choice for ultra-high temperature heat-resistant energetic materials due to its excellent heat resistance and good detonation performances (Td: 415 °C, D: 7874 m/s, P: 28.2 GPa). Currently, the morphology of TNBP synthesized by the process has obvious angularity and uneven particle size distribution, affecting the product performances [2]. Therefore, improving the crystal quality of TNBP is of great importance for its further application in the military industry.

Figure 1.
(a) The molecular structure of TNBP. (b) The 3D structure of TNBP.
Solution recrystallization enables energetic materials to achieve the desired crystalline state and properties. However, the existing reports on TNBP mainly focus on optimizing the synthesis process [3], and there are few studies on recrystallization [4,5], especially the crystallization thermodynamics data for TNBP. Crystallization thermodynamics, as the basis of energetic material recrystallization research [6,7], can provide a basis for the selection of crystallization solvents and methods and has practical significance for the development and optimization of the TNBP crystallization process.
In this work, the molar fraction solubility of TNBP in six pure solvents (dimethyl sulfoxide (DMSO), N, N-dimethylformamide (DMF), N-methylpyrrolidone (NMP), acetone, acetonitrile, ethyl acetate) and the mixture of DMSO and four other solvents (water, acetone, acetonitrile, ethyl acetate) were determined. The experimental solubility was correlated using the van’t Hoff equation, modified Apelblat equation, and λh equation to broaden the applicability of the obtained data. Moreover, the factors affecting the solubility behavior of TNBP in pure solvents and mixed systems were analyzed using the KAT-LESR model and molecular dynamics simulations, respectively. In addition, the thermodynamic characteristics of TNBP throughout the dissolution process were also examined.
2. Results and Discussion
2.1. Solid-State Properties of TNBP
The PXRD patterns of crystals obtained before and after crystallization are given in Figure 2a. The crystals obtained by the crystallization of TNBP in all solvent systems have the same crystal phase compared with the raw material, which has characteristic peaks at 2θ of 10.4°, 12.9°, 14.6°, 15.1°, 16.3°, 18.2°, 18.6°, 18.9°, 20.8°, 21.9°, 22.3°, 23.1°, 23.8°, 24.7°, 25.1°, 25.8°, 26.4°, 29.6°, 30.2° and 20.6°.
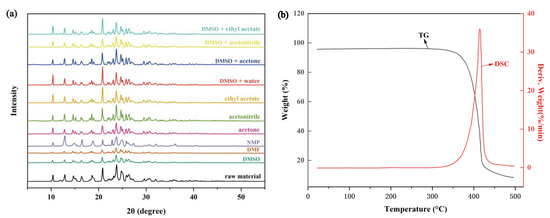
Figure 2.
(a) PXRD patterns of TNBP raw material and crystalline samples obtained in different solvent systems. (b) TG-DTG curves of TNBP.
According to the TG-DTG curve of TNBP (Figure 2b), it can be seen that the exothermic peak of TNBP is at 415.4 °C, and there is only a decomposition process during the heating process. To obtain its melting point (Tm) and enthalpy of melting (ΔfusH), they are estimated by the additive and non-additive group contribution method (Table S1) [8,9], and the results show that Tm is 392.23 °C and ΔfusH is 50.50 KJ·mol−1.
2.2. Pure Solvent Solubility Results
The experimental data on the molar fraction solubility of TNBP in six pure solvents are shown in Table 1 and plotted in Figure 3. TNBP’s solubility in pure solvents increases with rising temperature, indicating that the dissolution process is heat absorbing, and the temperature increase is conducive to the dissolution equilibrium. At lower temperatures (293.15–323.15 K), the solubility is in the following order from largest to smallest: NMP, DMF, DMSO, acetone, acetonitrile, and ethyl acetate. The change in solubility of TNBP in DMSO with temperature is relatively apparent. Therefore, when the temperature is higher than 333.15 K, the solubility of TNBP in DMSO is greater than that in DMF.

Table 1.
Experimental molar fraction solubility and calculated solubility of TNBP in six pure solvents at 0.1 Mpa.
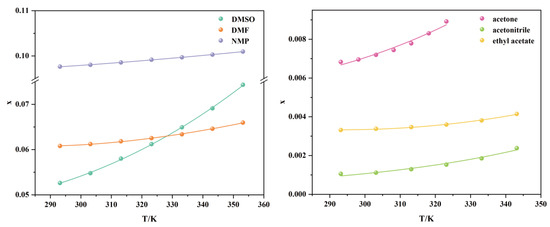
Figure 3.
Modified Apelblat equation correlation of TNBP solubility data in six pure solvents.
From Table S2, the polarity order of the six solvents is: acetonitrile > DMSO > DMF > NMP > acetone > ethyl acetate [10], which does not correspond to the true order of solubility in all solvents. Therefore, polarity is not the main factor in determining the solubility of TNBP in pure solvents. To further study the solvent effect, the solubility of TNBP in pure solvents at 313.15 K is fitted using the KAT-LSER model (SPSS software 17.0). The α, β, π⁎, and δH2 values for the solvents are listed in Table S2 [11], and the density of TNBP (1.980 g/cm3) can be found in the SciFinder database. The results are shown in Equation (1):
where n represents the six pure solvents, R2 is the correlation coefficient, RSS represents the residual sum of squares, and the F-test is the ratio of variance test. The numbers in brackets refer to the standard deviation of the model coefficients. As can be seen from the above equations, the relative contributions of π⁎, β, α, and δH2 to the solubility of TNBP are 9.47%, 26.34%, 17.62%, and 28.33%, respectively. Among them, the parameter coefficients of π⁎, β, and α are all positive, indicating that the solubility of TNBP increases with increasing dipole/polarizability parameter, hydrogen bonding alkalinity, and hydrogen bonding acidity of the solvent. The δH2 parameter coefficient is negative, indicating that the self-cohesiveness of the solvent plays an opposite role in the dissolution process of TNBP.
In addition, the van’t Hoff equation, modified Apelblat equation, and λh equation all fit well with the experimental values of TNBP solubility in pure solvents. According to Tables S3–S5, the mean 100RAD values for the three models are 1.92, 1.07, and 1.68. The mean 1000RMSD values are 0.30, 0.07, and 0.19, and the mean R2 values are 0.9546, 0.9907, and 0.9709, respectively. The correlation order for the three equations is modified Apelblat > λh > van’t Hoff. Consequently, the modified Apelblat equation correlates better (Figure 3) and is a guide for fitting and extending the application of experimental solubility data.
2.3. Mixed Solvent Solubility Results
As DMSO is an excellent solvent for solubilizing TNBP, studying the solid–liquid phase equilibrium of DMSO with the four non-solvents (water, acetone, acetonitrile, and ethyl acetate) can provide more options for the crystallization process of TNBP. The experimental values of the molar fraction solubility of TNBP in four mixtures of DMSO with water, acetone, acetonitrile, and ethyl acetate at different temperatures and mass fractions are shown in Table 2, Table 3, Table 4 and Table 5 and plotted in Figure 4. The solubility of TNBP in mixed solvents varies with solvent composition and temperature. For all the mixed solvents studied, solubility is positively correlated with increasing temperature. In the three systems (DMSO + water, DMSO + acetone, and DMSO + acetonitrile), the solubility of TNBP increases with the increasing mass fraction of DMSO when the temperature is constant. However, the co-solvent phenomenon occurs in the mixture of DMSO + ethyl acetate, which means that the solubility of TNBP reaches a maximum when the mass fraction of DMSO is 0.9, after which the solubility decreases with the addition of DMSO. The discovery of this phenomenon has great significance for controlling the crystallization operation range of TNBP in this system [12,13].

Table 2.
Experimental molar fraction solubility and calculated solubility of TNBP in mixed solvents (DMSO + water) from 293.15 to 353.15 K at 0.1 Mpa.

Table 3.
Experimental molar fraction solubility and calculated solubility of TNBP in mixed solvents (DMSO + acetone) from 293.15 K to 323.15 K at 0.1 Mpa.

Table 4.
Experimental molar fraction solubility and calculated solubility of TNBP in mixed solvents (DMSO + acetonitrile) from 293.15 to 343.15 K at 0.1 Mpa.

Table 5.
Experimental molar fraction solubility and calculated solubility of TNBP in mixed solvents (DMSO + ethyl acetate) from 293.15 to 343.15 K at 0.1 Mpa.
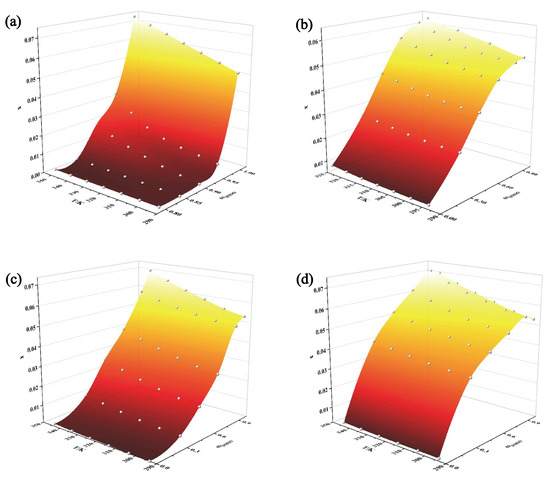
Figure 4.
Experimental data on the solubility of TNBP in mixed solvents: (a) DMSO + water; (b) DMSO + acetone; (c) DMSO + acetonitrile; (d) DMSO + ethyl acetate.
In order to better understand the reasons for the appearance of the co-solvent phenomenon, intermolecular interactions obtained using molecular dynamics simulations are explained. The solute–solvent intermolecular interactions can be quantitatively described by the calculated solvation free energies. Table 6 lists the solvation free energy of TNBP in four solvent mixtures, and its absolute value increases with the increase in DMSO mass fraction. The solvation free energy in the DMSO + ethyl acetate system likewise peaks when ωDMSO is 0.90. Therefore, it can be concluded that the order of the magnitude of the absolute value of the solvation free energy follows the same trend as the solubility change of TNBP. It is further deduced that the stronger the solute–solvent interaction, the greater the solubility.

Table 6.
The solvation free energy of TNBP in the four solvent mixtures at 313.15 K.
Competition between the solvent–solute and solvent–solvent interactions can be analyzed using the radial distribution function (RDF). RDF peaks between 1.5 and 3.5 Å are hydrogen bonding interactions, and peaks in the range 3.5–5.0 Å represent van der Waals forces. Figure S1 shows the RDF curves between solute–solvent. Hydrogen bonds are formed between solute–solvent in all four systems with strong interactions. The solvent–solvent RDF curves (Figure 5) reflect that the intermolecular forces are also stronger in the DMSO + water, DMSO + acetone, and DMSO + acetonitrile systems. The peak intensity becomes stronger with increasing DMSO content. These indicate that both solute–solvent and solvent–solvent interactions strongly influence the solubility of TNBP in the three systems. However, in the DMSO + ethyl acetate mixture, the solvent–solvent intermolecular interaction is weaker, with the peak at 4.93 Å, and the peak intensity is essentially constant. The above results suggest that the solute–solvent interaction in this system is less affected by the solvent–solvent interaction, which leads to the co-solvent phenomenon.
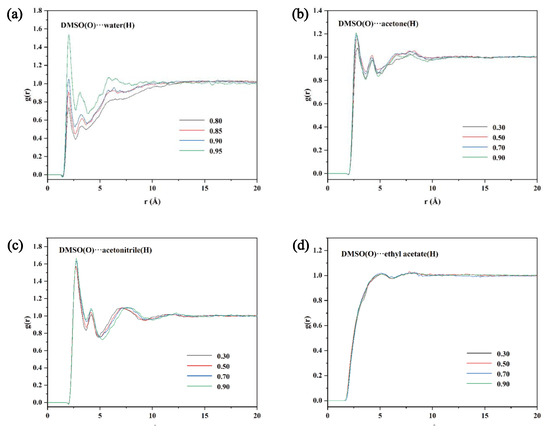
Figure 5.
RDF plots of water (a), acetone (b), acetonitrile (c), and ethyl acetate (d) with different mass fraction of DMSO at 303.1 K.
In addition, the co-solvent phenomenon of the DMSO + ethyl acetate system was further investigated using infrared spectroscopy experiments. Figure 6a shows the comparative IR spectrum of TNBP dissolved in mixed solutions with different mass fractions of DMSO. As ωDMSO increases, the carbonyl peak gradually moves toward the lower wave number, and the positions of the other peaks do not change. Considering that the nitro group’s oxygen atom in TNBP and ethyl acetate’s hydrogen atom form intermolecular hydrogen bonds, the electron absorption of the nitro group affects the carbonyl group in ethyl acetate, resulting in the apparent redshift of the peak. The above results prove the existence of hydrogen bonding between TNBP and the mixed solution. Figure 6b compares the IR spectra between the solvents and shows that all the carbonyl peaks are around 1742 cm−1 and do not shift, indicating little hydrogen bonding between the solvent–solvent. These are in good agreement with our calculation results.
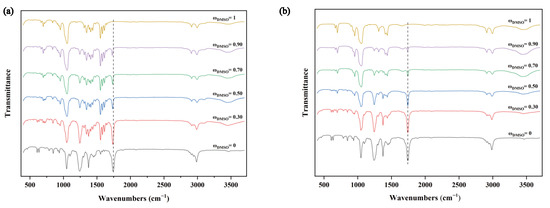
Figure 6.
(a) The infrared spectrum of TNBP dissolved in DMSO + ethyl acetate mixture. (b) The infrared spectrum of DMSO + ethyl acetate solvent mixture.
The solubility data of TNBP in mixed solvents were correlated using the three thermodynamic equations. The results of the model parameters and the correlation data are shown in Tables S3–S5. In the DMSO + water system, the maximum 100ARD value for the van’t Hoff, modified Apelblat, and λh equations are 20.18, 32.95, and 34.18, respectively. The 1000RMSD and R2 are not significantly different, which suggests that the van’t Hoff equation is more applicable to this system. In the other binary mixed systems, the mean values of 100ARD for the three models are 1.61, 0.50, and 1.35, respectively. The mean values of 1000RMSD are 0.65, 0.21, and 0.53, respectively, and the mean values of R2 are 0.9599, 0.9908 and 0.9729, respectively. Therefore, the modified Apelblat equation is more suitable for the DMSO + acetone, DMSO + acetonitrile, and DMSO + ethyl acetate systems. These can predict the solubility data of other temperature points in the system and provide a theoretical basis for future crystallization processes.
2.4. Thermodynamic Properties of Dissolution
The enthalpy of dissolution (ΔdisH), the entropy of dissolution (ΔdisS), and the Gibbs free energy (ΔdisG) of TNBP in each solvent system are shown in Table S6. In pure solvents, ΔdisH is positive, indicating that the dissolution of TNBP is a heat-absorbing process and that the interaction between TNBP molecules and solvent molecules is stronger than between solvent molecules. ΔdisG is also positive, and the Gibbs free energy increases in the same order as the decrease in solubility (Figure 7a), implying that the dissolution process is non-spontaneous. In the solvent mixture, both ΔdisH and ΔdisG are also positive, and ΔdisG decreases with increasing DMSO content in the solvent mixture, which means that the dissolution of TNBP in the chosen solvent mixture is a “heat-absorbing and non-spontaneous” process.
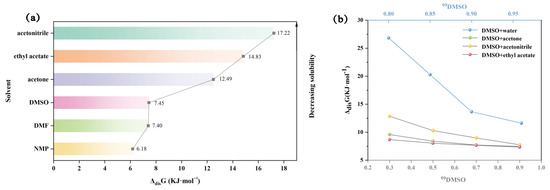
Figure 7.
ΔdisG values for TNBP in pure (a) and mixed (b) solvents.
3. Experimental
3.1. Materials and Instruments
The mass fraction of 0.980 for the yellow solid of TNBP was provided by the Xi’an Modern Chemistry Research Institute (Xi’an, China). All organic solvents, including DMSO, DMF, NMP, acetone, acetonitrile, and ethyl acetate, were analytical grade. Deionized water was homemade in the laboratory.
The D-MAX 2500 powder X-ray diffractometer (PXRD, Rigaku, Japan) was used to characterize the TNBP samples obtained by crystallization in different systems; the METTLER differential scanning calorimeter (Mettler Toledo, Switzerland) was used to measure the thermal properties of the TNBP recrystallized samples.
3.2. Solubility Determination
In this work, the dynamic laser monitoring method was used to measure the solubility of TNBP in six pure solvents (DMSO, DMF, NMP, acetone, acetonitrile, and ethyl acetate) and four mixtures of DMSO with acetone, acetonitrile, and ethyl acetate, respectively. The method is less time-consuming, quicker, and simpler than the traditional static methods, and there is no need to take samples for analysis. In addition, the accuracy of the test can meet the requirements.
The molar fraction solubility of TNBP in the pure solvent is shown in Equation (2); the molar fraction solubility of TNBP in mixed solvents is shown in Equation (3); the molar fraction of DMSO in mixed solvents is shown in Equation (4).
where m1 and m2 are the masses of TNBP and solvent, g; M1 and M2 are the molar masses of TNBP and solvent; m3 and m4 are the masses of DMSO and non-solvent (acetone, acetonitrile, ethyl acetate), g; M3 and M4 are the molar masses of DMSO and non-solvent.
The experimental determination process is as follows: a certain mass of solvent and an excess of TNBP are accurately weighed using the analytical balance (ME204/02, Mettler Toledo, Switzerland) and placed in a reactor. The temperature is increased at the specific rate (1 K·h−1), and the transmitted light reaches a maximum at a certain temperature point and does not change. This is the temperature at which the TNBP is completely dissolved, and the molar fraction of solute at this temperature is the corresponding solubility.
3.3. Molecular Dynamics Simulation
The effect of intermolecular interactions on the solubility trends of TNBP in binary solvents was investigated using Materials Studio 8.0 software. The free energy of solvation was calculated to analyze the solute–solvent interactions [14,15]. The solute–solvent and solvent–solvent interactions were also analyzed by radial distribution functions (RDF) [16,17].
The TNBP crystal structures were taken from single crystal diffraction data, and the relevant solvent molecules (water, DMSO, acetone, acetonitrile, ethyl acetate) were plotted in the software. Firstly, the solute and solvent molecules were structurally optimized using the Forcite module under the COMPASS force field, and the structure was constructed using the Amorphous Cell module, including one TNBP molecule and 500 solvent molecules. Next, molecular dynamics simulations were carried out in the NVT system synthesis (the temperature of the system was controlled at 313 K using the NHL thermostat method, the integration step was set to 1 fs, and the total simulation time was 500 ps) [18,19]. The resulting equilibrium structural configuration can be directly analyzed to obtain the RDF curve in the state. Finally, the equilibrium structures are calculated separately for ideal, van der Waals and electrostatic free energies using the Forcite module and summed to obtain the total solvation free energy (100 ps for each contributing term).
4. Theoretical Foundations
4.1. Van’t Hoff Equation
The van’t Hoff equation [20,21,22] is constructed on the basis of the thermodynamic concept of solid–liquid equilibrium under the presumption that the solvent is an ideal liquid (γ = 1). The link between the inverse of the absolute temperature and the positive logarithm of the molar fraction solubility is expressed by this solubility equation. It accurately predicts the solute dissolved in the solvent over a finite temperature range. The equation is as follows:
where T is the thermodynamic temperature, K; and A and B are model parameters.
4.2. Modified Apelblat Equation
The modified Apelblat equation, a semi-empirical model, is developed from the Clausius–Clapeyron equation. The equation provides a good representation of the relationship between temperature and solubility data in solvent systems [23,24,25,26].
where T is the thermodynamic temperature, K; and A, B and C are model parameters.
4.3. λh Equation
The λh model was first proposed by Buchowaski and is a common model for fitting experimental data using the λ and h parameters [27,28,29,30]:
where T is the thermodynamic temperature, K; and Tm is the melting point of TNBP, K; λ and h are the two parameters of the model.
4.4. Thermodynamic Model Evaluation
The mean relative deviation (ARD) and root mean square deviation (RMSD), which represent the fitting level of the thermodynamic model utilized, can be used to assess the applicability and accuracy of TNBP solubility data in pure solvent and mixed solvent systems [31].
where N is the number of experimental points; and xexp and xcal are the molar fraction solubility of TNBP’s experimental and calculated values, respectively.
4.5. KAT-LSER Model
The linear solvation energy equation (KAT-LSER), proposed by Kamlet and Taft et al., links solubility data with solvent characteristic parameters to investigate the effect of intermolecular interactions on solvation behavior. The expression is given by Equation (10) [32,33,34,35].
where α, β, π*, and δH stand for the hydrogen bond acidity, hydrogen bond alkalinity, dipole polarization rate, and Hildebrand parameter of the solvent, respectively. Vs represents the molar volume of the solute and can be estimated using the solute’s molar mass (M1) and density (ρ). c0 is the intercept of Equation (10). The values of c1 and c2 reflect changes in the nature of the solute’s interaction with the solvent through specificity hydrogen bonding. The values of c3 and c4 represent the solute’s sensitivity to non-specific electrostatic interactions between the solute and the solvent.
4.6. Thermodynamic Parameters
For the solid–liquid equilibrium system to be understood, it is required to compute the enthalpy of dissolution (ΔdisH), the entropy of dissolution (ΔdisS), and the Gibbs free energy (ΔdisG) using the van’t Hoff equation [36,37]. The equations are calculated as follows:
Assuming lnx is the dependent variable and 1/T is the independent variable, ΔdisH and ΔdisG can be calculated from the slope and intercept of the line fitted by the van’t Hoff equation, respectively. The equations are as follows:
The following equation can be used to compute ΔdisG in various solvents:
where the mean temperature is defined as follows:
where Ti is the experimental temperature, K; and N is the total number of test points in each solvent.
5. Conclusions
The solubility of TNBP was investigated in six pure solvents and four mixed solvents using the laser monitoring technique at 0.1 MPa. In all solvent systems, the solubility of TNBP increased monotonically as the temperature rose. Moreover, the solubility in three solvent mixtures of DMSO with water, acetone, and acetonitrile increased with increasing DMSO content. The solubility in the DMSO + ethyl acetate mixture increased and then dropped with increasing mass fraction of DMSO, reaching the maximum at DMSO = 0.90 while remaining constant in temperature.
According to the KAT-LSER model, the hydrogen bonding alkalinity and self-cohesiveness of the pure solvent had a strong influence on the solubility of TNBP. The solubility of TNBP in mixed systems was analyzed at the molecular level using the solvation free energy and radial distribution function, concluding that the co-solvent phenomenon was dominated by solute–solvent interactions.
The three empirical equations used, including the van’t Hoff equation, modified Apelblat equation, and λh equation, all correlated well with the solubility data of TNBP. The modified Apelbla equation had the best applicability, except for the DMSO + water mixed system. Furthermore, the dissolution of TNBP in all solvent systems was a “heat-absorbing and non-spontaneous” process.
Supplementary Materials
The following supporting information can be downloaded at: https://www.mdpi.com/article/10.3390/molecules28062424/s1, Figure S1: RDF plots between TNBP and selected mixed solvents at 313.15K; Table S1: Calculations of fusion enthalpy of TNBP by group contribution method; Table S2: KAT-LSER model parameters for six pure solvents; Table S3: Correlation of TNBP model parameters in different solvents using the van’t Hoff equation; Table S4: Correlation of TNBP model parameters in different solvents using the modified Apelblat equation; Table S5: Correlation of TNBP model parameters in different solvents using the λh equation; Table S6: Thermodynamic parameters of TNBP in pure and mixed solvents.
Author Contributions
Conceptualization, H.C.; Funding acquisition, Data curation, M.W., Y.K. and Y.Z.; Formal analysis, M.W., Y.K. and Y.Z.; M.W.; Investigation, L.W.; Resources, M.W., Y.K. and Y.Z.; Writing—original draft, L.W.; Writing—review and editing, N.L. All authors have read and agreed to the published version of the manuscript.
Funding
This research was funded by the National Natural Science Foundation of China, grant number 22175139.
Institutional Review Board Statement
Not applicable.
Informed Consent Statement
All authors have read and agreed to the published version of the manuscript.
Data Availability Statement
The data presented in this study are available to all readers according to “MDPI Research Data Policies”.
Conflicts of Interest
There are no conflict to declare.
Sample Availability
Samples of the compounds are available from authors (or from MDPI).
References
- Tselinskii, I.V.; Mel’nikova, S.F.; Romanova, T.V.; Pirogov, S.V.; Khisamutdinov, G.K.; Mratkhuzina, T.A.; Smirnov, S.P. 4H, 8H-difurazano[3, 4-b: 3′, 4′-e] pyrazine and some its derivatives. Russ. J. Org. Chem. 1997, 33, 1656–1665. [Google Scholar]
- Liu, N.; Xiao, C.; Zhang, Q.; Lu, X.; Wang, B. Research progress in ultra-temperature heat-resistant energetic materials. J. Ordnance Equip. Eng. 2021, 42, 115–121. [Google Scholar]
- Liu, N.; Shu, Y.; Li, H.; Zhai, L.; Li, Y.; Wang, B. Synthesis, characterization and properties of heat-resistant explosive materials: Polynitroaromatic substituted difurazano[3,4-b:3′,4′-e]pyrazines. RSC Adv. 2015, 5, 43780–43785. [Google Scholar] [CrossRef]
- Liu, N.; Zhang, Q.; Duan, B.; Lu, X.; Bai, X.; Yan, Q. Comparative study on thermal behavior of three highly thermostable energetic materials: Z-TACOT, PYX, and TNBP. FirePhysChem 2021, 1, 61–69. [Google Scholar] [CrossRef]
- Wang, L.; Wang, M.; Zhao, J.; Chang, H.; Liu, N. Research progress on crystallization process based on typical heat resistant explosives. Appl. Chem. Ind. 2022, 51, 3682–3687. [Google Scholar]
- Wu, H.; Zhang, Y.; Chang, P.; Hao, H.; Zhai, L.; Wang, B. Solubility, dissolution properties and molecular dynamic simulation of 2, 6-bis(picrylamino)-3, 5-dinitro-pyridine in pure and binary solvents. J. Mol. Liq. 2022, 368, 120567. [Google Scholar] [CrossRef]
- Wang, L.; Zhai, L.; She, W.; Wang, M.; Zhang, J.; Wang, B. Synthetic strategies toward nitrogen-rich energetic compounds via the reaction characteristics of cyanofurazan/furoxan. Front. Chem. 2022, 10, 871684. [Google Scholar] [CrossRef]
- Jain, A.; Yang, G.; Yalkowsky, S. Estimation of total entropy of melting of organic compounds. Ind. Eng. Chem. Res. 2004, 43, 4376–4379. [Google Scholar] [CrossRef]
- Jain, A.; Yalkowsky, S. Estimation of melting points of organic compounds-II. J. Pharm. Sci. 2006, 95, 2562–2618. [Google Scholar] [CrossRef]
- Smallwood, I. Handbook of Organic Solvent Properties; Butterworth-Heinemann: Oxford, UK, 1996. [Google Scholar]
- Fedors, R. A method for estimating both the solubility parameters and molar volumes of liquids. Polym. Eng. Sci. 1974, 14, 147–154. [Google Scholar] [CrossRef]
- Li, R.; Tang, T.; Yin, X.; Yao, L.; Lin, Z.; Zhang, L.; Gao, X.; Xu, X.; Han, D. Solubility of naftopidil in pure and mixed solvents at 273.15–313.15 K and its correlation with the Jouyban-Acree and CNIBS/RK models. J. Chem. Thermodyn. 2020, 145, 105969. [Google Scholar] [CrossRef]
- Chen, X.; Fadda, H.; Aburub, A.; Mishra, D.; Pinal, R. Cosolvency approach for assessing the solubility of drugs in poly (vinylpyrrolidone). Int. J. Pharm. 2015, 494, 346–356. [Google Scholar] [CrossRef]
- Wolfenden, R.; Andersson, L.; Cullis, P.; Southgate, C. Affinities of amino acid side chains for solvent water. Biochemistry 1981, 20, 849–855. [Google Scholar] [CrossRef]
- Steinbrecher, T.; Joung, I.; Case, D. Soft-core potentials in thermodynamic integration: Comparing one-and two-step transformations. J. Comput. Chem. 2011, 32, 3253–3263. [Google Scholar] [CrossRef]
- Gholizadeh, R.; Wang, Y. Molecular dynamics simulation of the aggregation phenomenon in the late stages of silica materials preparation. Chem. Eng. Sci. 2018, 184, 62–71. [Google Scholar] [CrossRef]
- Sha, J.; Hu, K.; Li, T.; Cao, Z.; Wan, Y.; Sun, R.; He, H.; Jiang, G.; Li, Y.; Li, T.; et al. Solubility determination, model correlation, solvent effect, molecular simulation and thermodynamic properties of flutamide in eleven pure solvents at different temperatures. J. Mol. Liq. 2021, 336, 115559. [Google Scholar] [CrossRef]
- Sui, J.; Luo, Y.; Zhai, J.; Fan, F.; Zhang, L.; Lu, J.; Zhu, X. Solubility measurement, model evaluation and molecular simulations of aprepitant (form I) in eight pure solvents. J. Mol. Liq. 2020, 304, 112723. [Google Scholar] [CrossRef]
- Wang, M.; Liu, Y.; Du, S.; Zhao, Y.; Liu, S.; Zhou, L.; Wu, S. Determining the solubility and understanding the solid-liquid equilibrium behavior of cyhalothric acid in eleven pure solvents. J. Mol. Liq. 2020, 300, 112365. [Google Scholar] [CrossRef]
- Schröder, B.; Santos, L.; Marrucho, I.; Coutinho, J. Prediction of aqueous solubilities of solid carboxylic acids with COSMO-RS. Fluid. Phase. Equilibr. 2010, 289, 140–147. [Google Scholar] [CrossRef]
- Zhao, X.; Wang, J.; Chen, L.; Liu, L.; Han, Z.; Zhou, C. Crystallization thermodynamics of FOX-7 in three binary mixed solvents. J. Mol. Liq. 2019, 295, 111445. [Google Scholar] [CrossRef]
- Cao, Z.; Zhang, R.; Hu, X.; Sha, J.; Jiang, G.; Li, Y.; Li, T.; Ren, B. Thermodynamic modelling, Hansen solubility parameter and solvent effect of oxaprozin in thirteen pure solvents at different temperatures. J. Chem. Thermodyn. 2020, 151, 106239. [Google Scholar] [CrossRef]
- Apelblat, A.; Manzurola, E. Solubilities of L-aspartic, DL-aspartic, DL-glutamic, p-hydroxybenzoic, o-anisic, p-anisic, and itaconic acids in water from T = 278 K to T = 345 K. J. Chem. Thermodyn. 1997, 29, 1527–1533. [Google Scholar] [CrossRef]
- Apelblat, A.; Manzurola, E. Solubilities of o-acetylsalicylic, 4-aminosalicylic, 3, 5-dinitrosalicylic, andp-toluic acid, and magnesium-DL-aspartate in water from T = (278 to 348) K. J. Chem. Thermodyn. 1999, 31, 85–91. [Google Scholar] [CrossRef]
- Du, S.; Wang, Y.; Li, J.; Wu, S.; Dun, W.; Song, X.; Wang, J.; Gong, J. Correlation and thermodynamic analysis of solubility of diphenhydramine hydrochloride in pure and binary solvents. J. Chem. Thermodyn. 2016, 93, 132–142. [Google Scholar] [CrossRef]
- Shakeel, F.; Bhat, M.; Haq, N. Solubility of N-(4-chlorophenyl)-2-(pyridin-4-ylcarbonyl) hydrazinecarbothioamide (isoniazid analogue) in Transcutol + water cosolvent mixtures at (298.15 to 338.15) K. J. Chem. Eng. Data 2014, 59, 1727–1732. [Google Scholar] [CrossRef]
- Buchowski, H.; Ksiazczak, A.; Pietrzyk, S. Solvent activity along a saturation line and solubility of hydrogen-bonding solids. J. Phys. Chem. A 1980, 84, 975–979. [Google Scholar] [CrossRef]
- Yang, Y.; Tang, W.; Li, X.; Han, D.; Liu, Y.; Du, S.; Zhang, T.; Liu, S.; Gong, J. Solubility of benzoin in six monosolvents and in some binary solvent mixtures at various temperatures. J. Chem. Eng. Data 2017, 62, 3071–3083. [Google Scholar] [CrossRef]
- Alshehri, S.; Haq, N.; Shakeel, F. Solubility, molecular interactions and mixing thermodynamic properties of piperine in various pure solvents at different temperatures. J. Mol. Liq. 2018, 250, 63–70. [Google Scholar] [CrossRef]
- Qin, Y.; Chen, X.; Wang, L.; Wei, X.; Nong, W.; Wei, X.; Liang, J. Experimental determination and computational prediction of dehydroabietic acid solubility in (−)-α-pinene + (−)-β-caryophyllene+ p-cymene system. Molecules 2022, 27, 1220. [Google Scholar] [CrossRef]
- Noubigh, A.; Abderrabba, M. Solid–liquid phase equilibrium and thermodynamic properties of vanillic acid in different pure solvents. J. Mol. Liq. 2016, 223, 261–266. [Google Scholar] [CrossRef]
- Li, C.; Li, Y.; Gao, X.; Lv, H. Rutaecarpine dissolved in binary aqueous solutions of methanol, ethanol, isopropanol and acetone: Solubility determination, solute-solvent and solvent-solvent interactions and preferential solvation study. J. Chem. Thermodyn. 2020, 151, 106253. [Google Scholar] [CrossRef]
- Huang, H.; Qiu, J.; He, H.; Yi, D.; An, M.; Liu, H.; Hu, S.; Han, J.; Guo, Y.; Wei, N.; et al. Determination and correlation of the solubility of d (−)-salicin in pure and binary solvent systems. J. Chem. Eng. Data 2020, 65, 4485–4497. [Google Scholar] [CrossRef]
- Zhang, C.; Jouyban, A.; Zhao, H.; Farajtabar, A.; Acree, W., Jr. Equilibrium solubility, Hansen solubility parameter, dissolution thermodynamics, transfer property and preferential solvation of zonisamide in aqueous binary mixtures of ethanol, acetonitrile, isopropanol and N, N-dimethylformamide. J. Mol. Liq. 2021, 326, 115219. [Google Scholar] [CrossRef]
- Kamlet, M.; Doherty, R.; Abboud, J.; Abraham, M.; Taft, R. Linear solvation energy relationships: 36. Molecular properties governing solubilities of organic nonelectrolytes in water. J. Pharm. Sci. 1986, 75, 338–349. [Google Scholar] [CrossRef] [PubMed]
- Chaires, J. Possible origin of differences between van’t Hoff and calorimetric enthalpy estimates. Biophys. Chem. 1997, 64, 15–23. [Google Scholar] [CrossRef]
- Wei, G.; Zou, Z.; Yang, X.; Long, S.; Xu, L. Solubility and thermodynamic properties of musk xylene in binary mixed solvents from t = (278.15 to 313.15) K. J. Chem. Thermodyn. 2020, 149, 106165. [Google Scholar] [CrossRef]
Disclaimer/Publisher’s Note: The statements, opinions and data contained in all publications are solely those of the individual author(s) and contributor(s) and not of MDPI and/or the editor(s). MDPI and/or the editor(s) disclaim responsibility for any injury to people or property resulting from any ideas, methods, instructions or products referred to in the content. |
© 2023 by the authors. Licensee MDPI, Basel, Switzerland. This article is an open access article distributed under the terms and conditions of the Creative Commons Attribution (CC BY) license (https://creativecommons.org/licenses/by/4.0/).