


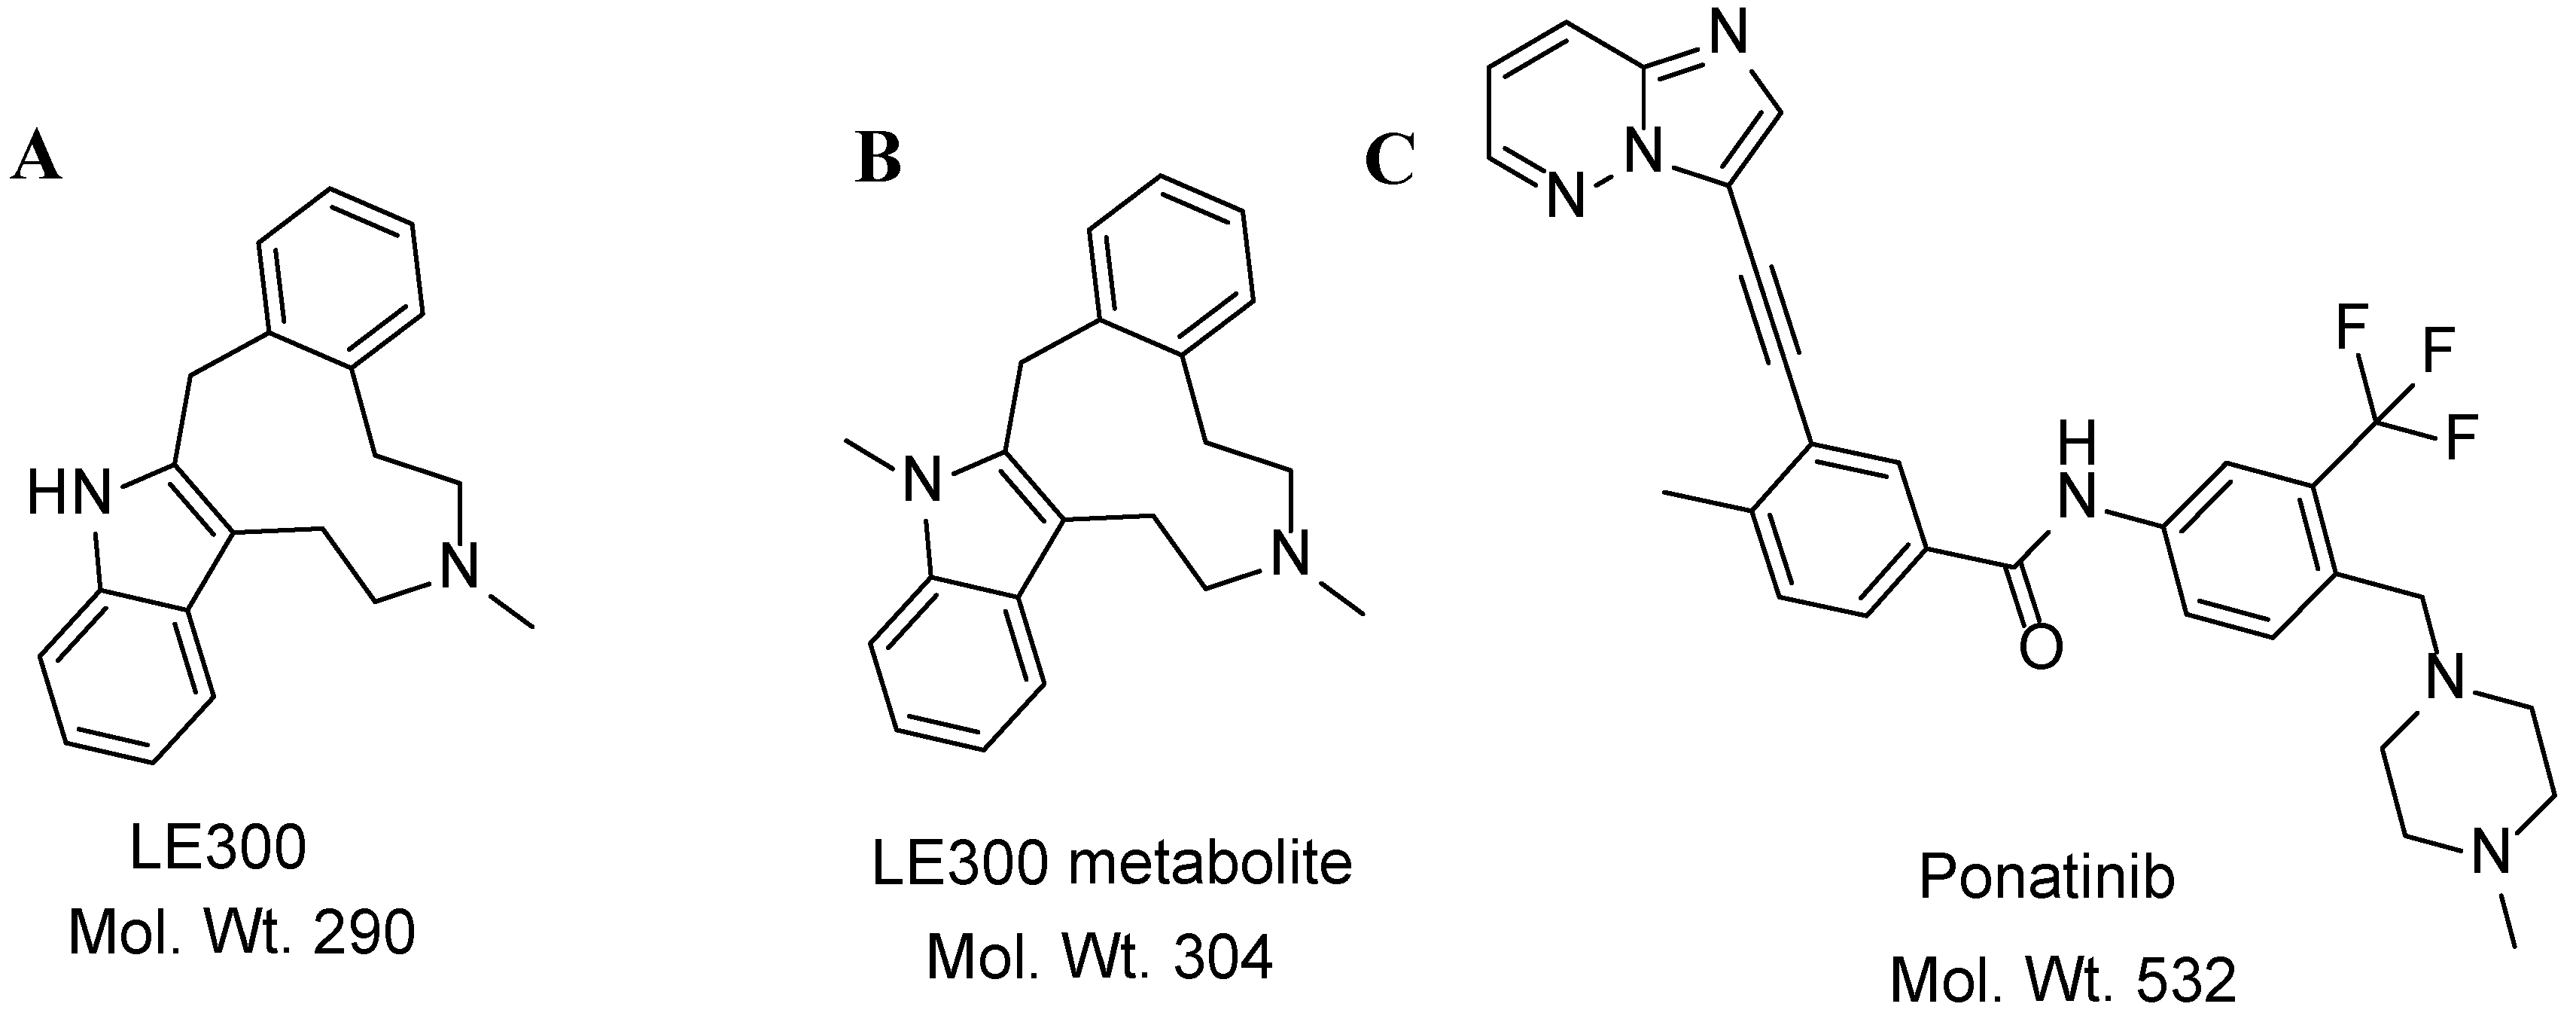
A Liquid Chromatography Tandem Mass Spectrometry Method for the Simultaneous Estimation of the Dopamine Receptor Antagonist LE300 and Its N-methyl Metabolite in Plasma: Application to a Pharmacokinetic Study

 ,
,  and
and
Abstract
:1. Introduction
2. Results and Discussion
2.1. Chromatography and Mass Spectrometry Parameters
2.2. Method Validation
2.2.1. Selectivity
2.2.2. Calibration Curve
2.2.3. Accuracy and Precision
2.2.4. Matrix Effects and Extraction Recovery
2.2.5. Stability
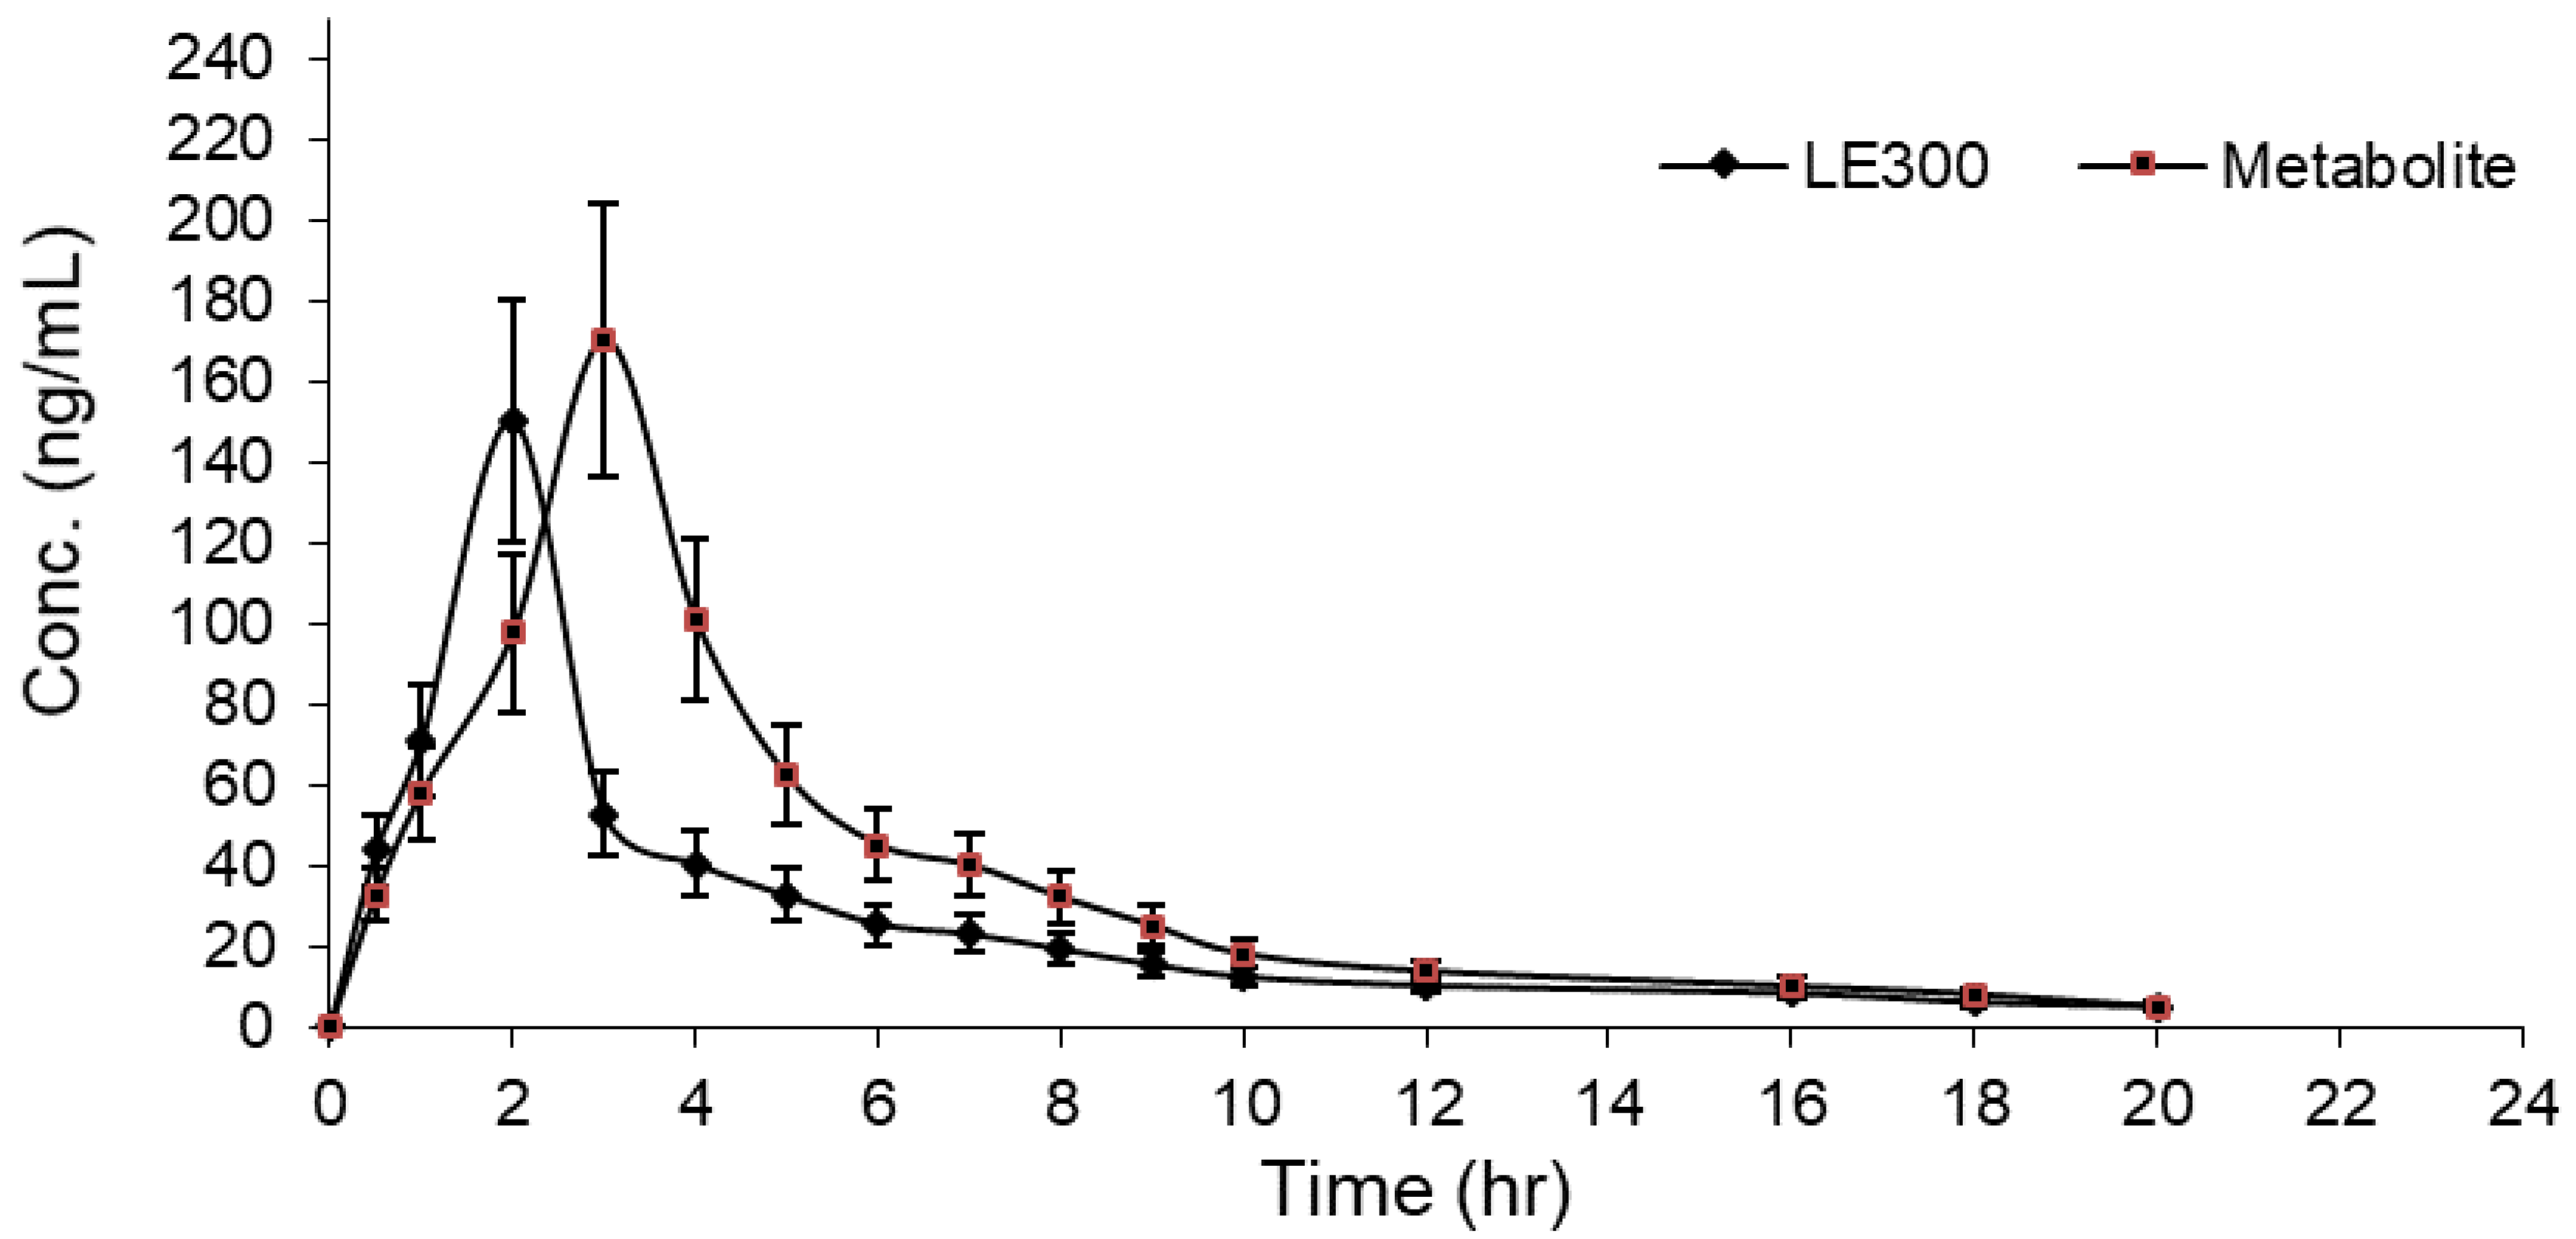
2.3. Pharmacokinetic Study
3. Material and Methods
3.1. Materials
3.2. LC–MS/MS Analysis
3.3. Calibration Standard Solutions and QC Sample Preparation
3.4. Sample Preparation
3.5. Method Validation
3.6. Application to Pharmacokinetic Studies
4. Conclusions
Author Contributions
Funding
Institutional Review Board Statement
Informed Consent Statement
Data Availability Statement
Acknowledgments
Conflicts of Interest
Sample Availability
References
- Witt, T.; Hock, F.J.; Lehmann, J. 7-Methyl-6, 7, 8, 9, 14, 15-hexahydro-5 H-benz [d] indolo [2, 3-g] azecine: A new heterocyclic system and a new lead compound for dopamine receptor antagonists. J. Med. Chem. 2000, 43, 2079–2081. [Google Scholar] [CrossRef] [PubMed]
- Decker, M.; Schleifer, K.-J.; Nieger, M.; Lehmann, J. Dopamine/serotonin receptor ligands. Part VIII [1]: The dopamine receptor antagonist LE300-modelled and X-ray structure plus further pharmacological characterization, including serotonin receptor binding, biogenic amine transporter testing and in vivo testings. Eur. J. Med. Chem. 2004, 39, 481–489. [Google Scholar] [PubMed]
- Hoefgen, B.; Decker, M.; Mohr, P.; Schramm, A.M.; Rostom, S.A.; El-Subbagh, H.; Schweikert, P.M.; Rudolf, D.R.; Kassack, M.U.; Lehmann, J. Dopamine/Serotonin Receptor Ligands. 10: 1 SAR studies on azecine-type dopamine receptor ligands by functional screening at human cloned D1, D2L, and D5 receptors with a microplate reader based calcium assay lead to a novel potent D1/D5 selective antagonist. J. Med. Chem. 2006, 49, 760–769. [Google Scholar] [PubMed]
- Robaa, D.; Kretschmer, R.; Siol, O.; AbulAzm, S.E.; ElKhawass, E.; Lehmann, J.; Enzensperger, C. Residues at the Indole-NH of LE300 Modulate Affinities and Selectivities for Dopamine Receptors. Arch. Der Pharm. 2011, 344, 28–36. [Google Scholar] [CrossRef] [PubMed]
- Silverman, R.B.; Holladay, M.W. The Organic Chemistry of Drug Design and Drug Action, 3rd ed.; Academic Press: Cambridge, MA, USA, 2014. [Google Scholar]
- Hefnawy, M.; Mohamed, M.; Abunassif, M.; Alanazi, A.; Al-Majed, A.; Jochen, L.; Mostafa, G.A.H. Spectrofluorimetric determination of dopamine receptor antagonist LE 300 in mice plasma. Luminescence 2016, 31, 63–66. [Google Scholar] [CrossRef] [PubMed]
- Hefnawy, M.; Alanazi, A.; Abounassif, M.; Mohammed, M.; Al-Swaidan, I.; Attia, S.; Mostafa, G.; El-Subbagh, H.; Lehmann, J. Selective Analysis of Dopamine Receptor Antagonist LE300 and its N-Methyl Metabolite in Mouse Sera at the Trace Level by HPLC–Fluorescence Detection. Chromatographia 2015, 78, 655–661. [Google Scholar] [CrossRef]
- Al-Majed, A.A.; Hefnawy, M.M.; Mohammed, M.S.; Attia, S.M.; Lehmann, J. Selective microemulsion liquid chromatography analysis of dopamine receptor antagonist LE300 and its N-methyl metabolite in mouse sera by using a monolithic silica column. J. Chromatogr. B 2015, 989, 104–111. [Google Scholar] [CrossRef] [PubMed]
- United State of America–Food and Drug Administration. Bioanalytical Method Validation Guidance for Industry. 2018. Available online: https://www.fda.gov/ucm/groups/fdagov-public/@fdagov-drugsgen/documents/document/ucm070107.pdf (accessed on 5 December 2022).
- Hubert, P.; Nguyen-Huu, J.-J.; Boulanger, B.; Chapuzet, E.; Chiap, P.; Cohen, N.; Compagnon, P.-A.; Dewé, W.; Feinberg, M.; Lallier, M. Harmonization of strategies for the validation of quantitative analytical procedures: A SFSTP proposal–part II. J. Pharm. Biomed. Anal. 2007, 45, 70–81. [Google Scholar] [CrossRef] [PubMed]
- Sennbro, C.J.; Knutsson, M.; Timmerman, P.; Van Amsterdam, P. Anticoagulant counter ion impact on bioanalytical LC–MS/MS assay performance: Additional validation required? Bioanalysis 2011, 3, 2389–2391. [Google Scholar] [CrossRef] [PubMed]
- González, O.; Blanco, M.E.; Iriarte, G.; Bartolomé, L.; Maguregui, M.I.; Alonso, R.M. Bioanalytical chromatographic method validation according to current regulations, with a special focus on the non-well defined parameters limit of quantification, robustness and matrix effect. J. Chromatogr. A 2014, 1353, 10–27. [Google Scholar] [CrossRef] [PubMed]
- Mohammed, M.S.; Hefnawy, M.M.; Al-Majed, A.A.; Alrabiah, H.K.; Algrain, N.A.; Obaidullah, A.J.; Altamimi, A.S.; Bin Jardan, Y.A.; Al-Hossaini, A.M. Development and Validation of a Chiral Liquid Chromatographic Assay for Enantiomeric Separation and Quantification of Verapamil in Rat Plasma: Stereoselective Pharmacokinetic Application. Molecules 2021, 26, 2091. [Google Scholar] [CrossRef] [PubMed]
- Hefnawy, M.; Al-Majed, A.; Alrabiah, H.; Algrain, N.; Mohammed, M.; Bin Jardand, Y. Rapid and sensitive LC-MS/MS method for the enantioanalysis ofverapamil in rat plasma using superficially porous silicaisopropyl-cyclofructan 6 chiral stationary phase after SPE: Applicationto a stereoselective pharmacokinetic study. J. Pharm. Biomed. Anal. 2021, 201, 114108. [Google Scholar] [CrossRef] [PubMed]
- Al-Shehri, M.; Hefnawy, M.; Abuelizz, H.; Alzamil, A.; Mohammed, M.; Alsaif, N.; Almehizia, A.; Alkahtani, H.; Abounassif, M. Development and validation of an UHPLC-MS/MS method for simultaneous determination of palbociclib, letrozole and its metabolite carbinol in rat plasma and pharmacokinetic study application. Arab. J. Chem. 2020, 13, 4024–4034. [Google Scholar] [CrossRef]
- Hefnawy, M.; Hammad, S.; Kadi, A.; Alsaif, N.; Mohammed, M.; Al-Hossaini, A.; Bin Jardan, Y.; Attwa, M.; Abou-El-Alamin, M. Effective quantification of ravidasvir (an NS5A inhibitor) and sofosbuvir in rat plasma by validated LC-MS/MS method and its application to pharmacokinetic study. Arab. J. Chem. 2020, 13, 8160–8171. [Google Scholar] [CrossRef]
- Council, N.R. Guide for the Care and Use of Laboratory Animals; National Academies Press: Washington, DC, USA, 2010. [Google Scholar]
- Hefnawy, M.M.; Alanazi, M.M.; Al-Hossaini, A.M.; Alnasser, A.I.; El-Azab, A.S.; Bin Jardan, Y.A.; Attwa, M.W.; El-Gendy, M.A. A Rapid and Sensitive Liquid Chromatography-Tandem Mass Spectrometry Bioanalytical Method for the Quantification of Encorafenib and Binimetinib as a First-Line Treatment for Advanced (Unresectable or Metastatic) Melanoma—Application to a Pharmacokinetic Study. Molecules 2023, 28, 79. [Google Scholar] [CrossRef]
- Decker, M.; Lehmann, J. LE300—New results on its ability to antagonize the discriminative stimulus effects of cocaine. Pharmazie 2006, 61, 248–250. [Google Scholar] [PubMed]
- Zhang, Y.; Huo, M.; Zhoua, J.; Xie, S. PKSolver: An add-in program for pharmacokinetic and pharmacodynamic data analysis in Microsoft Excel. Comput. Methods Programs Biomed. 2010, 99, 306–314. [Google Scholar] [CrossRef] [PubMed]


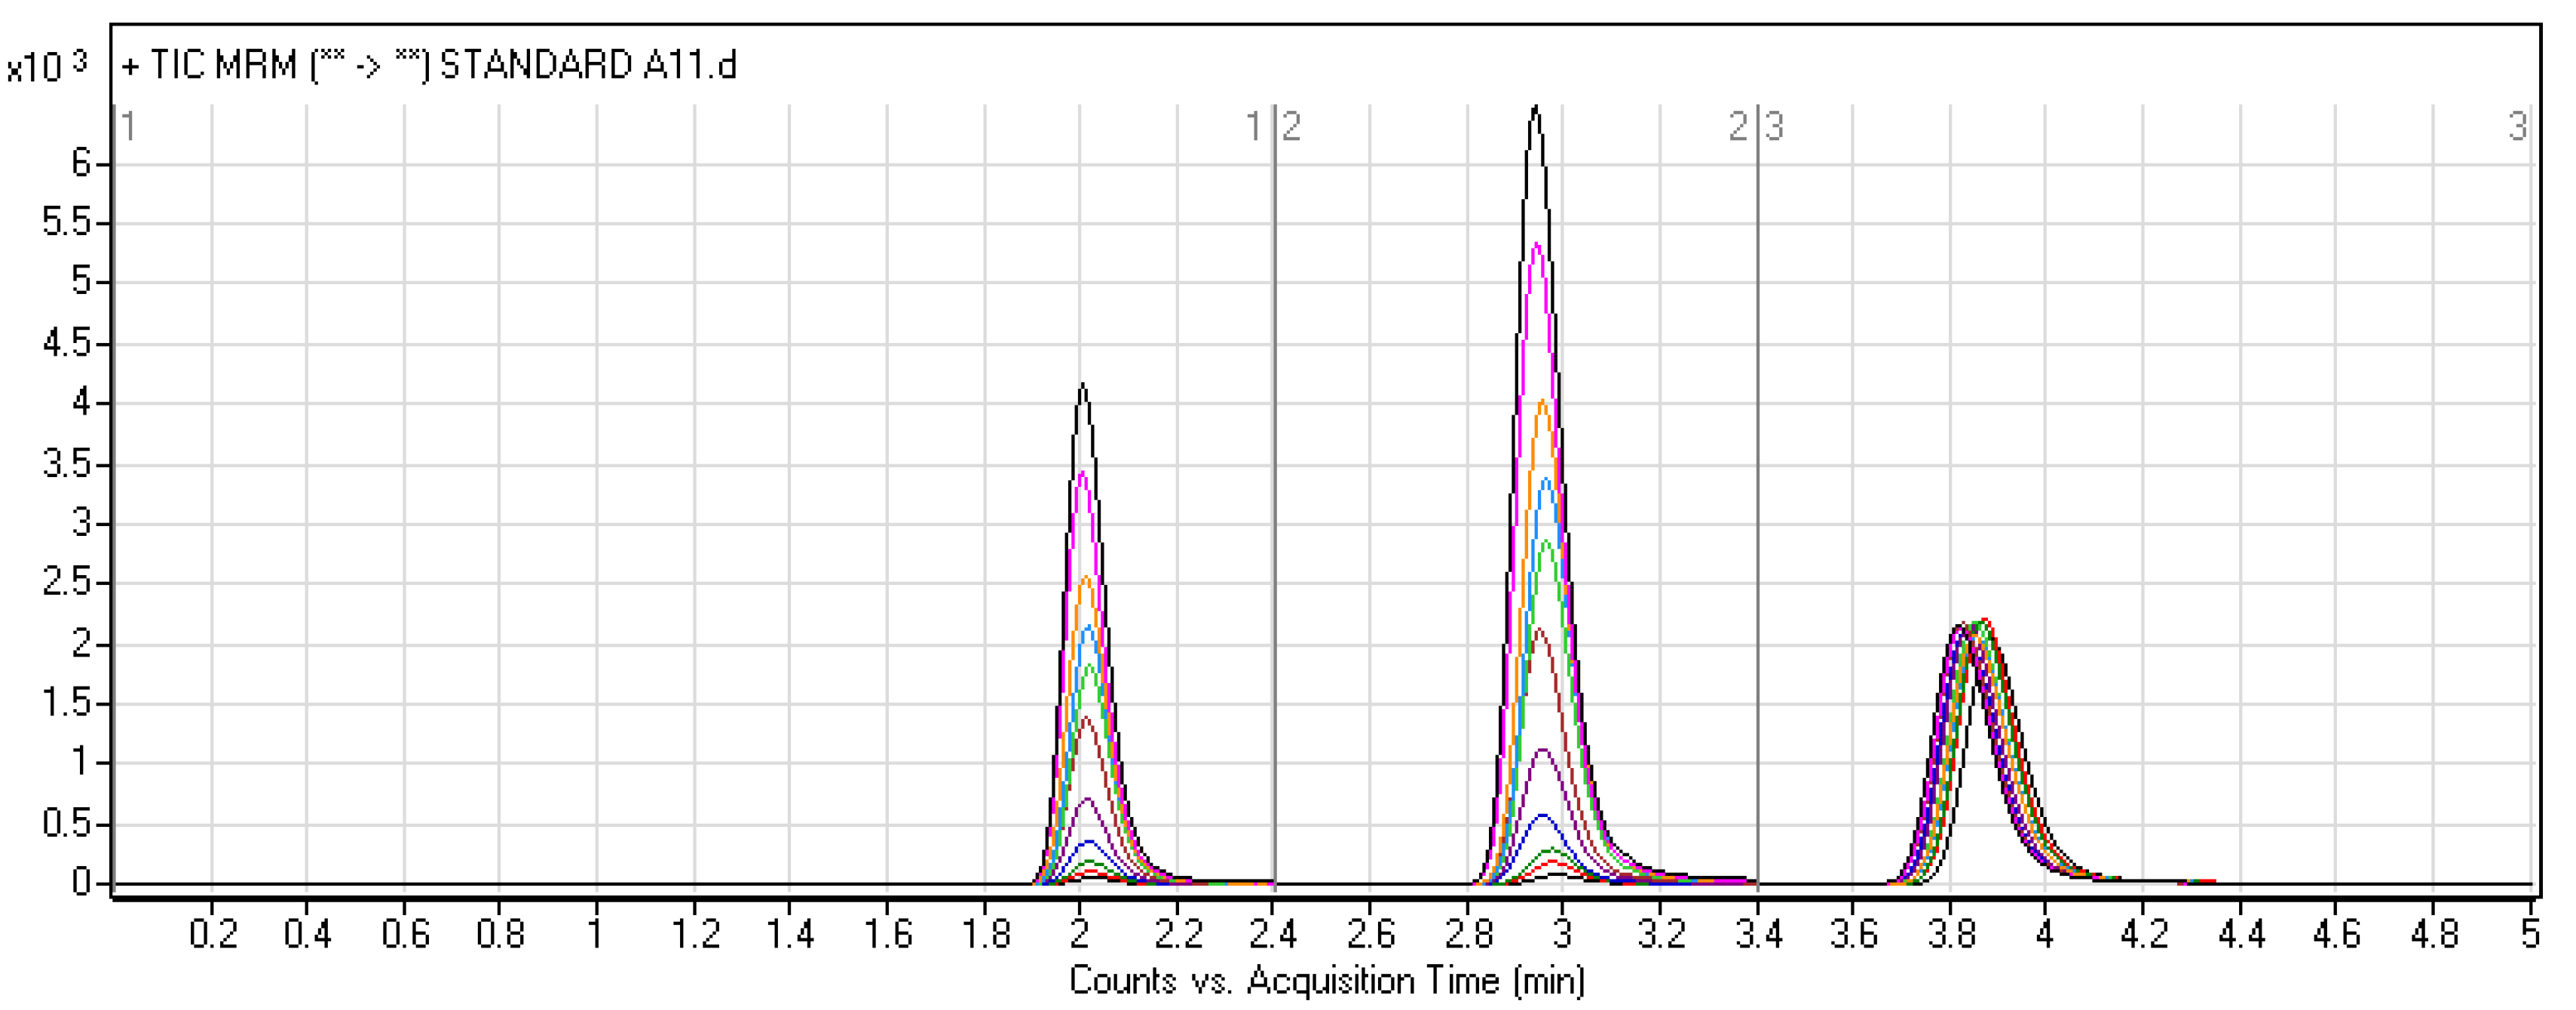
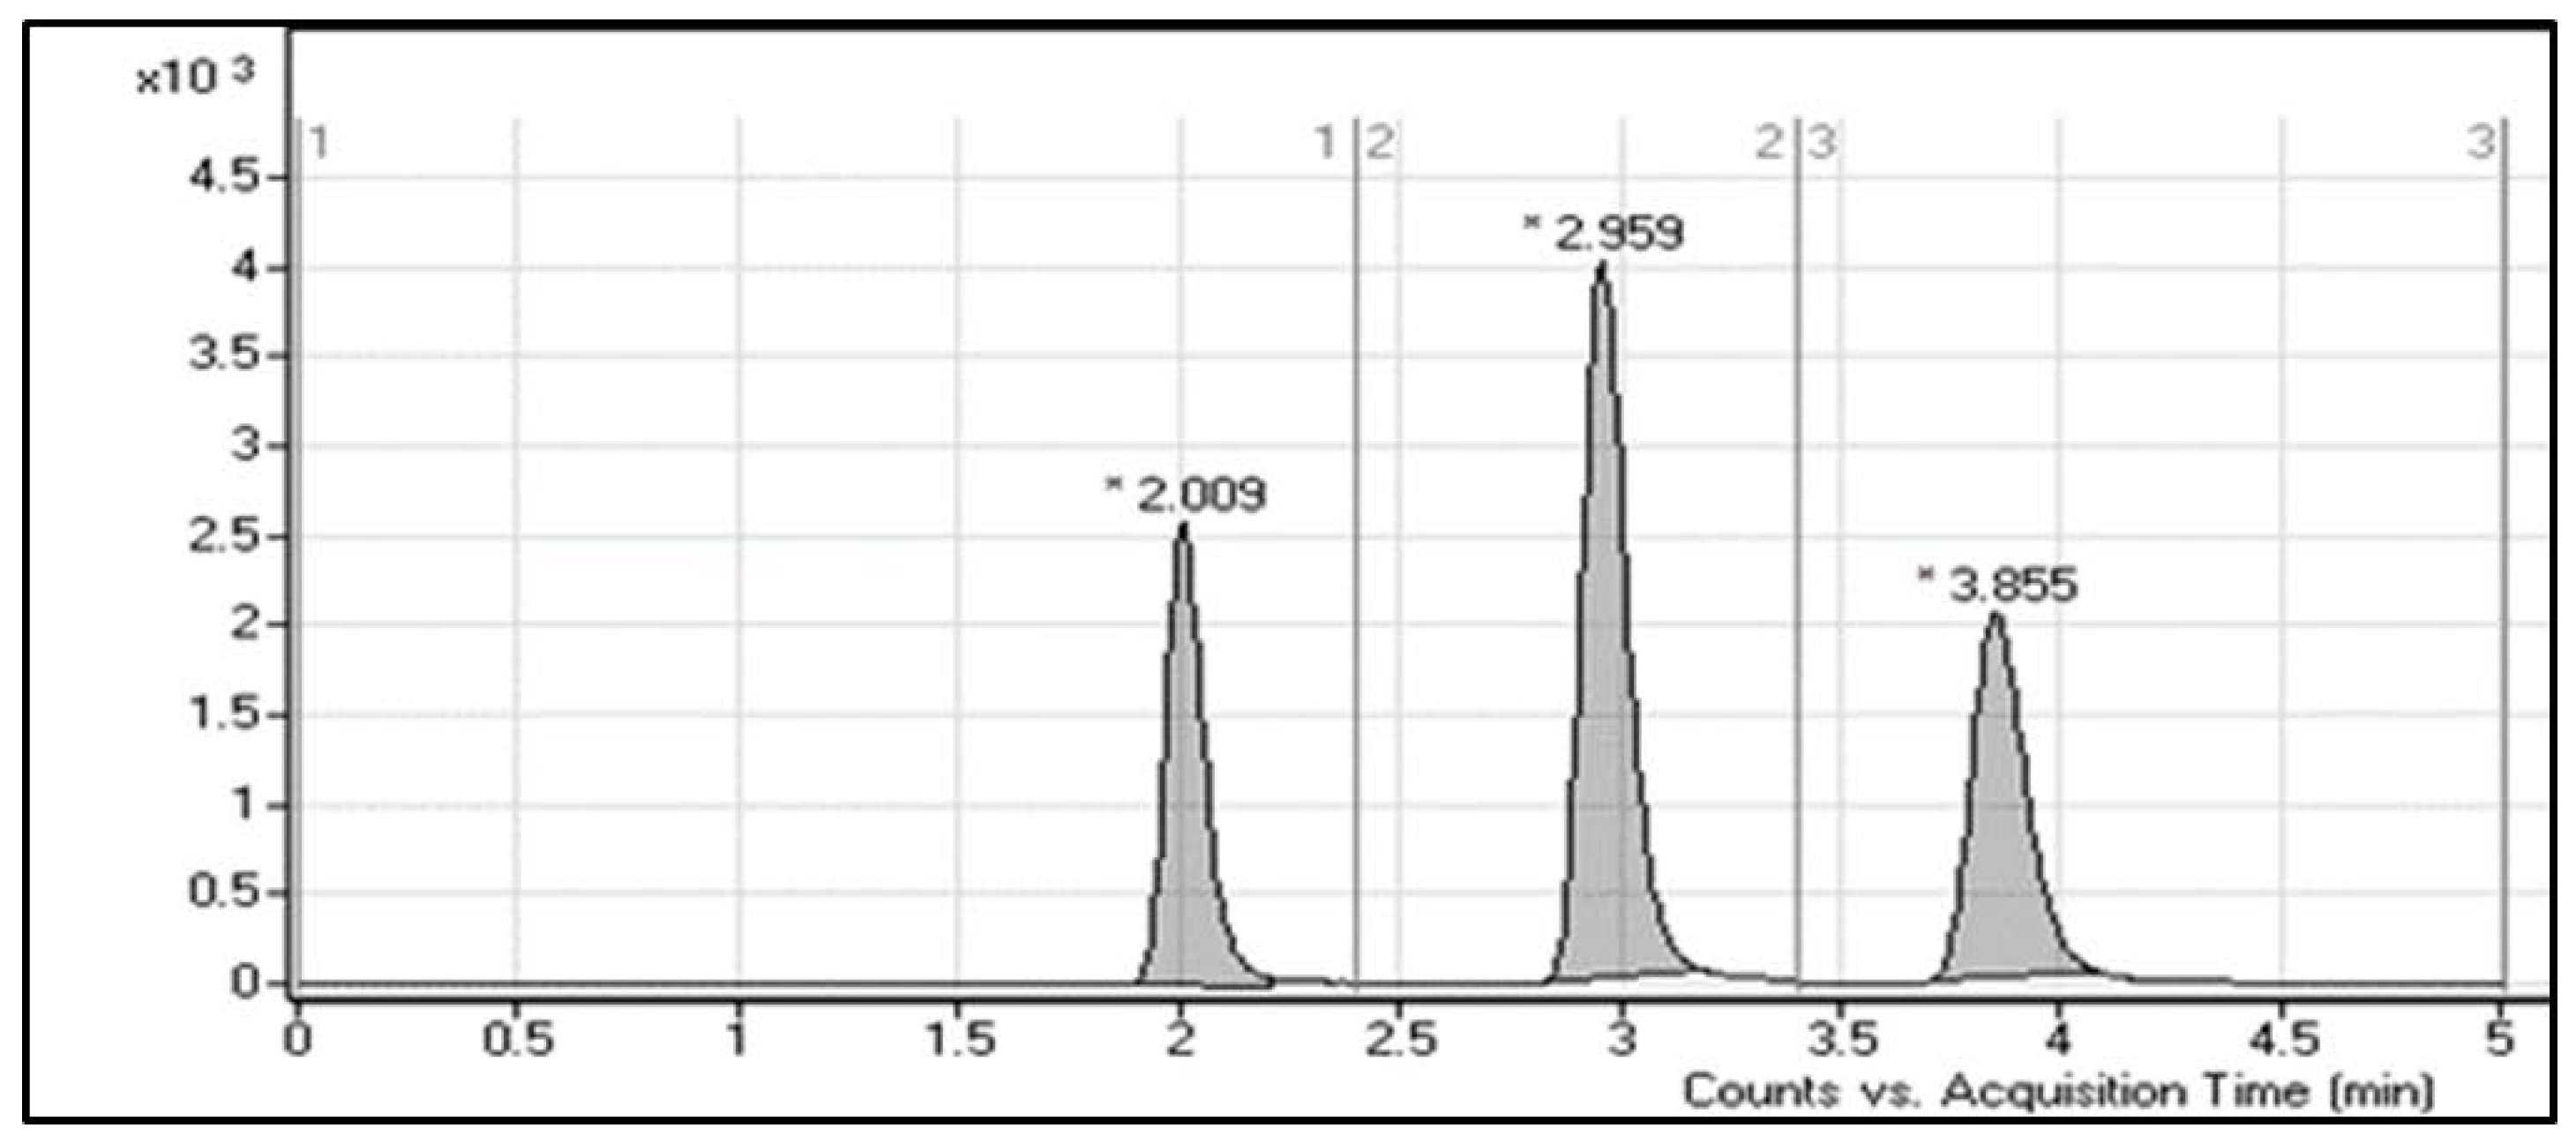
| Molecules | Elution Time (min) | Ion Mode | MRM Transitions (m/z) | Collision Energy (eV) |
|---|---|---|---|---|
| LE300 | 2.0 ± 0.1 | + | 291.0 > 160,246 | 20, 22 |
| MLE300 | 3.0 ± 0.2 | + | 305 > 158,248 | 20, 18 |
| Ponatinib (IS) | 3.8 ± 0.1 | + | 533 > 260,433 | 18 |
| Parameters | LE300 | MLE300 |
|---|---|---|
| Linearity range (ng/mL) | 1–200 | 2–200 |
| Intercept (a) | 1.79 × 10⁻² | 2.38 × 10⁻² |
| Slope (b) | 3.4 × 10⁻³ | 1.29 × 10⁻³ |
| Correlation coefficient (r) | 0.9997 | 0.9984 |
| SY/N a | 1.01 × 10⁻² | 2.38 × 10⁻² |
| Sa b | 5.63 × 10⁻³ | 3.43 × 10⁻³ |
| Sb c | 3.12 × 10⁻³ | 1.43 × 10⁻³ |
| LLOD (ng/mL) | 0.3 | 0.7 |
| Nominal Conc. (ng/mL) | Mean a | Precision (RSD%) | Accuracy (RE%) | ||||
|---|---|---|---|---|---|---|---|
| LE300 | MLE300 | LE300 | MLE300 | LE300 | MLE300 | LE300 | MLE300 |
| 1 | 1 | 0.98 ± 0.12 | 0.98 ± 1.01 | 1.59 | 1.21 | −2.33 | −1.49 |
| 2 | 2 | 1.98 ± 0.07 | 2.01 ± 2.91 | 1.07 | 2.19 | −1.10 | −1.65 |
| 4 | 4 | 3.94 ± 0. 80 | 3.99 ± 1.23 | 1.98 | 0.69 | −1.63 | −1.04 |
| 8 | 8 | 7.89 ± 2.10 | 7.99 ± 0.19 | 0.87 | 0.06 | −1.41 | −1.08 |
| 16 | 16 | 15.64 ± 1.60 | 15.96 ± 3.20 | 1.59 | 0.99 | −2.27 | −1.38 |
| 32 | 32 | 30.78 ± 0.25 | 31.96 ± 1.92 | 1.58 | 0.61 | −3.82 | −1.57 |
| 60 | 60 | 59.17 ± 0.49 | 60.07 ± 1.63 | 2.39 | 0.53 | −1.39 | −1.48 |
| 80 | 80 | 78.97 ± 1.42 | 80.06 ± 1.65 | 1.42 | 0.51 | −1.29 | −1.49 |
| 100 | 100 | 98.48 ± 1.12 | 99.73 ± 1.79 | 1.42 | 0.80 | −1.52 | −1.54 |
| 120 | 120 | 117.94 ± 1.39 | 119.47 ± 1.80 | 1.62 | 0.73 | −1.72 | −1.01 |
| 160 | 160 | 156.45 ± 254 | 159.28 ± 2.37 | 1.62 | 0.45 | −2.22 | −1.49 |
| 200 | 200 | 195.62 ± 2.76 | 198.83 ± 1.26 | 1.41 | 0.45 | −2.19 | −0.87 |
| Actual Conc. (ng/mL) | Experimental (ng/mL) | RSD (%) a | Accuracy (%) b | |||||
|---|---|---|---|---|---|---|---|---|
| Analyte | LE300 | MLE300 | LE300 | MLE300 | LE300 | MLE300 | LE300 | MLE300 |
| Intra-day c | 1 | 2 | 0.94 | 1.89 | 2.12 | 2.51 | −6.00 | −5.50 |
| 3 | 6 | 2.91 | 5.83 | 3.17 | 2.87 | −3.00 | −2.83 | |
| 75 | 90 | 73.72 | 86.98 | 1.37 | 1.86 | −1.70 | −3.35 | |
| 175 | 180 | 174.71 | 175.69 | 2.45 | 2.91 | −1.70 | −2.39 | |
| Inter-day c | 1 | 2 | 0.93 | 1.87 | 2.85 | 1.15 | −7.00 | −6.50 |
| 3 | 6 | 2.89 | 5.83 | 2.56 | 1.97 | −3.66 | −2.83 | |
| 75 | 90 | 72.93 | 87.64 | 1.49 | 1.73 | −2.76 | −2.62 | |
| 175 | 180 | 171.60 | 174.25 | 2.86 | 2.18 | −1.94 | −3.19 | |
| Nominal Concentration (ng/mL) | LE300 | MLE300 | IS | ||||
|---|---|---|---|---|---|---|---|
| 3 ng/mL | 75 ng/mL | 175 ng/mL | 6 ng/mL | 90 ng/mL | 180 ng/mL | 20 ng/mL | |
| Mean a | 2.83 | 71.14 | 172.68 | 5.61 | 86.85 | 176.92 | 19.17 |
| Recovery (%) | 94.33 | 94.85 | 98.67 | 93.50 | 96.51 | 98.29 | 95.85 |
| RSD% | 1.76 | 1.37 | 1.48 | 2.13 | 1.85 | 1.94 | 1.96 |
| Analyte | Nominal Con. (ng/mL) | Freeze-Thaw Stability (3 Cycilic−80 °C) | Short-Team Stability (4 h at Room T) | Long-Team Stability (−80 °C for 28 d) | Autosampler Stability (24 h at 15 °C) |
|---|---|---|---|---|---|
| LE300 | 3 | 97.9 ± 1.5 | 98.5 ± 1.6 | 97.7 ± 1.4 | 98.5 ± 1.8 |
| 175 | 99.2 ± 1.3 | 98.3 ± 1.8 | 99.2 ± 1.7 | 98.9 ± 1.3 | |
| MLE300 | 6 | 98.2 ± 1.4 | 97.9 ± 1.6 | 98.9 ± 1.4 | 99.3 ± 1.7 |
| 180 | 99.5 ± 1.5 | 98.8 ± 1.8 | 99.2 ± 2.3 | 98.5 ± 1.7 |
| Parameters * | Unit | LE300 | MLE300 |
|---|---|---|---|
| AUC0–24 a | ng·h/mL | 523.61 ± 24.26 | 761.86 ± 34.29 |
| AUC0–∞ b | ng·h/mL | 576.82 ± 22.36 | 789.54 ± 37.23 |
| Cmax c | ng/mL | 150.15 ± 17.68 | 170.40 ± 26.33 |
| Tmax d | h | 2.00 ± 0.18 | 3.00 ± 0.18 |
| t1/2kel e | h | 7.38 ± 0.17 | 4.56 ± 0.29 |
| CL/F f | L/h | 0.017 ± 0.01 | 0.012 ± 0.01 |
| Name | Source |
|---|---|
| N-methyl metabolite of LE300 | Kindly gifted from Dr. J. Lehmann at Institut fur Pharmazie, Universitat Jena, Germany |
| Ponatinib | LC Laboratories (USA) |
| LE300, formic acid (HCOOH), acetonitrile (ACN) and ammonium formate | Sigma-Aldrich (USA) |
| HPLC grade water | Milli-Q plus purification instrument (Millipore, USA) |
| Wistar healthy male rats | The center for Experimental Animals at College of Pharmacy (KSU, Saudi Arabia) |
| Liquid Chromatography | Mass Spectrometer | ||
|---|---|---|---|
| RRLC | Agilent 1200 | Mass spectrometer | 6410 Triple Quad of Agilent |
| Isocratic mobile phase | 58% ACN | Ionization source | Positive ESI |
| 42% 10 mM ammonium formate (pH: 4.2 by addition of HCOOH) | Low-purity N2 gas as drying gas: Flow rate at 12 L/min with 60 psi pressure | ||
| 0.3 mL/min flow rate | |||
| 5 μL injection volume | |||
| Agilent eclipse plus C18 Column | 50 mm L | Source T at 350 °C | |
| 2.1 mm ID | Capillary voltage at 4000 V | ||
| 1.8 μm PS | Collision gas | High-purity N2 gas | |
| T: 22 ± 1 °C | Scan mode | MRM | |
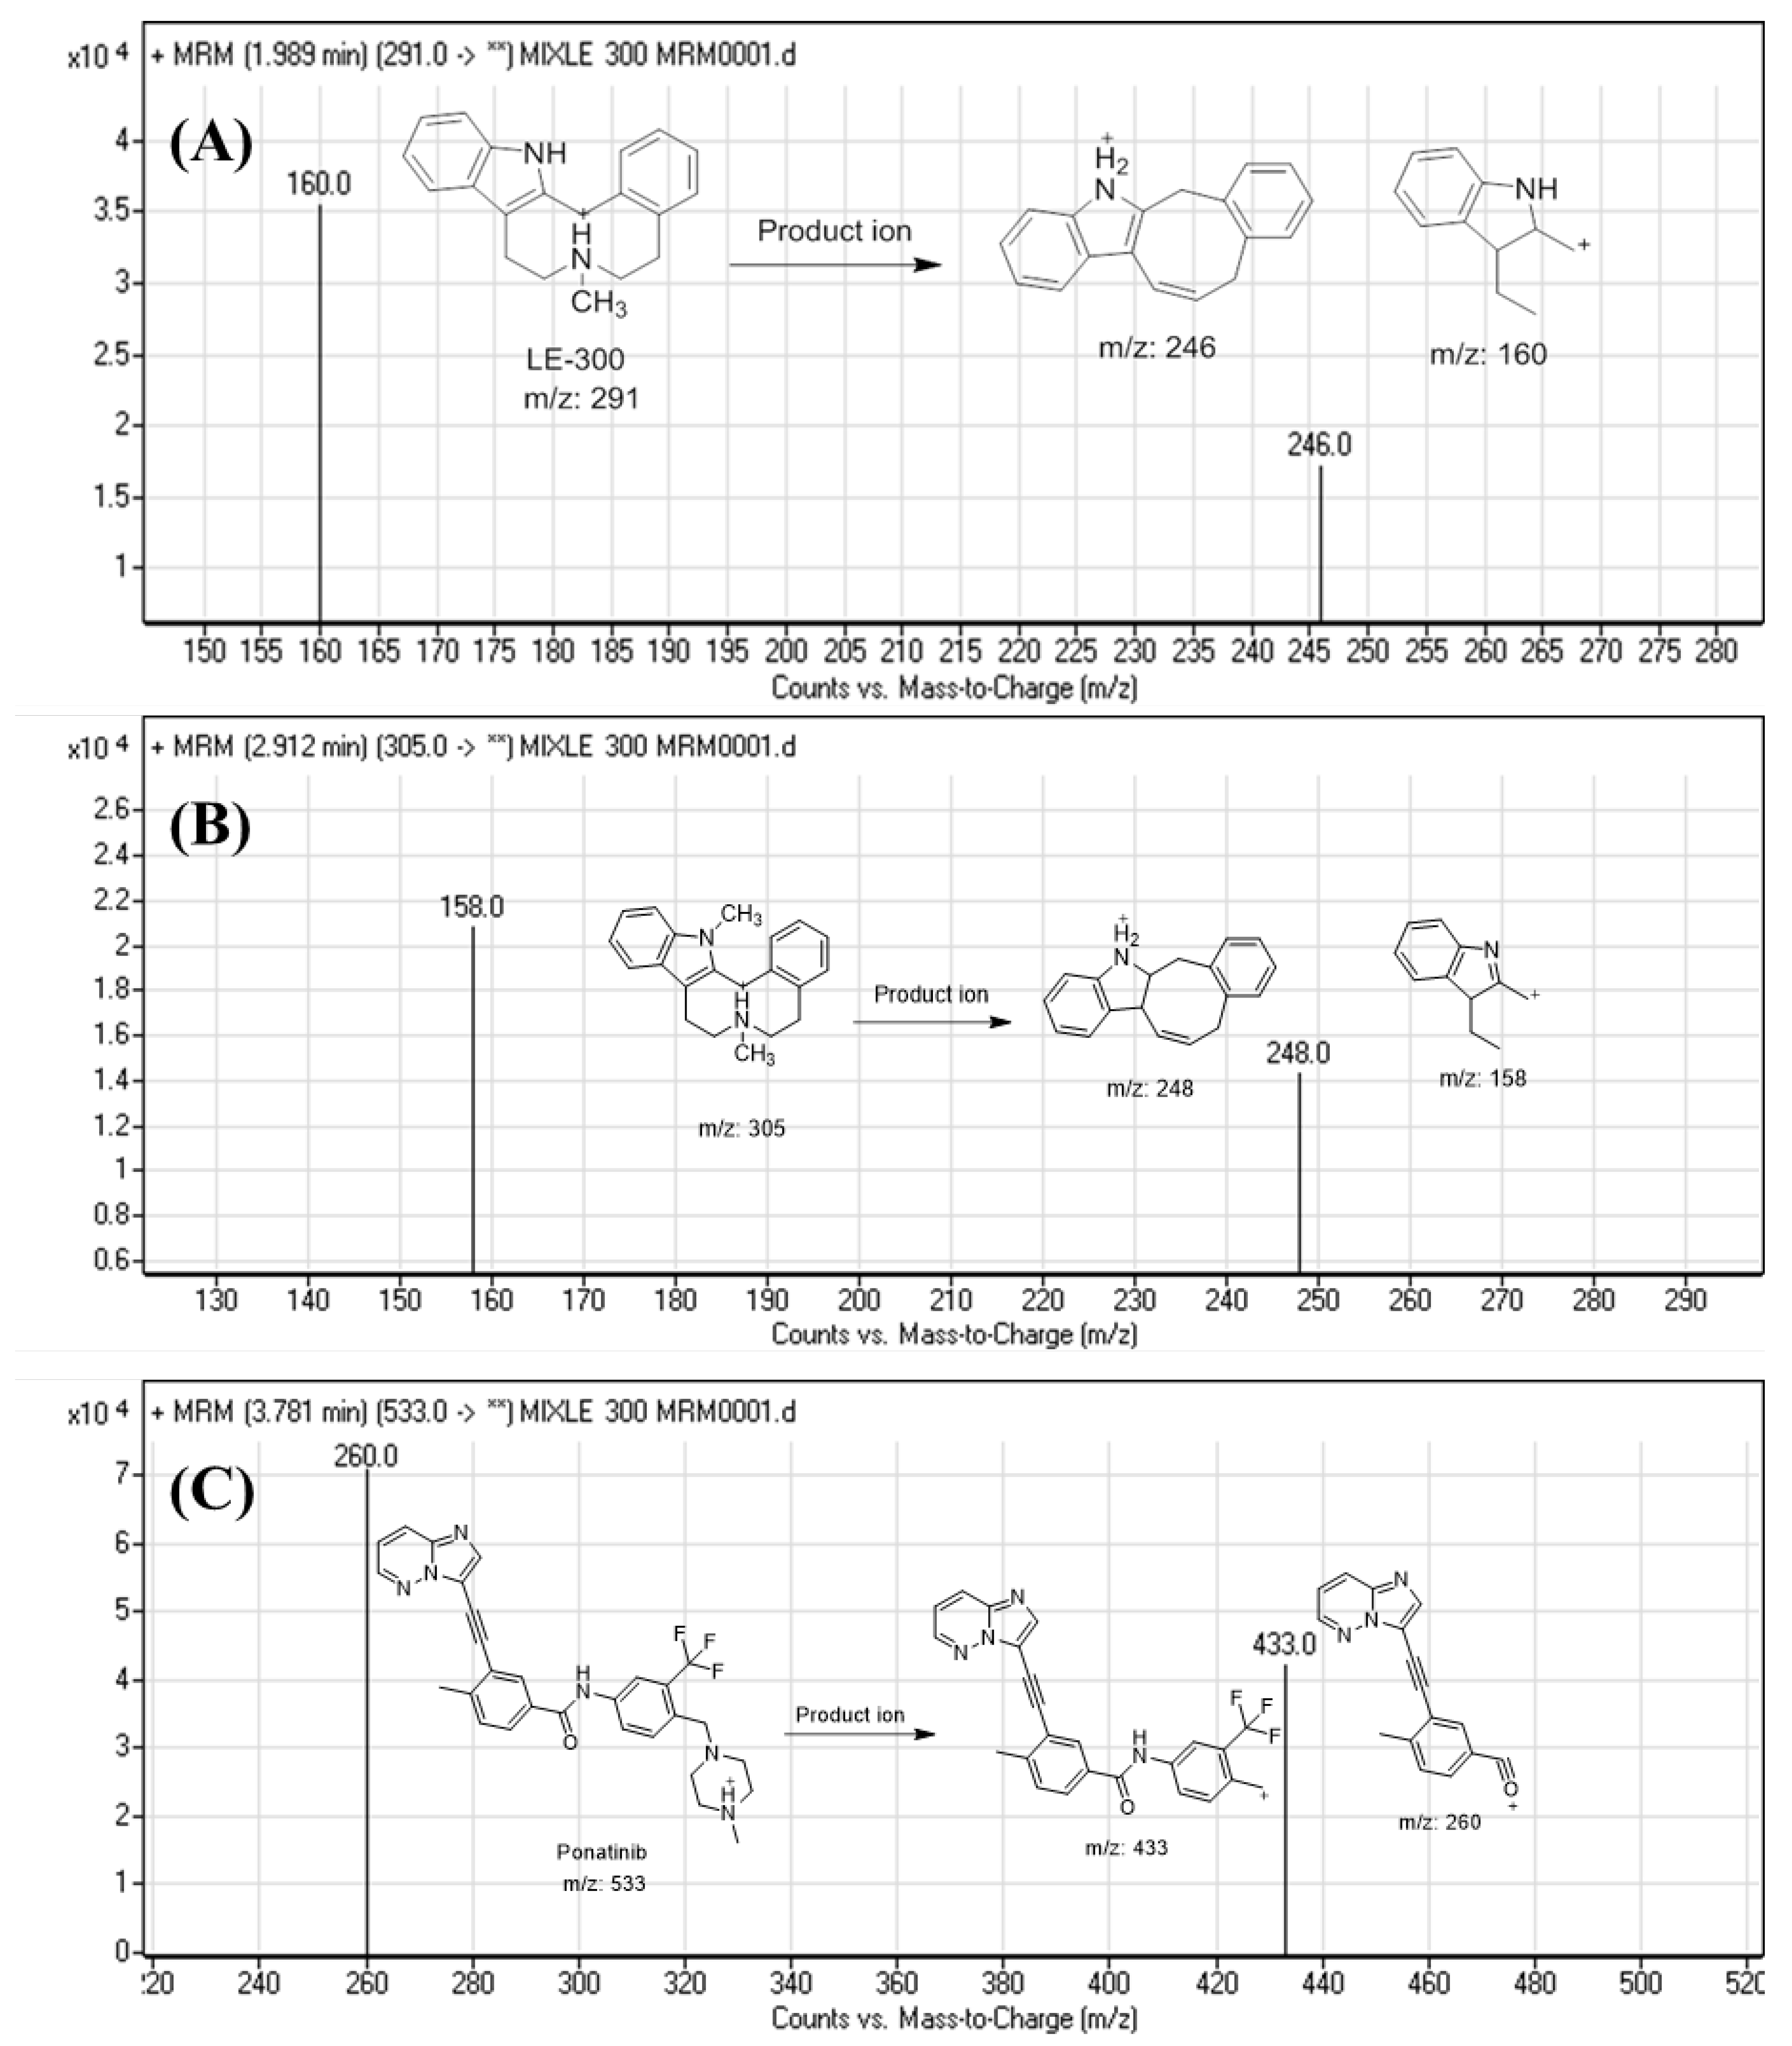
| Analyte | LE300 | LE300 mass transitions FV: Fragmentor voltage CE: Collison energy | m/z 291→m/z 160 (FV is 145 V and CE: 20 eV) |
| m/z 291→m/z 246 (FV is 140 V and CE: 22 eV) | |||
| Metabolite | N-methyl LE300 (MLE300) | MLE300 mass transitions FV: Fragmentor voltage CE: Collison energy | m/z 305→m/z 158 (FV is 140 V and CE: 20 eV) |
| m/z 291→m/z 248 (FV is 135 V and CE: 18 eV) | |||
| Internal standard | Ponatinib | IS mass transitions | m/z 533→m/z 433 (FV is 145 V and CE: 18 eV) |
| m/z 533→m/z 260 (FV is 140 V and CE: 20 eV) | |||
Disclaimer/Publisher’s Note: The statements, opinions and data contained in all publications are solely those of the individual author(s) and contributor(s) and not of MDPI and/or the editor(s). MDPI and/or the editor(s) disclaim responsibility for any injury to people or property resulting from any ideas, methods, instructions or products referred to in the content. |
© 2023 by the authors. Licensee MDPI, Basel, Switzerland. This article is an open access article distributed under the terms and conditions of the Creative Commons Attribution (CC BY) license (https://creativecommons.org/licenses/by/4.0/).
Share and Cite
Hefnawy, M.M.; Attwa, M.W.; Alzamil, A.A.; El-Gendy, M.A.; El-Azab, A.S.; Jardan, Y.A.B.; El-Gamal, A.A. A Liquid Chromatography Tandem Mass Spectrometry Method for the Simultaneous Estimation of the Dopamine Receptor Antagonist LE300 and Its N-methyl Metabolite in Plasma: Application to a Pharmacokinetic Study. Molecules 2023, 28, 1553. https://doi.org/10.3390/molecules28041553
Hefnawy MM, Attwa MW, Alzamil AA, El-Gendy MA, El-Azab AS, Jardan YAB, El-Gamal AA. A Liquid Chromatography Tandem Mass Spectrometry Method for the Simultaneous Estimation of the Dopamine Receptor Antagonist LE300 and Its N-methyl Metabolite in Plasma: Application to a Pharmacokinetic Study. Molecules. 2023; 28(4):1553. https://doi.org/10.3390/molecules28041553
Chicago/Turabian StyleHefnawy, Mohamed M., Mohamed W. Attwa, Adeeba A. Alzamil, Manal A. El-Gendy, Adel S. El-Azab, Yousef A. Bin Jardan, and Ali A. El-Gamal. 2023. "A Liquid Chromatography Tandem Mass Spectrometry Method for the Simultaneous Estimation of the Dopamine Receptor Antagonist LE300 and Its N-methyl Metabolite in Plasma: Application to a Pharmacokinetic Study" Molecules 28, no. 4: 1553. https://doi.org/10.3390/molecules28041553
APA StyleHefnawy, M. M., Attwa, M. W., Alzamil, A. A., El-Gendy, M. A., El-Azab, A. S., Jardan, Y. A. B., & El-Gamal, A. A. (2023). A Liquid Chromatography Tandem Mass Spectrometry Method for the Simultaneous Estimation of the Dopamine Receptor Antagonist LE300 and Its N-methyl Metabolite in Plasma: Application to a Pharmacokinetic Study. Molecules, 28(4), 1553. https://doi.org/10.3390/molecules28041553