Article

Development of a Novel LC-MS/MS Multi-Method for the Determination of Regulated and Emerging Food Contaminants Including Tenuazonic Acid, a Chromatographically Challenging Alternaria Toxin

1
Mertcontrol Hungary Ltd., 2144 Kerepes, Hungary
2
Program for the Environment and Sustainability, Department of Environmental and Occupational Health, School of Public Health, Texas A&M University, 1266 TAMU, College Station, TX 77843, USA
*
Authors to whom correspondence should be addressed.
Molecules 2023, 28(3), 1468; https://doi.org/10.3390/molecules28031468
Submission received: 17 January 2023 / Revised: 31 January 2023 / Accepted: 31 January 2023 / Published: 2 February 2023
(This article belongs to the Special Issue Chromatographic Analysis of Pesticide in Environmental and Food)

Abstract

:
The regulation of food contaminants in the European Union (EU) is comprehensive, and there are several compounds in the register or being added to the recommendation list. Recently, European standard methods for analysis have also been issued. The quick analysis of different groups of analytes in one sample requires a number of methods and the simultaneous use of various instruments. The aim of the present study was to develop a method that could analyze several groups of food contaminants: in this case, 266 pesticides, 12 mycotoxins, 14 alkaloid toxins, and 3 Alternaria toxins. The main advantage of the herein described approach over other methods is the simultaneous analysis of tenuazonic acid (TEA) and other relevant food contaminants. The developed method unites the newly published standard methods such as EN 15662:2018, EN 17194:2019, EN 17256:2019, EN 17425:2021, EN 17521:2021, which describes the analysis of both regulated and emerging contaminants. The developed method is based on a QuEChERS sample preparation, followed by LC-MS/MS analysis under alkaline mobile phase conditions. The pH of the aqueous eluent was set to 8.3, which resulted in baseline separation among ergot alkaloids and their corresponding epimers, a symmetric chromatographic peak shape for analyzing TEA and fit-for-purpose sensitivity for MS/MS detection in both positive and negative ionization modes. Those compounds, which possess the corresponding isotopically labeled internal standards (ISTD), allowed for direct quantification by the developed method and no further confirmation was necessary. This was proven by satisfactory analyses of a number of quality control (QC), proficiency test (PT), and validation samples.

1. Introduction

Contaminants in this study are substances which are either intentionally used in agriculture (e.g., pesticides) or which result from environmental contamination (e.g., plant toxins). Contamination may also occur during packaging, transport, or holding of foodstuffs, which causes a negative impact on the quality of food, thus risking human health. Therefore, the European Union (EU) has established maximum levels for several contaminants [1,2,3,4,5,6,7,8]. The pesticides are well-known groups of food contaminants. In the EU, the European Food Safety Authority (EFSA) assesses the safety of consumers based on the toxicity of pesticides and proposes a maximum residue limit (MRL) for their presence in food [7]. MRLs have been applied to more than 300 fresh products and to the same products after processing. Currently, the legislation covers more than 1000 pesticides recently or formerly used in agriculture worldwide. The MRL concentrations for pesticides set by the EU are summarized in regulation EC 396/2005 [6].
Mycotoxins have been regulated in the EU since 2006, beginning with well-known compounds such as aflatoxins, ochratoxin A or deoxynivalenol (DON) [2]. Subsequently, other compounds such as T-2 and HT-2 mycotoxins or citrinin have come into focus, and EU recommendations for these toxins are in force now [4]. In addition to these toxins, some other compounds known to be toxic have appeared in the EU regulations and recommendations. These so-called emerging toxins are the ergot and tropane alkaloids and the Alternaria toxins [1,3,5]. Our laboratory has been accredited for the standards listed above, and our aim in the present study was to combine all current methods into one novel multi-method. Hence, the simultaneous analysis of these groups of food contaminants is the focus of our current paper.
In the 1990s, the number of food contaminants analyzed simultaneously by HPLC was restricted due to the optical (HPLC-UV/FLD) or single-stage mass spectrometric (LC-MS) detection. With the widespread use of tandem mass spectrometric (MS/MS) detection in the early 2000s, a broader range of compounds could be separated in a single run, and multi-methods in food analysis have become popular [9,10]. One well-known LC-MS/MS multi-toxin method was published by Sulyok et al. in 2006 [11]. This method described the determination of 39 components employing a simple dilute-and-shoot approach. The extraction solvent for multi-mycotoxin analysis (acetonitrile-water-acetic/formic acid, 79/20/1, v/v/v) recommended by Sulyok has become a general extraction medium in control laboratories, and the recently published standard method (EN 17194:2019) included this solvent composition [12].
In addition to mycotoxins, the single pesticide group-based (e.g., chlorinated or phosphorated pesticide) methods have also been modified to multi-methods using both LC-MS/MS and GC-MS/MS techniques [13,14,15]. This required a general sample manipulation that can be used for all pesticides. The QuEChERS (Quick, Easy, Cheap, Efficient, Rugged, and Safe) sample preparation, which utilized acetonitrile-based extraction and phase partition, allowed for the extraction of a number of medium-polar or non-polar molecules. This extraction is commonly used for pesticides [13].
Thereafter, QuEChERS was tested and introduced as the sample preparation protocol for other LC-MS/MS methods as well [16,17,18]. Recently published papers and standards describe QuEChERS employed in the analysis of mycotoxins, ergot alkaloid or Alternaria toxin [19,20,21,22,23]. Although the extraction of Alternaria toxins from food is preferably done with a methanolic medium, QuEChERS can successfully be applied for their extraction in various food samples as well [22]. Thus, QuEChERS has become a general method for sample preparation before LC-MS/MS analyses [24].
Even though the extraction of compounds having different structures and hydrophobicity could be carried out with QuEChERS, the simultaneous HPLC analysis of the target compounds needs thorough optimization because some toxins (e.g., ergot alkaloids or tenuazonic acid (TEA)) require alkaline pH conditions in the mobile phase [19,22,25,26]. However, the HPLC separation of acidic (e.g., ochratoxin, Alternaria toxins) or basic compounds (e.g., alkaloids) generally requires an acidic pH condition to obtain appropriate peak shape and resolution [27]. Furthermore, MS detection in the positive ionization mode yields better sensitivity with an acidic mobile phase composition as the precursor ions are generally protonated molecules ([M+H]+). Consequently, multi-methods published earlier focused on compounds that could be separated with acidic or neutral eluents [10,11,12,13,28,29,30,31] and excluded those compounds that required alkaline conditions.
Six ergot alkaloids and their corresponding six epimers are currently regulated in the EU [1]. The simultaneous analysis of the twelve compounds requires an alkaline mobile phase pH to obtain baseline separation between the ergot alkaloids and their corresponding epimers [19,25]. TEA belongs to the Alternaria toxin group [3]; it is a chelating compound and forms complexes at acidic pH with metal ions occurring in the eluent [32,33]. Therefore, its LC-MS separation needs either pre-column derivatization or alkaline (pH > 8) conditions in the eluent [32,33,34,35,36] to include in a multi-method. Consequently, a multi-method that includes TEA and all regulated ergot alkaloids along with other mycotoxins and pesticides has not been published yet.
The aim of the present study was to develop for the first time a multi-method that allows for the analysis of food contaminants such as pesticides and toxins as well as alkaloids and Alternaria toxins including TEA. Therefore, the pH of the mobile phase has been optimized so that the HPLC separation allows fit-for-purpose chromatographic resolution for analyzing ergot alkaloids together with their epimers a functional peak shape for challenging TEA. In addition, appropriate sensitivity for MS/MS detection carried out with polarity switching had to be optimized based on the mobile phase condition. A further goal of the paper was to verify the method with validation at low concentration levels and to evaluate the accuracy of the method involving a number of QC and PT sample analyses. Finally, the results of the multi-method on QC samples were compared to those obtained after analysis of the samples with official standard methods.

2. Results and Discussion

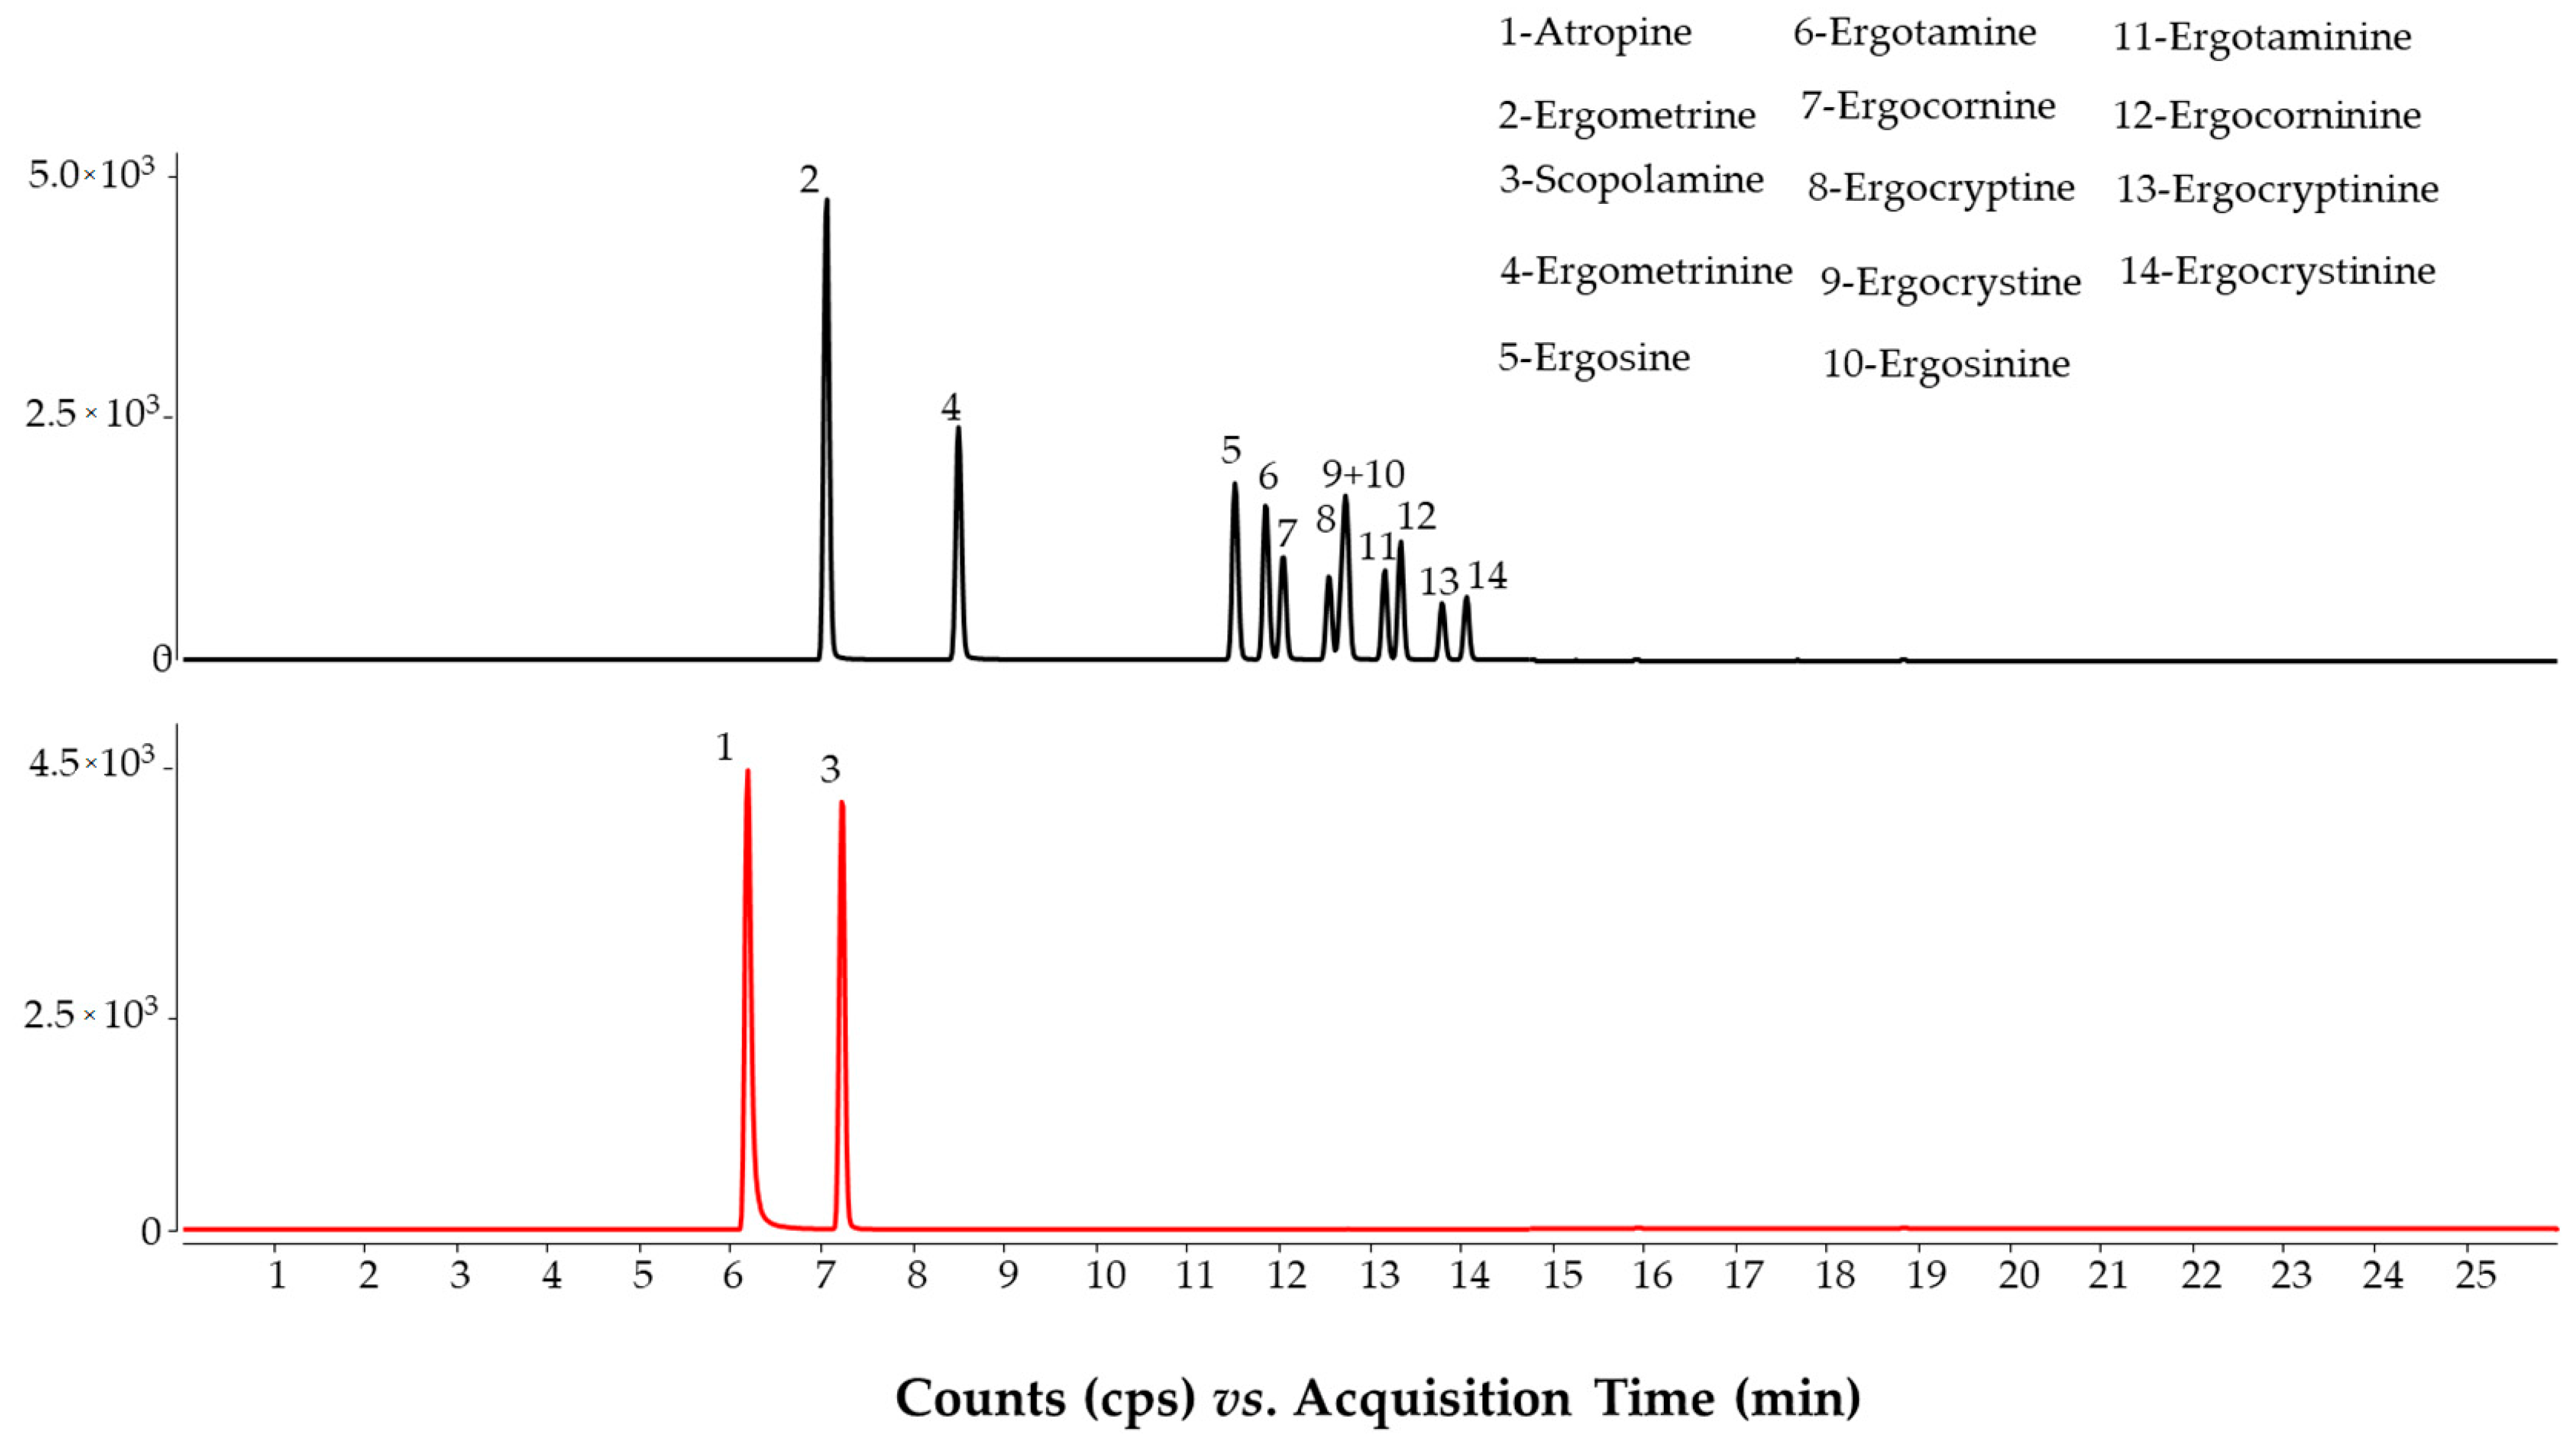
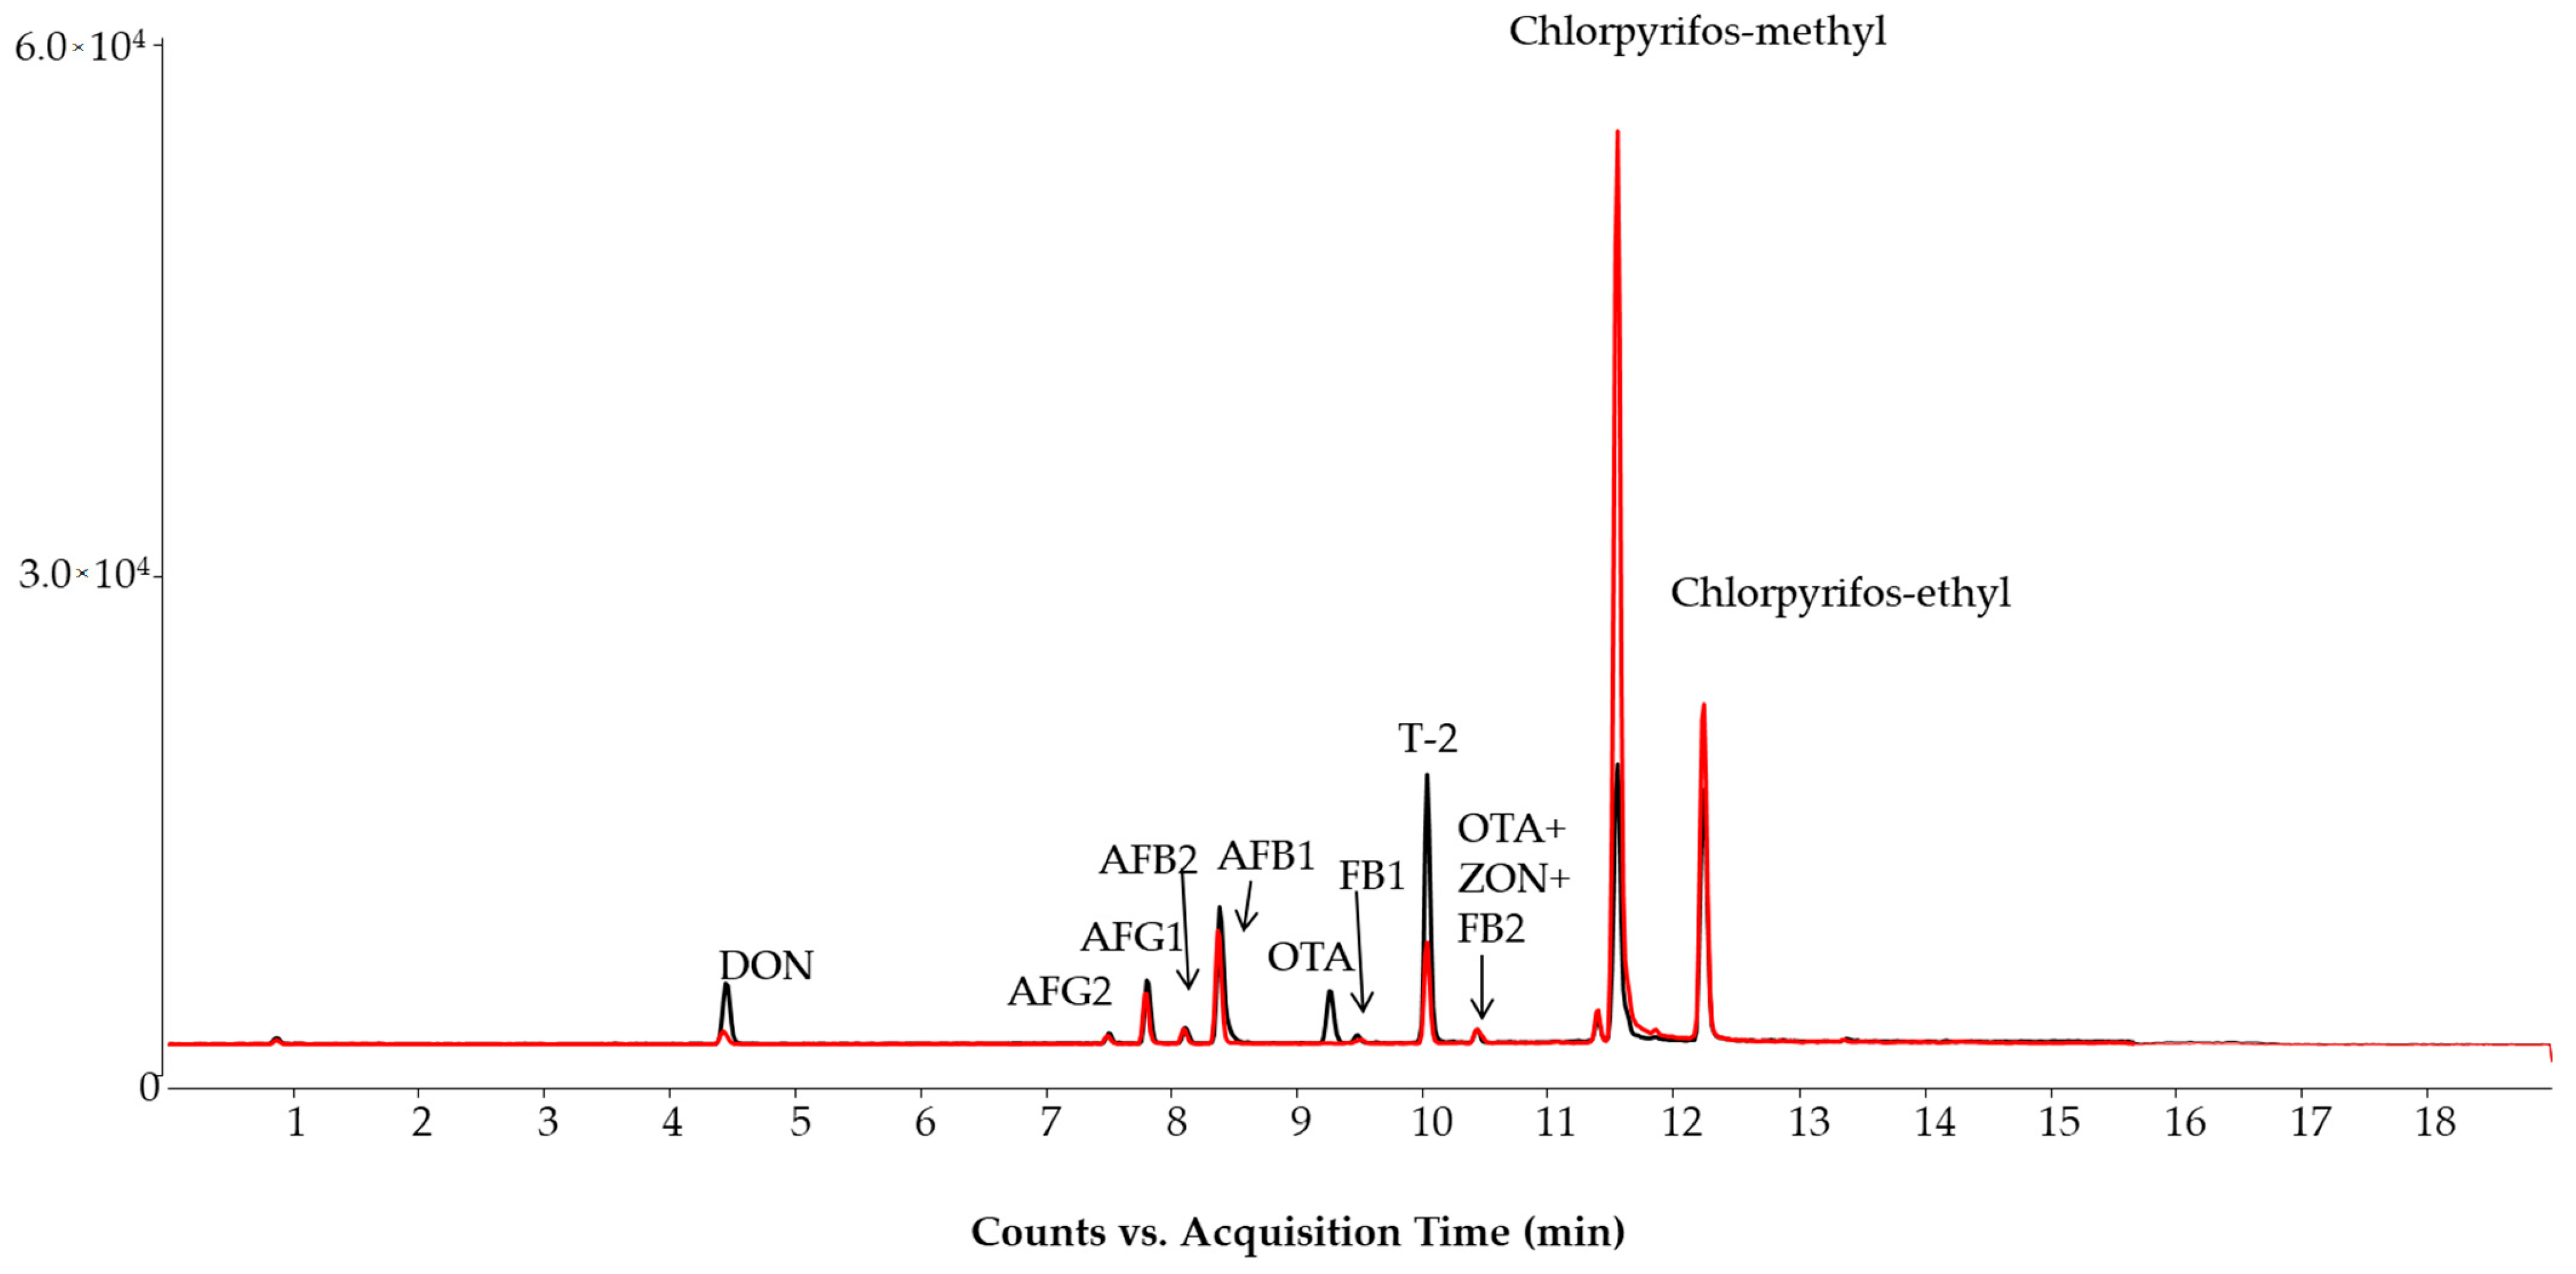
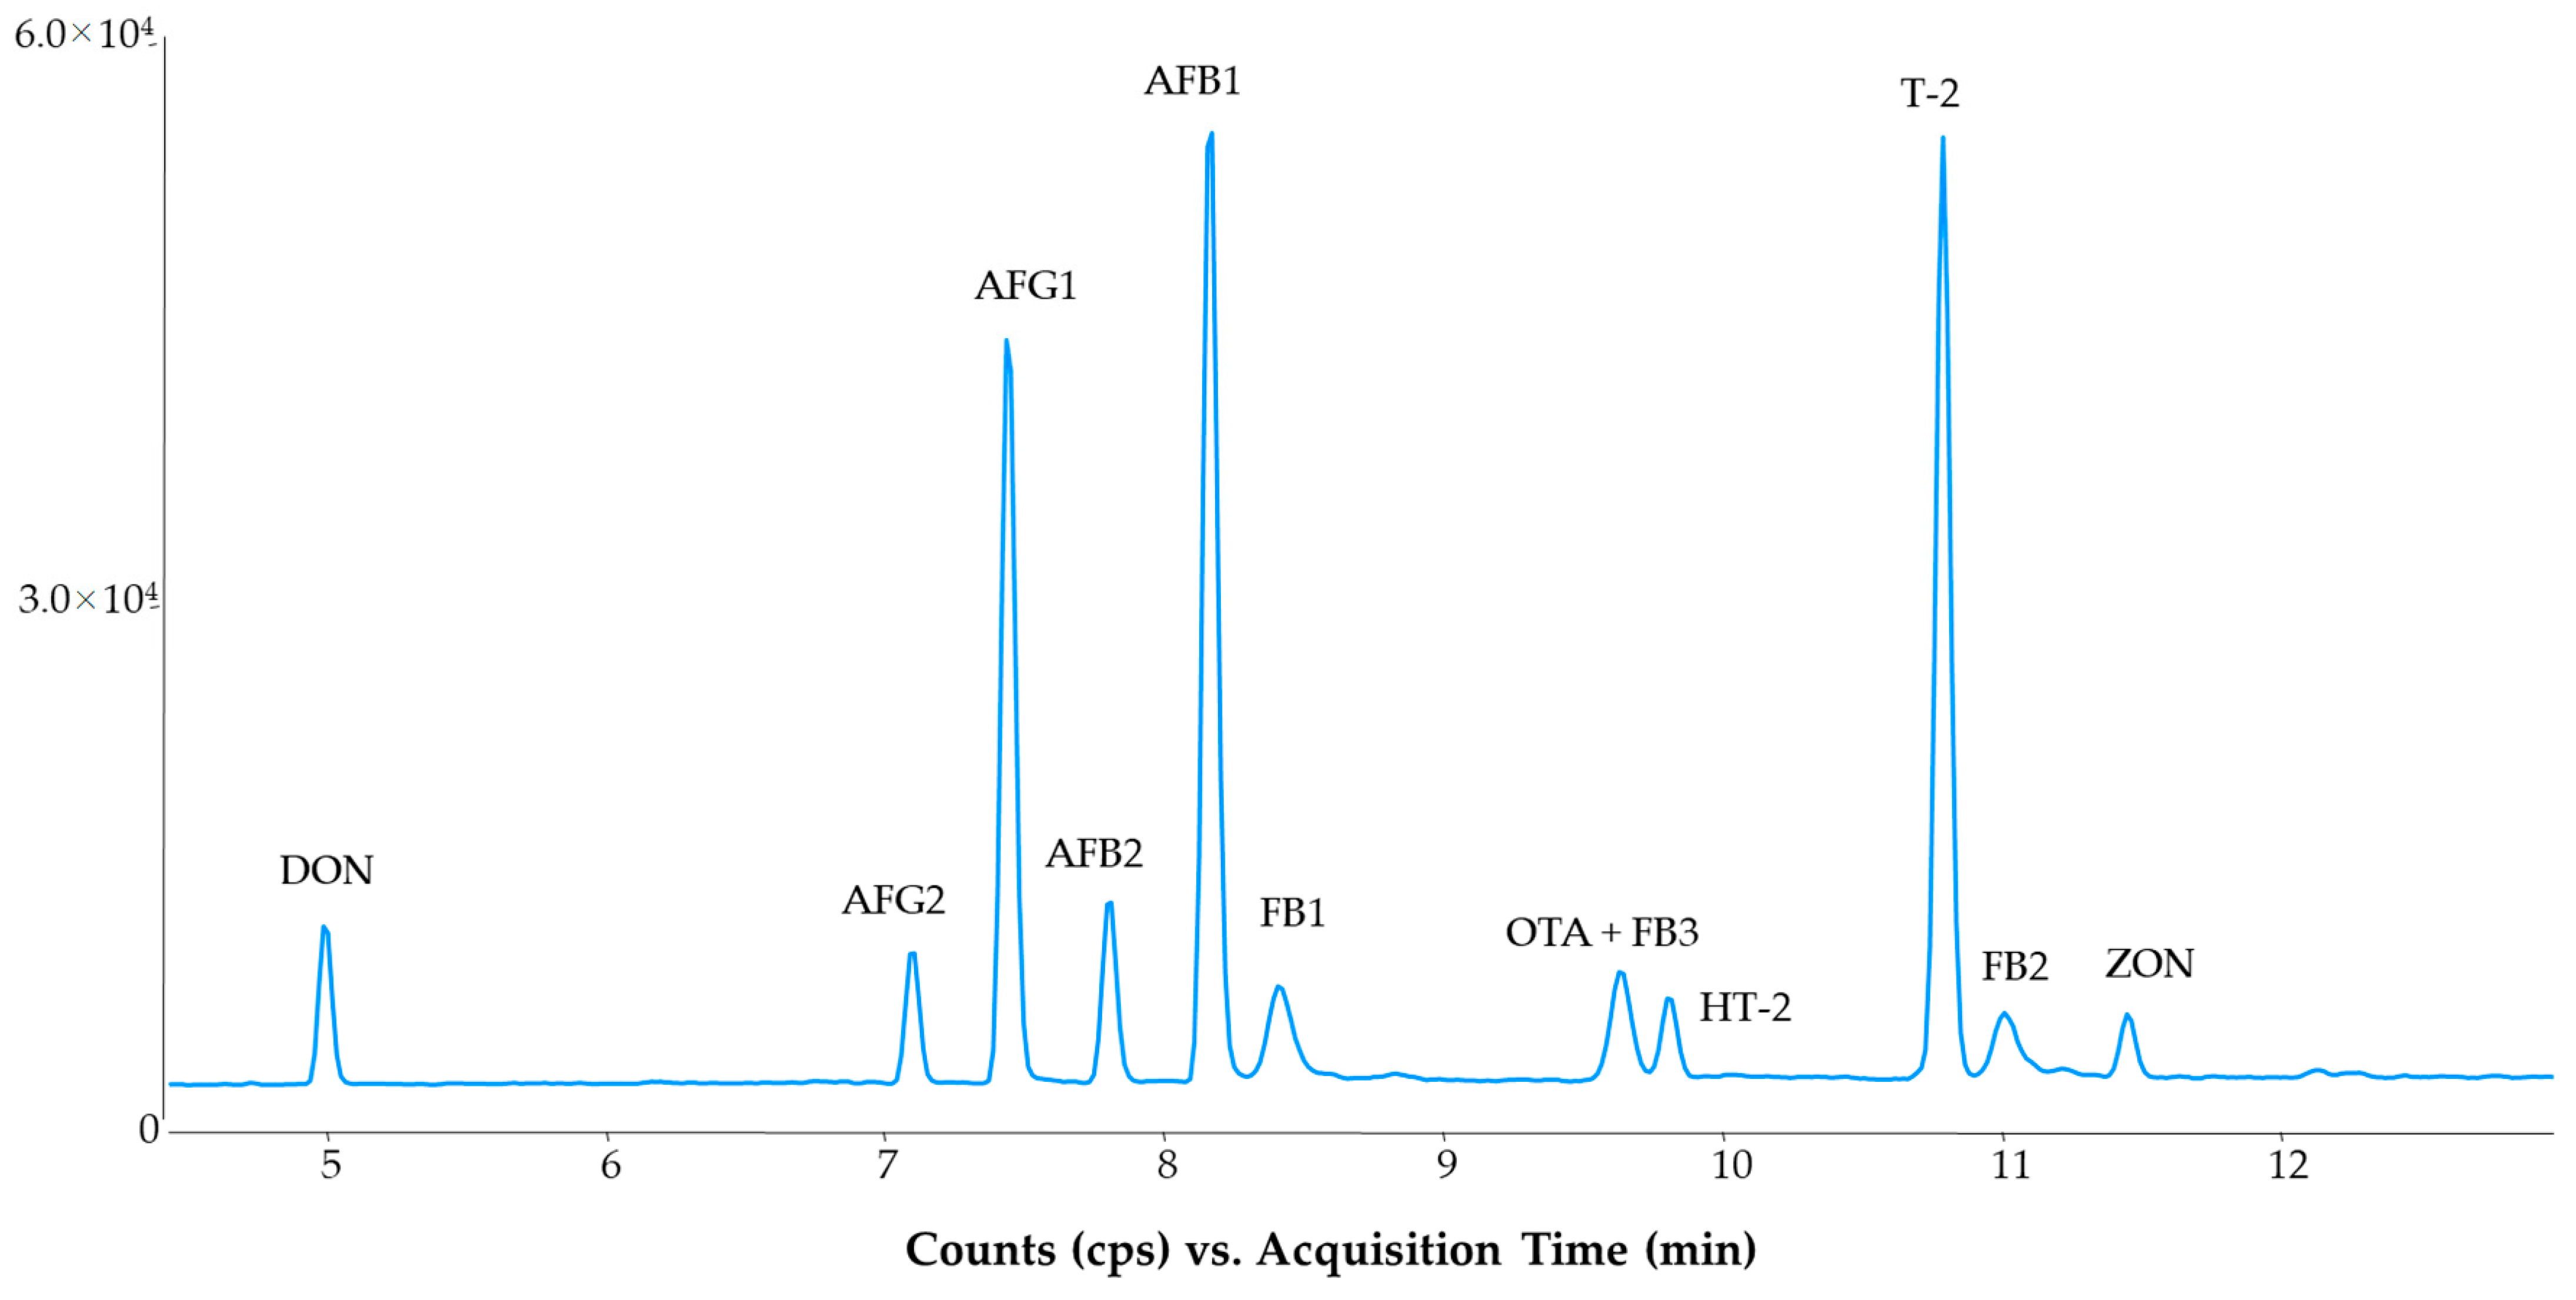
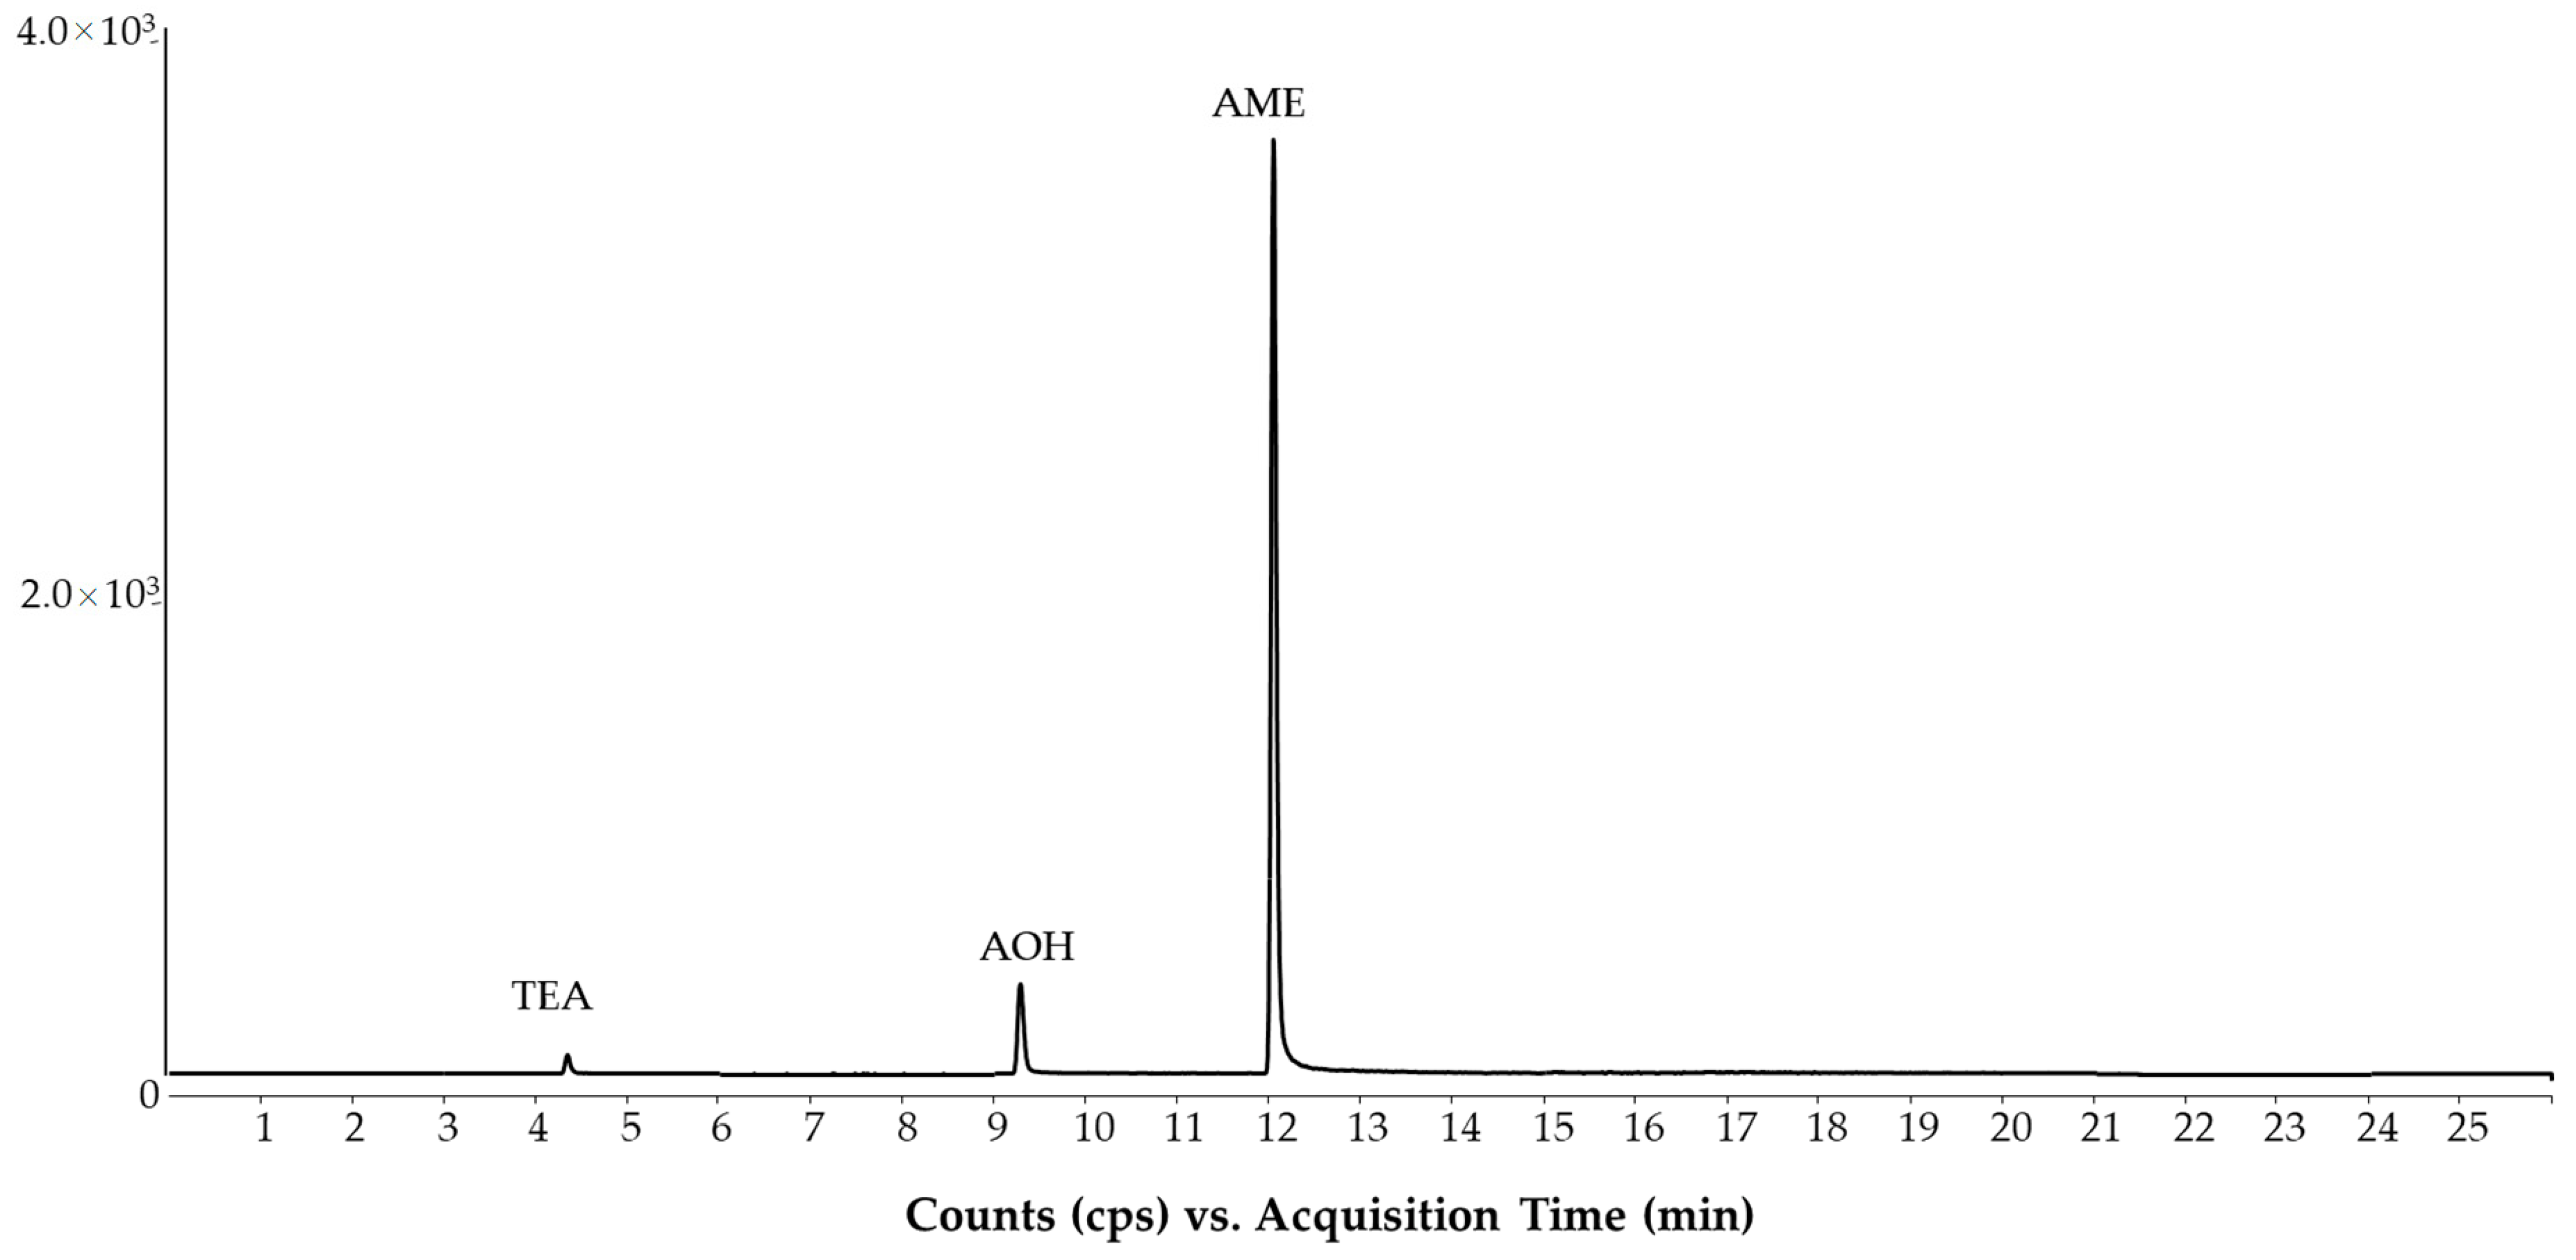
2.1. LC-MS/MS Method

In the analysis of pesticides and mycotoxins, the HPLC separation is generally done under acidic pH or sometimes at neural pH conditions [12,37,38]. In contrast, the separation of alkaloids and the Alternaria toxins requires alkaline pH conditions in the eluent recommended by the standards [19,25,26]. Hence, the optimal pH condition must be obtained at a weak alkaline pH to achieve fit-for-purpose separation of all compounds in the developed method. The pH conditions between 8.0 and 8.8 were therefore tested since the TEA gives a distorted peak shape below pH 8.0 using an HPLC column packed with C18 material, and the pH limit of the HPLC column utilized was at pH 9.0.
The EU standard methods recommend pH 10.0 to analyze ergot alkaloids in order to obtain an appropriate peak resolution between ergot alkaloids and their corresponding epimers, otherwise, peak interference may occur due to isobaric ion transitions [19,25]. On the other hand, an alkaline pH can decrease the sensitivity of those compounds ionized in the protonated molecule form. With these limitations in mind, the pH of the aqueous mobile phase was increased stepwise (in 0.1 unit increments) from 8.0 to 8.8. At pH 8.8, some pesticides displayed low intensity, e.g., cypermethrin, cyprodinil, pendimethalin and permethrin. However, this pH produced better resolution for ergot alkaloids. The lowest limit of pH in which the baseline separation could be achieved between ergot alkaloids and their corresponding epimers was at 8.3 (Figure 1). This alkaline pH did not considerably influence the retention and sensitivity of mycotoxins. Only ochratoxin A (OTA) and the fumonisins (FB1, FB2 and FB3) had retention time shifts between pH 8.0 and 8.8. The sensitivity of the detection of mycotoxins, carried out in a positive ionization mode, did not decrease under alkaline pH conditions (Figure 2 and Figure 3) compared with the acidic conditions detailed in the standard method [12].
In our earlier studies, we found that the mobile phase did not require acidic conditions to obtain high sensitivity for the analysis of pesticides and mycotoxins using LC-MS/MS separation and employing positive ionization [37,39]. The response of DON, aflatoxins and some pesticides (e.g., chlorpyrifos-ethyl/methyl), detected as a protonated molecule ion, slightly increased at alkaline pH in comparison with acidic conditions (Figure 2). This may be caused by the sodium content of the utilized HPLC water. The higher sodium level in water yields sodium formate in the eluent when formic acid is used for acidification, and this salt can decrease the ionization of protonated molecules in the ion source. Again, the non-acidified eluent caused sensitivity drops for only a few compounds, but rather enhanced the sensitivity for most of the molecules, which resulted in fit-for-purpose sensitivity for all compounds pursued for analysis in the developed method.
The other aspect of the method was the sample preparation. The QuEChERS approach described for maize and wheat samples in the standard pesticide method was tested since the QuEChERS is also used for ergot alkaloids in the EN 17425:2021 standard method [19]. Moreover, Bessaire et al. published a collaborative trial using the QuEChERS-LC-MS/MS method for analyzing mycotoxins [23] and Mujahid et al. proposed QuEChERS for Alternaria toxins [22]. The modification to the standard pesticide method involved the extraction time, which was adjusted to 30 min. Even though QuEChERS has been tested for analysis of Alternaria toxins [22], the acetonitrile-based extraction was not recommended for the extraction of Alternaria toxins earlier because methanol is preferable [40]. We also found that the absolute recovery of polar TEA, using QuEChERS extraction, was lower than 50%. The other two Alternaria toxins, AME and AOH, had higher recoveries (>80%) due to their lipophilic structures. Hence, the Alternaria ISTD solution (AME-d3, AOH-d2, TEA-13C2) was added to the sample before extraction to enhance the recovery. This was also recommended in previous papers [22,40]. The isotope dilution considerably improved the recovery of TEA, but the 50% loss increased its limit of quantification (LOQ). Furthermore, the injection solution consisted of acetonitrile, which caused peak distortion of TEA when the injection volume was higher than 2.0 µL. The separation of Alternaria toxins at pH 8.3 in a cereal matrix gave fit-for-purpose LC-MS/MS analysis (Figure 4), but the high (>50%) ion suppression of AME, described also in earlier methods [34,35,36,40], was also seen. Therefore, isotope dilution was needed for appropriate quantification.

2.2. Method Evaluation

During the method evaluation, twenty-three QC and PT samples (see Supplementary Table S1) were analyzed along with validation samples (spiked blanks). The validation samples involved maize and wheat matrices (Table 1). These blank samples were spiked at two levels with 15 replicates (see Section 3.6) to evaluate the recovery and precision (Table 1). The method evaluation was done only for those compounds possessing corresponding isotopically labeled ISTD. In the case of pesticides (excluding chlorpyrifos-ethyl) and ergot alkaloids, their signals were not compensated by ISTD, so only screening and semi-quantitative analysis could be done. Even though the EN 15662:2018 and EN 17425:2021 standards allow for quantification of pesticides and ergot alkaloids using neat solvent calibration, our experience was that this leads to considerable overestimation of the pesticide concentration in spiked samples. When analyzing ergot alkaloids, low recovery was observed. The higher and lower recovery was caused by ion enhancement and ion suppression, respectively. However, the QC sample analysis gave acceptable results for both pesticides and ergot alkaloids due to their broader satisfactory range. In agreement with the SANTE 11312/2021 guideline [41], standard addition is the appropriate quantification approach for pesticides and this approach is also suggested by the EN 17256:2019 standard method for ergot and tropane alkaloids. Confirmatory analyses have been performed according to standard methods using the standard addition approach, and the results were satisfactory (Table 2). In this validation, the screening detection limit (SDL) was set for pesticides and ergot alkaloids [41]. The SDL was established as the lowest spiking level (10 µg/kg or 50 µg/kg) at which the signal-to-noise ratio (SNR > 10) and the ion ratios (within the 30% tolerance range) are acceptable. For all pesticides and ergot alkaloids, 10 µg/kg as SDL was appropriate.
The recovery calculated for those compounds listed in Table 1 was not lower than 67.1% (TEA at 500 µg/kg level) and generally ranged between 70.0% and 111%. According to the standard guideline for the determination of mycotoxins [42], recovery between 50% and 120% is acceptable with precision below 30%. These satisfactory ranges are also applicable for the analysis of alkaloid toxins and Alternaria toxins. The validation data met the standard. The validation results for analyzing chlorpyrifos-ethyl also met the SANTE requirements [41].
In Table 2, we summarized the results obtained after the application of the multi-method on several naturally contaminated or spiked QC and PT samples. The concentrations of contaminants in these samples were also evaluated using the individual EU standard methods. Based on the assigned/reference values and their target standard deviations (Supplementary Table S1), the Z-score for the concentrations evaluated with the multi-method was calculated. Generally, the Z-score is satisfactory between −2 and +2.
In total, there were 11 samples analyzed for mycotoxins, of which 4 were PT samples. The PT samples had maize and wheat matrices in which aflatoxins, DON, fumonisins, HT-2, T-2, OTA and ZON could be detected, so all mycotoxins involved in the method was found at least in one PT sample. The evaluations of aflatoxins were successful at both low (below µg/kg) and medium level (sub-µg/kg) concentrations. The quantification of other mycotoxins was also satisfactory. The results obtained with the multi-method were close to those obtained by the standard methods [12]. This was also true for the seven QC samples. The quantification using the multi-method, which utilizes an alkaline mobile phase separation, QuEChERS sample preparation and isotope dilution with 13C labeled analogs, resulted in satisfactory analysis for all mycotoxins in the naturally contaminated samples. In total, forty-six Z-scores were evaluated, and they were found to be between −1.67 and 1.96. Generally, the alkaline condition did not influence the analysis of mycotoxins. Retention shifts for fumonisins and OTA were observed, but the quantification was not affected by the different background. Isotope dilution with 13C labeled standards further improved the quantification of mycotoxins.
Two QC (wheat and kidney bean) and two wheat PT samples were analyzed for pesticides (Figure 5). The QC samples contained multi-residues while the PT sample was contaminated with only chlorpyrifos-ethyl. The quantification of chlorpyrifos-ethyl was successfully carried out by the multi-method. The standard method used isotope dilution. However, the QC sample analysis showed underestimation of flufenoxuron and isofenphos-methyl in kidney bean QC and a questionable concentration of dimethoate and pirimiphos-methyl in wheat QC. This is caused by the pure solvent calibration, which could not compensate for the background and the recovery. The standard addition approach used for the confirmatory analysis gave satisfactory data for analyzing pesticides. In its current form, the multi-method utilizing neat solvent calibration can only be used as a screening approach.
In the case of alkaloids, five QC samples were analyzed. Two rye samples were spiked with ergot alkaloids, while the three cereal samples were naturally contaminated with tropane alkaloids. The samples were evaluated with both the multi-method and the standard method (EN 17256:2019). The alkaline mobile phase condition (pH 8.3) allowed for the baseline separation of the ergot alkaloids and their corresponding epimers. Therefore, all 12 compounds could be separated in all samples. In the separation of tropane alkaloids (atropine and scopolamine), isotope dilution produced satisfactory results for all samples. However, the pure solvent calibration used in the multi-method resulted in two non-satisfactory data sets in the two QC samples for analyzing ergot alkaloids (ergosine/inine and ergotaminine). Again, the standard addition approach used in the standard method for the analysis of ergot alkaloids produced successful results (Table 2).
In the case of Alternaria toxins (AME, AOH and TEA), the accuracy must be improved by spiking the isotopically labeled ISTDs at the beginning of sample preparation. This is critically needed because of the use of the acetonitrile-based extraction in QuEChERS. The TEA had mostly low recovery compared to the standard method using methanolic extraction. Two naturally contaminated wheat and a sunflower seed sample were analyzed using the multi-method and the standard method (EN 17521:2021). The detected concentrations compensated by isotope dilution gave satisfactory concentrations with both methods in all samples (Table 2). However, the standard method may be preferable over the method presented here because it gives better LOQ due to the higher injection volume.

3. Materials and Methods

3.1. Reagents and Samples

Dried-down analytical standards such as Alternaria toxins (100 μg), ergot alkaloids (500 μg), tropane alkaloids (100 μg), mycotoxin stock solutions and 13C isotopically labeled stock solutions were obtained from Romer Labs (Tulln, Austria). Stock solutions were prepared by adding 1.0 mL methanol (Alternaria toxins), 1.0 mL acetonitrile (tropane alkaloids), 5.0 mL acetonitrile (ergot alkaloids) to the vial and standards were redissolved in the solvent to obtain a concentration of 100 µg/mL. Stock solutions were kept at –18 °C for a year. Deuterated isotopically labeled standards (Alternaria toxins: AME-d3, AOH-d2, TEA-13C2; tropane alkaloids: atropine-d5 and scopolamine-13C1-d3; pesticide: chlorpyrifos-d10), Pesticide Mixture 167 and Pyrethroide Pesticide Mixture 153 were acquired from LGC (Wesel, UK). Piperonyl butoxide (a synergistic component), permethrin and diphenylamine individual standards were purchased from the Merck-Sigma group (Schnelldorf, Germany). An LC-MS comprehensive pesticide mixture containing 253 compounds was purchased from Agilent Technologies (Waldbronn, Germany). Stock solutions (1 mg/mL) for individual standards were prepared and stored by following the procedure given in the pesticide database [43].
Methanol, acetonitrile, ammonium formate, formic acid, ammonia solution (25%), (either LC-MS or HPLC grade) and the Ascentis Express C18 HPLC column (100 mm × 3 mm, 2.7 µm) were purchased from the Merck-Sigma group (Schnelldorf, Germany). The EN 15662:2018 QuEChERS extraction salt (4 g MgSO4, 1 g NaCl, 1 g Na-citrate × 2H2O and 0.5 g) and HPLC pre-column holders and C18 pre-column cartridges (4 mm × 3 mm; 5 µm) were obtained from Phenomenex (Torrance, CA, USA). Honeywell HPLC-gradient-grade water was acquired from Thomasker (Debrecen, Hungary). The final aqueous mobile phase (solvent A, pH 8.3) was prepared by adding 65 µL ammonia solution to 1 L HPLC water containing 5 mM ammonium formate.
PT and QC samples (23 in total) were obtained from various companies and details are provided in Supplementary Table S1.

3.2. Instrumentation

LC-MS/MS analyses were carried out using an Agilent 6470B triple quad consisting of an Agilent 1260 liquid chromatograph coupled to a 6470B MS detector equipped with an Agilent JetStream ion source (Agilent Technologies (Waldbronn, Germany)). Data acquisition and evaluation were performed with the Masshunter software version 10.1.

3.3. Sample Preparation

Samples were ground (<1 mm) before extraction and thoroughly mixed to assure adequate homogeneity. The sample preparation was based on the standard QuECHERS approach for regular pesticide residue analysis in cereals [13], with mechanical shaking modification to obtain appropriate extraction for the toxins. Samples (5.0 g) were weighed in a 50 mL plastic centrifuge tube and 100 µL Alternaria ISTD solution (25 µg/mL TEA-13C2, 5.0 µg/mL AOH-d2 and AME-d3 in methanol) was spiked into the sample. Then, 10.0 mL distilled water was added to the samples, followed by 9.9 mL acetonitrile. The extraction was carried out with a laboratory shaker (CAT S50, CAT M. Zipperer GmbH, Ballrechten-Dottingen, Germany) at full speed (600 min−1) for 30 min. After the extraction, EN 15662:2018 QuEChERS salt mixture was added and the samples were hand-shaken for 1.0 min, followed by centrifugation at 2300× g (Thermo Megafuge 16, Unicam Kft, Budapest, Hungary) at ambient temperature. Then, 470 µL of the upper layer and 30 µL of ISTD solution (AFB1-13C17, AFB2-13C17, AFG1-13C17, AFG2-13C17, OTA-13C20 in 15 ng/mL; T-2-13C24, HT-2-13C22, ZON-13C18 in 150 ng/mL; DON-13C15, FB1-13C34, FB2-13C34, FB3-13C34, chlorpyrifos-ethyl-d10 in 300 ng/mL; atropine-d5, scopolamine-13C1-d3 in 100 ng/mL in 50% acetonitrile) were mixed in a 2.0 mL screw-cap HPLC vial and vortexed prior to injection into the LC-MS/MS instrument.

3.4. LC-MS/MS Separation

Compounds were separated on an Ascentis Express C18 HPLC column (100 × 3 mm, 2.7 µm) equipped with a C18 guard column (4 mm × 3 mm, 5 µm) Merck-Sigma group (Schnelldorf, Germany). The binary gradient elution mode was applied with solvent A containing 5 mM ammonium formate in water (pH 8.3) and solvent B containing methanol. The mobile phase gradient consisted of 5% B at 0 min; 5% B at 0.5 min; 40% B at 3.0 min; 100% B at 15 min; 100% B at 19 min; 5% B at 19.1 min; 5% B at 26.0 min; flow rate was set to 0.5 mL/min. The column thermostat and autosampler were maintained at 39 °C and at 18 °C, respectively. The injection volume was 2.0 µL. Compounds were detected using positive/negative ionization mode and dynamic multiple reaction monitoring (dMRM) scan mode. Ion transitions for 295 compounds are presented in Supplementary Table S2. The MRM time window was 60 s, and the cycle time was 1000 ms. The Agilent Jet Stream ion source parameters were as follows: drying gas temperature, 300 °C; sheath gas temperature, 350 °C; nebulizer, 35 psi; gas flow, 7 L/min; sheath gas flow, 11 L/min; capillary voltage, ± 3500 V; and nozzle voltage, +0, −1000 V. The HPLC effluent was directed into waste from 0 to 2.0 min.

3.5. Quantification

Calibrants in 50% acetonitrile were prepared from the native working standard mixture along with ISTD solutions, considering the dilution factor (2.13×) of the sample preparation. The calibration levels, expressed in µg/kg, are detailed in Table 3. For some pesticides, the lowest calibration level was 0.2 µg/kg, however, for most of them, 1 µg/kg could be used as the starting point of the calibration. Only those compounds that possessed the corresponding isotopically labeled analogs could be appropriately quantified. These were the mycotoxins, the tropane alkaloids, the Alternaria toxins, and chlorpyrifos-ethyl. Even though the pesticide (EN 15662:2018) and ergot alkaloid (EN 17425:2021) standard methods allow the quantification with neat calibrants [13,19], the presented method works only as a screening approach for them in the absence of ISTD. In the case where compounds from their group are identified, a further quantification using the standard addition approach is needed, in accordance with the SANTE 11312/2021 guidelines and EN 17256:2019 standard method [25,41].
The concentrations of analytes could be directly obtained from the equations of linear calibration weighted with the factor of 1/x. The determination coefficients obtained under the validation study were not lower than 0.9950.

3.6. Validation

The confirmatory validation was performed for the mycotoxins, the tropane alkaloids, the Alternaria toxins and chlorpyrifos-ethyl. The recovery and precision were calculated from the analysis of spiked maize and wheat samples. The fortified samples were prepared on three different days at two concentration levels (level 1 and level 2) by the operators (Table 1). In total, fifteen samples were analyzed. The levels were: AFB2, AFG2—0.25 µg/kg and 1.25 µg/kg; AFB1, AFG1, atropine and scopolamine—1.0 µg/kg and 5.0 µg/kg; AME and AOH—2 µg/kg and 10 µg/kg; HT-2, T-2 and ZON—5 µg/kg and 25 µg/kg; chlorpyrifos-ethyl, DON, FB1, FB2 and FB3—10 µg/kg and 50 µg/kg; TEA—200 µg/kg and 1000 µg/kg.
Ergot alkaloids and pesticides were also spiked into the samples along with the other compounds mentioned above. Their levels were 10 µg/kg and 50 µg/kg; however, appropriate quantification could not be performed due to the absence of background compensation with ISTD. Hence, the validation of these samples was performed as a screening validation, and the SDL (either 10 µg/kg or 50 µg/kg) was evaluated. The LOQ was set as the lowest calibration point.

4. Conclusions

A novel LC-MS/MS multi-method has been developed for analyzing toxins and pesticides together. The sample preparation is the modification of the QuEChERS-based approaches described in the pesticide and ergot alkaloid standard method or developed by Mujahid et al. (2020) or Bessaire et al. (2019). The chromatographically challenging TEA could be included in the method along with all regulated ergot alkaloids by using alkaline mobile phase conditions. The pH of the eluent did not influence the analysis of pesticides and mycotoxins. The method was evaluated by analyzing several QC and PT samples. Moreover, results obtained with the multi-method was compared with those data obtained by the individual EU standard methods. Even though the results with the standard methods are better, similarly good data can be obtained with the multi-method, which covers 295 compounds and unites five standard methods.

Supplementary Materials

The following supporting information can be downloaded at: https://www.mdpi.com/article/10.3390/molecules28031468/s1, Table S1: Quality control and proficiency test materials; Table S2: The scheduled MRM ion transitions of the tested compounds.

Author Contributions

Conceptualization, Á.T. and A.C.; methodology, Á.T. and A.C.; validation, A.C., Á.T. and A.S.; formal analysis, A.C. and Á.T.; investigation, Á.T. and A.C.; data curation, A.C. and Á.T.; writing—original draft preparation, Á.T. and A.C. and V.K.S.; writing—review and editing, Á.T. and A.C. and V.K.S. All authors have read and agreed to the published version of the manuscript.

Funding

This research received no external funding.

Institutional Review Board Statement

Not applicable.

Informed Consent Statement

Not applicable.

Data Availability Statement

Not applicable.

Acknowledgments

Authors wish to thank Mary Sohn, Edgár Tóth and the anonymous reviewers for their comments that improved the paper greatly.

Conflicts of Interest

The authors declare no conflict of interest.

Sample Availability

Samples of the compounds are not available from the authors.

References

  1. Commission Regulation (EU) 2021/1399 of 24 August 2021 Amending Regulation (EC) No 1881/2006 as Regards Maximum Levels of Ergot Sclerotia and Ergot Alkaloids in Certain Foodstuffs. Available online: https://eur-lex.europa.eu/legal-content/EN/TXT/PDF/?uri=CELEX:32021R1399&rid=2 (accessed on 16 October 2022).
  2. Commission Regulation (EC) No 1881/2006 of 19 December 2006 Setting Maximum Levels for Certain Contaminants in Foodstuffs. Available online: https://eur-lex.europa.eu/legal-content/EN/TXT/PDF/?uri=CELEX:32006R1881&from=HU (accessed on 16 October 2022).
  3. Commission Regulation (EU) 2022/553 of 5 April 2022 on Monitoring the Presence of Alternaria Toxins in Food. Available online: https://eur-lex.europa.eu/legal-content/EN/TXT/PDF/?uri=CELEX:32022H0553&from=EN (accessed on 16 October 2022).
  4. Commission Regulation of 27 March 2013 on the Presence of T-2 and HT-2 Toxin in Cereals and Cereal Products. Available online: https://eur-lex.europa.eu/LexUriServ/LexUriServ.do?uri=OJ:L:2013:091:0012:0015:EN:PDF (accessed on 16 October 2022).
  5. Commission Regulation (EU) 2021/1408 of 27 August 2021 Amending Regulation (EC) No 1881/2006 as Regards Maximum Levels of Tropane Alkaloids in Certain Foodstuffs. Available online: https://eur-lex.europa.eu/legal-content/EN/TXT/PDF/?uri=CELEX:32021R1408&from=EN (accessed on 16 October 2022).
  6. Regulation (EC) No 396/2005 of the European Parliament and of the Council of 23 February 2005 on Maximum Residue Levels of Pesticides in or on Food and Feed of Plant and Animal Origin and Amending Council Directive 91/414/EEC. Available online: http://data.europa.eu/eli/reg/2005/396/2016-05-13 (accessed on 18 September 2022).
  7. Pesticide Evaluations: Overview and Procedure. Available online: https://www.efsa.europa.eu/en/applications/pesticides (accessed on 18 September 2022).
  8. Pesticide Residue Monitoring Program, Fiscal Year 2020 Pesticide Report, U.S. Food and Drug Administration. Available online: https://www.fda.gov/media/160464/download (accessed on 18 September 2022).
  9. De Girolamo, A.; Lippolis, V.; Pascale, M. Overview of Recent Liquid Chromatography Mass Spectrometry-Based Methods for Natural Toxins Detection in Food Products. Toxins 2022, 14, 328. [Google Scholar] [CrossRef] [PubMed]
  10. Sulyok, M.; Stadler, D.; Steiner, D.; Krska, R. Validation of an LC-MS/MS-based dilute-and-shoot approach for the quantification of > 500 mycotoxins and other secondary metabolites in food crops: Challenges and solutions. Anal. Bioanal. Chem. 2020, 412, 2607–2620. [Google Scholar] [CrossRef] [PubMed]
  11. Sulyok, M.; Berthiller, F.; Krska, R.; Schuhmacher, R. Development and validation of a liquid chromatography/ tandem mass spectrometric method for the determination of 39 mycotoxins in wheat and maize. Rapid Commun. Mass Spectrom. 2006, 20, 2649–2659. [Google Scholar] [CrossRef] [PubMed]
  12. EN 17194:2019. Animal Feeding Stuffs: Methods of Sampling and Analysis. Determination of Deoxynivalenol, Aflatoxin B1, Fumonisin B1 & B2, T-2 & HT-2 Toxins, Zearalenone and Ochratoxin A in Feed Materials and Compound Feed by LC-MS/MS. Available online: https://www.en-standard.eu/search/?q=EN+17194%3A2019 (accessed on 16 October 2022).
  13. EN 15662:2018. Foods of Plant Origin—Multimethod for the Determination of Pesticide Residues Using GC- and LC-Based Analysis Following Acetonitrile Extraction/Partitioning and Clean-Up by Dispersive SPE—Modular QuEChERS-Method. Available online: https://www.en-standard.eu/bs-en-15662-2018-foods-of-plant-origin-multimethod-for-the-determination-of-pesticide-residues-using-gc-and-lc-based-analysis-following-acetonitrile-extraction-partitioning-and-clean-up-by-dispersive-spe-modular-quechers-method/ (accessed on 16 October 2022).
  14. Lee, S.-H.; Kwak, S.-Y.; Sarker, A.; Moon, J.-K.; Kim, J.-E. Optimization of a Multi-Residue Analytical Method during Determination of Pesticides in Meat Products by GC-MS/MS. Foods 2022, 11, 2930. [Google Scholar] [CrossRef]
  15. Maragou, N.C.; Balayiannis, G.; Karanasios, E.; Markellou, E.; Liapis, K. Targeted Multiresidue Method for the Analysis of Different Classes of Pesticides in Agro-Food Industrial Sludge by Liquid Chromatography Tandem Mass Spectrometry. Molecules 2021, 26, 6888. [Google Scholar] [CrossRef]
  16. González-Gómez, L.; Morante-Zarcero, S.; Pérez-Quintanilla, D.; Sierra, I. Occurrence and Chemistry of Tropane Alkaloids in Foods, with a Focus on Sample Analysis Methods: A Review on Recent Trends and Technological Advances. Foods 2022, 11, 407. [Google Scholar] [CrossRef]
  17. Martinello, M.; Borin, A.; Stella, R.; Bovo, D.; Biancotto, G.; Gallina, A.; Mutinelli, F. Development and validation of a QuEChERS method coupled to liquid chromatography and high resolution mass spectrometry to determine pyrrolizidine and tropane alkaloids in honey. Food Chem. 2017, 234, 295–302. [Google Scholar] [CrossRef] [PubMed]
  18. Rausch, A.-K.; Brockmeyer, R.; Schwerdtle, T. Development and Validation of a QuEChERS-Based Liquid Chromatography Tandem Mass Spectrometry Multi-Method for the Determination of 38 Native and Modified Mycotoxins in Cereals. J. Agric. Food Chem. 2020, 68, 4657–4669. [Google Scholar] [CrossRef]
  19. EN 17425:2021. Foodstuffs. Determination of Ergot Alkaloids in Cereals and Cereal Products by dSPE Clean-Up and HPLC-MS/MS. Available online: https://www.en-standard.eu/search/?q=EN+17425%3A2021 (accessed on 16 October 2022).
  20. Carbonell-Rozas, L.; Gámiz-Gracia, L.; Lara, F.J.; García-Campaña, A.M. Determination of the Main Ergot Alkaloids and Their Epimers in Oat-Based Functional Foods by Ultra-High Performance Liquid Chromatography Tandem Mass Spectrometry. Molecules 2021, 26, 3717. [Google Scholar] [CrossRef]
  21. González-Gómez, L.; Morante-Zarcero, S.; Pereira, J.A.M.; Câmara, J.S.; Sierra, I. Improved Analytical Approach for Determination of Tropane Alkaloids in Leafy Vegetables Based on µ-QuEChERS Combined with HPLC-MS/MS. Toxins 2022, 14, 650. [Google Scholar] [CrossRef]
  22. Mujahid, C.; Savoy, M.-C.; Baslé, Q.; Woo, P.M.; Ee, E.C.Y.; Mottier, P.; Bessaire, T. Levels of Alternaria Toxins in Selected Food Commodities Including Green Coffee. Toxins 2020, 12, 595. [Google Scholar] [CrossRef] [PubMed]
  23. Bessaire, T.; Mujahid, C.; Mottier, P.; Desmarchelier, A. Multiple Mycotoxins Determination in Food by LC-MS/MS: An International Collaborative Study. Toxins 2019, 11, 658. [Google Scholar] [CrossRef] [PubMed]
  24. Kim, L.; Lee, D.; Cho, H.-K.; Choi, S.-D. Review of the QuEChERS method for the analysis of organic pollutants: Persistent organic pollutants, polycyclic aromatic hydrocarbons, and pharmaceuticals. Trends Environ. Anal. Chem. 2019, 22, e00063. [Google Scholar] [CrossRef]
  25. EN 17256:2019. Animal Feeding Stuffs: Methods of Sampling and Analysis. Determination of Ergot Alkaloids and Tropane Alkaloids in Feed Materials and Compound Feeds by LC-MS/MS. Available online: https://www.en-standard.eu/search/?q=EN+17256%3A2019 (accessed on 16 October 2022).
  26. EN 17521:2021. Foodstuffs. Determination of Alternaria Toxins in Tomato, Wheat and Sunflower Seeds by SPE Clean-Up and HPLC-MS/MS. Available online: https://www.en-standard.eu/search/?q=EN+17521%3A2021 (accessed on 16 October 2022).
  27. Tölgyesi, Á.; Berky, R.; Békési, K.; Fekete, S.; Fekete, J.; Sharma, V.K. Analysis of sulfonamide residue in real honey samples using liquid chromatography with fluorescence and tandem mass spectrometry detection. J. Liq. Chromatogr Relat. Technol. 2013, 36, 1105–1125. [Google Scholar] [CrossRef]
  28. Kresse, M.; Drinda, H.; Romanotto, A.; Speer, K. Simultaneous determination of pesticides, mycotoxins, and metabolites as well as other contaminants in cereals by LC-LC-MS/MS. J. Chromatogr. B 2019, 1117, 86–102. [Google Scholar] [CrossRef]
  29. Reichert, B.; de Kok, A.; Pizzutti, I.R.; Scholten, J.; Cardoso, C.D.; Spanjer, M. Simultaneous determination of 117 pesticides and 30 mycotoxins in raw coffee, without clean-up, by LC-ESI-MS/MS analysis. Anal. Chim. Acta 2018, 1004, 40–50. [Google Scholar] [CrossRef]
  30. Na, T.W.; Seo, H.-J.; Jang, S.-N.; Kim, H.; Yun, H.; Kim, H.; Ahn, J.; Cho, H.; Hong, S.-H.; Kim, H.J.; et al. Multi-residue analytical method for detecting pesticides, veterinary drugs, and mycotoxins in feed using liquid- and gas chromatography coupled with mass spectrometry. J. Chromatogr. A 2022, 1676, 463257. [Google Scholar] [CrossRef]
  31. Eyring, P.; Tienstra, M.; Mol, H.; Herrmann, S.S.; Rasmussen, P.H.; Frandsen, H.L.; Poulsen, M.E. Development of a new generic extraction method for the analysis of pesticides, mycotoxins, and polycyclic aromatic hydrocarbons in representative animal feed and food samples. Food Chem. 2021, 356, 129653. [Google Scholar] [CrossRef]
  32. Asam, S.; Liu, Y.; Konitzer, K.; Rychlik, M. Development of a stable isotope dilution assay for tenuazonic acid. J. Agric. Food Chem. 2011, 59, 2980–2987. [Google Scholar] [CrossRef]
  33. Siegel, D.; Rasenko, T.; Koch, M.; Nehls, I. Determination of the Alternaria mycotoxin tenuazonic acid. in cereals by high-performance liquid chromatography–electrospray ionization iontrap multistage mass spectrometry after derivatization with 2,4-dinitrophenylhydrazine. J. Chromatogr. A 2009, 1216, 4582–4588. [Google Scholar] [CrossRef]
  34. Tölgyesi, Á.; Stroka, J.; Tamosiunas, V.; Zwickel, T. Simultaneous analysis of Alternaria toxins and citrinin in tomato: An optimised method using liquid chromatography-tandem mass spectrometry. Food Addit. Contam. 2015, 32, 1512–1522. [Google Scholar] [CrossRef]
  35. Tölgyesi, Á.; Kozma, L.K.; Sharma, V. Determination of Alternaria Toxins in Sunflower Oil by Liquid Chromatography Isotope Dilution Tandem Mass Spectrometry. Molecules 2020, 25, 1685. [Google Scholar] [CrossRef] [PubMed]
  36. Tölgyesi, Á.; Farkas, T.; Bálint, M.; McDonald, T.J.; Sharma, V.K. A Dilute and Shoot Strategy for Determining Alternaria Toxins in Tomato-Based Samples and in Different Flours Using LC-IDMS Separation. Molecules 2021, 26, 1017. [Google Scholar] [CrossRef] [PubMed]
  37. Tóth, E.; Tölgyesi, Á.; Simon, A.; Bálint, M.; Ma, X.; Sharma, V.K. An Alternative Strategy for Screening and Confirmation of 330 Pesticides in Ground- and Surface Water Using Liquid Chromatography Tandem Mass Spectrometry. Molecules 2022, 27, 1872. [Google Scholar] [CrossRef] [PubMed]
  38. Lauwers, M.; De Baere, S.; Letor, B.; Rychlik, M.; Croubels, S.; Devreese, M. Multi LC-MS/MS and LC-HRMS Methods for Determination of 24 Mycotoxins including Major Phase I and II Biomarker Metabolites in Biological Matrices from Pigs and Broiler Chickens. Toxins 2019, 11, 171. [Google Scholar] [CrossRef] [PubMed]
  39. Tölgyesi, Á.; Tóth Kovács, B.; Tóth, E.; Simon, A.; Bálint, M.; Sharma, V.K. Unexpected sensitivity enhancement in analysing alfatoxin M1 using LC-IDMS. Microchem. J. 2022, 179, 107469. [Google Scholar] [CrossRef]
  40. Gonçalves, C.; Tölgyesi, Á.; Bouten, K.; Cordeiro, F.; Stroka, J. Determination of Alternaria Toxins in Food by SPE and LC-IDMS: Development and In-House Validation of a Candidate Method for Standardisation. Separations 2022, 9, 70. [Google Scholar] [CrossRef]
  41. Main Changes Introduced in Document Nº SANTE/11312/2021 with Respect to the Previous Version (Document Nº SANTE 12682/2019). Available online: https://food.ec.europa.eu/system/files/2022-02/pesticides_mrl_guidelines_wrkdoc_2021-11312.pdf (accessed on 16 October 2022).
  42. CEN/TR 16059:2010. Food Analysis—Performance Criteria for Single Laboratory Validated Methods of Analysis for the Determination of Mycotoxins. Available online: https://www.nbn.be/shop/en/standard/preview/6283/en/ (accessed on 16 October 2022).
  43. EU Pesticides Database. Available online: https://ec.europa.eu/food/plants/pesticides/eu-pesticides-database_hu (accessed on 16 October 2022).
Figure 1. Separation of ergot (10 µg/kg) and tropane (5 µg/kg) alkaloids in spiked wheat samples using the optimized method.
Molecules 28 01468 g001
Figure 2. Total ion chromatograms of mycotoxins and chlorpyrifos-ethyl/methyl in standard solution recorded under acidic (pH 3, red line) and alkaline (pH 8.3, black line) mobile phase conditions. Concentrations: chlorpyrifos-ethyl/methyl, DON, FB1, FB2, 10 ng/mL; AFB1, AFG1, OTA, 1 ng/mL; AFB2, AFG2, 0.25 ng/mL; HT-2, T-2, ZON, 5 ng/mL. The chromatograms were recorded in an earlier stage of the method development.
Molecules 28 01468 g002
Figure 3. Separation of mycotoxins in wheat samples using the optimized method. Concentrations: DON, FB1, FB2, FB3, 50 µg/kg; AFB1, AFG1, OTA, 5 µg/kg; AFB2, AFG2, 1.25 µg/kg; HT-2, T-2, ZON, 25 µg/kg.
Molecules 28 01468 g003
Figure 4. Separation of Alternaria toxins in wheat samples using the optimized method. Concentrations: AOH and AME, 2 µg/kg; TEA 100 µg/kg.
Molecules 28 01468 g004
Figure 5. Separation of pesticides in kidney bean (T09133QC, above) and wheat flour (T09140QC, below) FAPAS QC samples using the multi-method. Concentrations are detailed in Table 2.
Molecules 28 01468 g005
Table 1. Validation results for maize and wheat samples. Spiking levels are summarized in Section 3.6.
ComponentsRepeatability RSD%
(n = 5)
Reproducibility RSD%
(n = 15)
Recovery%
(n = 15)
LOQ(µg/kg)Linearity
Level 1Level 2Level 1Level 2Level 1Level 2 EquationR2
AFB14.794.218.306.2488.985.80.200.8850x − 0.09850.9992
AFB211.111.023.819.911189.30.050.6217x − 0.08760.9999
AFG111.94.4813.716.788.794.30.200.6388x + 0.01250.9998
AFG219.113.626.510.41191010.050.4611x − 0.009850.9988
AME5.316.055.324.8287.486.30.200.0745x − 0.02530.9992
AOH21.314.623.014.61081030.200.1455x − 0.03250.9999
Atropine4.022.184.112.1878.683.90.200.6052x + 0.08970.9992
Chlorpyrifos-ethyl11.33.8611.315.697.172.70.200.0407x + 0.00140.9994
DON21.16.7120.58.8686.082.910.00.04475x − 0.00140.9995
FB110.15.712.39.783.173.910.00.1118x − 0.005470.9979
FB29.95.217.29.891.481.510.00.0954x − 0.01450.9999
FB37.76.413.010.195.390.510.00.0954x − 0.01450.9999
HT-217.77.8926.812.8102.6925.00.0051x + 0.00110.9998
OTA21.74.2521.710.510170.61.000.1045x + 0.07450.9983
Scopolamine3.492.805.572.8074.976.60.200.3750x−0.04550.9975
T-28.863.4411.913.696.189.21.000.04459x + 0.00840.9994
TEA12.111.824.228.210067.12000.0153x + 0.006320.9988
ZON13.89.8714.613.395.488.21.000.0397x − 0.007540.9998
AFB1: aflatoxin B1; AFB2: aflatoxin B2; AFG1: aflatoxin G1; AFG2: aflatoxin G2; AME: alternariol monomethyl ether; AOH: alternariol; DON: deoxynivalenol; FB1: fumonisin B1; FB2: fumonisin B2; FB3: fumonisin B3; OTA: ochratoin A; TEA: tenuazonic acid; ZON: zearalenone.
Table 2. The results of QC and PT sample analysis using the multi-method and EU standard methods.
Sample CodeMatrixDetected
Compounds
Detected
Concentrations (µg/kg)
Calculated
Z-Score
EvaluationDetected
Concentrations with Standard Method (Reference Value, µg/kg)
Evaluation
GAFTA PT 2022-M2MaizeAFB1
AFB2
AFG1
AFG2
Total Aflatoxins
1.77
0.507
2.05
0.69
5.05
0.49
0.0
1.67
1.90
1.61
Satisfactory1.79 (1.60)
0.524 (0.50)
1.86 (1.50)
0.552 (0.50)
4.73 (3.73)
Satisfactory
GAFTA PT
2022-M1
WheatHT-2
T-2
7.8
30.1
0.31
−1.42
Satisfactory9.2 (7.3)
38.1 (43.8)
Satisfactory
Romer PT M22411 AFMaizeAFB1
AFB2
AFG1
AFG2
Total Aflatoxins
FB1
FB2
FB3
Total Fumonisins
8.35
0.576
0.706

9.73
1136
296
121
1553
−0.22
−0.38
1.96

0.0
−1.56
−1.21
−1.31
−1.55
Satisfactory9.44 (8.79)
0.450 (0.63)
0.554 (0.49)

10.4 (9.72)
1414 (1425)
402 (387)
168 (168)
1984 (1911)
Satisfactory
Romer PT M22161 DZOWheatDON
OTA
ZON
2032
30.3
702
0.78
0.79
1.81
Satisfactory1694 (1826)
27.5 (25.9)
519 (545)
Satisfactory
Romer QC M21161DZOWheatDON
OTA
ZON
2597
25.0
200
−0.96
−0.84
0.62
Satisfactory2802 (2841)
28.7 (30.7)
195 (177)
Satisfactory
EURL QC 2016
O161
OatHT-2
T-2
161
63.8
0.33
−0.41
Satisfactory98 (150)
58.8 (70.3)
Satisfactory
EURL QC 2017
A004
WheatDON434−0.97Satisfactory388 (551)Satisfactory
EURL QC 2016
C257
MaizeAFB1
DON
FB1
FB2
ZON
10.9
553
501
237
210
0.13
−0.43
−1.58
0.27
1.33
Satisfactory9.10 (10.6)
454 (618)
653 (768)
246 (224)
147 (162)
Satisfactory
Romer QC
DZO10006460
WheatDON
OTA
ZON
618
7.4
34.6
−1.67
−1.24
−0.05
Satisfactory859 (825)
7.2 (10)
34.4 (34.9)
Satisfactory
Romer QC
10003613
MaizeAFB1
AFB2
8.5
1.93
−0.59
−0.49
Satisfactory8.6 (9.5)
2.5 (2.1)
Satisfactory
Trilogy QC
TQC-MMF11-100
MaizeAFB1
AFB2
Total Aflatoxins
DON
FB1
FB2
FB3
Total Fumonisins
HT-2
T-2
OTA
ZON
20.8
1.32
22.1
1932
1168
442
95
1705
121.9
104.5
17.5
374
0.54
0.07
0.50
0.16
−1.55
1.2
−0.2
−0.68
−0.41
1.22
−0.31
0.35
Satisfactory17.6 (18.6)
1.20 (1.30)
18.8 (19.9)
1758 (1900)
1276 (1400)
366 (400)
93 (100)
1735 (1900)
149 (127)
92.5 (94.8)
22.6 (18.5)
373 (360)
Satisfactory
FAPAS QC
T09133QC
Kidney Beans (Dried)Boscalid
Chlorpyrifos
Flufenoxuron
Flusilazole
Isofenphos-methyl
Isoprothiolane
Methacrifos
Pirimicarb
Pyridaben
Thiacloprid
81
143
26
119
25
154
70
96.4
32.3
67.2
−1.12
1.74
−2.38
−1.09
−3.06
−0.06
−1.88
−0.21
−1.79
−0.95
Questionable94 (107)
68 (103)
38.5 (55)
152 (155)
80 (77)
142 (156)
118 (119)
82 (101)
69 (53)
62 (85)
Satisfactory
FAPAS QC
T09140QC
Wheat flourDimethoate
Oxadiazon
Paclobutrazol
Permethrin
Pirimiphos-methyl
Prochloraz
Tebuconazole
47.1
101
134
28.1
104
166
79
2.10
1.35
1.02
−2.57
0.00
0.40
0.44
Questionable41.1 (32.1)
65.4 (77.8)
112 (98.3)
66.8 (64.7)
99.3 (104)
111 (153)
101 (87.3)
Satisfactory
PT, Chlorpyrifos-ethylWheatChlorpyrifos-ethyl28.0−0.68Satisfactory27.0 (33.0)Satisfactory
PT, Chlorpyrifos-ethylWheatChlorpyrifos-ethyl17.00.0Satisfactory19.6 (16.9)Satisfactory
EURL 2017 QC
EA047
RyeErgocornine/inine
α-Ergocryptine/inine
Ergocrystine/inine
Ergometrine/inine
Ergosine/inine
Ergotamine/inine
294
304
676
92.1
136
641
0.00
+1.60
−0.55
−1.20
−2.65
−0.45
Questionable280 (295)
337 (231)
651 (752)
114 (116)
222 (242)
606 (695)
Satisfactory
FAPAS QC
22180
RyeErgocornine
Ergocorninine
α-Ergocryptinine
Ergocrystine
Ergocrystinine
Ergometrine
Ergometrinine
Ergosine
Ergotamine
Ergotaminine
Total Ergot Alkaloides
45.2
12.6
13.9
85.6
20.8
27.1
4.30
16.9
34.5
6.03
338
1.79
0.07
−1.30
−0.91
−1.95
0.21
0.11
−1.08
−1.42
−2.29
−1.06
Questionable40.7 (32.4)
15.8 (12.4)
15.7 (19.5)
141 (107)
23.6 (36.4)
32 (25.9)
4.64 (4.2)
19.1 (22.2)
41.6 (50.2)
18.0 (13.6)
353 (419)
Satisfactory
EURL QC 2016
C029
CerealAtropine
Scopolamine
0.81
0.111
−1.37
−1.85
Questionable1.11 (1.16)
0.169 (0.183)
Satisfactory
FAPAS QC
22179
CerealAtropine
Scopolamine
6.5
3.6
−1.53
−0.37
Satisfactory8.82 (9.8)
4.83 (3.88)
Satisfactory
EURL QC 2016
E087
CerealAtropine
Scopolamine
6.7
0.63
−0.45
−1.77
Satisfactory6.29 (7.44)
0.76 (1.03)
Satisfactory
QC 2018T15WheatAME
AOH
TEA
4.0
3.3
76.0
−0.95
−1.63
2.1
Satisfactory4.08 (5.06)
5.96 (5.11)
71.0 (52.0)
Satisfactory
QC 2018 B56WheatAME
AOH
TEA
0.78
1.51
180
−1.53
−1.28
−1.95
Satisfactory0.69 (1.17)
2.51 (2.1)
314 (297)
Satisfactory
QC 2018 X06Sunflower seedAME
AOH
TEA
1.68
1.57
87
−0.91
−1.06
−1.84
Satisfactory2.01 (2.1)
1.32 (2.06)
102 (146)
Satisfactory
The outlier results are highlighted with red.
Table 3. Calibration levels.
CompoundsCal 1 (µg/kg)Cal 2 (µg/kg)Cal 3 (µg/kg)Cal 4 (µg/kg)Cal 5 (µg/kg)Cal 6 (µg/kg)
AFB10.212102050
AFB20.050.250.52.5512.5
AFG10.212102050
AFG20.050.250.52.5512.5
AME0.212102050
AOH0.212102050
Atropine/scopolamine0.212102050
DON105010050010002500
Ergot alkaloids0.212102050
Fumonisins105010050010002500
HT-2/T-2151050100250
OTA151050100250
Pesticides0.212102050
TEA1005001000500010,00025,000
ZON151050100250
Disclaimer/Publisher’s Note: The statements, opinions and data contained in all publications are solely those of the individual author(s) and contributor(s) and not of MDPI and/or the editor(s). MDPI and/or the editor(s) disclaim responsibility for any injury to people or property resulting from any ideas, methods, instructions or products referred to in the content.

