
Unveiling the Efficacy of Sesquiterpenes from Marine Sponge Dactylospongia elegans in Inhibiting Dihydrofolate Reductase Using Docking and Molecular Dynamic Studies

 ,
, 
 and
and 
Abstract
1. Introduction
2. Results and Discussion
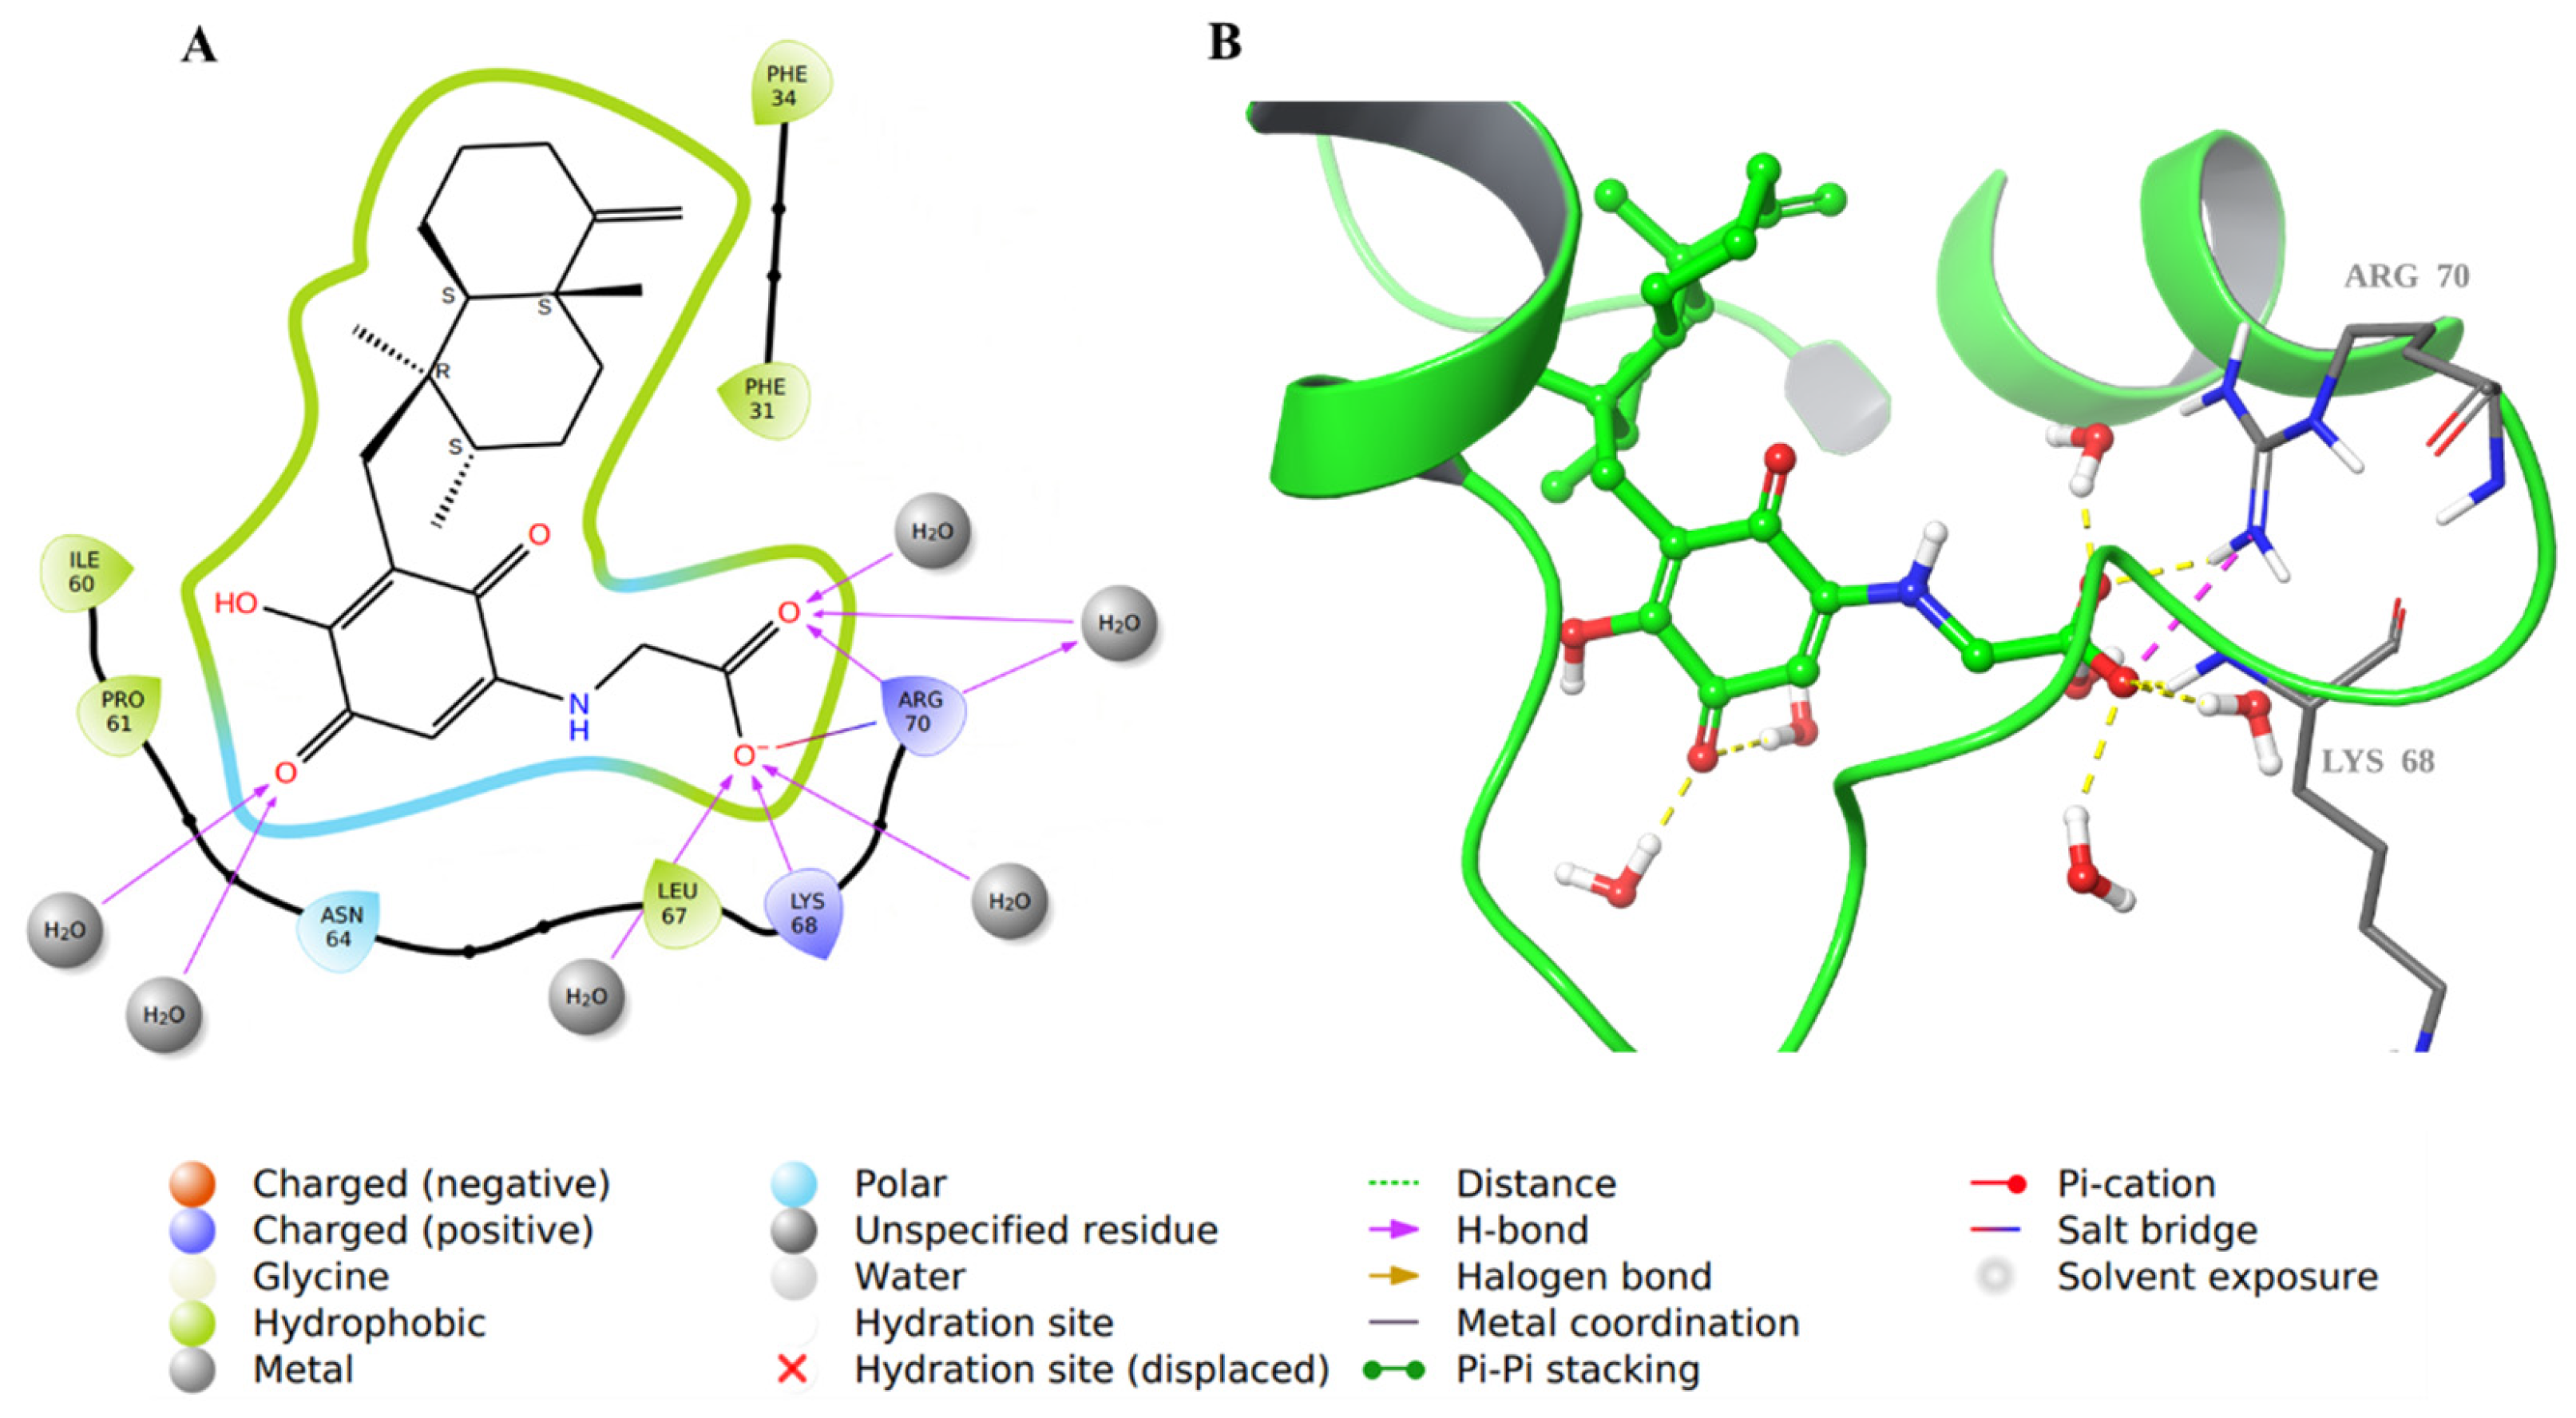
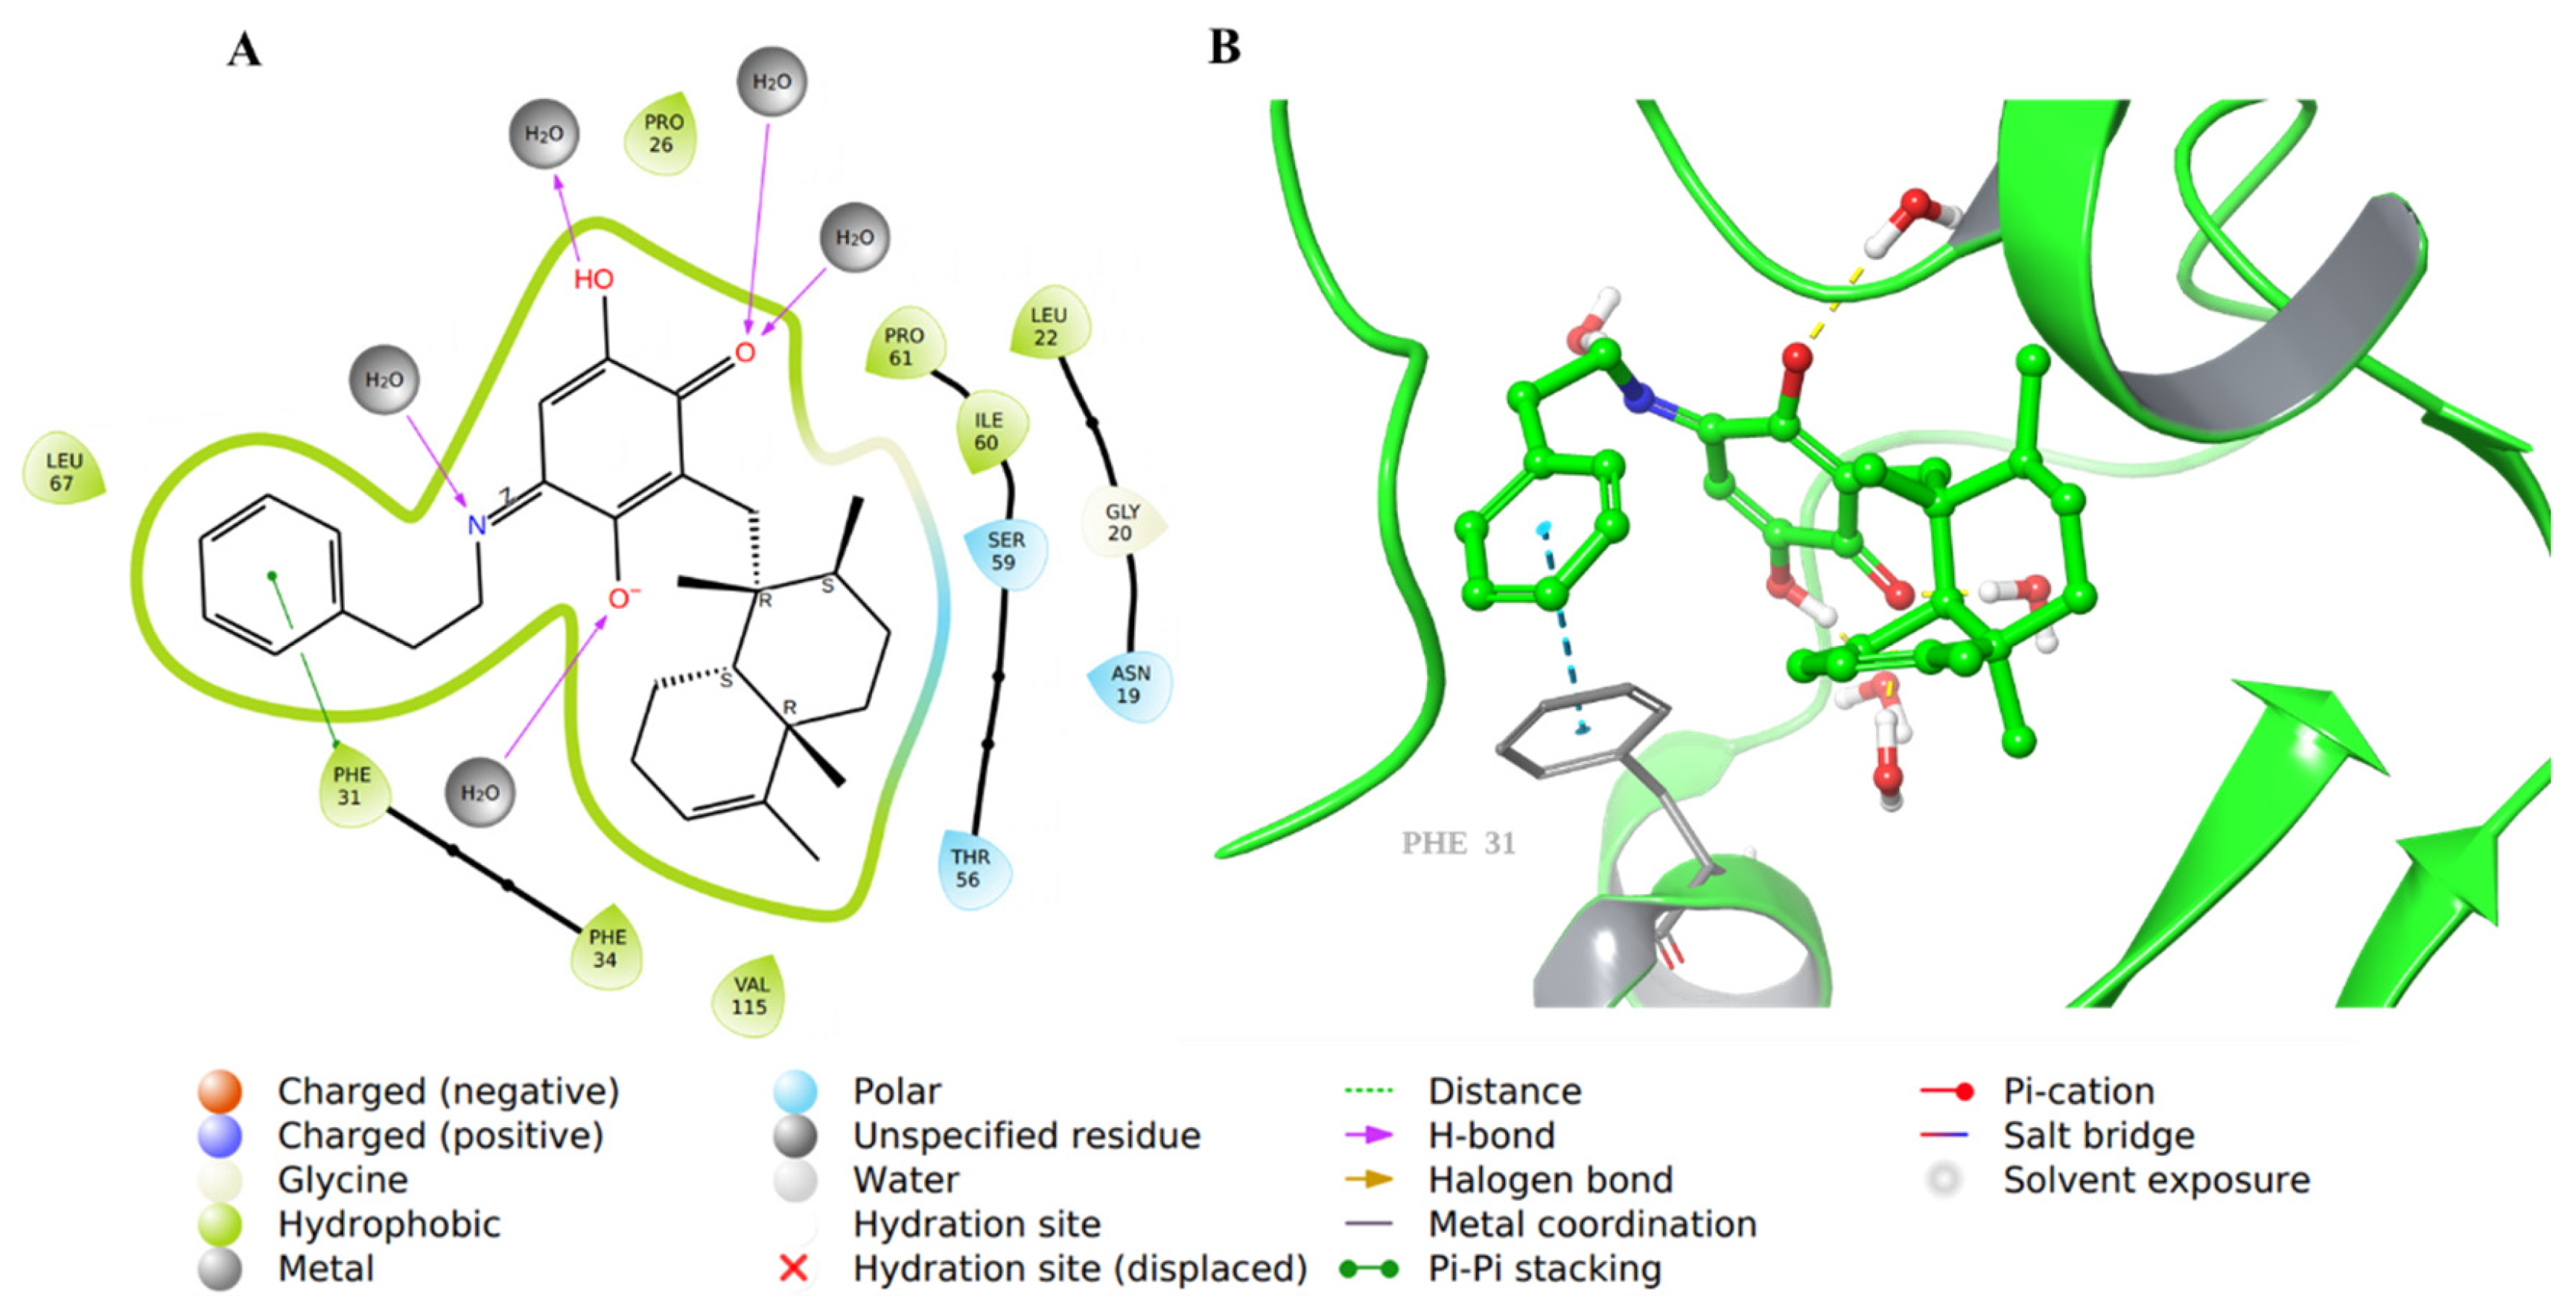
2.1. Molecular Docking Evaluation
2.2. In silico ADMET Properties
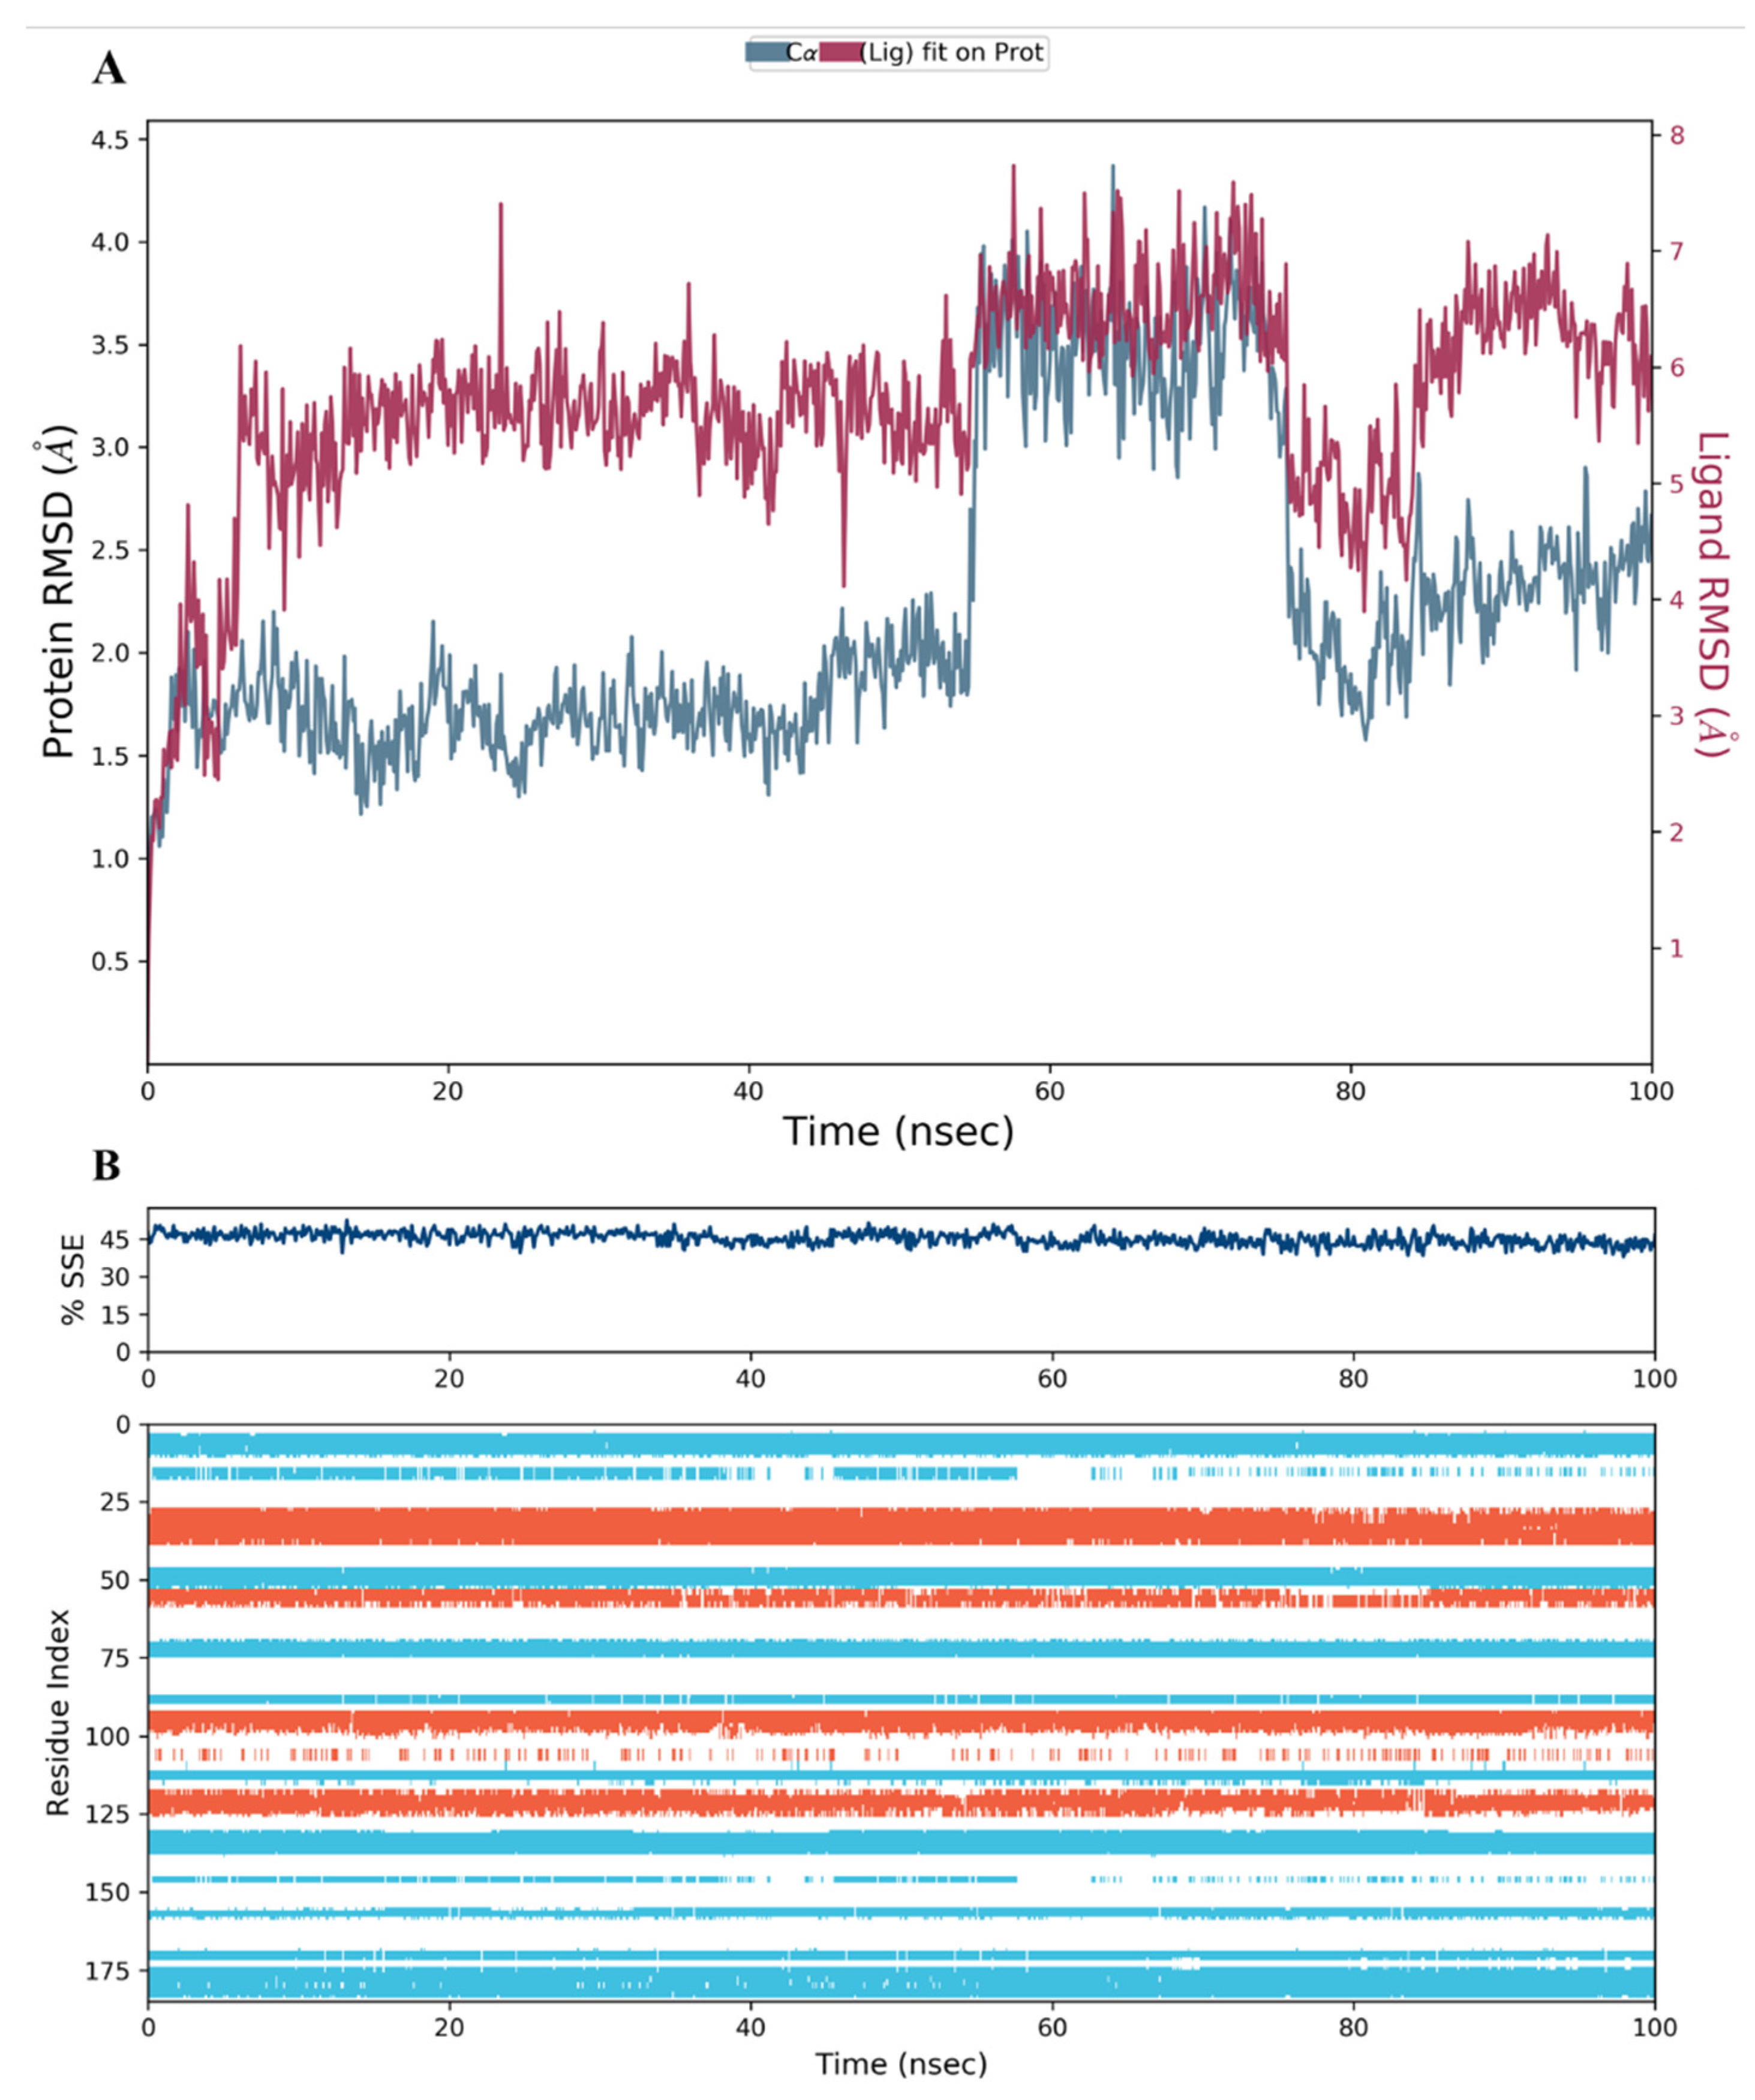
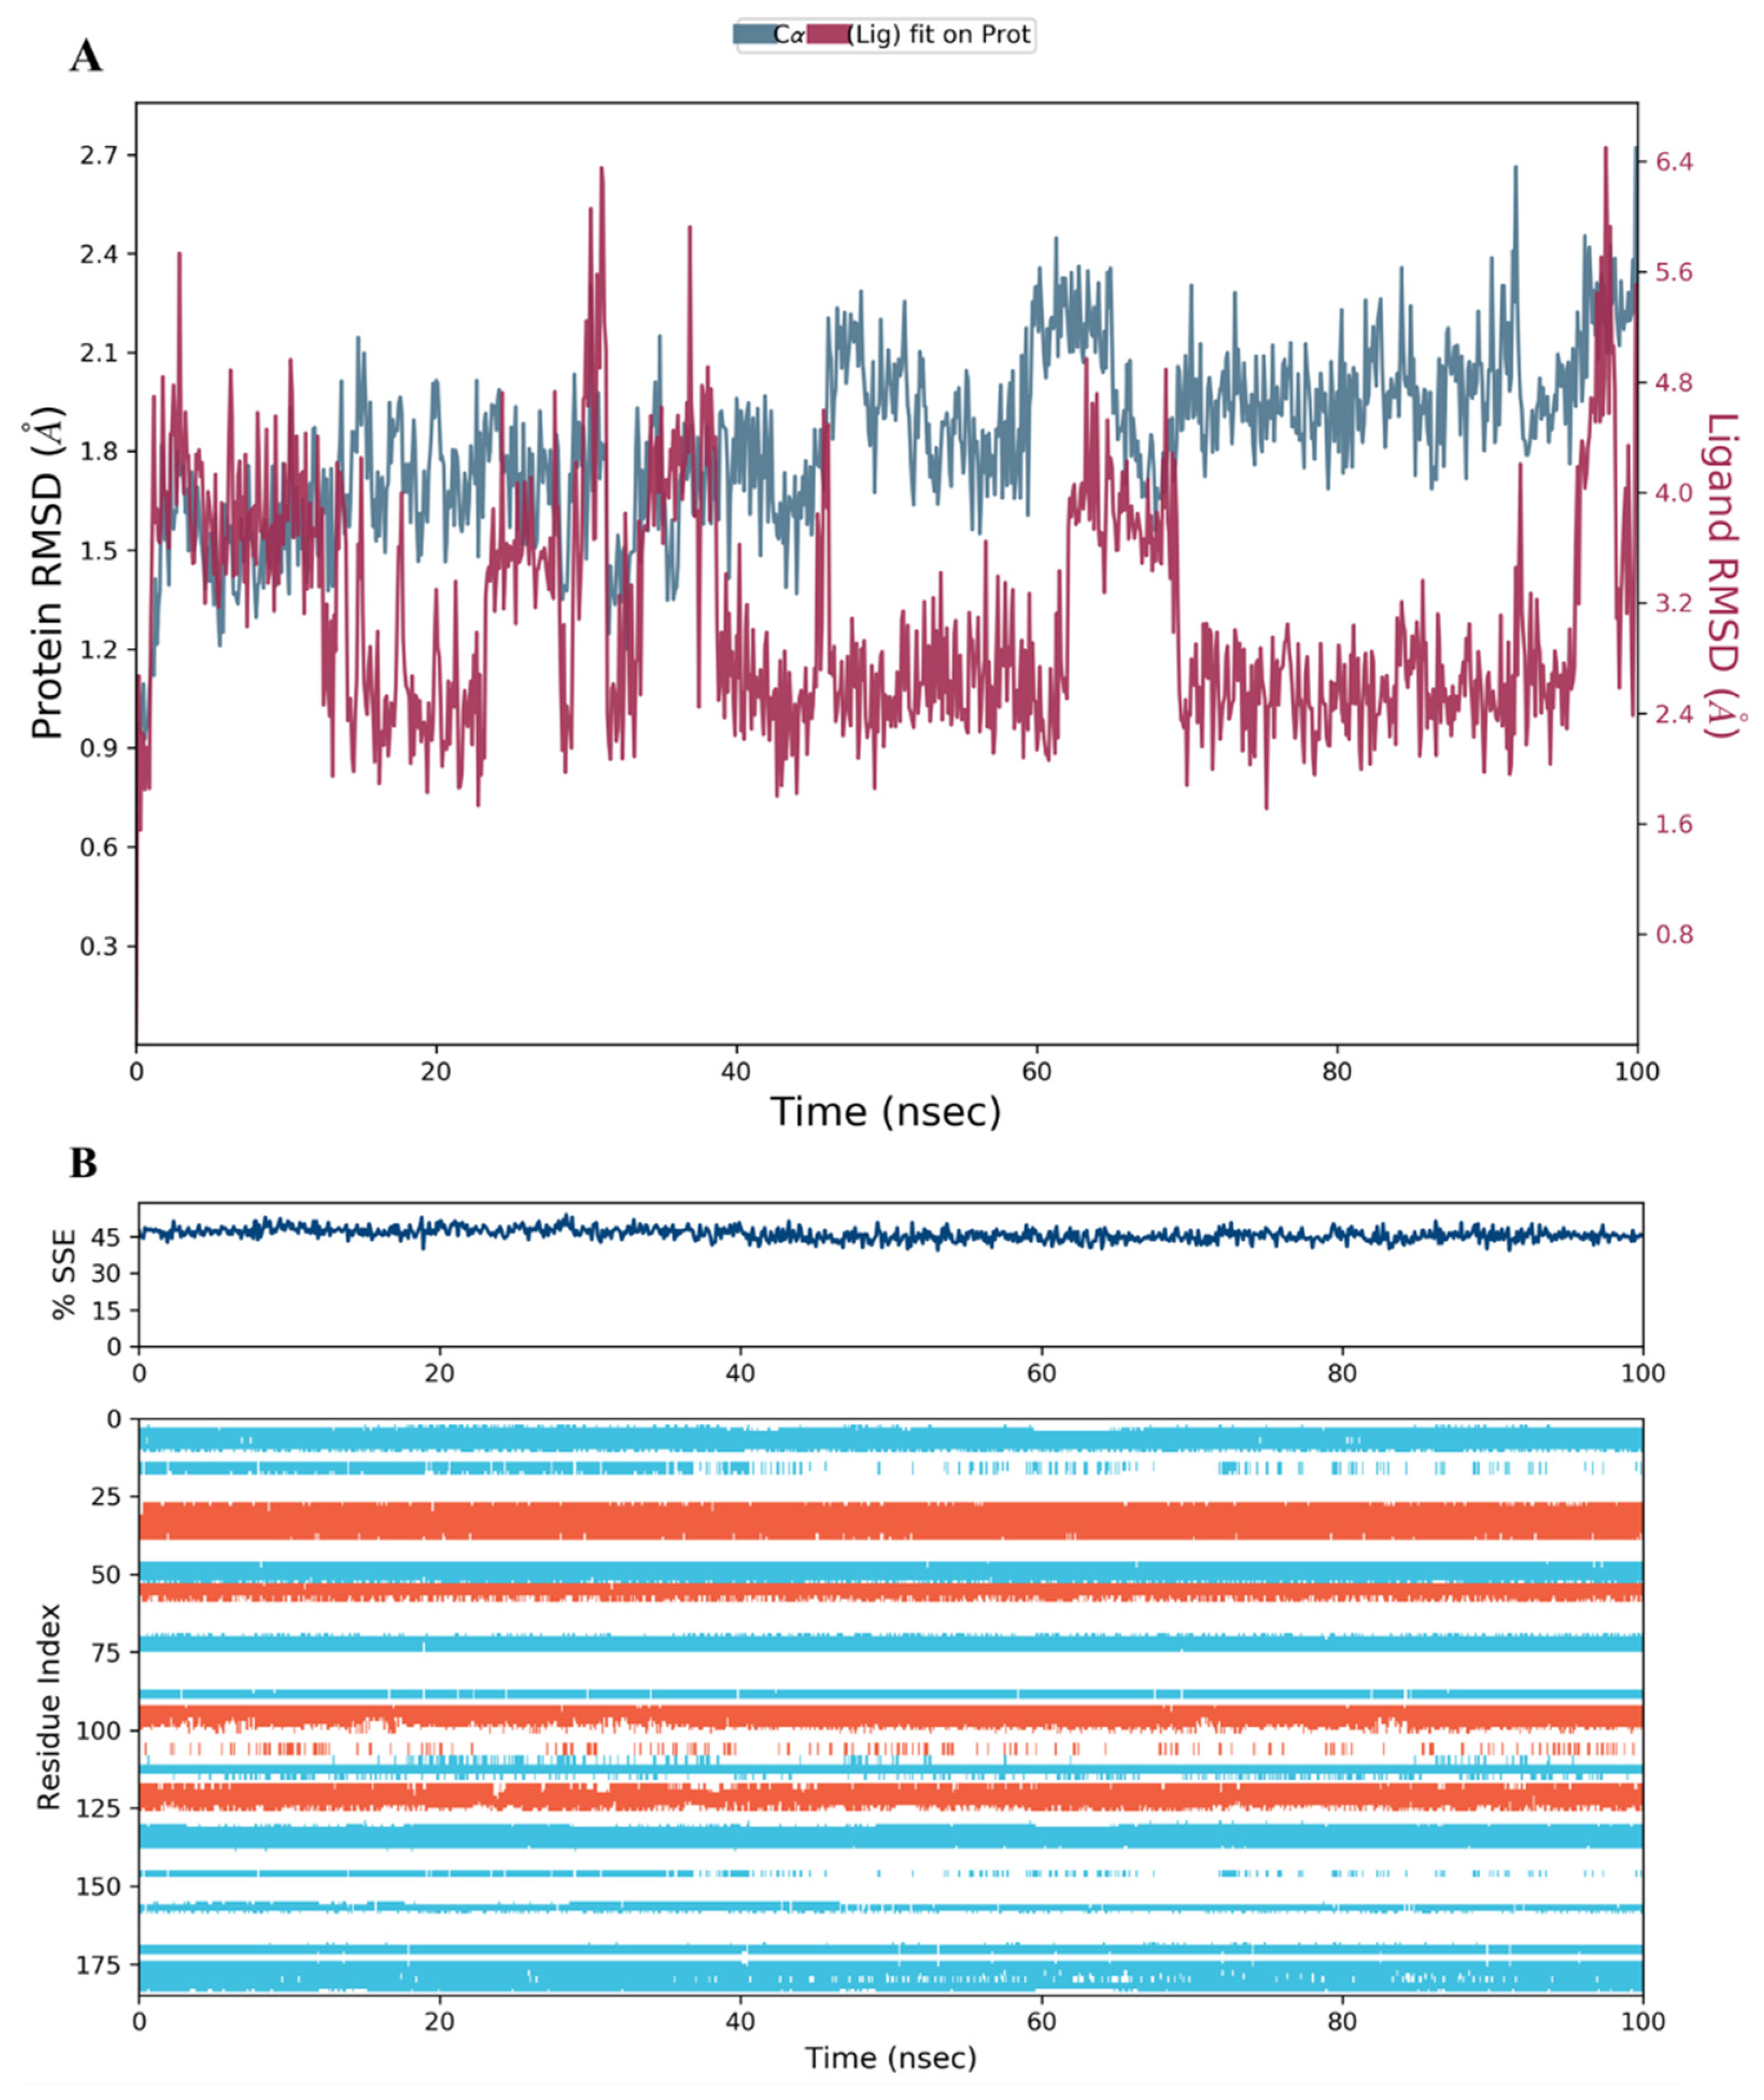
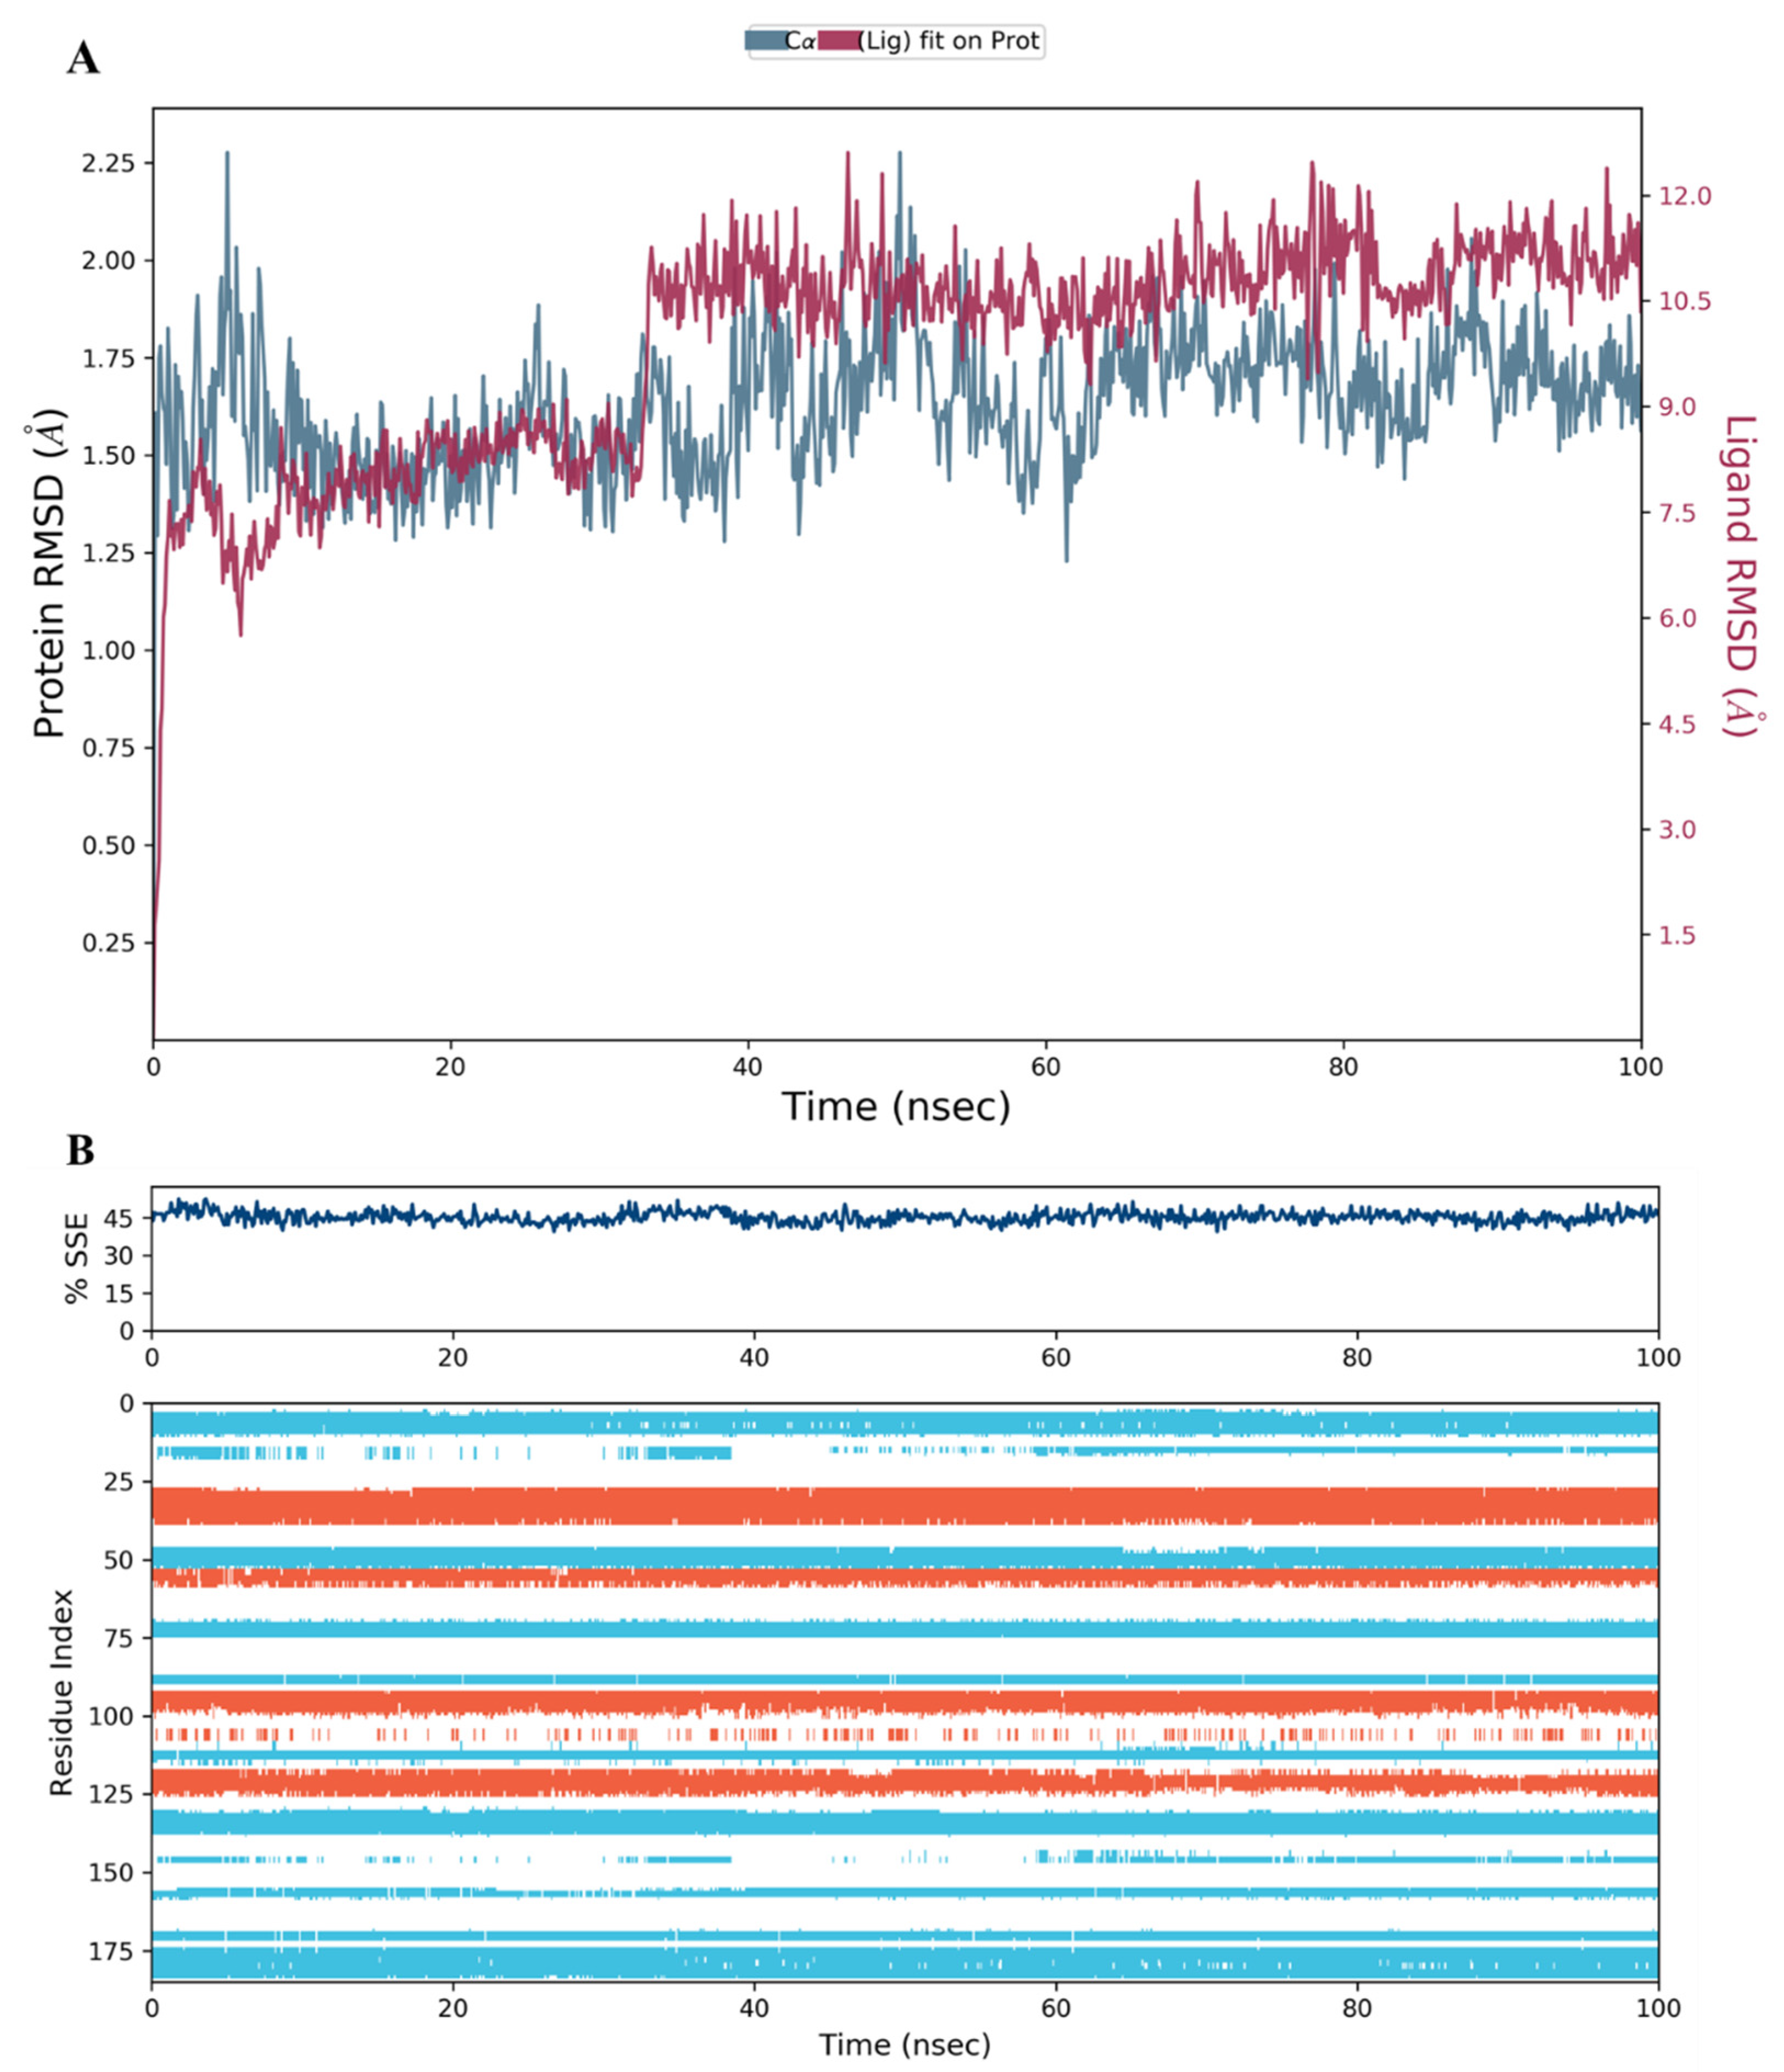
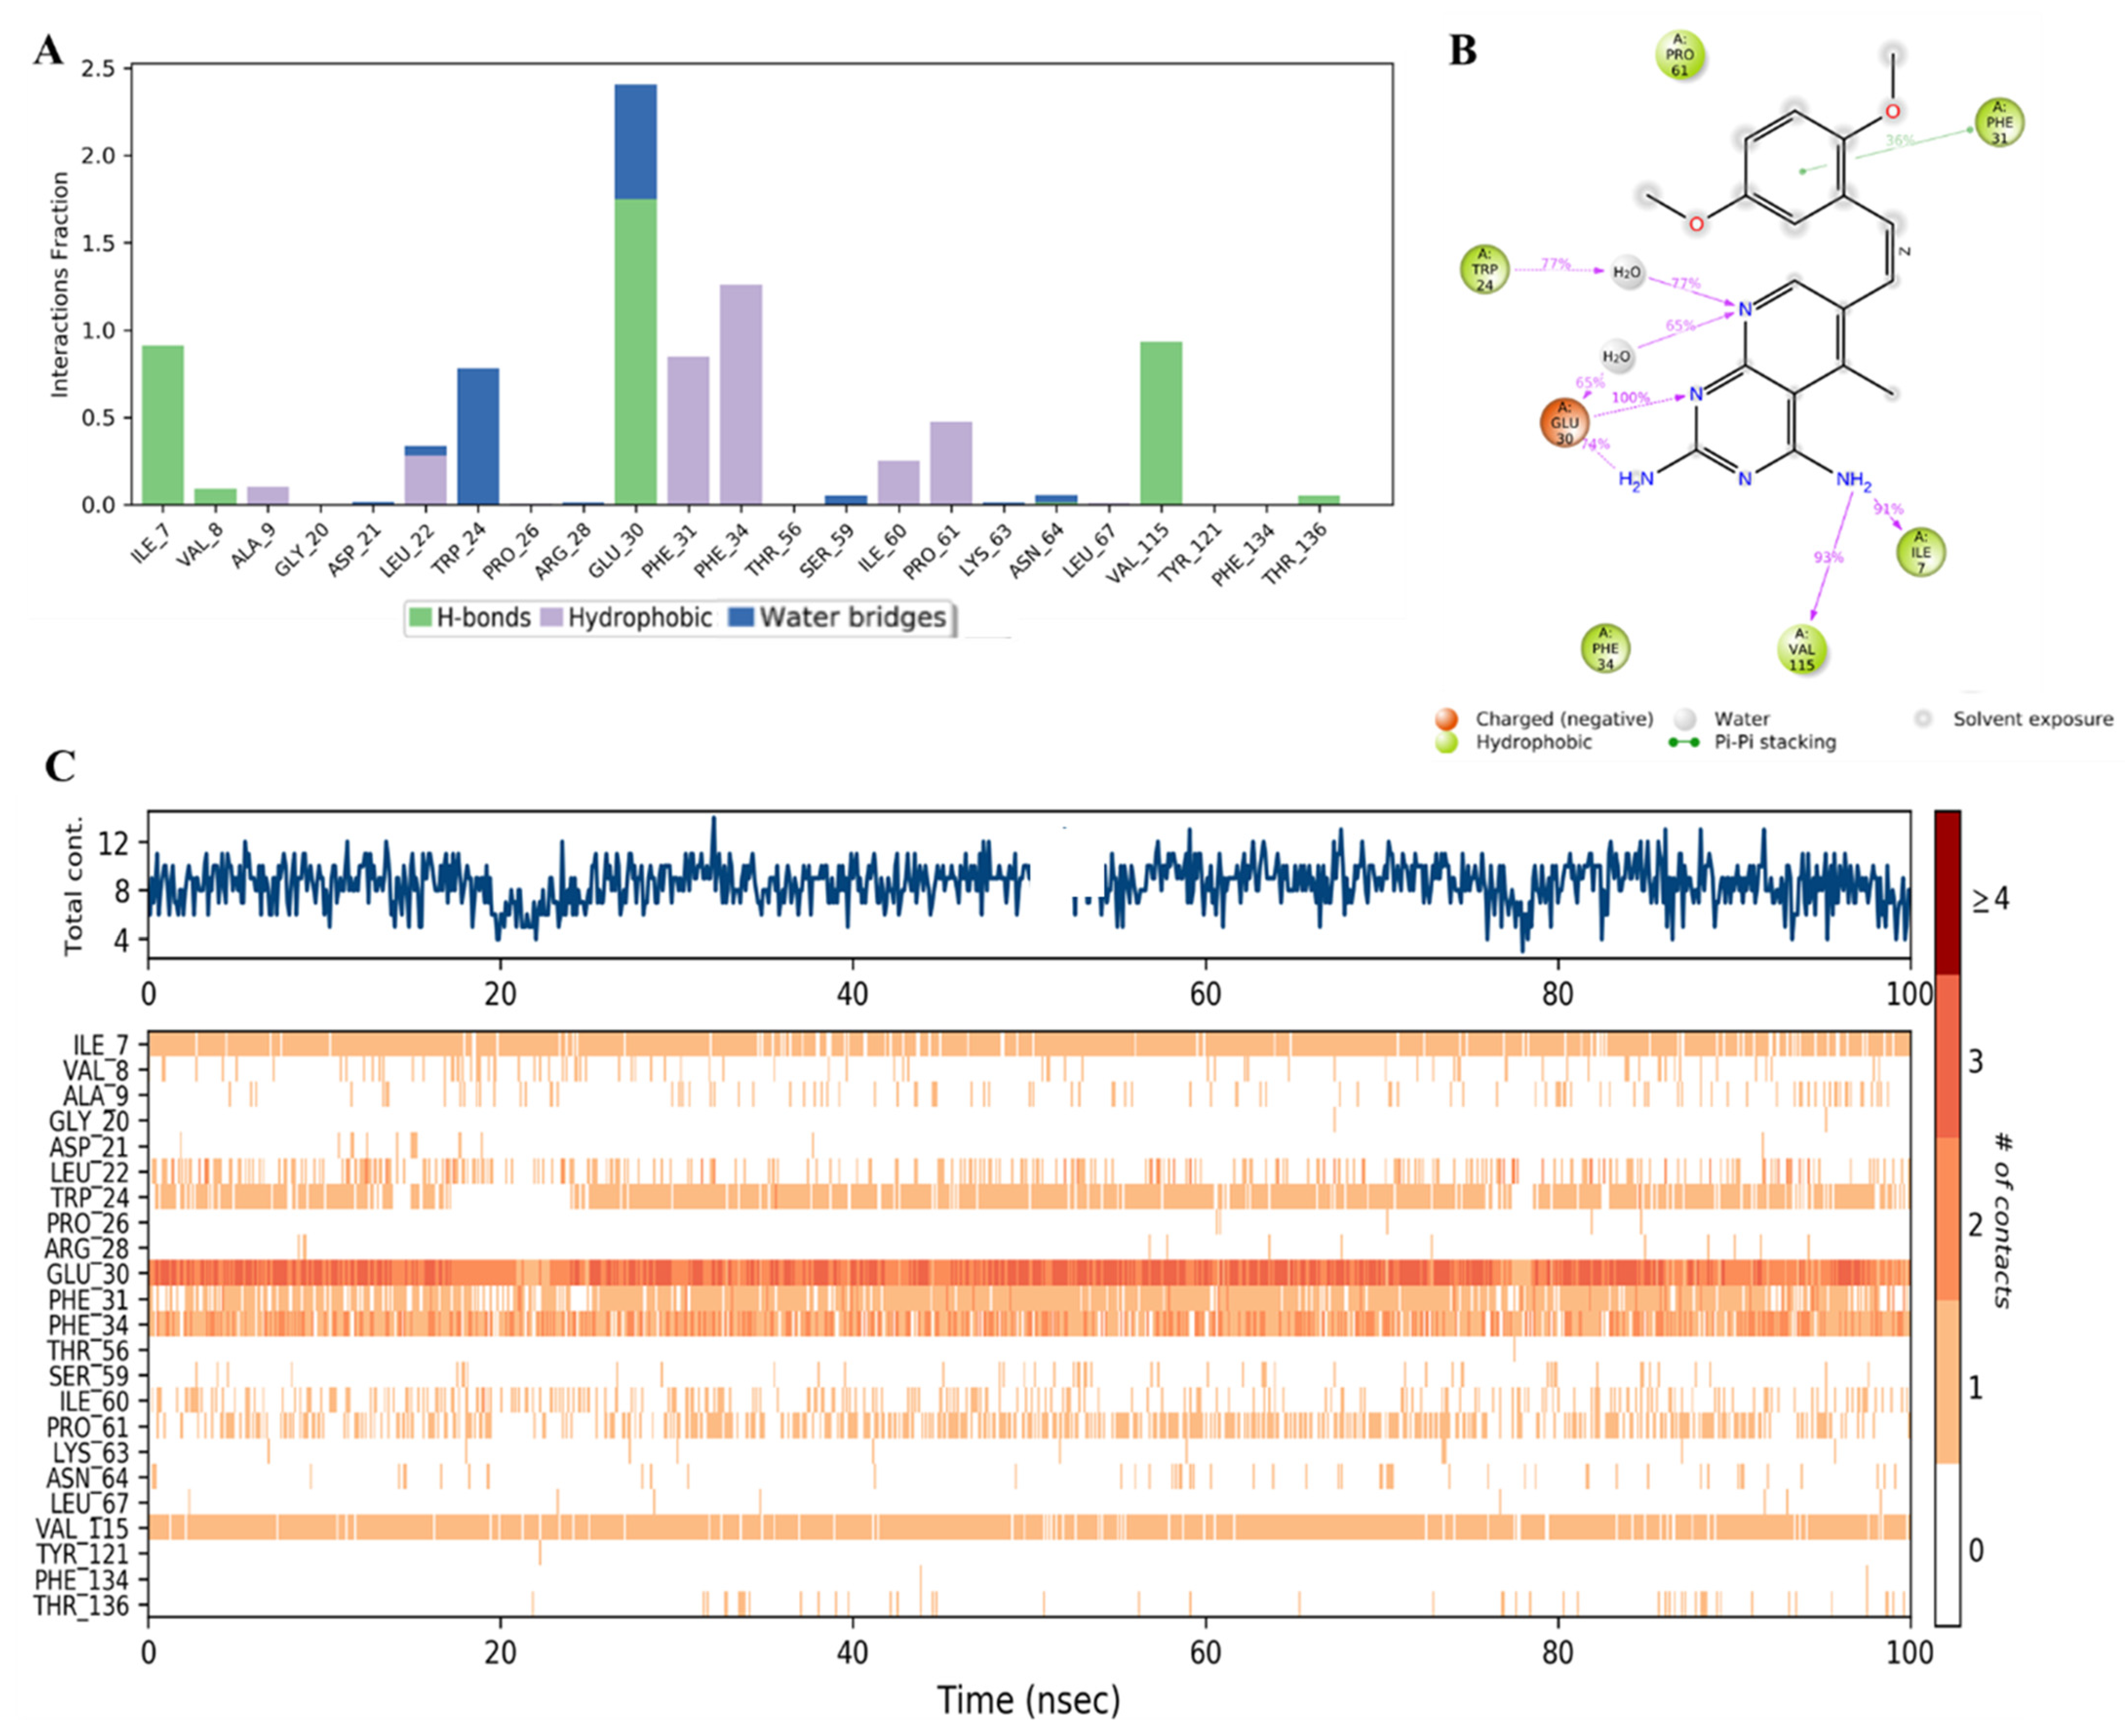
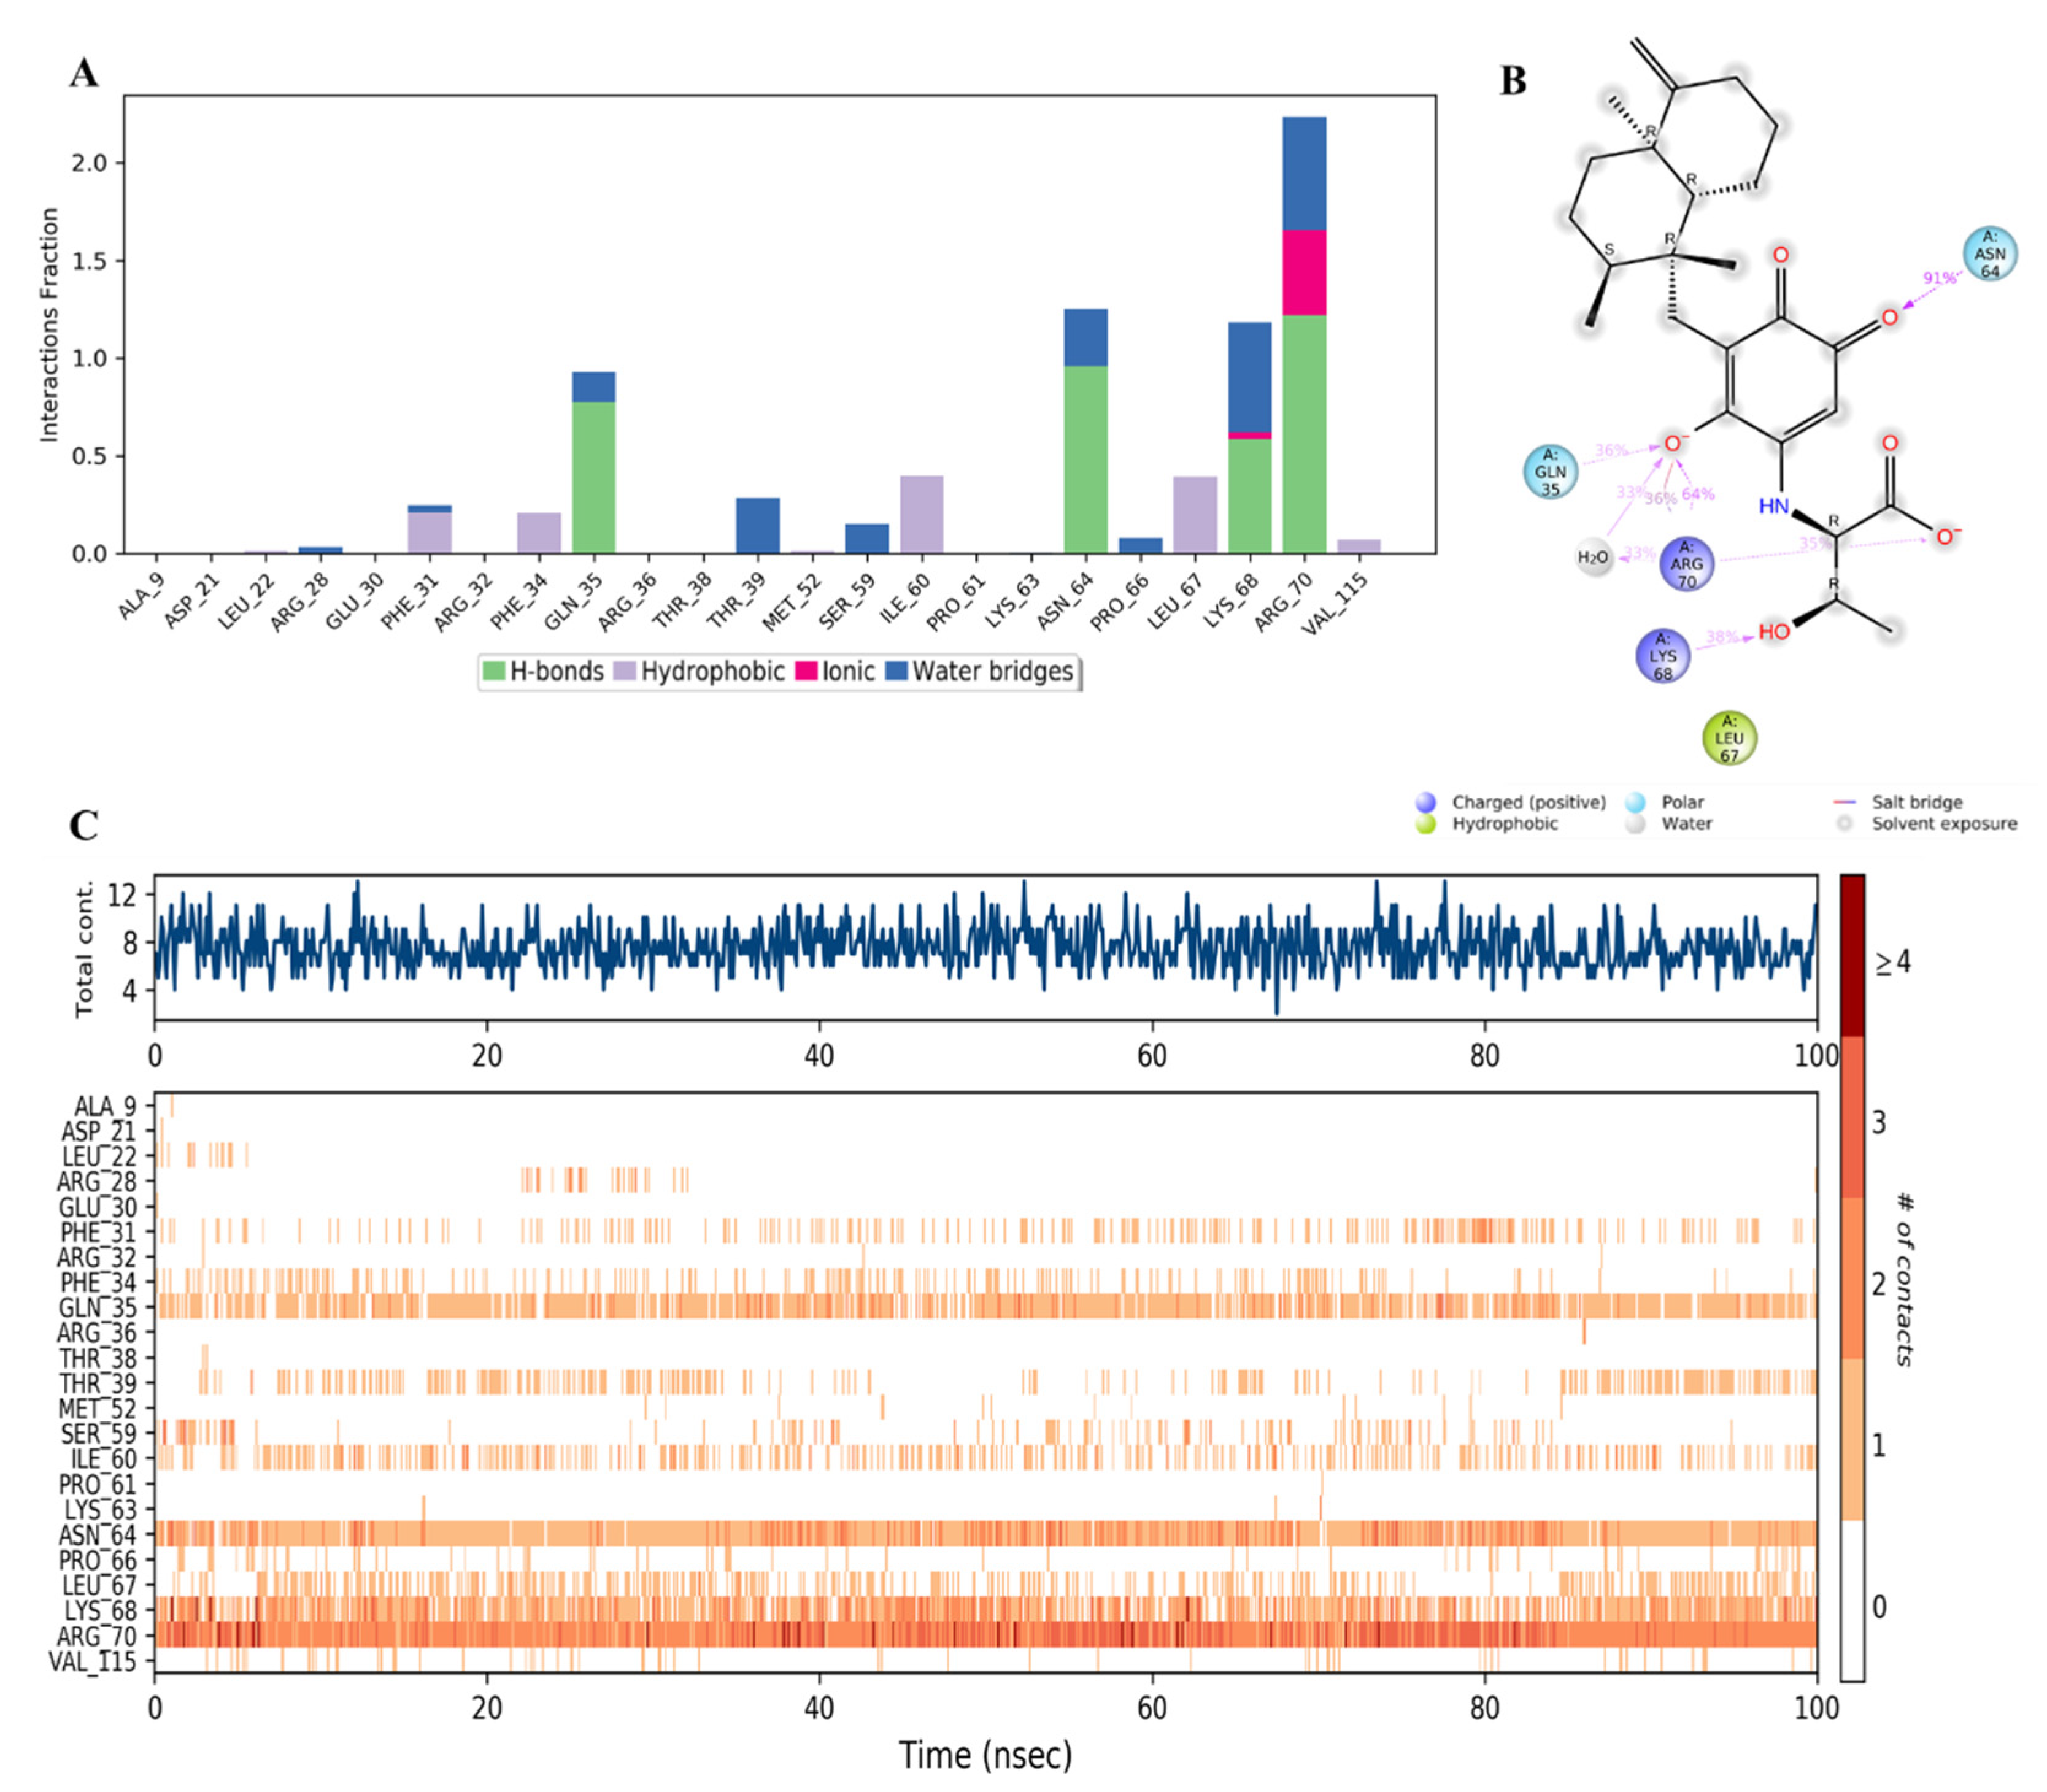
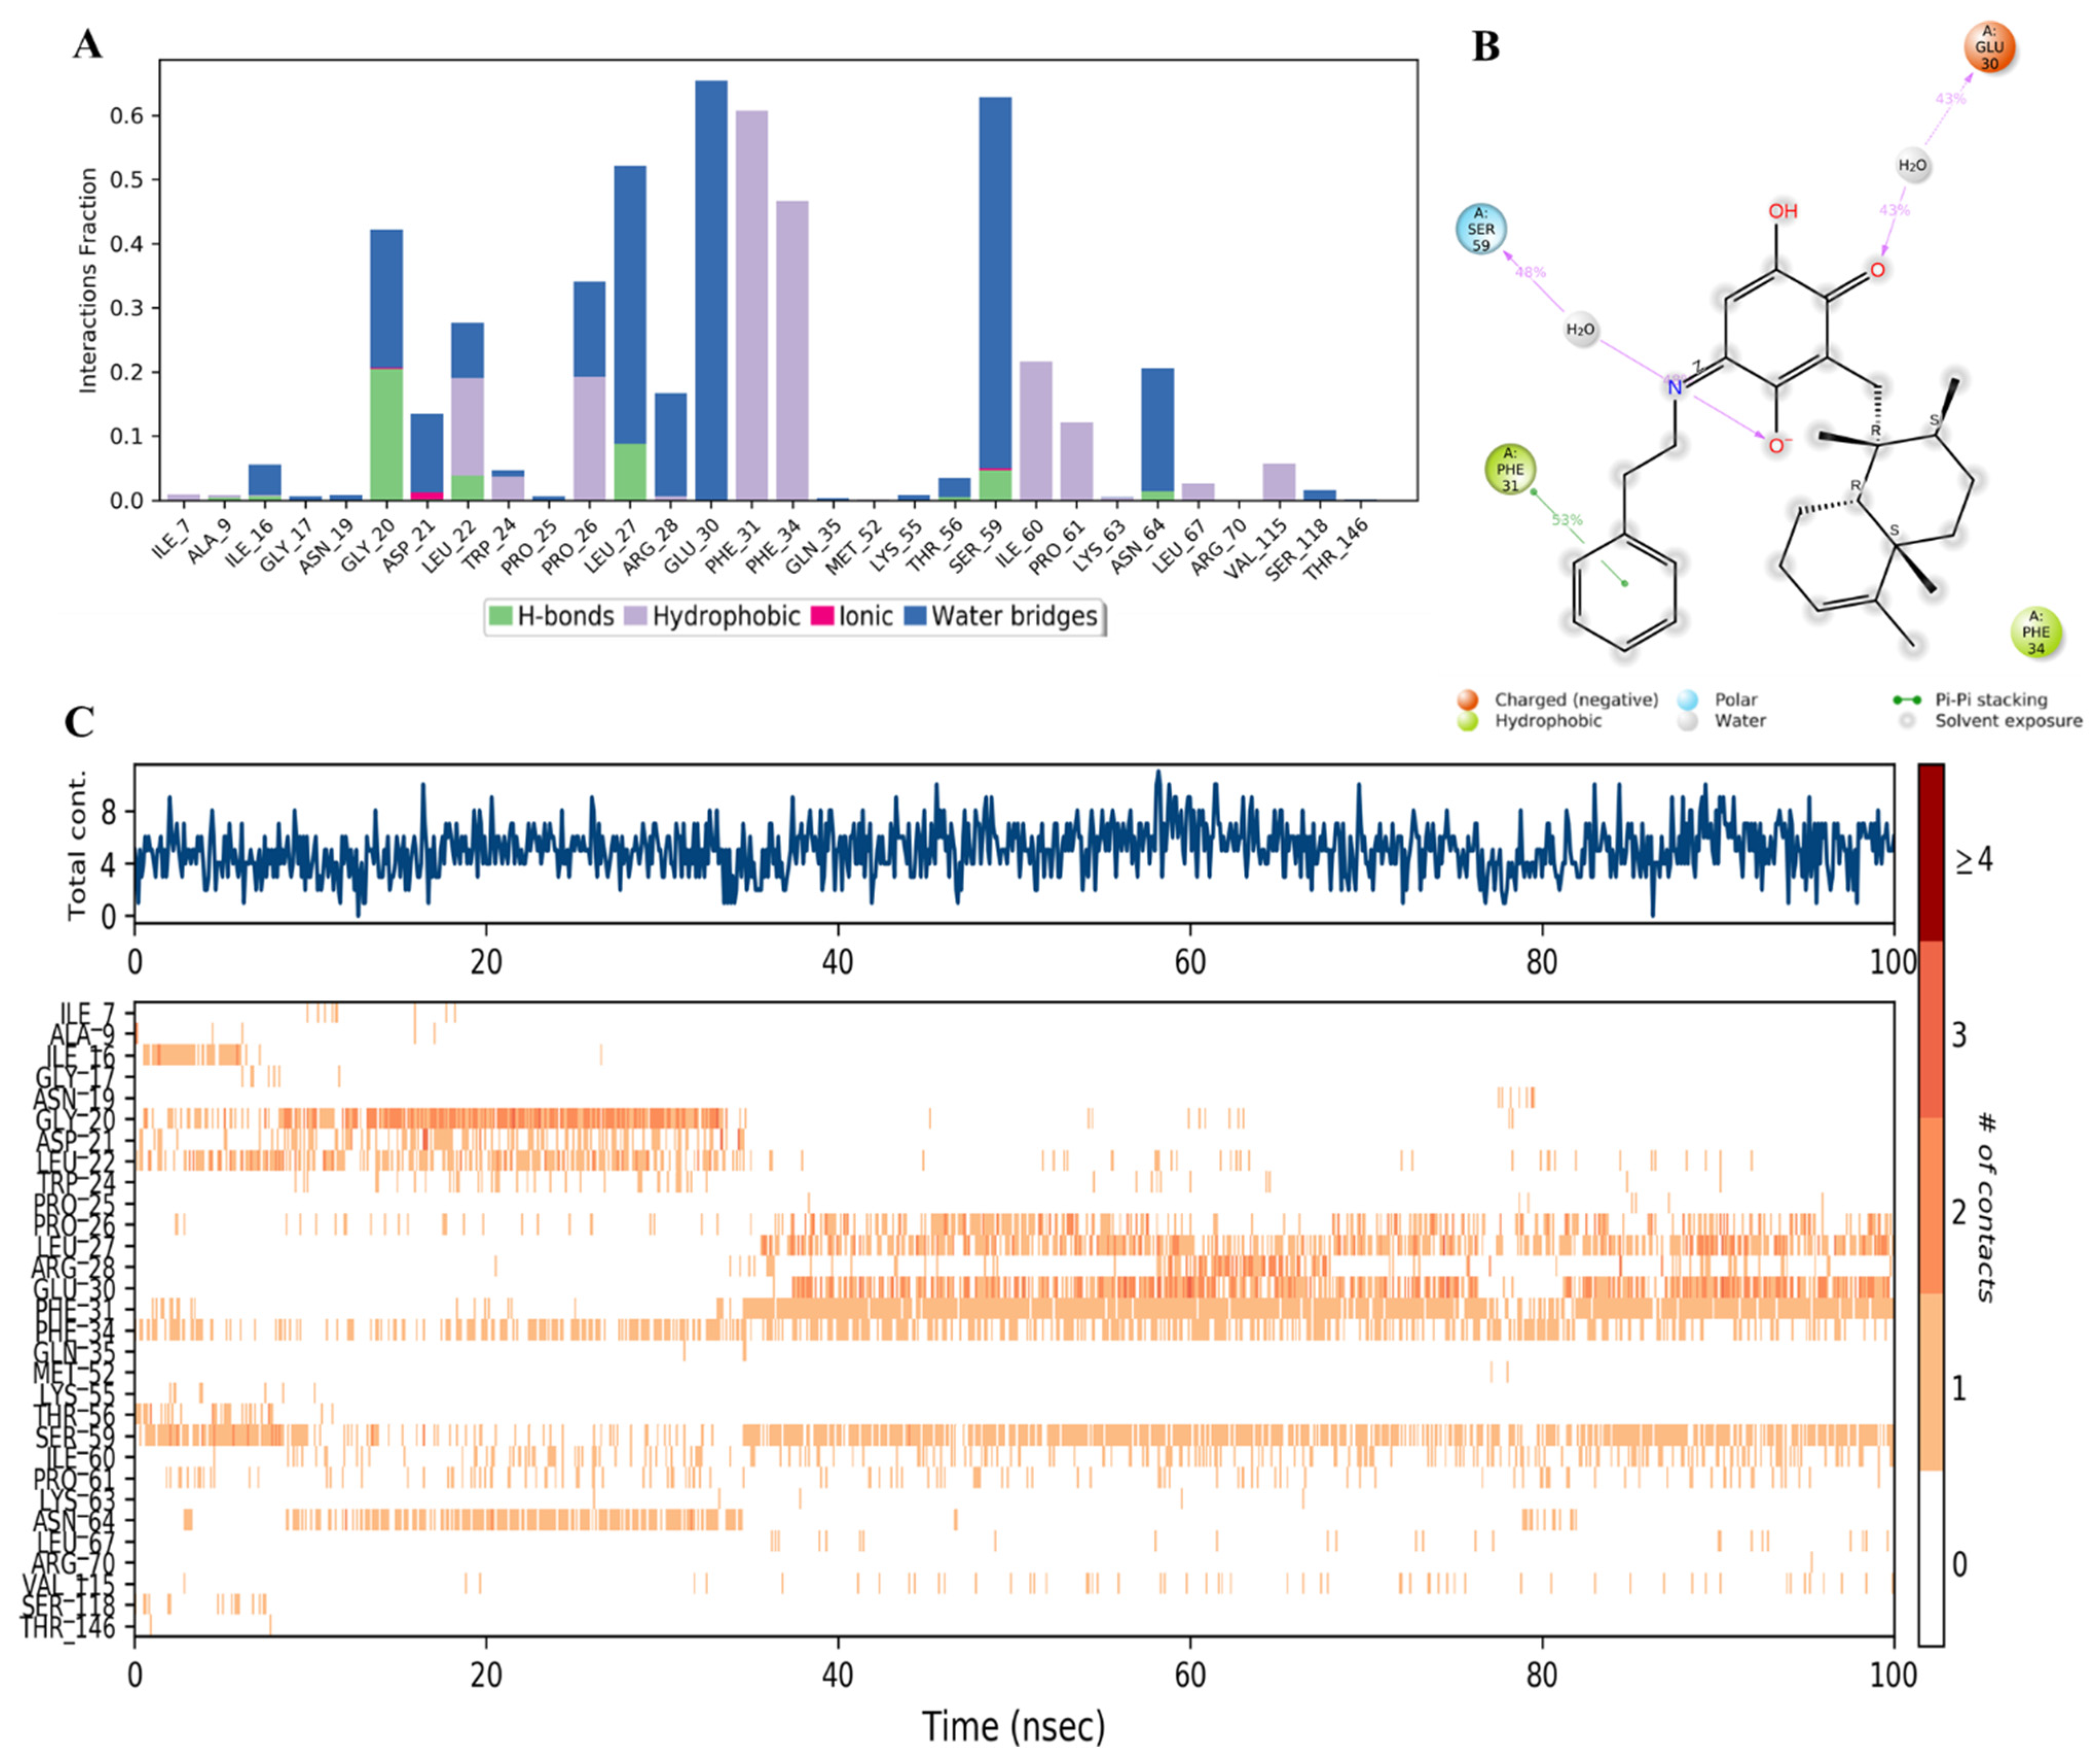
2.3. MD Simulation
3. Materials and Methods
3.1. Ligand and Protein Preparation
3.2. Grid Generation and Molecular Docking
3.3. ADME Properties
3.4. MD Simulation
4. Conclusion
Supplementary Materials
Author Contributions
Funding
Institutional Review Board Statement
Informed Consent Statement
Data Availability Statement
Acknowledgments
Conflicts of Interest
References
- Osorio, E.; Aguilera, C.; Naranjo, N.; Marín, M.; Muskus, C. Biochemical characterization of the bifunctional enzyme dihydrofolate reductase-thymidylate synthase from Leishmania (Viannia) and its evaluation as a drug target. Biomedica 2013, 33, 393–401. [Google Scholar] [CrossRef] [PubMed]
- Tobias, A.M.; Toska, D.; Lange, K.; Eck, T.; Bhat, R.; Janson, C.A.; Rotella, D.P.; Gubler, U.; Goodey, N.M. Expression, purification, and inhibition profile of dihydrofolate reductase from the filarial nematode Wuchereria bancrofti. PLoS ONE 2018, 13, e01971732018. [Google Scholar] [CrossRef] [PubMed]
- Raimondi, M.V.; Randazzo, O.; La Franca, M.; Barone, G.; Vignoni, E.; Rossi, D.; Collina, S. DHFR Inhibitors: Reading the Past for Discovering Novel Anticancer Agents. Molecules 2019, 24, 1140. [Google Scholar] [CrossRef] [PubMed]
- Hawser, S.; Lociuro, S.; Islam, K. Dihydrofolate reductase inhibitors as antibacterial agents. Biochem. Pharmacol. 2006, 71, 941–948. [Google Scholar] [CrossRef] [PubMed]
- Rana, R.M.; Rampogu, S.; Zeb, A.; Son, M.; Park, C.; Lee, G.; Yoon, S.; Baek, A.; Parameswaran, S.; Park, S.J.; et al. In Silico Study Probes Potential Inhibitors of Human Dihydrofolate Reductase for Cancer Therapeutics. J. Clin. Med. 2019, 8, 233. [Google Scholar] [CrossRef]
- Srinivasan, B.; Tonddast-Navaei, S.; Roy, A.; Zhou, H.; Skolnick, J. Chemical space of Escherichia coli dihydrofolate reductase inhibitors: New approaches for discovering novel drugs for old bugs. Med. Res. Rev. 2019, 39, 684–705. [Google Scholar] [CrossRef]
- Tibon, N.S.; Ng, C.H.; Cheong, S.L. Current progress in antimalarial pharmacotherapy and multi-target drug discovery. Eur. J. Med. Chem. 2020, 188, 111983. [Google Scholar] [CrossRef]
- Giletti, A.; Esperon, P. Genetic markers in methotrexate treatments. Pharm. J. 2018, 18, 689–703. [Google Scholar] [CrossRef]
- Wróbel, A.; Arciszewska, K.; Maliszewski, D.; Drozdowska, D. Trimethoprim and other nonclassical antifolates an excellent template for searching modifications of dihydrofolate reductase enzyme inhibitors. J. Antibiot. 2020, 73, 5–27. [Google Scholar] [CrossRef]
- Chawla, P.; Teli, G.; Gill, R.K.; Narang, R.K. An Insight into Synthetic Strategies and Recent Developments of Dihydrofolate Reductase Inhibitors. ChemistrySelect 2021, 6, 12101–12145. [Google Scholar] [CrossRef]
- Kreutzfeld, O.; Tumwebaze, P.K.; Byaruhanga, O.; Katairo, T.; Okitwi, M.; Orena, S.; Rasmussen, S.A.; Legac, J.; Conrad, M.D.; Nsobya, S.L.; et al. Decreased Susceptibility to Dihydrofolate Reductase Inhibitors Associated With Genetic Polymorphisms in Ugandan Plasmodium falciparum Isolates. J. Infect. Dis. 2022, 225, 696–704. [Google Scholar] [CrossRef]
- Krucinska, J.; Lombardo, M.N.; Erlandsen, H.; Estrada, A.; Si, D.; Viswanathan, K.; Wright, D.L. Structure-guided functional studies of plasmid-encoded dihydrofolate reductases reveal a common mechanism of trimethoprim resistance in Gram-negative pathogens. Commun. Biol. 2022, 5, 459. [Google Scholar] [CrossRef]
- Arya, H.; Coumar, M.S. Chapter 4—Lead identification and optimization. In The Design & Development of Novel Drugs and Vaccines; Bhatt, T.K., Nimesh, S., Eds.; Academic Press: Boston, MA, USA, 2021; pp. 31–63. [Google Scholar] [CrossRef]
- Aguayo-Ortiz, R.; Fernández-de Gortari, E. Chapter 2—Overview of Computer-Aided Drug Design for Epigenetic Targets. In Epi-Informatics; Medina-Franco, J.L., Ed.; Academic Press: Boston, MA, USA, 2016. [Google Scholar] [CrossRef]
- Nastrucci, C.; Cesario, A.; Russo, P. Anticancer Drug Discovery from the Marine Environment. Recent Pat. Anti-Cancer Drug Discov. 2012, 7, 218–232. [Google Scholar] [CrossRef]
- Abdelmohsen, U.R.; Balasubramanian, S.; Oelschlaeger, T.A.; Grkovic, T.; Pham, N.B.; Quinn, R.J.; Hentschel, U. Potential of marine natural products against drug-resistant fungal, viral, and parasitic infections. Lancet Infect. Dis. 2017, 17, e30–e41. [Google Scholar] [CrossRef]
- Lu, W.-Y.; Li, H.-J.; Li, Q.-Y.; Wu, Y.-C. Application of marine natural products in drug research. Bioorganic Med. Chem. 2021, 35, 116058. [Google Scholar] [CrossRef]
- Pereira, F.; Aires-de-Sousa, J. Computational Methodologies in the Exploration of Marine Natural Product Leads. Mar. Drugs 2018, 16, 236. [Google Scholar] [CrossRef]
- Chen, G.; Seukep, A.J.; Guo, M. Recent Advances in Molecular Docking for the Research and Discovery of Potential Marine Drugs. Mar. Drugs 2020, 18, 545. [Google Scholar] [CrossRef]
- Marcos, I.S.; Conde, A.; Moro, R.F.; Basabe, P.; Diez, D.; Urones, J.G. Quinone/Hydroquinone Sesquiterpenes. Mini-Rev. Org. Chem. 2010, 7, 230–254. [Google Scholar] [CrossRef]
- Kumar, M.; Dagar, A.; Gupta, V.K.; Sharma, A. In silico docking studies of bioactive natural plant products as putative DHFR antagonists. Med. Chem. Res. 2014, 23, 810–817. [Google Scholar] [CrossRef]
- Herrmann, F.C.; Sivakumar, N.; Jose, J.; Costi, M.P.; Pozzi, C.; Schmidt, T.J. In Silico Identification and In Vitro Evaluation of Natural Inhibitors of Leishmania major Pteridine Reductase I. Molecules 2017, 22, 2166. [Google Scholar] [CrossRef]
- Jose, S.; Devi, S.S.; Al-Khafaji, K. Phytochemical constituents of Inula britannica as potential inhibitors of dihydrofolate reductase: A strategic approach against shigellosis. J. Biomol. Struct. Dyn. 2022, 40, 11932–11947. [Google Scholar] [CrossRef] [PubMed]
- Possart, K.; Herrmann, F.C.; Jose, J.; Costi, M.P.; Schmidt, T.J. Sesquiterpene Lactones with Dual Inhibitory Activity against the Trypanosoma brucei Pteridine Reductase 1 and Dihydrofolate Reductase. Molecules 2022, 27, 149. [Google Scholar] [CrossRef]
- Herrera-Acevedo, C.; Monroy-Velandia, D.; Flores-Gaspar, A.; Coy-Barrera, E. In Silico Studies to Evaluate Interactions Between Kaurane-Type Diterpenes and the Dihy-drofolate Reductase–Thymilidine Synthase of Three Leishmania Species. In Proceedings of the International Conference on Multidisciplinary Sciences (MOL2NET 2018), 4th edition UFPB, Paraiba, Brasil, 15 January 2018. [Google Scholar]
- Kwon, Y.-J.; Sohn, M.-J.; Kim, H.-J.; Kim, W.-G. The Lactone form of stachybotrydial: A new inhibitor of dihydrofolate reductase from stachybotrys sp. FN298. Biol. Pharm. Bull. 2014, 37, 1406–1410. [Google Scholar] [CrossRef] [PubMed]
- Alea, G.; Carroll, A.R.; Bowden, B.F. Coscinoquinol, a New Cytotoxic Sesterterpene From a Dictyoceratid Sponge, Coscinoderma sp. Aust. J. Chem. 1994, 47, 191–194. [Google Scholar] [CrossRef]
- Zubía, E.; Ortega, M.J.; Luis Carballo, J.; Salvá, J. Sesquiterpene hydroquinones from the sponge Reniera mucosa. Tetrahedron 1994, 50, 8153–8160. [Google Scholar] [CrossRef]
- Ibrahim, S.R.M.; Fadil, S.A.; Fadil, H.A.; Hareeri, R.H.; Alolayan, S.O.; Abdallah, H.M.; Mohamed, G.A. Dactylospongia elegans—A Promising Drug Source: Metabolites, Bioactivities, Biosynthesis, Synthesis, and Structural-Activity Relationship. Mar. Drugs 2022, 20, 221. [Google Scholar] [CrossRef]
- Klon, A.E.; Héroux, A.; Ross, L.J.; Pathak, V.; Johnson, C.A.; Piper, J.R.; Borhani, D.W. Atomic Structures of Human Dihydrofolate Reductase Complexed with NADPH and Two Lipophilic Antifolates at 1.09Å and 1.05Å Resolution. J. Mol. Biol. 2002, 320, 677–693. [Google Scholar] [CrossRef]
- Olsson, M.H.M.; Søndergaard, C.R.; Rostkowski, M.; Jensen, J.H. PROPKA3: Consistent Treatment of Internal and Surface Residues in Empirical pKa Predictions. J. Chem. Theory Comput. 2011, 7, 525–537. [Google Scholar] [CrossRef]
- LigPrep; Schrödinger, LLC: New York, NY, USA, 2021.
- Friesner, R.A.; Banks, J.L.; Murphy, R.B.; Halgren, T.A.; Klicic, J.J.; Mainz, D.T.; Repasky, M.P.; Knoll, E.H.; Shelley, M.; Perry, J.K.; et al. Glide: A New Approach for Rapid, Accurate Docking and Scoring. 1. Method and Assessment of Docking Accuracy. J. Med. Chem. 2004, 47, 1739–1749. [Google Scholar] [CrossRef]
- Friesner, R.A.; Murphy, R.B.; Repasky, M.P.; Frye, L.L.; Greenwood, J.R.; Halgren, T.A.; Sanschagrin, P.C.; Mainz, D.T. Extra Precision Glide: Docking and Scoring Incorporating a Model of Hydrophobic Enclosure for Protein−Ligand Complexes. J. Med. Chem. 2006, 49, 6177–6196. [Google Scholar] [CrossRef]
- Glide; Schrödinger, LLC: New York, NY, USA, 2021.
- Hou, T.; Wang, J.; Li, Y.; Wang, W. Assessing the Performance of the MM/PBSA and MM/GBSA Methods. 1. The Accuracy of Binding Free Energy Calculations Based on Molecular Dynamics Simulations. J. Chem. Inf. Model. 2011, 51, 69–82. [Google Scholar] [CrossRef] [PubMed]
- Koushki, E.H.; Abolghasemi, S.; Mollica, A.; Aghaeepoor, M.; Moosavi, S.S.; Farshadfar, C.; Hasanpour, B.; Feyzi, B.; Abdi, F.; Mirzaie, S. Structure-based virtual screening, molecular docking and dynamics studies of natural product and classical inhibitors against human dihydrofolate reductase. Netw. Model. Anal. Health Inform. Bioinform. 2020, 9, 49. [Google Scholar] [CrossRef]
- QikProp; Schrödinger, LLC.: New York, NY, USA, 2021.
- Maestro; Schrödinger, LLC: New York, NY, USA, 2021.
- Desmond Molecular Dynamics System, Maestro-Desmond Interoperability Tools; Schrödinger: New York, NY, USA, 2021.
- Hollingsworth, S.A.; Dror, R.O. Molecular Dynamics Simulation for All. Neuron 2018, 99, 1129–1143. [Google Scholar] [CrossRef]
- Leelananda, S.P.; Lindert, S. Computational methods in drug discovery. Beilstein J. Org. Chem. 2016, 12, 2694–2718. [Google Scholar] [CrossRef] [PubMed]


| Activity | Compound Name |
|---|---|
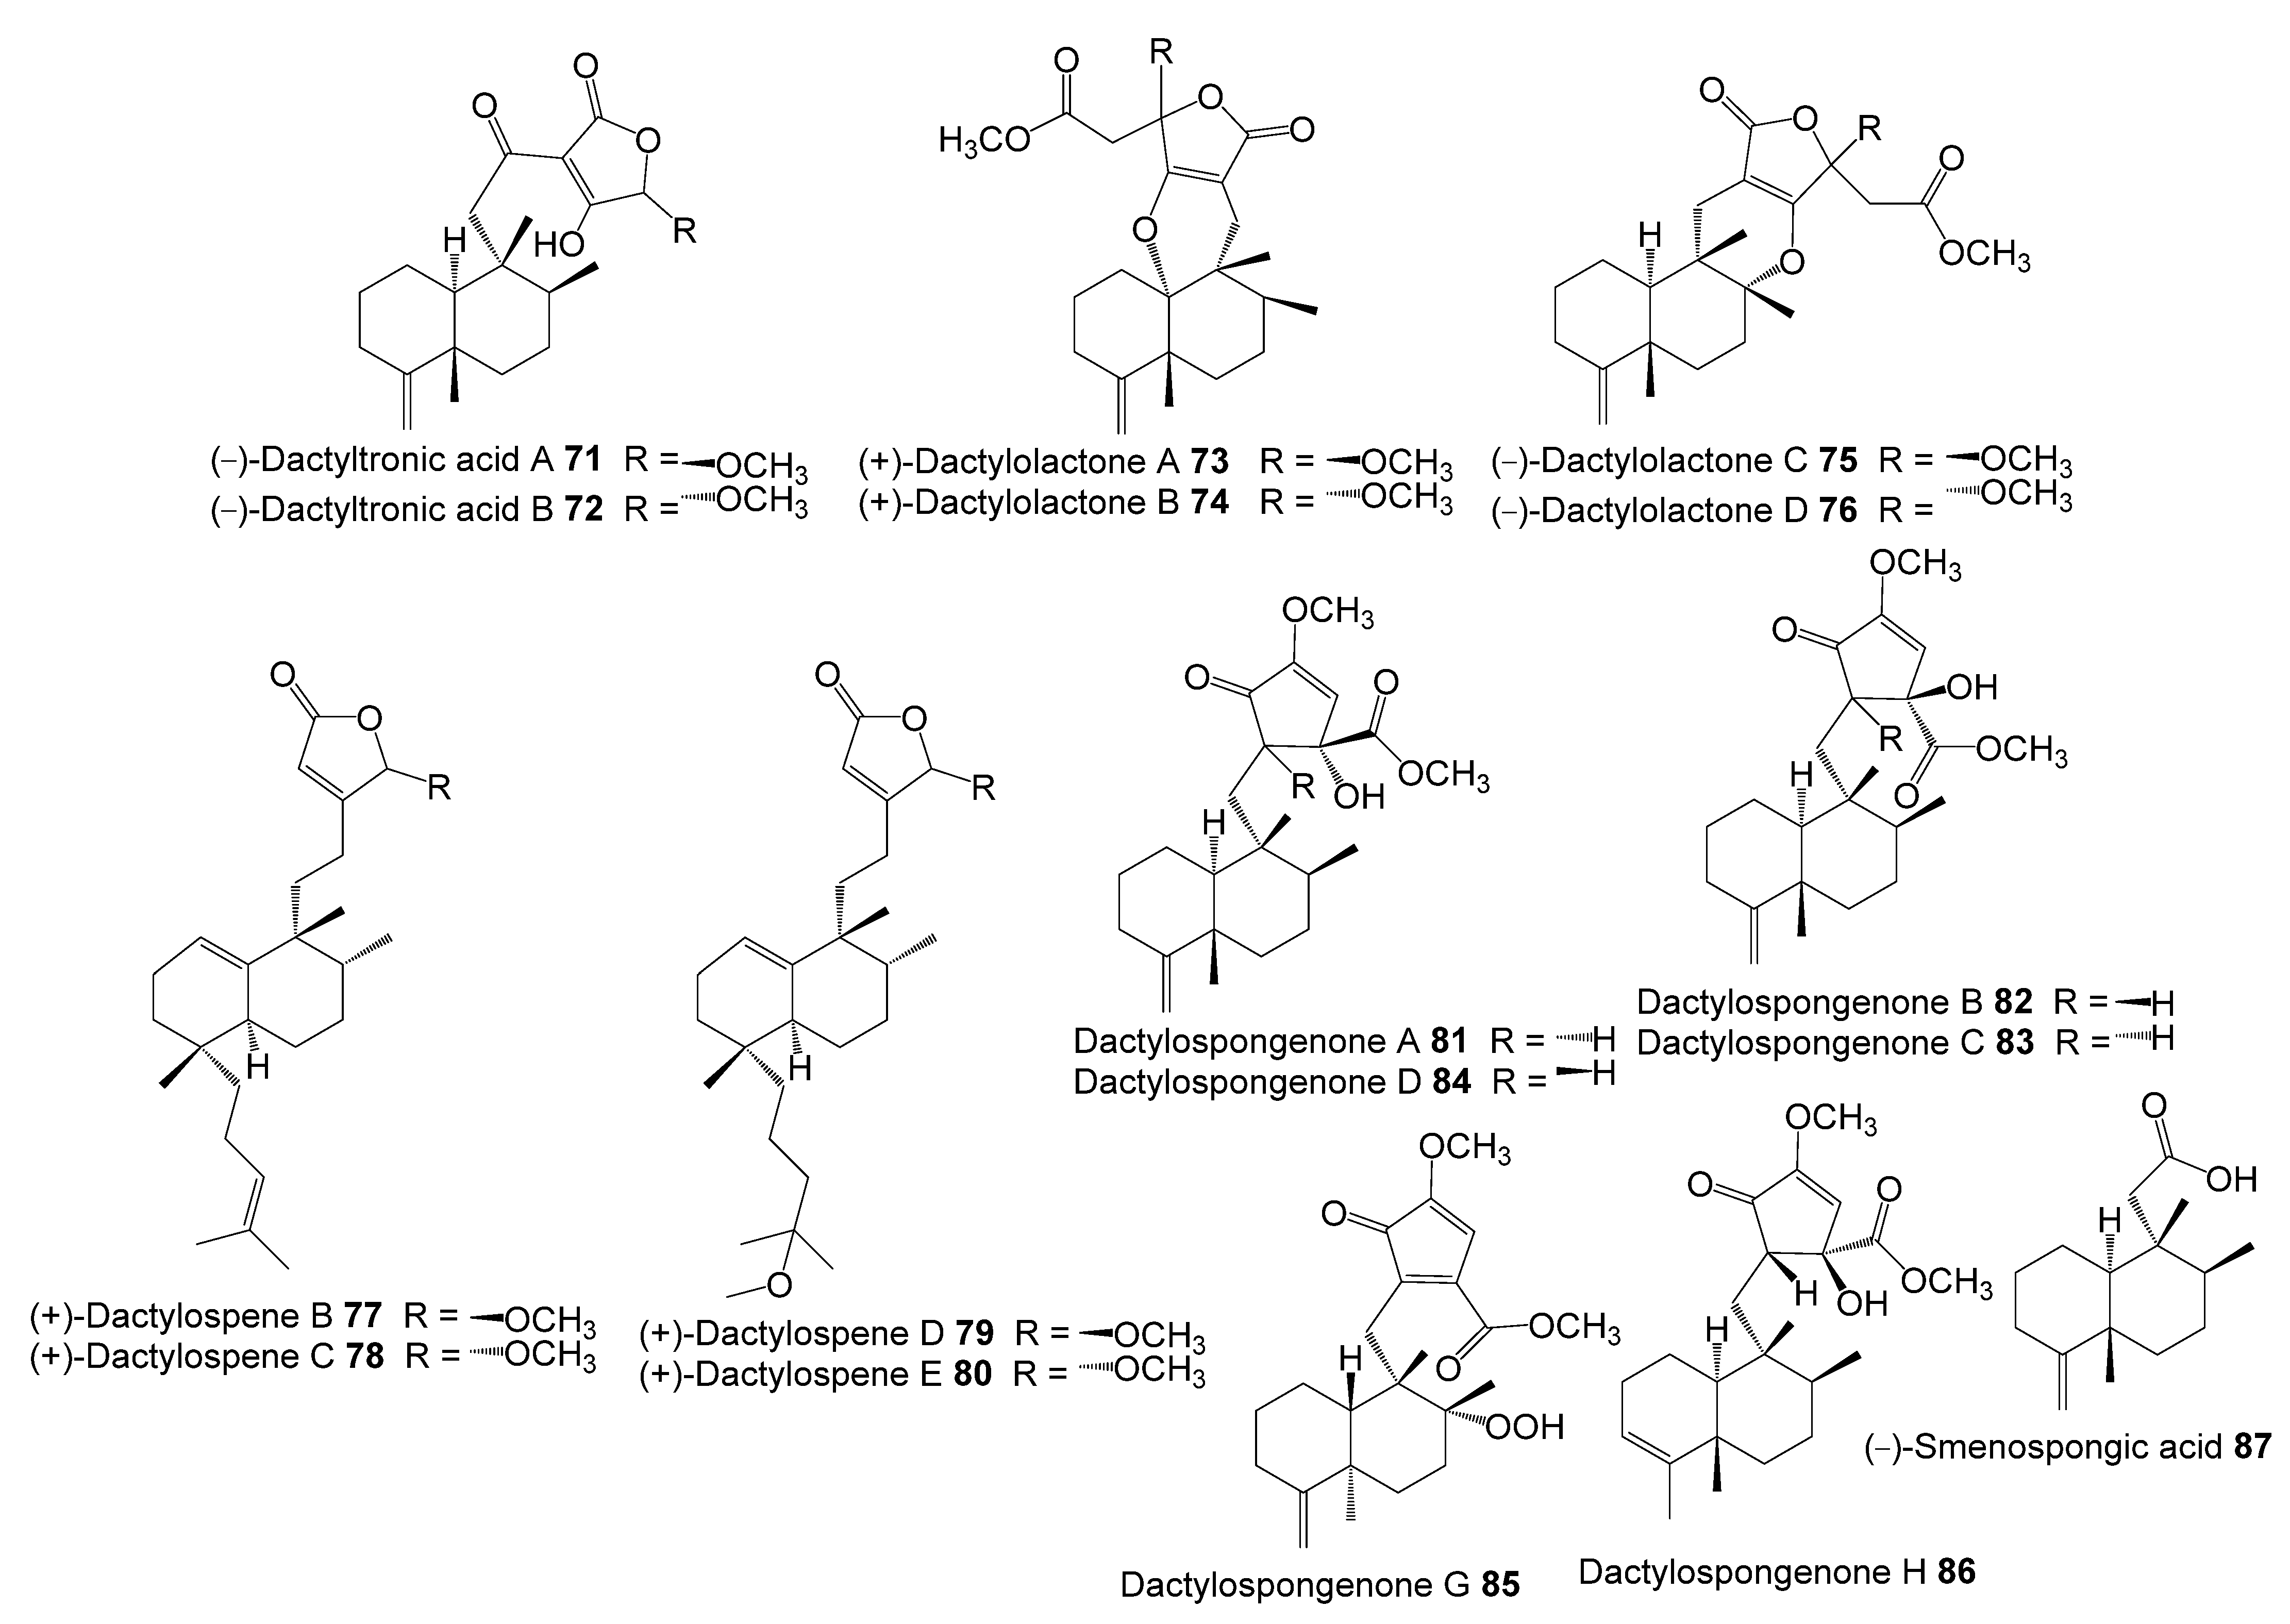
| Cytotoxicity | (−)-Ilimaquinone (1), 5-(+)-epi-ilimaquinone (2), (−)-dactyloquinone B (5), (+)-isospongiaquinone (11), mamanuthaquinone (14), hyatellaquinone (15), (+)-isohyatellaquinone (16), neomamanuthaquinone (18), 9-epi-7,8-dehydrocyclospongiaquinone-2 (20), smenospongine (25), smenospongimine (27), smenospongine b (28), smenospongine c (29), smenospongorine (30), smenospongiarine (32), 5-(+)-epi-smenospongiarine (33), smenospongidine (35), 5-(+)-epi-smenospongidine (36), isosmenospongine (39), nakijiquinone A (40), nakijiquinone B (41), nakijiquinone G (43), 5-epi-nakijiquinone Q (44), (+)-dictyoceratin A (49), (+)-19-methoxy-dictyoceratin-A (50), (+)-dictyoceratin B (51), (+)-dictyoceratin C (52), nakijinol B (65), (+)-dactylospene C (78), dactylospongenone A (81) |
| Antibacterial | (−)-ilimaquinone (1), 5-(+)-epi-ilimaquinone (2), (−)-dactyloquinone A (4), (−)-dactyloquinone B (5), (−)-dactyloquinone C (7), (−)-dactyloquinone D (8), (+)-dactyloquinone E (9), (+)-isospongiaquinone (11), smenospongine C (29), smenospongorine (30), 5-(+)-epi-smenospongidine (36), isosmenospongine (39), nakijiquinone A (40), nakijiquinone B (41), 5-epi-nakijiquinone Q (44), (+)-dictyoceratin A (49), (+)-dictyoceratin B (51), (−)-xishaeleganin C (54), (+)-xishaeleganin d (55), (−)-xishaeleganin B (57), pelorol (64), (−)-dactyltronic acid A (71), (−)-dactyltronic acid B (72), |
| Anti-inflammatory | (+)-dactylospene B (77), (+)-dactylospene C (78) |
| Antitrypanosomal | (−)-ilimaquinone (1), pelorol (64) |
| Antimalarial | (−)-ilimaquinone (1), pelorol (64) |
| β-Secretase 1 inhibition | (−)-ilimaquinone (1), smenospongine (25) |
| Compounds | PubChem CID/ChemSpider ID | XP gscore | glide gscore | Prime Energy |
|---|---|---|---|---|
| 34 | 11744241 | −12.431 | −12.431 | −7441.3 |
| 28 | 50994611 | −11.502 | −11.502 | −7452.5 |
| 44 | 31130045 * | −10.62 | −10.62 | −7460.7 |
| Ref_ SRI-9662 | −10.432 | −10.432 | −7788.8 | |
| 51 | 21681043 | −9.874 | −9.874 | −7489.4 |
| 61 | 71726095 | −9.71 | −9.71 | −7448.6 |
| 50 | - | −9.598 | −9.598 | −7483.7 |
| 84 | 10369050 * | −9.341 | −9.341 | −7458.4 |
| 65 | 50994610 | −8.932 | −8.932 | −7475 |
| 36 | - | −8.884 | −8.884 | −7459.1 |
| 30 | 101245402 | −8.755 | −8.755 | −7453.3 |
| 15 | 10361056 | −8.705 | −8.705 | −7455.7 |
| 3 | 30770979 * | −8.592 | −8.592 | −7465.9 |
| 14 | 495021 | −8.494 | −8.494 | −7475.6 |
| 52 | 21589795 | −8.42 | −8.42 | −7522.7 |
| 41 | 457734 | −8.407 | −8.407 | −7399.1 |
| 85 | 64063250 * | −8.358 | −8.358 | −7467.9 |
| 56 | - | −8.288 | −8.288 | −7546.5 |
| 2 | 21727418 | −8.256 | −8.256 | −7465.1 |
| 42 | 10071409 | −8.154 | −8.154 | −7385.6 |
| 18 | 24691897 | −7.953 | −7.953 | −7447.5 |
| 82 | 132498497 | −7.949 | −7.949 | −7431.7 |
| 80 | - | −7.881 | −7.881 | −7569.4 |
| 64 | 10067895 | −7.876 | −7.876 | −7478.7 |
| 60 | 10316629 * | −7.867 | −7.867 | −7472.2 |
| 16 | 24905924 | −7.836 | −7.836 | −7444.7 |
| 55 | - | −7.825 | −7.825 | −7459.6 |
| 35 | 14286425 | −7.816 | −7.816 | −7435.1 |
| 17 | 27023531 | −7.794 | −7.794 | −7421.4 |
| 13 | 14526059 | −7.711 | −7.711 | −7477.8 |
| 31 | - | −7.711 | −7.711 | −7426.8 |
| 43 | 24710044 * | −7.59 | −7.59 | −7373.1 |
| 57 | - | −7.58 | −7.58 | −7511.6 |
| 48 | 101605919 | −7.56 | −7.56 | −7499.8 |
| 49 | 9885835 | −7.56 | −7.56 | −7499.8 |
| 1 | 72291 | −7.5 | −7.5 | −7460.7 |
| 40 | 457733 | −7.368 | −7.368 | −7374.2 |
| 63 | 102015226 | −7.335 | −7.335 | −7514 |
| 38 | 44188455 | −7.31 | −7.31 | −7446.5 |
| 39 | - | −7.211 | −7.211 | −7435.4 |
| 33 | 21727419 | −7.208 | −7.208 | −7445.6 |
| 23 | - | −7.147 | −7.147 | −7460.2 |
| 62 | 189164 | −7.136 | −7.136 | −7520.3 |
| 79 | - | −7.116 | −7.116 | −7556.1 |
| 22 | 23424798 | −7.071 | −7.071 | −7443 |
| 21 | 25211413 | −7.062 | −7.062 | −7463.5 |
| 6 | - | −6.942 | −6.942 | −7423.3 |
| 83 | 132498496 | −6.719 | −6.719 | −7459.3 |
| 25 | 3081931 | −6.583 | −6.583 | −7467.6 |
| 26 | 10617363 | −6.567 | −6.567 | −7469.5 |
| 77 | - | −6.54 | −6.54 | −7545.1 |
| 78 | - | −6.316 | −6.316 | −7553.1 |
| 76 | 11811553 | −6.303 | −6.303 | −7523.8 |
| 54 | - | −6.274 | −6.274 | −7479.5 |
| 5 | 10915278 | −6.194 | −6.194 | −7435.8 |
| 53 | 9977451 | −6.145 | −6.145 | −7486.6 |
| 9 | 12972982 | −6.101 | −6.101 | −7439 |
| 70 | 65790999 * | −6.055 | −6.055 | −7459.8 |
| 29 | 50994612 | −5.927 | −5.927 | −7442 |
| 32 | 10313302 * | −5.704 | −5.704 | −7450.8 |
| 4 | 11035675 | −5.579 | −5.579 | −7423.7 |
| 20 | 27023533 * | −5.371 | −5.371 | −7440.4 |
| 24 | - | −5.314 | −5.314 | −7422.7 |
| 75 | 11090757 | −5.228 | −5.228 | −7534.9 |
| 7 | 12972980 | −5.134 | −5.134 | −7462.2 |
| 81 | 102284910 | −5.034 | −5.034 | −7436.4 |
| 10 | 637868 | −4.462 | −4.462 | −7442.6 |
| 37 | 73930387 * | −4.239 | −4.239 | −7446.9 |
| 45 | 132606991 | −3.689 | −3.689 | −7417.7 |
| 12 | 10066979 | −3.676 | −3.676 | −7363 |
| 46 | 132606990 | −3.433 | −3.433 | −7414.9 |
| 47 | 107805883 * | −3.308 | −3.308 | −7429.9 |
| 27 | 132578684 | −3.139 | −3.139 | −7406.7 |
| 8 | 12972981 | −3.13 | −3.13 | −7439.4 |
| 58 | 10316627 * | −2.619 | −2.619 | −7455.7 |
| 73 | 10873154 | −2.199 | −2.199 | −7530 |
| 74 | 11014966 | −0.852 | −0.852 | −7471.3 |
| 72 | - | −0.122 | −0.122 | −7578.1 |
| 71 | 54729714 | 0.84 | 0.84 | −7579.9 |
| Molecule | mol_MW | #Stars | #rtvFG | CNS | SASA | donorHB | accptHB | QPlogPo/w | QPlogHERG | QPPCaco | QPlogBB | #metab | QPlogKhsa | Percent HumanOral Absorption |
|---|---|---|---|---|---|---|---|---|---|---|---|---|---|---|
| Recommended Range | (130–725) | (0.0–5.0) | (0–2) | (−2 Inactive) (+2 Active) | (300–1000) | (0–6) | (2.0–20.0) | (−2–6.5) | Concern Below −5 | <25 Poor, >500 Great | (−3–1.2) | (1–8) | (−1.5–1.5) | (<25% Poor; >80% High) |
| 1 | 358.48 | 0.00 | 2.00 | 0.00 | 590.81 | 1.00 | 5.50 | 3.46 | −3.66 | 1182.68 | −0.51 | 4.00 | 0.46 | 100.00 |
| 2 | 358.48 | 0.00 | 2.00 | 0.00 | 587.02 | 1.00 | 5.50 | 3.40 | −3.59 | 1076.04 | −0.54 | 4.00 | 0.45 | 100.00 |
| 3 | 358.48 | 0.00 | 2.00 | 0.00 | 603.35 | 1.00 | 5.50 | 3.45 | −3.87 | 902.98 | −0.64 | 4.00 | 0.49 | 100.00 |
| 4 | 356.46 | 1.00 | 0.00 | 0.00 | 573.09 | 0.00 | 5.50 | 3.29 | −3.50 | 1942.90 | −0.12 | 3.00 | 0.27 | 100.00 |
| 5 | 356.46 | 1.00 | 0.00 | 0.00 | 567.60 | 0.00 | 5.50 | 3.23 | −3.38 | 1659.36 | −0.17 | 3.00 | 0.27 | 100.00 |
| 6 | 356.46 | 1.00 | 0.00 | 0.00 | 575.08 | 0.00 | 5.50 | 3.26 | −3.56 | 1778.31 | −0.16 | 3.00 | 0.27 | 100.00 |
| 7 | 356.46 | 1.00 | 0.00 | 0.00 | 570.26 | 0.00 | 5.50 | 3.26 | −3.50 | 1751.98 | −0.15 | 3.00 | 0.27 | 100.00 |
| 8 | 356.46 | 1.00 | 0.00 | 0.00 | 582.17 | 0.00 | 5.50 | 3.30 | −3.66 | 1521.91 | −0.22 | 3.00 | 0.31 | 100.00 |
| 9 | 356.46 | 1.00 | 0.00 | 0.00 | 567.44 | 0.00 | 5.50 | 3.24 | −3.32 | 1484.16 | −0.20 | 3.00 | 0.29 | 100.00 |
| 10 | 356.46 | 1.00 | 0.00 | 0.00 | 587.87 | 0.00 | 5.50 | 3.29 | −3.78 | 1451.01 | −0.26 | 3.00 | 0.31 | 100.00 |
| 11 | 358.48 | 0.00 | 2.00 | 0.00 | 593.80 | 1.00 | 5.50 | 3.46 | −3.75 | 1173.47 | −0.52 | 5.00 | 0.46 | 100.00 |
| 12 | 358.48 | 0.00 | 2.00 | −1.00 | 621.90 | 1.00 | 5.50 | 3.47 | −4.21 | 737.72 | −0.77 | 5.00 | 0.52 | 100.00 |
| 13 | 358.48 | 0.00 | 2.00 | −1.00 | 609.27 | 1.00 | 5.50 | 3.39 | −3.85 | 768.06 | −0.72 | 3.00 | 0.50 | 100.00 |
| 14 | 358.48 | 0.00 | 2.00 | 0.00 | 604.81 | 1.00 | 5.50 | 3.53 | −3.78 | 1069.35 | −0.57 | 5.00 | 0.51 | 100.00 |
| 15 | 358.48 | 0.00 | 2.00 | −1.00 | 620.06 | 1.00 | 5.50 | 3.45 | −4.10 | 701.23 | −0.78 | 5.00 | 0.52 | 100.00 |
| 16 | 358.48 | 0.00 | 2.00 | −1.00 | 607.51 | 1.00 | 5.50 | 3.43 | −3.91 | 760.42 | −0.71 | 6.00 | 0.50 | 100.00 |
| 17 | 358.48 | 0.00 | 2.00 | −1.00 | 607.82 | 1.00 | 5.50 | 3.42 | −3.93 | 749.67 | −0.72 | 6.00 | 0.50 | 100.00 |
| 18 | 344.45 | 0.00 | 2.00 | −1.00 | 613.23 | 1.00 | 5.50 | 3.30 | −4.02 | 715.47 | −0.77 | 6.00 | 0.46 | 100.00 |
| 19 | 356.46 | 1.00 | 0.00 | 0.00 | 598.49 | 0.00 | 5.50 | 3.34 | −3.94 | 1279.73 | −0.32 | 4.00 | 0.35 | 100.00 |
| 20 | 356.46 | 1.00 | 0.00 | 0.00 | 598.60 | 0.00 | 5.50 | 3.38 | −3.90 | 1348.28 | −0.30 | 4.00 | 0.36 | 100.00 |
| 21 | 358.48 | 1.00 | 0.00 | 0.00 | 595.10 | 0.00 | 5.50 | 3.30 | −3.72 | 1200.63 | −0.34 | 2.00 | 0.35 | 100.00 |
| 22 | 358.48 | 1.00 | 0.00 | 0.00 | 596.11 | 0.00 | 5.50 | 3.33 | −3.74 | 1332.29 | −0.30 | 2.00 | 0.36 | 100.00 |
| 23 | 358.48 | 0.00 | 2.00 | 0.00 | 603.69 | 1.00 | 5.50 | 3.40 | −3.76 | 861.92 | −0.66 | 3.00 | 0.49 | 100.00 |
| 24 | 356.46 | 1.00 | 0.00 | 0.00 | 572.49 | 0.00 | 5.50 | 3.24 | −3.41 | 1899.93 | −0.13 | 2.00 | 0.27 | 100.00 |
| 25 | 343.47 | 0.00 | 2.00 | −1.00 | 569.45 | 2.50 | 5.75 | 2.50 | −3.62 | 347.02 | −0.96 | 4.00 | 0.27 | 87.04 |
| 26 | 343.47 | 0.00 | 2.00 | −1.00 | 561.62 | 2.50 | 5.75 | 2.43 | −3.46 | 314.54 | −0.98 | 4.00 | 0.26 | 85.85 |
| 27 | 357.49 | 0.00 | 2.00 | 0.00 | 605.48 | 2.00 | 5.75 | 3.23 | −3.86 | 834.01 | −0.67 | 5.00 | 0.44 | 100.00 |
| 28 | 401.50 | 0.00 | 0.00 | −2.00 | 647.79 | 3.00 | 7.75 | 2.60 | −2.32 | 23.48 | −1.76 | 6.00 | 0.02 | 66.70 |
| 29 | 415.53 | 0.00 | 2.00 | −2.00 | 687.22 | 2.00 | 6.75 | 3.68 | −2.66 | 24.51 | −1.88 | 6.00 | 0.34 | 73.34 |
| 30 | 399.57 | 0.00 | 0.00 | −1.00 | 697.89 | 2.00 | 4.50 | 4.94 | −4.54 | 1304.45 | −0.75 | 4.00 | 0.97 | 100.00 |
| 31 | 399.57 | 0.00 | 0.00 | −1.00 | 665.46 | 2.00 | 4.50 | 4.80 | −4.02 | 1148.84 | −0.74 | 4.00 | 0.93 | 100.00 |
| 32 | 413.60 | 0.00 | 0.00 | −1.00 | 724.46 | 2.00 | 4.50 | 5.26 | −4.69 | 1304.85 | −0.83 | 4.00 | 1.06 | 100.00 |
| 32 | 413.60 | 2.00 | 0.00 | −1.00 | 732.98 | 2.00 | 4.50 | 5.27 | −4.80 | 1146.67 | −0.91 | 4.00 | 1.08 | 100.00 |
| 33 | 413.60 | 0.00 | 0.00 | −1.00 | 712.20 | 2.00 | 4.50 | 5.25 | −4.54 | 1450.92 | −0.76 | 4.00 | 1.05 | 100.00 |
| 34 | 445.56 | 0.00 | 0.00 | −2.00 | 649.73 | 3.00 | 7.20 | 3.39 | −1.74 | 27.35 | −1.73 | 6.00 | 0.22 | 72.53 |
| 35 | 447.62 | 0.00 | 2.00 | −1.00 | 750.39 | 1.00 | 7.00 | 4.95 | −5.55 | 1120.27 | −0.79 | 5.00 | 0.88 | 100.00 |
| 36 | 447.62 | 0.00 | 2.00 | −1.00 | 738.69 | 1.00 | 7.00 | 4.90 | −5.31 | 959.48 | −0.82 | 5.00 | 0.89 | 100.00 |
| 37 | 437.58 | 0.00 | 2.00 | −2.00 | 733.50 | 3.00 | 7.25 | 3.79 | −5.31 | 363.49 | −1.37 | 6.00 | 0.58 | 94.97 |
| 38 | 343.47 | 0.00 | 2.00 | −2.00 | 597.78 | 2.50 | 5.75 | 2.48 | −4.13 | 216.02 | −1.25 | 5.00 | 0.30 | 83.25 |
| 39 | 343.47 | 0.00 | 2.00 | −1.00 | 569.70 | 2.50 | 5.75 | 2.49 | −3.65 | 343.89 | −0.97 | 5.00 | 0.26 | 86.93 |
| 40 | 401.50 | 0.00 | 0.00 | −2.00 | 648.04 | 3.00 | 7.75 | 2.60 | −2.35 | 23.48 | −1.76 | 7.00 | 0.02 | 66.69 |
| 41 | 443.58 | 1.00 | 0.00 | −2.00 | 712.86 | 3.00 | 7.75 | 3.79 | −2.54 | 58.16 | −1.49 | 7.00 | 0.34 | 80.71 |
| 42 | 431.53 | 0.00 | 2.00 | −2.00 | 673.74 | 3.00 | 8.45 | 2.52 | −2.39 | 11.60 | −2.19 | 8.00 | −0.02 | 60.74 |
| 43 | 437.58 | 0.00 | 2.00 | −2.00 | 728.41 | 3.00 | 7.25 | 3.60 | −5.16 | 254.87 | −1.52 | 7.00 | 0.56 | 91.10 |
| 44 | 447.62 | 1.00 | 2.00 | −1.00 | 760.65 | 1.00 | 7.00 | 4.89 | −5.82 | 772.87 | −0.98 | 6.00 | 0.89 | 100.00 |
| 45 | 355.48 | 0.00 | 0.00 | 0.00 | 605.15 | 1.00 | 4.50 | 3.86 | −4.03 | 1096.57 | −0.46 | 3.00 | 0.74 | 100.00 |
| 46 | 397.56 | 1.00 | 0.00 | 0.00 | 695.14 | 1.00 | 4.50 | 5.06 | −4.59 | 1512.13 | −0.51 | 3.00 | 1.12 | 100.00 |
| 47 | 411.58 | 1.00 | 0.00 | 0.00 | 726.02 | 1.00 | 4.50 | 5.47 | −4.86 | 1727.51 | −0.54 | 3.00 | 1.23 | 100.00 |
| 48 | 372.50 | 0.00 | 1.00 | −1.00 | 621.47 | 2.00 | 3.50 | 4.29 | −3.98 | 613.88 | −0.86 | 4.00 | 0.89 | 100.00 |
| 49 | 372.50 | 0.00 | 1.00 | −1.00 | 621.47 | 2.00 | 3.50 | 4.29 | −3.98 | 613.88 | −0.86 | 4.00 | 0.89 | 100.00 |
| 50 | 402.53 | 0.00 | 1.00 | −1.00 | 647.58 | 2.00 | 4.25 | 4.54 | −3.92 | 1026.72 | −0.72 | 5.00 | 0.89 | 100.00 |
| 51 | 388.50 | 0.00 | 1.00 | −2.00 | 653.04 | 2.00 | 3.25 | 4.34 | −4.28 | 283.29 | −1.31 | 5.00 | 0.98 | 96.23 |
| 52 | 356.50 | 0.00 | 1.00 | 0.00 | 612.17 | 1.00 | 2.75 | 5.02 | −4.10 | 1659.62 | −0.39 | 3.00 | 1.10 | 100.00 |
| 53 | 386.53 | 0.00 | 1.00 | 0.00 | 650.86 | 1.00 | 3.50 | 5.17 | −4.12 | 1806.41 | −0.44 | 4.00 | 1.13 | 100.00 |
| 54 | 372.50 | 0.00 | 0.00 | 1.00 | 600.93 | 1.00 | 3.00 | 5.10 | −3.72 | 5101.41 | 0.12 | 5.00 | 1.05 | 100.00 |
| 55 | 356.50 | 0.00 | 0.00 | 0.00 | 617.64 | 1.00 | 2.25 | 5.33 | −3.98 | 3852.76 | −0.01 | 5.00 | 1.21 | 100.00 |
| 56 | 386.53 | 2.00 | 1.00 | −2.00 | 824.22 | 1.00 | 3.50 | 6.38 | −5.91 | 1254.62 | −1.22 | 11.00 | 1.43 | 100.00 |
| 57 | 390.52 | 0.00 | 1.00 | −2.00 | 671.57 | 3.00 | 4.25 | 3.88 | −4.50 | 304.62 | −1.33 | 4.00 | 0.76 | 94.12 |
| 58 | 372.50 | 0.00 | 1.00 | −2.00 | 663.72 | 2.00 | 3.50 | 4.42 | −4.62 | 458.92 | −1.09 | 6.00 | 0.97 | 100.00 |
| 59 | 356.50 | 1.00 | 1.00 | 0.00 | 652.58 | 1.00 | 2.75 | 5.16 | −4.72 | 1254.20 | −0.58 | 5.00 | 1.20 | 100.00 |
| 60 | 388.50 | 0.00 | 1.00 | −2.00 | 670.71 | 2.00 | 3.25 | 4.39 | −4.54 | 239.87 | −1.44 | 7.00 | 1.02 | 95.22 |
| 61 | 388.50 | 1.00 | 1.00 | −1.00 | 659.93 | 1.00 | 3.25 | 4.69 | −4.40 | 510.35 | −0.91 | 3.00 | 1.19 | 100.00 |
| 62 | 314.47 | 1.00 | 0.00 | 1.00 | 559.04 | 1.00 | 1.50 | 4.90 | −4.01 | 3001.20 | 0.04 | 2.00 | 1.11 | 100.00 |
| 63 | 314.47 | 2.00 | 0.00 | 1.00 | 563.25 | 1.00 | 1.50 | 4.90 | −4.04 | 3001.81 | 0.03 | 2.00 | 1.11 | 100.00 |
| 64 | 372.50 | 0.00 | 1.00 | −1.00 | 627.45 | 2.00 | 3.50 | 4.18 | −4.07 | 621.36 | −0.77 | 3.00 | 0.93 | 100.00 |
| 65 | 355.48 | 1.00 | 0.00 | 0.00 | 569.69 | 2.00 | 3.50 | 3.91 | −3.82 | 1051.25 | −0.53 | 5.00 | 0.67 | 100.00 |
| 66 | 623.92 | 4.00 | 0.00 | 0.00 | 896.54 | 2.00 | 5.25 | 8.42 | −5.21 | 1691.25 | −0.66 | 8.00 | 2.37 | 100.00 |
| 67 | 623.92 | 5.00 | 0.00 | −1.00 | 906.24 | 2.00 | 5.25 | 8.43 | −5.35 | 1545.04 | −0.71 | 9.00 | 2.38 | 100.00 |
| 68 | 624.90 | 4.00 | 0.00 | 0.00 | 761.51 | 1.00 | 5.25 | 7.56 | −3.60 | 1130.21 | −0.65 | 7.00 | 2.07 | 100.00 |
| 69 | 623.92 | 4.00 | 0.00 | 0.00 | 896.54 | 2.00 | 5.25 | 8.42 | −5.21 | 1691.25 | −0.66 | 8.00 | 2.37 | 100.00 |
| 70 | 623.92 | 4.00 | 0.00 | −1.00 | 905.65 | 2.00 | 5.25 | 8.43 | −5.30 | 1511.67 | −0.72 | 8.00 | 2.39 | 100.00 |
| 71 | 362.47 | 0.00 | 1.00 | −1.00 | 617.02 | 0.00 | 6.45 | 3.05 | −3.77 | 832.11 | −0.73 | 2.00 | 0.08 | 100.00 |
| 72 | 362.47 | 0.00 | 1.00 | −1.00 | 621.09 | 0.00 | 6.45 | 2.84 | −4.05 | 724.55 | −0.84 | 2.00 | 0.01 | 94.77 |
| 73 | 404.50 | 0.00 | 2.00 | 0.00 | 650.04 | 0.00 | 6.50 | 3.49 | −3.92 | 925.43 | −0.60 | 3.00 | 0.35 | 100.00 |
| 74 | 404.50 | 0.00 | 2.00 | 0.00 | 643.97 | 0.00 | 6.50 | 3.55 | −3.76 | 1033.49 | −0.53 | 3.00 | 0.36 | 100.00 |
| 75 | 404.50 | 0.00 | 2.00 | 0.00 | 656.21 | 0.00 | 6.50 | 3.53 | −4.01 | 893.31 | −0.63 | 3.00 | 0.37 | 100.00 |
| 76 | 404.50 | 0.00 | 2.00 | 0.00 | 616.22 | 0.00 | 6.50 | 3.46 | −3.36 | 1469.50 | −0.35 | 3.00 | 0.27 | 100.00 |
| 77 | 400.60 | 0.00 | 1.00 | 0.00 | 671.71 | 0.00 | 4.70 | 5.26 | −3.91 | 1954.56 | −0.51 | 6.00 | 0.93 | 100.00 |
| 78 | 400.60 | 0.00 | 1.00 | 0.00 | 691.19 | 0.00 | 4.70 | 5.44 | −4.05 | 1954.69 | −0.53 | 6.00 | 1.02 | 100.00 |
| 79 | 432.64 | 0.00 | 1.00 | 0.00 | 718.22 | 0.00 | 5.45 | 5.47 | −4.13 | 1939.73 | −0.66 | 4.00 | 0.91 | 100.00 |
| 80 | 432.64 | 0.00 | 1.00 | 0.00 | 750.60 | 0.00 | 5.45 | 5.72 | −4.49 | 1950.56 | −0.70 | 4.00 | 1.03 | 100.00 |
| 81 | 390.52 | 0.00 | 0.00 | 0.00 | 653.42 | 1.00 | 5.50 | 4.27 | −4.18 | 1628.90 | −0.49 | 4.00 | 0.71 | 100.00 |
| 82 | 390.52 | 0.00 | 0.00 | 0.00 | 634.28 | 1.00 | 5.50 | 4.08 | −3.84 | 1090.57 | −0.62 | 4.00 | 0.69 | 100.00 |
| 83 | 390.52 | 0.00 | 0.00 | 0.00 | 618.00 | 1.00 | 5.50 | 4.05 | −3.47 | 1475.16 | −0.47 | 4.00 | 0.66 | 100.00 |
| 84 | 390.52 | 0.00 | 0.00 | 0.00 | 601.76 | 1.00 | 5.50 | 3.92 | −3.22 | 1276.69 | −0.50 | 4.00 | 0.62 | 100.00 |
| 85 | 404.50 | 1.00 | 1.00 | 0.00 | 640.06 | 1.00 | 7.20 | 3.48 | −3.99 | 1408.26 | −0.59 | 3.00 | 0.32 | 100.00 |
| 86 | 390.52 | 0.00 | 0.00 | 0.00 | 686.36 | 1.00 | 5.50 | 4.45 | −4.67 | 1597.54 | −0.56 | 5.00 | 0.78 | 100.00 |
| 87 | 250.38 | 1.00 | 0.00 | −1.00 | 476.68 | 1.00 | 2.00 | 3.84 | −1.14 | 441.09 | −0.18 | 2.00 | 0.34 | 96.78 |
Disclaimer/Publisher’s Note: The statements, opinions and data contained in all publications are solely those of the individual author(s) and contributor(s) and not of MDPI and/or the editor(s). MDPI and/or the editor(s) disclaim responsibility for any injury to people or property resulting from any ideas, methods, instructions or products referred to in the content. |
© 2023 by the authors. Licensee MDPI, Basel, Switzerland. This article is an open access article distributed under the terms and conditions of the Creative Commons Attribution (CC BY) license (https://creativecommons.org/licenses/by/4.0/).
Share and Cite
Omar, A.M.; Mohammad, K.A.; Sindi, I.A.; Mohamed, G.A.; Ibrahim, S.R.M. Unveiling the Efficacy of Sesquiterpenes from Marine Sponge Dactylospongia elegans in Inhibiting Dihydrofolate Reductase Using Docking and Molecular Dynamic Studies. Molecules 2023, 28, 1292. https://doi.org/10.3390/molecules28031292
Omar AM, Mohammad KA, Sindi IA, Mohamed GA, Ibrahim SRM. Unveiling the Efficacy of Sesquiterpenes from Marine Sponge Dactylospongia elegans in Inhibiting Dihydrofolate Reductase Using Docking and Molecular Dynamic Studies. Molecules. 2023; 28(3):1292. https://doi.org/10.3390/molecules28031292
Chicago/Turabian StyleOmar, Abdelsattar M., Khadijah A. Mohammad, Ikhlas A. Sindi, Gamal A. Mohamed, and Sabrin R. M. Ibrahim. 2023. "Unveiling the Efficacy of Sesquiterpenes from Marine Sponge Dactylospongia elegans in Inhibiting Dihydrofolate Reductase Using Docking and Molecular Dynamic Studies" Molecules 28, no. 3: 1292. https://doi.org/10.3390/molecules28031292
APA StyleOmar, A. M., Mohammad, K. A., Sindi, I. A., Mohamed, G. A., & Ibrahim, S. R. M. (2023). Unveiling the Efficacy of Sesquiterpenes from Marine Sponge Dactylospongia elegans in Inhibiting Dihydrofolate Reductase Using Docking and Molecular Dynamic Studies. Molecules, 28(3), 1292. https://doi.org/10.3390/molecules28031292