
Per- and Poly-Fluoroalkyl Substances in Portuguese Rivers: Spatial-Temporal Monitoring

 ,
,  ,
,  ,
,  ,
, 

Abstract
1. Introduction
2. Results and Discussion
2.1. Seasonal Variation and Distribution of PFASs
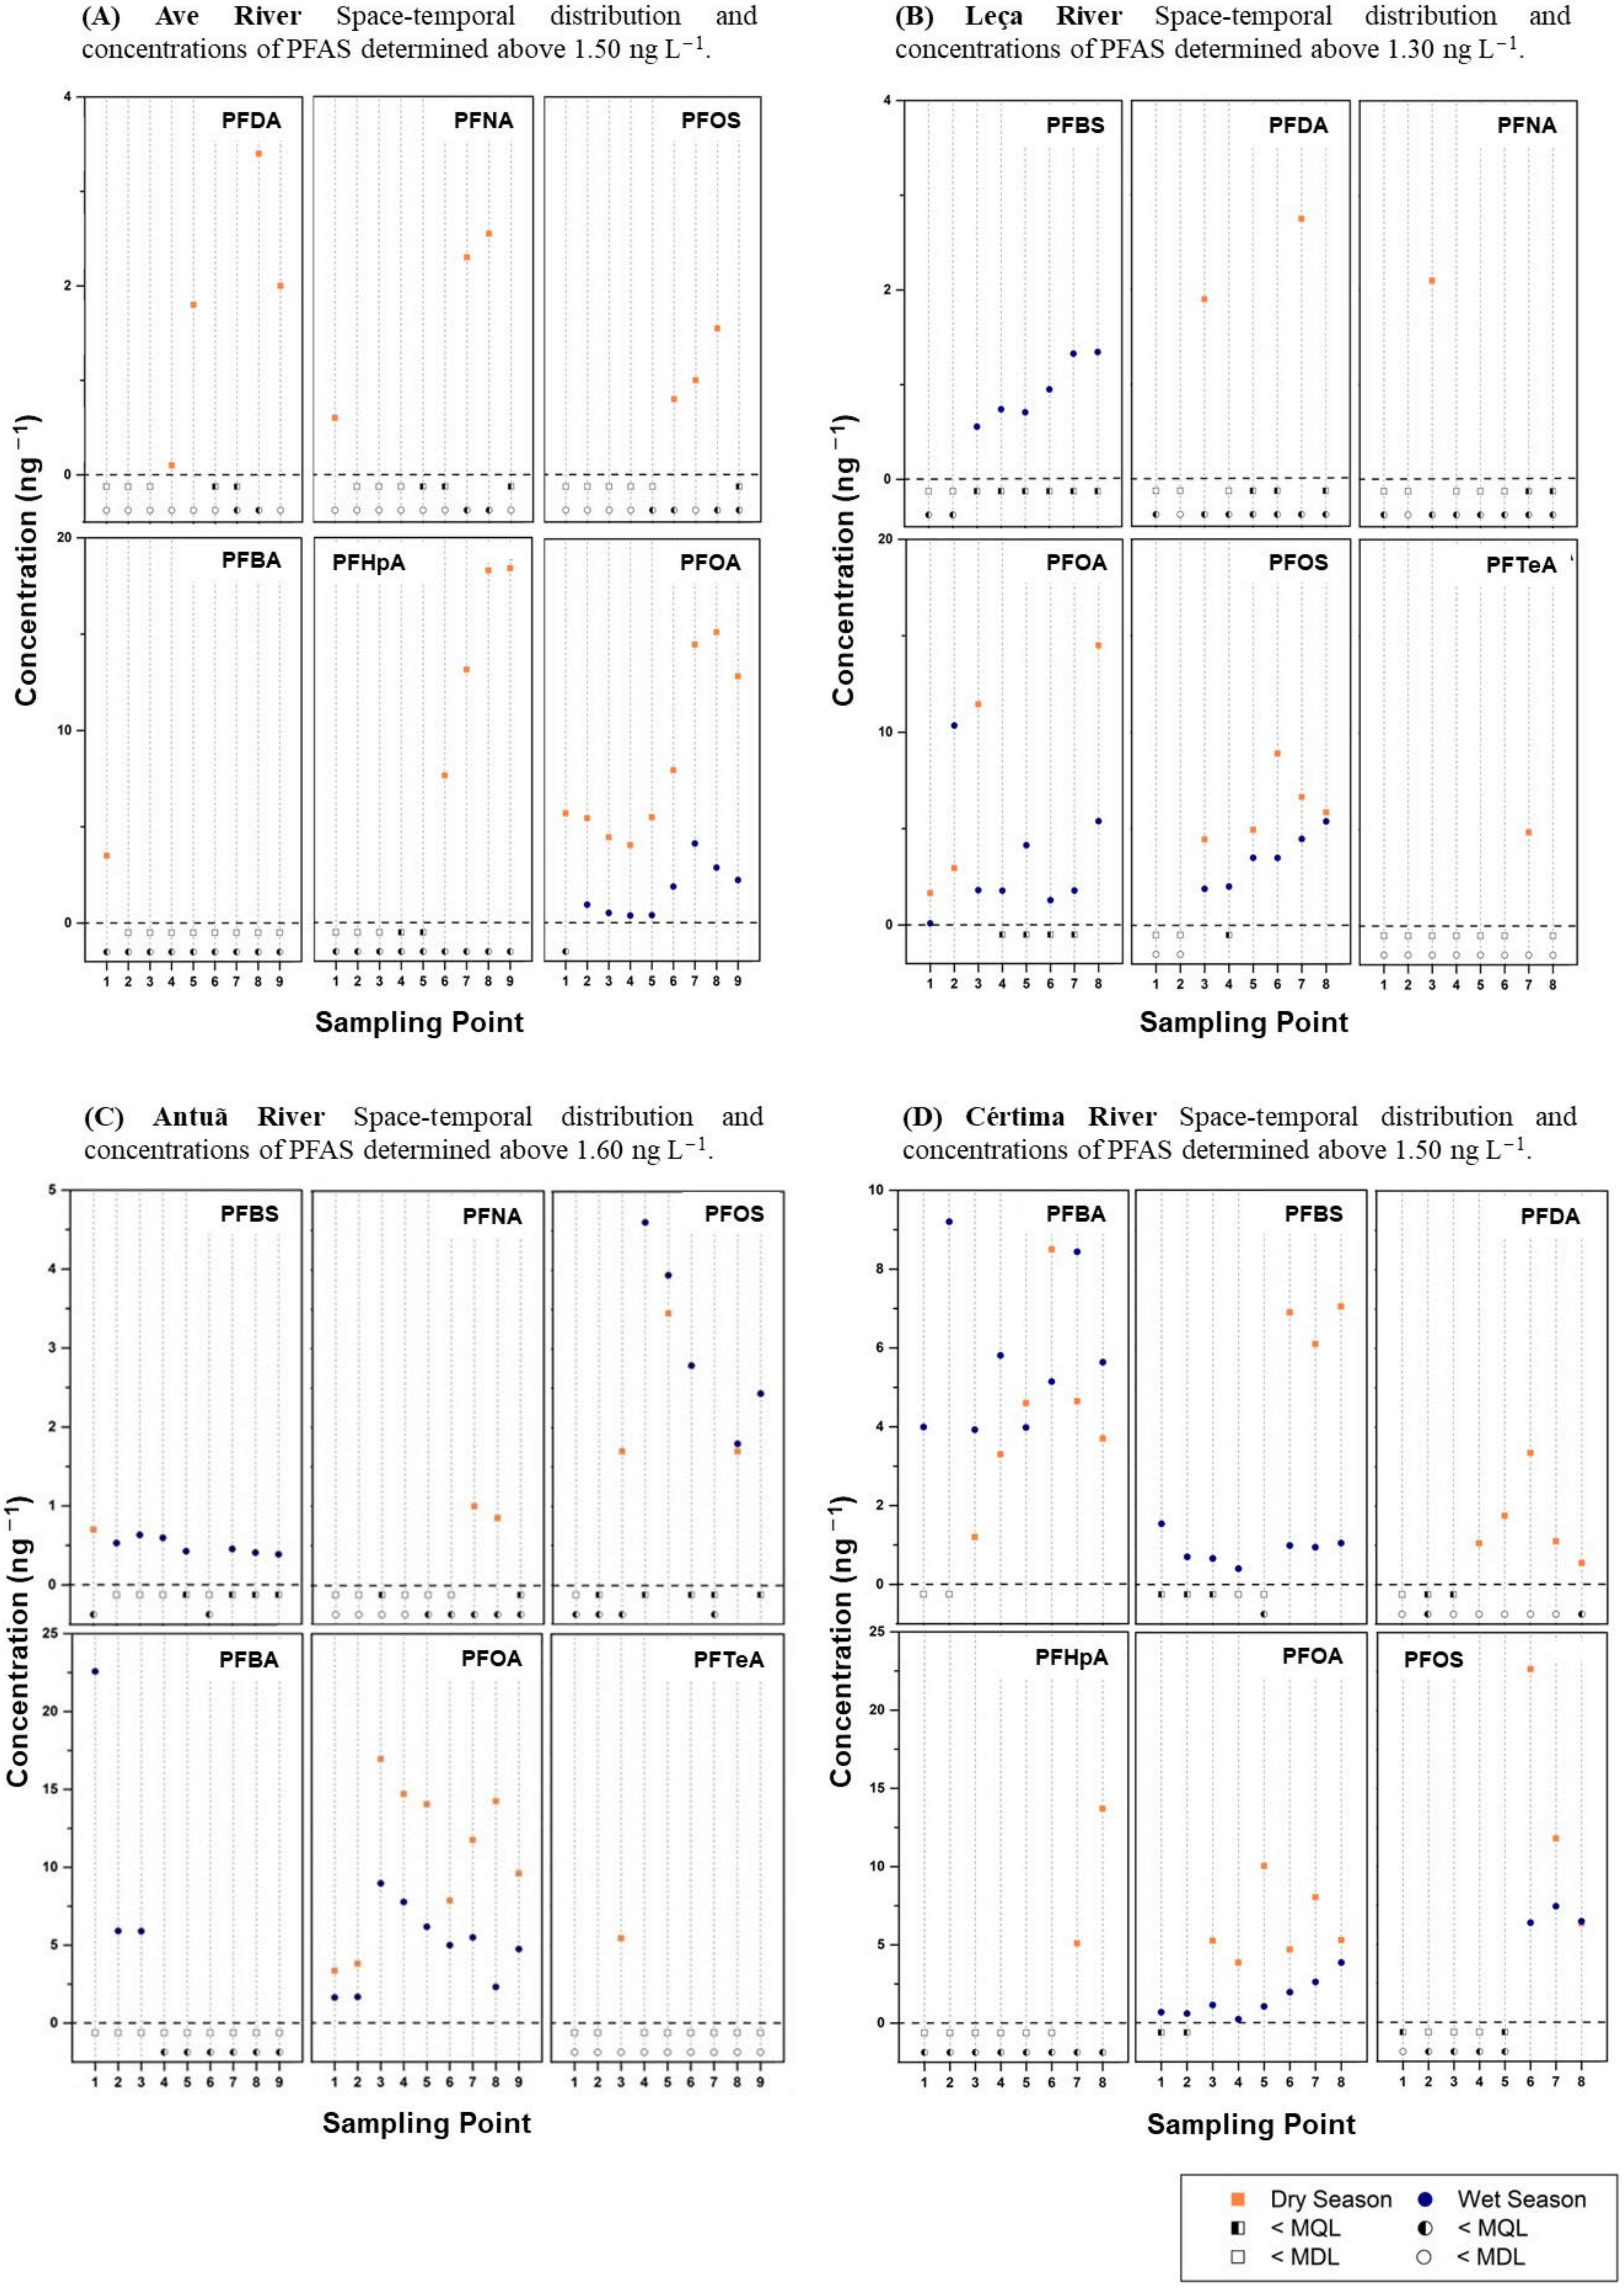
2.1.1. Ave River
2.1.2. Leça River
2.1.3. Antuã River
2.1.4. Cértima River
2.2. Ecological Risk Assessment of PFASs in the Rivers in Portugal
2.3. Occurrence of Target PFASs in European SWs
3. Materials and Methods
3.1. Chemicals and Materials
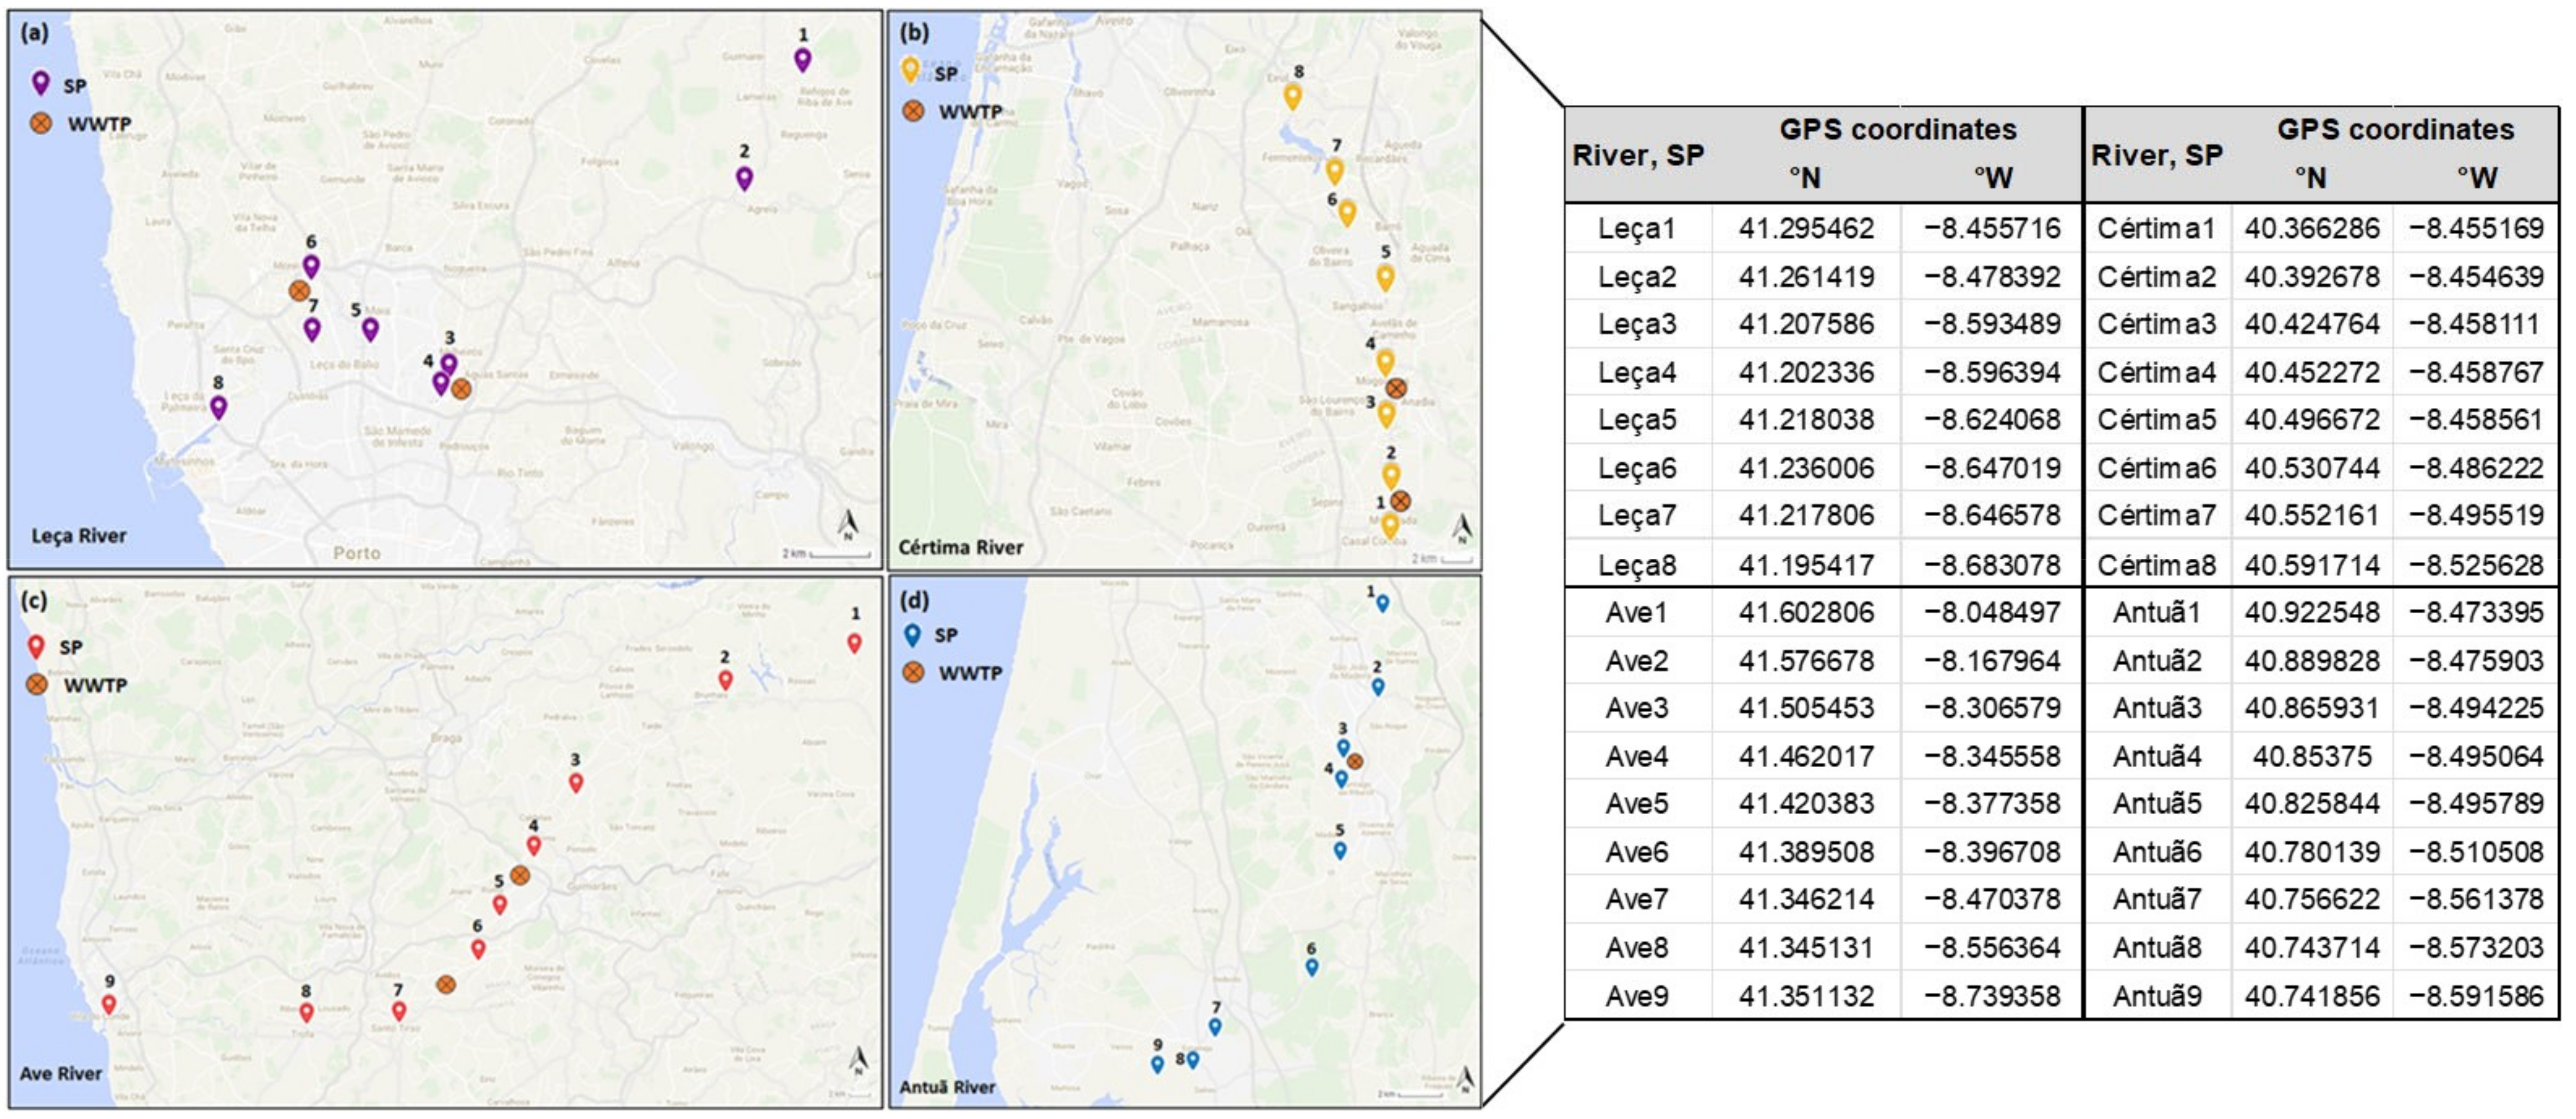
3.2. Sampling Area, Collection and Preparation
3.3. Analysis by LC-MS/MS
3.4. Ecological Risk Assessment
4. Conclusions
Supplementary Materials
Author Contributions
Funding
Institutional Review Board Statement
Informed Consent Statement
Data Availability Statement
Acknowledgments
Conflicts of Interest
References
- Pramanik, B.K. Occurrence of perfluoroalkyl and polyfluoroalkyl substances in the water environment and their removal in a water treatment process. J. Water Reuse Desalination 2015, 5, 196–210. [Google Scholar] [CrossRef]
- Rahman, M.F.; Peldszus, S.; Anderson, W.B. Behaviour and fate of perfluoroalkyl and polyfluoroalkyl substances (PFASs) in drinking water treatment: A review. Water Res. 2014, 50, 318–340. [Google Scholar] [CrossRef] [PubMed]
- Cui, D.; Li, X.; Quinete, N. Occurrence, fate, sources and toxicity of PFAS: What we know so far in Florida and major gaps. TrAC Trends Anal. Chem. 2020, 130, 115976. [Google Scholar] [CrossRef]
- Abunada, Z.; Alazaiza, M.Y.D.; Bashir, M.J.K. An Overview of Per- and Polyfluoroalkyl Substances (PFAS) in the Environment: Source, Fate, Risk and Regulations. Water 2020, 12, 3590. [Google Scholar] [CrossRef]
- Crone, B.C.; Speth, T.F.; Wahman, D.G.; Smith, S.J.; Abulikemu, G.; Kleiner, E.J.; Pressman, J.G. Occurrence of Per- and Polyfluoroalkyl Substances (PFAS) in Source Water and Their Treatment in Drinking Water. Crit. Rev. Environ. Sci. Technol. 2019, 49, 2359–2396. [Google Scholar] [CrossRef]
- SC-4/17; Stockholm_Convention, Report of the Persistent Organic Pollutants Review Committee on the Work of Its Fourth Meeting—Addendum to the Risk Management Evaluation for Perfluorooctane Sulfonate. United Nations Environment Programme: Nairobi, Kenya, 2008.
- UNEP/POPS/POPRC.14/6/Add.2; Stockholm_Convention, Report of the Persistent Organic Pollutants Review Committee on the Work of Its Fourteenth Meeting—Addendum to the Risk Management Evaluation on Perfluorooctanoic Acid (PFOA), Its Salts and PFOA-Related Compounds. United Nations Environment Programme: Nairobi, Kenya, 2018.
- Schulz, K.; Silva, M.R.; Klaper, R. Distribution and effects of branched versus linear isomers of PFOA, PFOS, and PFHxS: A review of recent literature. Sci. Total Environ. 2020, 733, 139186. [Google Scholar] [CrossRef]
- Sinclair, G.M.; Long, S.M.; Jones, O.A.H. What are the effects of PFAS exposure at environmentally relevant concentrations? Chemosphere 2020, 258, 127340. [Google Scholar] [CrossRef]
- Steenland, K.; Winquist, A. PFAS and cancer, a scoping review of the epidemiologic evidence. Environ. Res. 2021, 194, 110690. [Google Scholar] [CrossRef]
- Liu, W.; Wu, J.; He, W.; Xu, F. A review on perfluoroalkyl acids studies: Environmental behaviors, toxic effects, and ecological and health risks. Ecosyst. Health Sustain. 2019, 5, 1–19. [Google Scholar] [CrossRef]
- Barbosa, M.O.; Ribeiro, A.R.; Pereira, M.F.R.; Silva, A.M.T. Eco-friendly LC–MS/MS method for analysis of multi-class micropollutants in tap, fountain, and well water from northern Portugal. Anal. Bioanal. Chem. 2016, 408, 8355–8367. [Google Scholar] [CrossRef]
- Becker, A.M.; Gerstmann, S.; Frank, H. Perfluorooctanoic acid and perfluorooctane sulfonate in the sediment of the Roter Main river, Bayreuth, Germany. Environ. Pollut. 2008, 156, 818–820. [Google Scholar] [CrossRef]
- Jiang, J.-J.; Okvitasari, A.R.; Huang, F.-Y.; Tsai, C.-S. Characteristics, pollution patterns and risks of Perfluoroalkyl substances in drinking water sources of Taiwan. Chemosphere 2021, 264, 128579. [Google Scholar] [CrossRef]
- Guardian, M.G.E.; Boongaling, E.G.; Bernardo-Boongaling, V.R.R.; Gamonchuang, J.; Boontongto, T.; Burakham, R.; Arnnok, P.; Aga, D.S. Prevalence of per- and polyfluoroalkyl substances (PFASs) in drinking and source water from two Asian countries. Chemosphere 2020, 256, 127115. [Google Scholar] [CrossRef]
- Xiao, S.-K.; Wu, Q.; Pan, C.-G.; Yin, C.; Wang, Y.-H.; Yu, K.-F. Distribution, partitioning behavior and potential source of legacy and alternative per- and polyfluoroalkyl substances (PFASs) in water and sediments from a subtropical Gulf, South China Sea. Environ. Res. 2021, 201, 111485. [Google Scholar] [CrossRef]
- Baluyot, J.C.; Reyes, E.M.; Velarde, M.C. Per- and polyfluoroalkyl substances (PFAS) as contaminants of emerging concern in Asia’s freshwater resources. Environ. Res. 2021, 197, 111122. [Google Scholar] [CrossRef]
- Goodrow, S.M.; Ruppel, B.; Lippincott, R.L.; Post, G.B.; Procopio, N.A. Investigation of levels of perfluoroalkyl substances in surface water, sediment and fish tissue in New Jersey, USA. Sci. Total Environ. 2020, 729, 138839. [Google Scholar] [CrossRef]
- Chen, C.-E.; Yang, Y.-Y.; Zhao, J.-L.; Liu, Y.-S.; Hu, L.-X.; Li, B.-B.; Li, C.-L.; Ying, G.-G. Legacy and alternative per- and polyfluoroalkyl substances (PFASs) in the West River and North River, south China: Occurrence, fate, spatio-temporal variations and potential sources. Chemosphere 2021, 283, 131301. [Google Scholar] [CrossRef]
- Munoz, G.; Giraudel, J.L.; Botta, F.; Lestremau, F.; Dévier, M.H.; Budzinski, H.; Labadie, P. Spatial distribution and partitioning behavior of selected poly- and perfluoroalkyl substances in freshwater ecosystems: A French nationwide survey. Sci. Total Environ. 2015, 517, 48–56. [Google Scholar] [CrossRef]
- Muir, D.; Miaz, L.T. Spatial and Temporal Trends of Perfluoroalkyl Substances in Global Ocean and Coastal Waters. Environ. Sci. Technol. 2021, 55, 9527–9537. [Google Scholar] [CrossRef]
- Banzhaf, S.; Filipovic, M.; Lewis, J.; Sparrenbom, C.J.; Barthel, R. A review of contamination of surface-, ground-, and drinking water in Sweden by perfluoroalkyl and polyfluoroalkyl substances (PFASs). Ambio 2017, 46, 335–346. [Google Scholar] [CrossRef]
- Pico, Y.; Blasco, C.; Farré, M.; Barceló, D. Occurrence of perfluorinated compounds in water and sediment of L’Albufera Natural Park (València, Spain). Environ. Sci. Pollut. Res. 2012, 19, 946–957. [Google Scholar] [CrossRef] [PubMed]
- Podder, A.; Sadmani, A.H.M.A.; Reinhart, D.; Chang, N.-B.; Goel, R. Per and poly-fluoroalkyl substances (PFAS) as a contaminant of emerging concern in surface water: A transboundary review of their occurrences and toxicity effects. J. Hazard. Mater. 2021, 419, 126361. [Google Scholar] [CrossRef] [PubMed]
- U.S. Environmental Protection Agency. Drinking Water Health Advisory for Perfluorooctane Sulfonate (PFOS). In EPA Document Number: 822-R-16-004; U.S. Environmental Protection Agency, Office of Water (4304T)—Health and Ecological Criteria Division: Washington, DC, USA, 2016. [Google Scholar]
- U.S. Environmental Protection Agency. Drinking Water Health Advisory for Perfluorooctanoic Acid (PFOA). In EPA Document Number: 822-R-16-005; U.S. Environmental Protection Agency, Office of Water (4304T)—Health and Ecological Criteria Division: Washington, DC, USA, 2016. [Google Scholar]
- U.S. Environmental Protection Agency. PFAS Strategic Roadmap: EPA’s Commitments to Action 2021–2024. In EPA-100-K-21-002; U.S. Environmental Protection Agency: Washington, DC, USA, 2021. [Google Scholar]
- Directive 2020/2184/EU of the European Parliament and of the Council of 16 December 2020 on the quality of water intended for human consumption (recast). Off. J. Eur. Union 2020, L435, 1–62.
- Directive 2013/39/EU of the European Parliament and of the Council of 12 August 2013 amending Directives 2000/60/EC and 2008/105/EC as regards priority substances in the field of water policy. Off. J. Eur. Union 2013, L226, 1–17.
- Candidate List of Substances of Very High Concern for Authorisation (Published in Accordance with Article 59(10) of the REACH Regulation). Available online: https://echa.europa.eu/candidate-list-table (accessed on 20 July 2022).
- Ademollo, N.; Spataro, F.; Rauseo, J.; Pescatore, T.; Fattorini, N.; Valsecchi, S.; Polesello, S.; Patrolecco, L. Occurrence, distribution and pollution pattern of legacy and emerging organic pollutants in surface water of the Kongsfjorden (Svalbard, Norway): Environmental contamination, seasonal trend and climate change. Mar. Pollut. Bull. 2021, 163, 111900. [Google Scholar] [CrossRef]
- Awchi, M.; Gebbink, W.A.; Berendsen, B.J.A.; Benskin, J.P.; van Leeuwen, S.P.J. Development, validation, and application of a new method for the quantitative determination of monohydrogen-substituted perfluoroalkyl carboxylic acids (H-PFCAs) in surface water. Chemosphere 2021, 287, 132143. [Google Scholar] [CrossRef]
- Castiglioni, S.; Valsecchi, S.; Polesello, S.; Rusconi, M.; Melis, M.; Palmiotto, M.; Manenti, A.; Davoli, E.; Zuccato, E. Sources and fate of perfluorinated compounds in the aqueous environment and in drinking water of a highly urbanized and industrialized area in Italy. J. Hazard. Mater. 2015, 282, 51–60. [Google Scholar] [CrossRef]
- Clara, M.; Gans, O.; Weiss, S.; Sanz-Escribano, D.; Scharf, S.; Scheffknecht, C. Perfluorinated alkylated substances in the aquatic environment: An Austrian case study. Water Res. 2009, 43, 4760–4768. [Google Scholar] [CrossRef]
- Ericson, I.; Nadal, M.; van Bavel, B.; Lindström, G.; Domingo, J.L. Levels of perfluorochemicals in water samples from Catalonia, Spain: Is drinking water a significant contribution to human exposure? Environ. Sci. Pollut. Res. Int. 2008, 15, 614–619. [Google Scholar] [CrossRef]
- Huset, C.A.; Chiaia, A.C.; Barofsky, D.F.; Jonkers, N.; Kohler, H.-P.E.; Ort, C.; Giger, W.; Field, J.A. Occurrence and Mass Flows of Fluorochemicals in the Glatt Valley Watershed, Switzerland. Environ. Sci. Technol. 2008, 42, 6369–6377. [Google Scholar] [CrossRef]
- Junttila, V.; Vähä, E.; Perkola, N.; Räike, A.; Siimes, K.; Mehtonen, J.; Kankaanpää, H.; Mannio, J. PFASs in Finnish Rivers and Fish and the Loading of PFASs to the Baltic Sea. Water 2019, 11, 870. [Google Scholar] [CrossRef]
- Labadie, P.; Chevreuil, M. Partitioning behaviour of perfluorinated alkyl contaminants between water, sediment and fish in the Orge River (nearby Paris, France). Environ. Pollut. 2011, 159, 391–397. [Google Scholar] [CrossRef]
- Llorca, M.; Farré, M.; Picó, Y.; Müller, J.; Knepper, T.P.; Barceló, D. Analysis of perfluoroalkyl substances in waters from Germany and Spain. Sci. Total Environ. 2012, 431, 139–150. [Google Scholar] [CrossRef]
- Loos, R.; Gawlik, B.M.; Locoro, G.; Rimaviciute, E.; Contini, S.; Bidoglio, G. EU-wide survey of polar organic persistent pollutants in European river waters. Environ. Pollut. 2009, 157, 561–568. [Google Scholar] [CrossRef]
- Loos, R.; Locoro, G.; Huber, T.; Wollgast, J.; Christoph, E.H.; de Jager, A.; Manfred Gawlik, B.; Hanke, G.; Umlauf, G.; Zaldívar, J.-M. Analysis of perfluorooctanoate (PFOA) and other perfluorinated compounds (PFCs) in the River Po watershed in N-Italy. Chemosphere 2008, 71, 306–313. [Google Scholar] [CrossRef]
- Loos, R.; Wollgast, J.; Huber, T.; Hanke, G. Polar herbicides, pharmaceutical products, perfluorooctanesulfonate (PFOS), perfluorooctanoate (PFOA), and nonylphenol and its carboxylates and ethoxylates in surface and tap waters around Lake Maggiore in Northern Italy. Anal. Bioanal. Chem. 2007, 387, 1469–1478. [Google Scholar] [CrossRef]
- McLachlan, M.S.; Holmstrom, K.E.; Reth, M.; Berger, U. Riverine discharge of perfluorinated carboxylates from the European continent. Environ. Sci. Technol. 2007, 41, 7260–7265. [Google Scholar] [CrossRef]
- Möller, A.; Ahrens, L.; Surm, R.; Westerveld, J.; van der Wielen, F.; Ebinghaus, R.; de Voogt, P. Distribution and sources of polyfluoroalkyl substances (PFAS) in the River Rhine watershed. Environ. Pollut. 2010, 158, 3243–3250. [Google Scholar] [CrossRef]
- Rostkowski, P.; Taniyasu, S.; Yamashita, N.; Falandysz, J.J.; Zegarowski, Ł.; Chojnacka, A.; Pazdro, K.; Falandysz, J. Survey of perfluorinated compounds (PFCs) in surface waters of Poland. J. Environ. Sci. Health 2009, 44, 1518–1527. [Google Scholar] [CrossRef]
- Schmidt, N.; Fauvelle, V.; Castro-Jiménez, J.; Lajaunie-Salla, K.; Pinazo, C.; Yohia, C.; Sempéré, R. Occurrence of perfluoroalkyl substances in the Bay of Marseille (NW Mediterranean Sea) and the Rhône River. Mar. Pollut. Bull. 2019, 149, 110491. [Google Scholar] [CrossRef]
- Skutlarek, D.; Exner, M.; Färber, H. Perfluorinated surfactants in surface and drinking waters. Environ. Sci. Pollut. Res. Int. 2006, 13, 299–307. [Google Scholar] [PubMed]
- Pignotti, E.; Farré, M.; Barceló, D.; Dinelli, E. Occurrence and distribution of six selected endocrine disrupting compounds in surface- and groundwaters of the Romagna area (North Italy). Environ. Sci. Pollut. Res. 2017, 24, 21153–21167. [Google Scholar] [CrossRef] [PubMed]
- Köck-Schulmeyer, M.; Ginebreda, A.; Petrovic, M.; Giulivo, M.; Aznar-Alemany, Ò.; Eljarrat, E.; Valle-Sistac, J.; Molins-Delgado, D.; Diaz-Cruz, M.S.; Monllor-Alcaraz, L.S.; et al. Priority and emerging organic microcontaminants in three Mediterranean river basins: Occurrence, spatial distribution, and identification of river basin specific pollutants. Sci. Total Environ. 2021, 754, 142344. [Google Scholar] [CrossRef] [PubMed]
- Barbosa, M.O.; Ribeiro, A.R.; Ratola, N.; Hain, E.; Homem, V.; Pereira, M.F.R.; Blaney, L.; Silva, A.M.T. Spatial and seasonal occurrence of micropollutants in four Portuguese rivers and a case study for fluorescence excitation-emission matrices. Sci. Total Environ. 2018, 644, 1128–1140. [Google Scholar] [CrossRef]
- Sousa, J.C.G.; Barbosa, M.O.; Ribeiro, A.R.L.; Ratola, N.; Pereira, M.F.R.; Silva, A.M.T. Distribution of micropollutants in estuarine and sea water along the Portuguese coast. Mar. Pollut. Bull. 2020, 154, 111120. [Google Scholar] [CrossRef]
- Onghena, M.; Moliner-Martinez, Y.; Picó, Y.; Campíns-Falcó, P.; Barceló, D. Analysis of 18 perfluorinated compounds in river waters: Comparison of high performance liquid chromatography-tandem mass spectrometry, ultra-high-performance liquid chromatography-tandem mass spectrometry and capillary liquid chromatography-mass spectrometry. J. Chromatogr. A 2012, 1244, 88–97. [Google Scholar]
- Sousa, J.C.G.; Ribeiro, A.R.; Barbosa, M.O.; Ribeiro, C.; Tiritan, M.E.; Pereira, M.F.R.; Silva, A.M.T. Monitoring of the 17 EU Watch List contaminants of emerging concern in the Ave and the Sousa Rivers. Sci. Total Environ. 2019, 649, 1083–1095. [Google Scholar] [CrossRef]
- Homem, V.; Llompart, M.; Vila, M.; Ribeiro, A.R.L.; Garcia-Jares, C.; Ratola, N.; Celeiro, M. Gone with the flow—Assessment of personal care products in Portuguese rivers. Chemosphere 2022, 293, 133552. [Google Scholar] [CrossRef]
- Yan, C.; Yang, Y.; Zhou, J.; Liu, M.; Nie, M.; Shi, H.; Gu, L. Antibiotics in the surface water of the Yangtze Estuary: Occurrence, distribution and risk assessment. Environ. Pollut. 2013, 175, 22–29. [Google Scholar] [CrossRef]
- Huerta, B.; McHugh, B.; Regan, F. Development and application of an LC-MS method to the determination of poly- and perfluoroalkyl substances (PFASs) in drinking, sea and surface water samples. Anal. Methods 2022, 14, 2090–2099. [Google Scholar] [CrossRef]
- Nguyen, M.A.; Wiberg, K.; Ribeli, E.; Josefsson, S.; Futter, M.; Gustavsson, J.; Ahrens, L. Spatial distribution and source tracing of per- and polyfluoroalkyl substances (PFASs) in surface water in Northern Europe. Environ. Pollut. 2017, 220, 1438–1446. [Google Scholar] [CrossRef]
- Lorenzo, M.; Campo, J.; Farré, M.; Pérez, F.; Picó, Y.; Barceló, D. Perfluoroalkyl substances in the Ebro and Guadalquivir river basins (Spain). Sci. Total Environ. 2016, 540, 191–199. [Google Scholar] [CrossRef]
- Campo, J.; Pérez, F.; Masiá, A.; Picó, Y.; Farré, M.; Barceló, D. Perfluoroalkyl substance contamination of the Llobregat River ecosystem (Mediterranean area, NE Spain). Sci. Total Environ. 2015, 503–504, 48–57. [Google Scholar] [CrossRef]
- Gebbink, W.A.; van Asseldonk, L.; van Leeuwen, S.P.J. Presence of Emerging Per- and Polyfluoroalkyl Substances (PFASs) in River and Drinking Water near a Fluorochemical Production Plant in the Netherlands. Environ. Sci. Technol. 2017, 51, 11057–11065. [Google Scholar] [CrossRef]
- Pan, Y.; Zhang, H.; Cui, Q.; Sheng, N.; Yeung, L.W.Y.; Sun, Y.; Guo, Y.; Dai, J. Worldwide distribution of novel perfluoroether carboxylic and sulfonic acids in surface water. Environ. Sci. Technol. 2018, 52, 7621–7629. [Google Scholar] [CrossRef]
- Campo, J.; Lorenzo, M.; Pérez, F.; Picó, Y.; Farré, M.; Barceló, D. Perfluoroalkyl substance contamination of the Llobregat River ecosystem (Mediterranean area, NE Spain). Environ. Res. 2016, 147, 503–512. [Google Scholar] [CrossRef]
- Shafique, U.; Schulze, S.; Slawik, C.; Böhme, A.; Paschke, A.; Schüürmann, G. Perfluoroalkyl acids in aqueous samples from Germany and Kenya. Environ. Sci. Pollut. Res. 2017, 24, 11031–11043. [Google Scholar] [CrossRef]
- Sammut, G.; Sinagra, E.; Helmus, R.; de Voogt, P. Perfluoroalkyl substances in the Maltese environment—(I) surface water and rain water. Sci. Total Environ. 2017, 589, 182–190. [Google Scholar] [CrossRef]
- Aro, R.; Carlsson, P.; Vogelsang, C.; Kärrman, A.; Yeung, L.W.Y. Fluorine mass balance analysis of selected environmental samples from Norway. Chemosphere 2021, 283, 131200. [Google Scholar] [CrossRef]
- Sánchez-Avila, J.; Meyer, J.; Lacorte, S. Spatial distribution and sources of perfluorochemicals in the NW Mediterranean coastal waters (Catalonia, Spain). Environ. Pollut. 2010, 158, 2833–2840. [Google Scholar] [CrossRef]
- Llorca, M.; Farré, M.; Picó, Y.; Barceló, D. Analysis of perfluorinated compounds in sewage sludge by pressurized solvent extraction followed by liquid chromatography-mass spectrometry. J. Chromatogr. A 2011, 1218, 4840–4846. [Google Scholar] [CrossRef] [PubMed]
- Llorca, M.; Farré, M.; Picó, Y.; Barceló, D. Development and validation of a pressurized liquid extraction liquid chromatography-tandem mass spectrometry method for perfluorinated compounds determination in fish. J. Chromatogr. A 2009, 1216, 7195–7204. [Google Scholar] [CrossRef] [PubMed]
- Pihlström, T.; Fernández-Alba, A.R.; Gamón, M.; Amate, C.; Poulsen, M.; Lippold, R.; Anastassiades, M. Analytical quality control and method validation procedures for pesticide residues analysis in food and feed. Sante 2017, 11813, 21–22. [Google Scholar]
- USEPA. Definition and Procedure for the Determination of the Method Detection Limit, Revision 2, in EPA Doocument Number: 821-R-16-006. 2016, U.S. Environmental Protection Agency, Office of Science and Technology—CWA Methods Team, Engineering and Analytical Support Branch/EAD (4303T) Washington, DC 20460. Available online: https://www.epa.gov/sites/default/files/2016-12/documents/mdl-procedure_rev2_12-13-2016.pdf (accessed on 13 December 2022).
- E.C.J.R.Centre. Technical Guidance Document on Risk Assessment in Support of Commission Directive 93/67/EEC on Risk Assessment for New Notified Substances, Commission Regulation (EC) No. 1488/94 on Risk Assessment for Existing Substance, and Directive 98/8/EC of the European Parliament and of the Council Concerning the Placing of Biocidal Products on the Market. Part II. EUR 20418 EN/2. 2003, European Commission Joint Research Centre, 100-102. Available online: https://echa.europa.eu/documents/10162/987906/tgdpart2_2ed_en.pdf/138b7b71-a069-428e-9036-62f4300b752f (accessed on 13 December 2022).
- Ding, H.; Wu, Y.; Zhang, W.; Zhong, J.; Lou, Q.; Yang, P.; Fang, Y. Occurrence, distribution, and risk assessment of antibiotics in the surface water of Poyang Lake, the largest freshwater lake in China. Chemosphere 2017, 184, 137–147. [Google Scholar] [CrossRef]
- Sardiña, P.; Leahy, P.; Metzeling, L.; Stevenson, G.; Hinwood, A. Emerging and legacy contaminants across land-use gradients and the risk to aquatic ecosystems. Sci. Total Environ. 2019, 695, 133842. [Google Scholar] [CrossRef]


| Compound | Type of Effect | Organism | Conc. (mg L−1) a | PNEC (mg L−1) b | RQ c | Classification |
|---|---|---|---|---|---|---|
| PFBA | Acute (LC50 or EC50 for Green Algae) | Fish (96 h) | 1323 | 1.323 | 0.000 | RQ < 0.1 Low risk |
| Daphnid (48 h) | 760.6 | 0.761 | 0.000 | |||
| Green Algae (96 h) | 597.1 | 0.597 | 0.000 | |||
| Chronic (ChV) | Fish | 131.2 | 1.312 | 0.000 | ||
| Daphnid | 76.84 | 0.768 | 0.000 | |||
| Green Algae | 160.9 | 1.609 | 0.000 | |||
| PFHxS | Acute (LC50 or EC50 for Green Algae) | Fish (96 h) | 301.3 | 0.301 | 0.000 | RQ < 0.1 Low risk |
| Daphnid (48 h) | 190.4 | 0.190 | 0.000 | |||
| Green Algae (96 h) | 220.4 | 0.220 | 0.000 | |||
| Chronic (ChV) | Fish | 33.40 | 0.334 | 0.000 | ||
| Daphnid | 24.98 | 0.250 | 0.000 | |||
| Green Algae | 73.20 | 0.732 | 0.000 | |||
| PFBS | Acute (LC50 or EC50 for Green Algae) | Fish (96 h) | 3597 | 3.597 | 0.000 | RQ < 0.1 Low risk |
| Daphnid (48 h) | 2008 | 2.008 | 0.000 | |||
| Green Algae (96 h) | 1395 | 1.395 | 0.000 | |||
| Chronic (ChV) | Fish | 344.7 | 3.447 | 0.000 | ||
| Daphnid | 186.9 | 1.869 | 0.000 | |||
| Green Algae | 351.9 | 3.519 | 0.000 | |||
| PFHpA | Acute (LC50 or EC50 for Green Algae) | Fish (96 h) | 35.43 | 0.035 | 0.001 | RQ < 0.1 Low risk |
| Daphnid (48 h) | 24.52 | 0.025 | 0.001 | |||
| Green Algae (96 h) | 41.43 | 0.041 | 0.000 | |||
| Chronic (ChV) | Fish | 4.374 | 0.044 | 0.000 | ||
| Daphnid | 4.150 | 0.042 | 0.000 | |||
| Green Algae | 16.86 | 0.169 | 0.000 | |||
| PFOA | Acute (LC50 or EC50 for Green Algae) | Fish (96 h) | 10.10 | 0.010 | 0.002 | RQ < 0.1 Low risk |
| Daphnid (48 h) | 7.437 | 0.007 | 0.002 | |||
| Green Algae (96 h) | 16.22 | 0.016 | 0.001 | |||
| Chronic (ChV) | Fish | 1.341 | 0.013 | 0.001 | ||
| Daphnid | 1.495 | 0.015 | 0.001 | |||
| Green Algae | 7.576 | 0.076 | 0.000 | |||
| PFNA | Acute (LC50 or EC50 for Green Algae) | Fish (96 h) | 2.837 | 0.003 | 0.001 | RQ < 0.1 Low risk |
| Daphnid (48 h) | 2.222 | 0.002 | 0.001 | |||
| Green Algae (96 h) | 6.258 | 0.006 | 0.000 | |||
| Chronic (ChV) | Fish | 0.405 | 0.004 | 0.001 | ||
| Daphnid | 0.530 | 0.005 | 0.000 | |||
| Green Algae | 3.354 | 0.034 | 0.000 | |||
| PFDA | Acute (LC50 or EC50 for Green Algae) | Fish (96 h) | 0.788 | 0.001 | 0.004 | RQ < 0.1 Low risk |
| Daphnid (48 h) | 0.656 | 0.001 | 0.005 | |||
| Green Algae (96 h) | 2.386 | 0.002 | 0.001 | |||
| Chronic (ChV) | Fish | 0.121 | 0.001 | 0.003 | ||
| Daphnid | 0.186 | 0.002 | 0.002 | |||
| Green Algae | 1.468 | 0.015 | 0.000 | |||
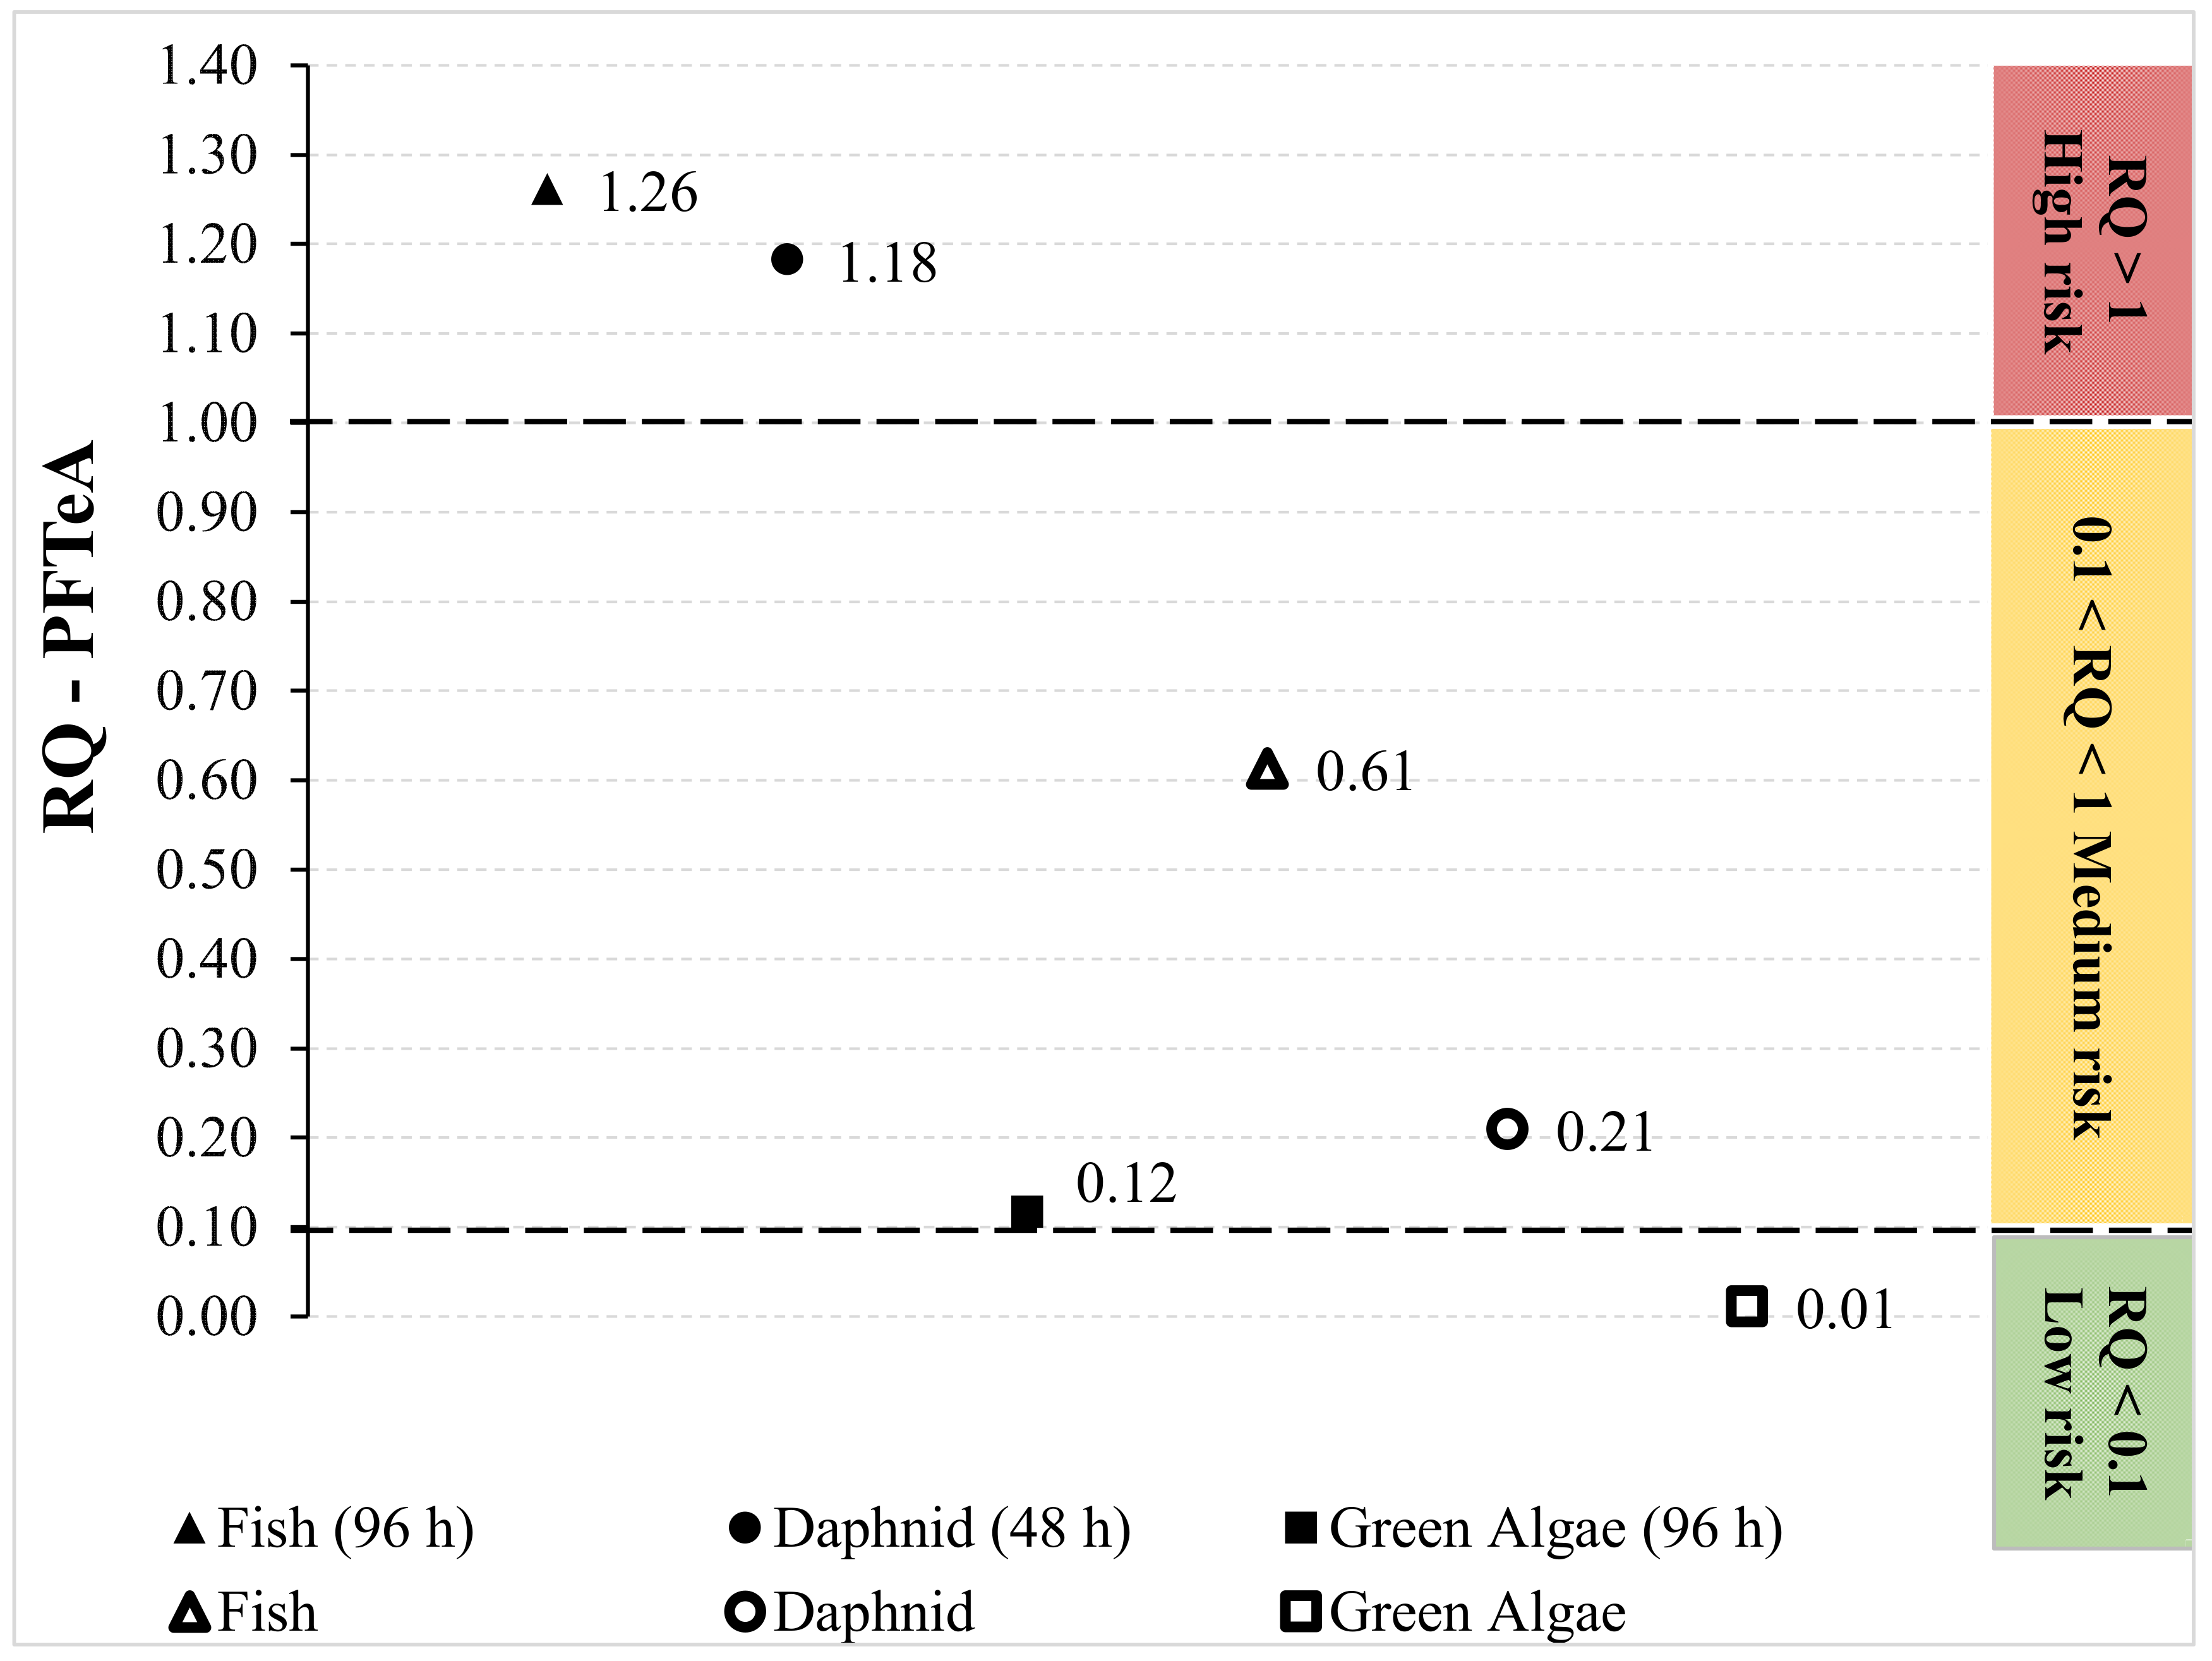
| PFTeA | Acute (LC50 or EC50 for Green Algae) | Fish (96 h) | 0.004 | 4.320 × 10⁻⁶ | 1.261 | RQ > 1 High risk |
| Daphnid (48 h) | 0.005 | 4.608 × 10⁻⁶ | 1.183 | |||
| Green Algae (96 h) | 0.047 | 4.654 × 10⁻⁵ | 0.117 | 0.1 < RQ < 1 Medium risk | ||
| Chronic (ChV) | Fish | 0.001 | 8.884 × 10⁻⁶ | 0.613 | ||
| Daphnid | 0.003 | 2.599 × 10⁻⁵ | 0.210 | |||
| Green Algae | 0.050 | 4.963 × 10⁻⁴ | 0.011 | RQ < 0.1 Low risk | ||
| PFOS | Acute (LC50 or EC50 for Green Algae) | Fish (96 h) | 23.66 | 0.024 | 0.001 | RQ < 0.1 Low risk |
| Daphnid (48 h) | 16.92 | 0.017 | 0.001 | |||
| Green Algae (96 h) | 32.65 | 0.033 | 0.001 | |||
| Chronic (ChV) | Fish | 3.035 | 0.030 | 0.001 | ||
| Daphnid | 3.131 | 0.031 | 0.001 | |||
| Green Algae | 14.28 | 0.143 | 0.000 |
| Compound | Max. Concentration Found (ng L−1) | |||||||||||||||
|---|---|---|---|---|---|---|---|---|---|---|---|---|---|---|---|---|
| Present Study | Literature Overview | |||||||||||||||
| Portugal | Austria [34] | Finland [37] | France [38] | France [20] | Germany [47] | Germany and Netherlands [44] | Germany [39] | Spain [39] | Italy [42] | Malta and Gozo [64] | Netherlands [32] | Norway [65] | Spain [35] | Spain [66] | Switzerland [36] | |
| PFBA | 23 | <MDL | 5.3 | <MDL | 0.2 | 3.0 | 335 | 0.4 | 27 | n.a. | n.a. | n.a. | 8.0 | n.a. | 0.6 | n.a. |
| PFHxS | 1.5 | <MDL | 6.4 | 14 | 217 | n.a. | 14 | <MQL | 28 | n.a. | 2.5 | n.a. | 1.6 | 0.8 | 0.9 | 14 |
| PFBS | 7.1 | <MDL | 1.5 | 4.4 | 29 | 46 | 181 | <MQL | 36 | n.a. | n.a. | n.a. | 2.0 | n.a. | n.a. | 7.7 |
| PFHpA | 18 | <3.2 | 2.7 | 4.5 | 16 | 11 | 4.7 | 24 | 16 | 2 | 11 | 10 | 4.4 | 3.4 | 10 | 2.7 |
| PFOA | 17 | 19 | 5.4 | 9.4 | 36 | 48 | 41 | 1.9 | 35 | 16 | 16 | >125 | 5.7 | 6.3 | 1.6 | 7.7 |
| PFNA | 2.6 | <1.1 | 23 | 1.3 | 30 | n.a. | n.a. | <MQL | 22 | 16 | 3.4 | 1.5 | 2.8 | 0.6 | n.a. | <MDL |
| PFDA | 3.4 | <1.1 | 0.5 | 1.1 | 10 | n.a. | n.a. | <MQL | 4.7 | 11 | 4.4 | 3.8 | 2.0 | < 0.82 | n.a. | <MDL |
| PFTeA | 5.5 | <MDL | <MDL | <MDL | <MDL | n.a. | n.a. | n.a. | n.a. | n.a. | n.a. | n.a. | n.a. | < 0.90 | 10 | n.a. |
| PFOS | 23 | 35 | 26 | 17 | 370 | 26 | 25 | 0.4 | 258 | 39 | 5.3 | n.a. | 9.1 | 5.9 | n.a. | 60.0 |
Disclaimer/Publisher’s Note: The statements, opinions and data contained in all publications are solely those of the individual author(s) and contributor(s) and not of MDPI and/or the editor(s). MDPI and/or the editor(s) disclaim responsibility for any injury to people or property resulting from any ideas, methods, instructions or products referred to in the content. |
© 2023 by the authors. Licensee MDPI, Basel, Switzerland. This article is an open access article distributed under the terms and conditions of the Creative Commons Attribution (CC BY) license (https://creativecommons.org/licenses/by/4.0/).
Share and Cite
Barbosa, M.O.; Ratola, N.; Homem, V.; Pereira, M.F.R.; Silva, A.M.T.; Ribeiro, A.R.L.; Llorca, M.; Farré, M. Per- and Poly-Fluoroalkyl Substances in Portuguese Rivers: Spatial-Temporal Monitoring. Molecules 2023, 28, 1209. https://doi.org/10.3390/molecules28031209
Barbosa MO, Ratola N, Homem V, Pereira MFR, Silva AMT, Ribeiro ARL, Llorca M, Farré M. Per- and Poly-Fluoroalkyl Substances in Portuguese Rivers: Spatial-Temporal Monitoring. Molecules. 2023; 28(3):1209. https://doi.org/10.3390/molecules28031209
Chicago/Turabian StyleBarbosa, Marta O., Nuno Ratola, Vera Homem, M. Fernando R. Pereira, Adrián M. T. Silva, Ana R. L. Ribeiro, Marta Llorca, and Marinella Farré. 2023. "Per- and Poly-Fluoroalkyl Substances in Portuguese Rivers: Spatial-Temporal Monitoring" Molecules 28, no. 3: 1209. https://doi.org/10.3390/molecules28031209
APA StyleBarbosa, M. O., Ratola, N., Homem, V., Pereira, M. F. R., Silva, A. M. T., Ribeiro, A. R. L., Llorca, M., & Farré, M. (2023). Per- and Poly-Fluoroalkyl Substances in Portuguese Rivers: Spatial-Temporal Monitoring. Molecules, 28(3), 1209. https://doi.org/10.3390/molecules28031209