
Molecular Dynamics Study on the Diffusion Mass Transfer Behaviour of CO2 and Crude Oil in Fluids Produced via CO2 Flooding

Abstract
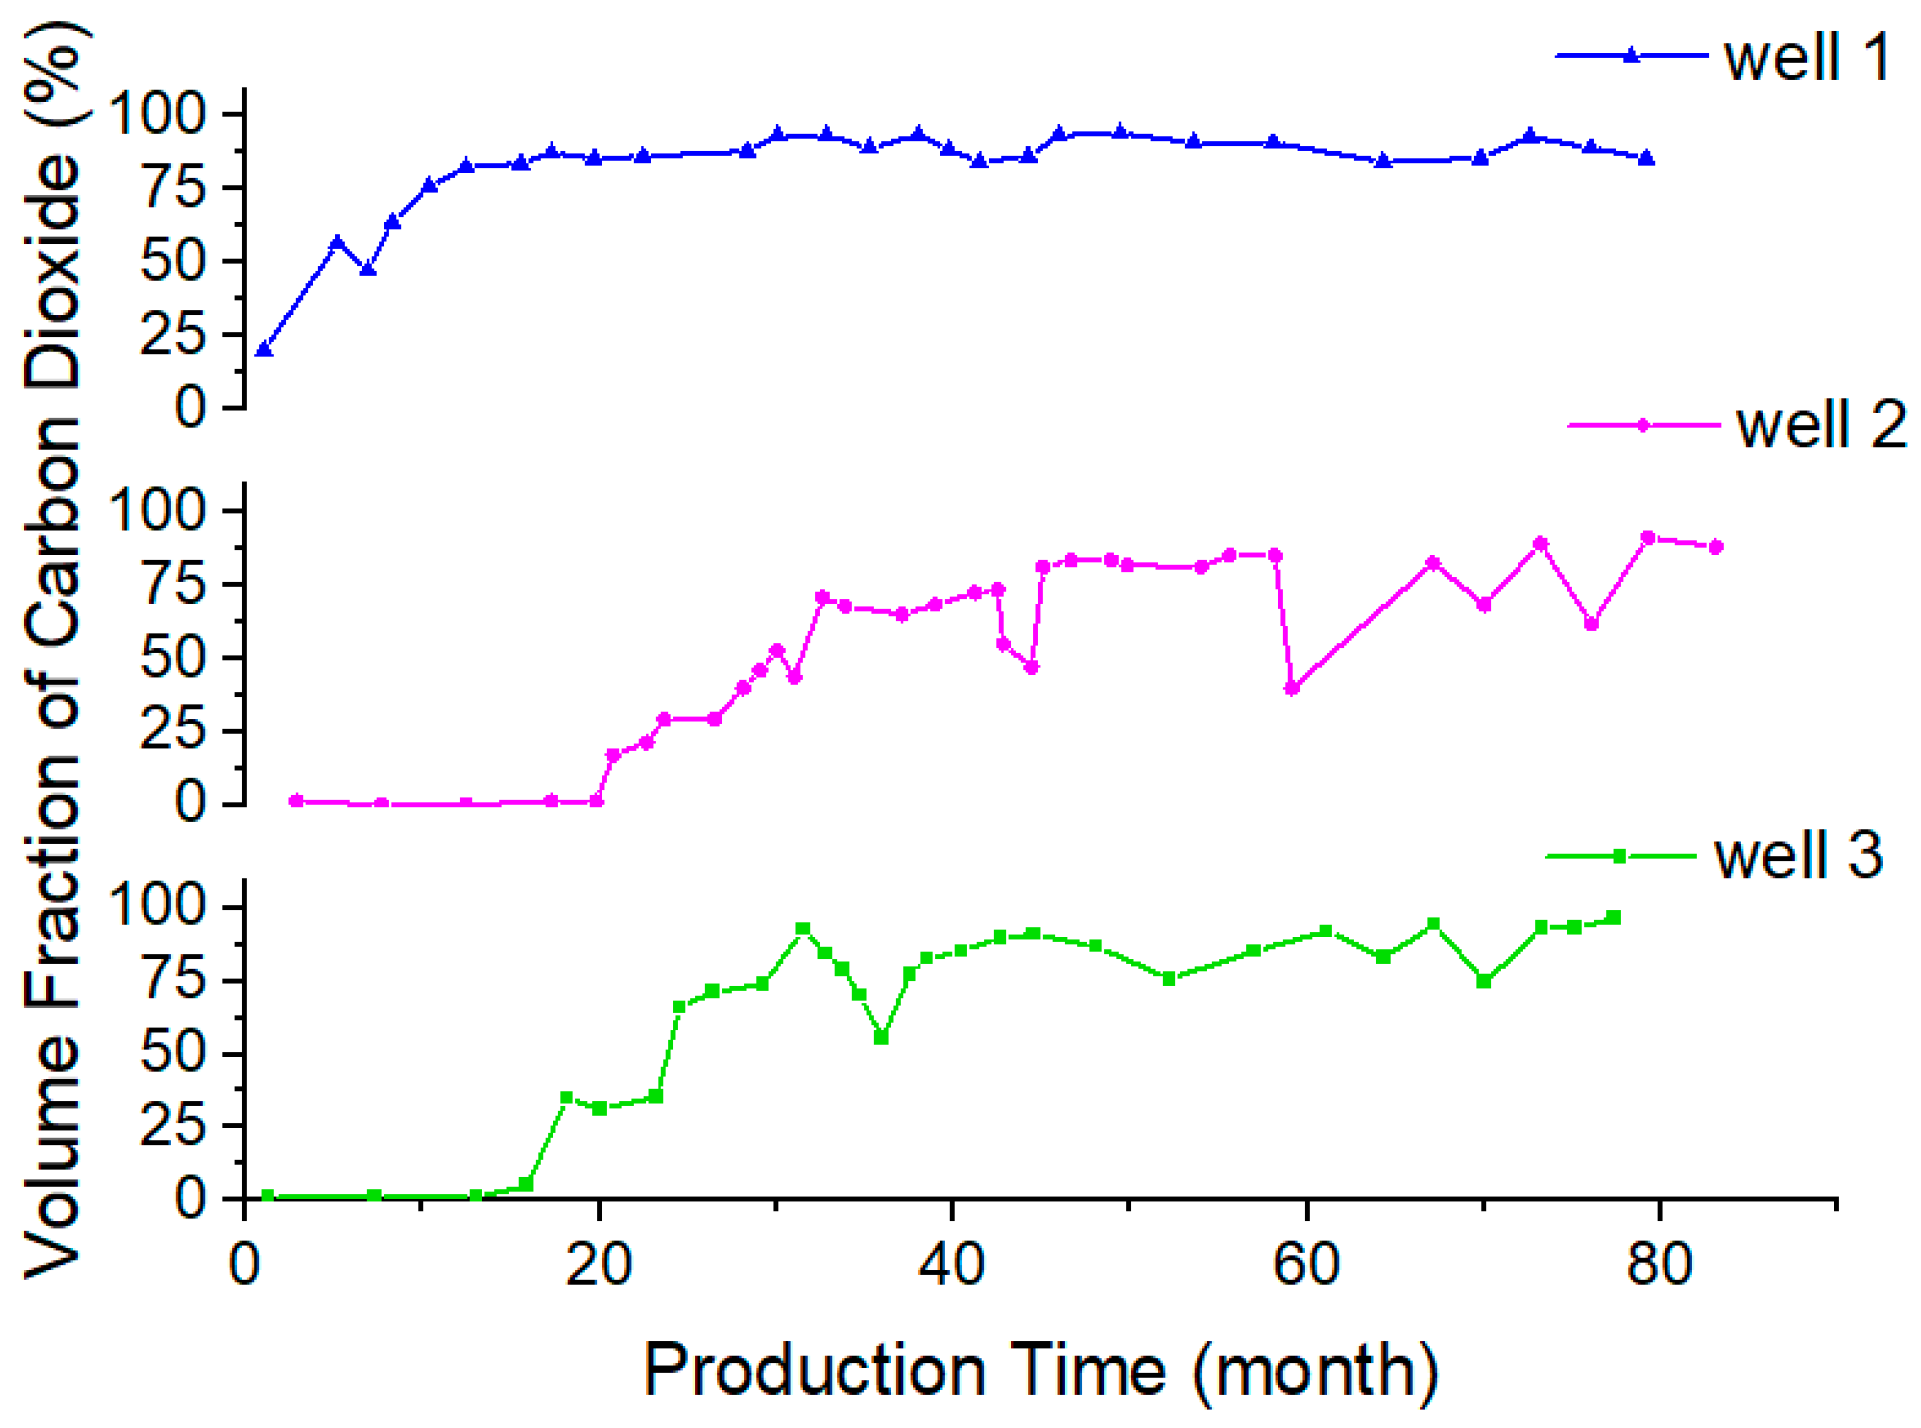
:1. Introduction
2. Results and Discussion
2.1. The Effect of Temperature on the Diffusion Process of Carbon Dioxide in the Crude Oil System
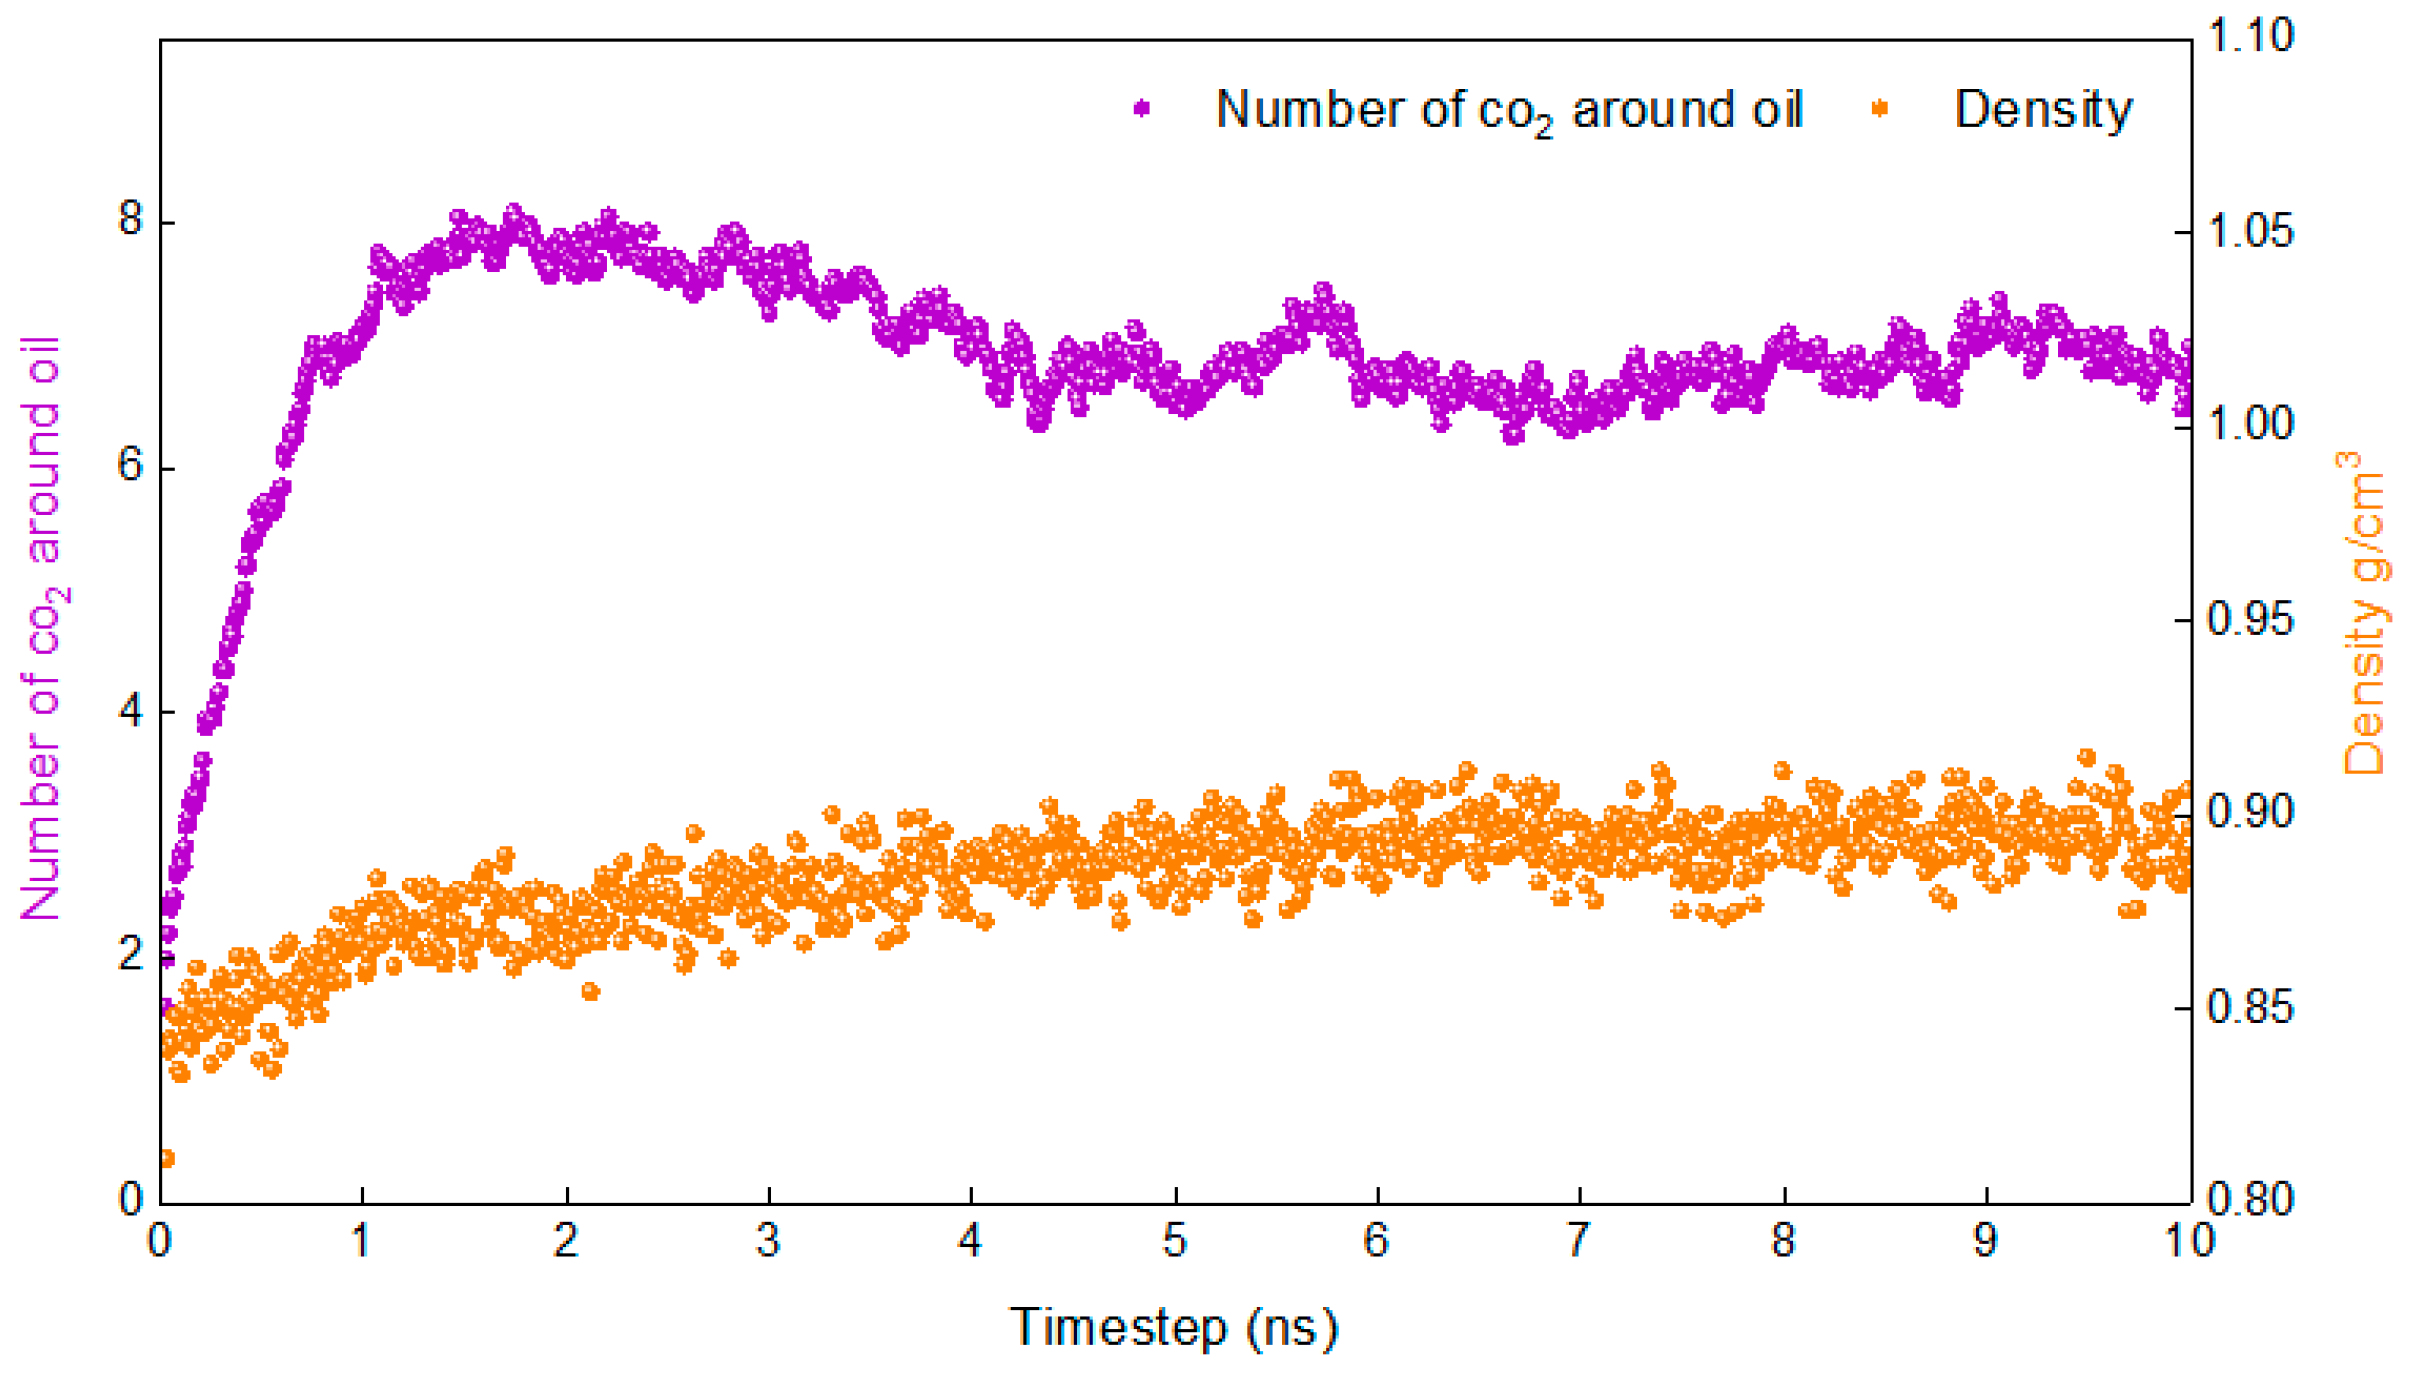
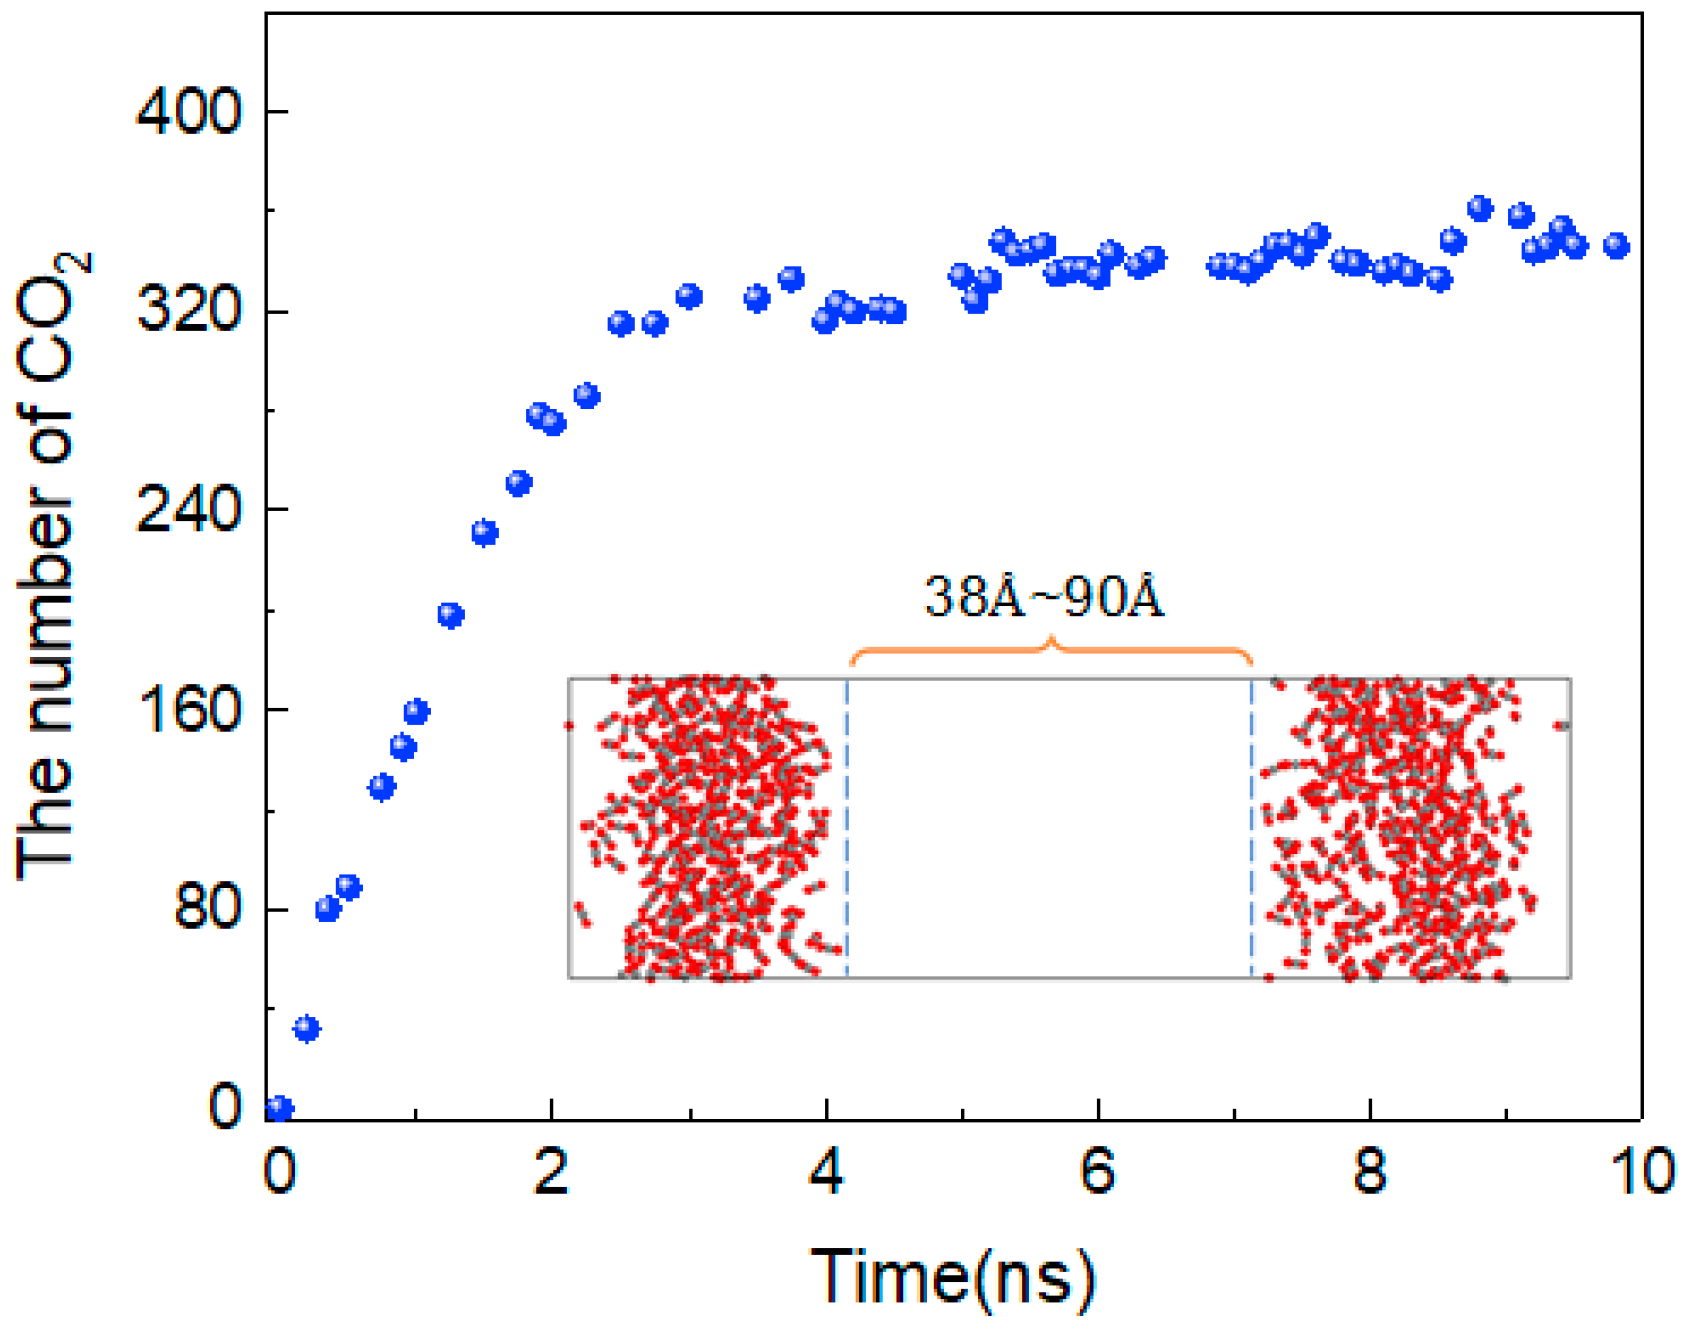
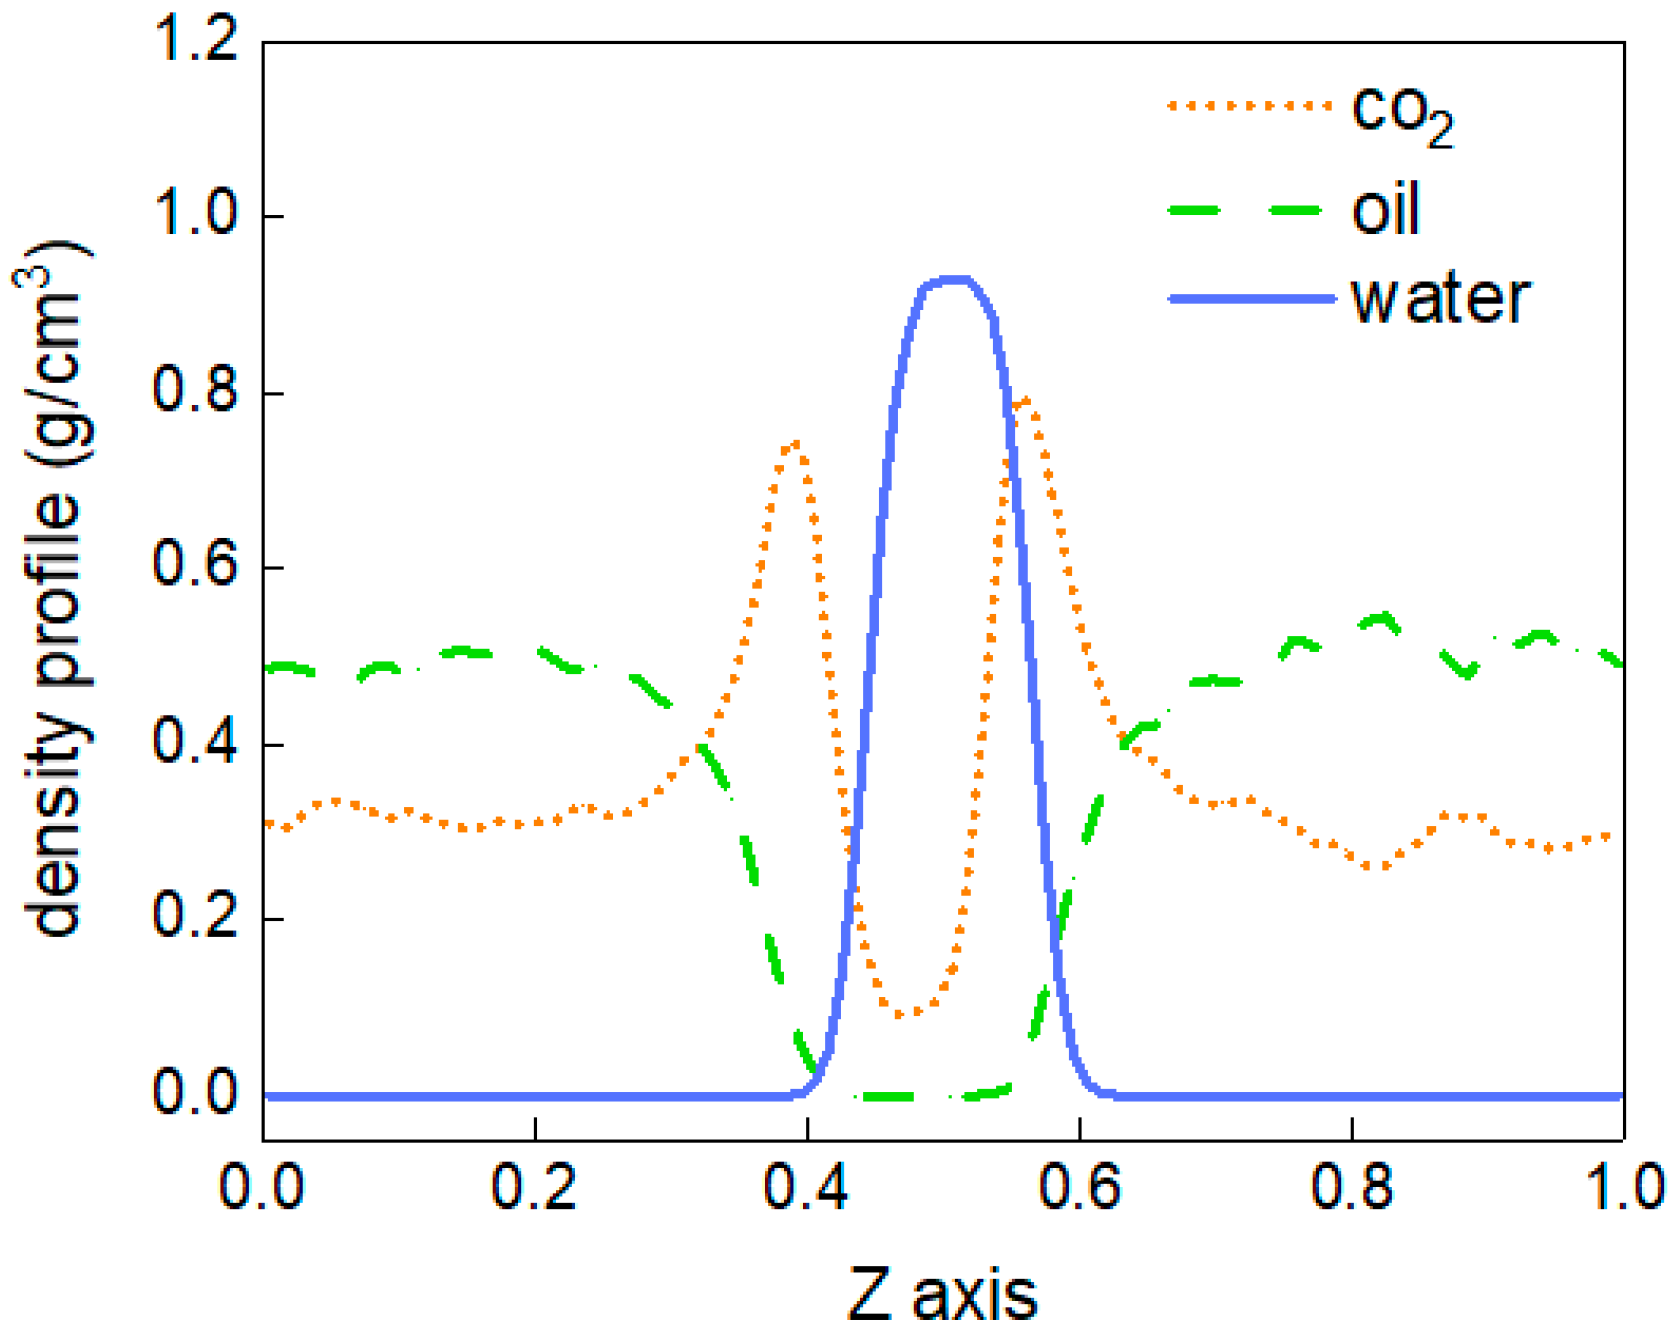
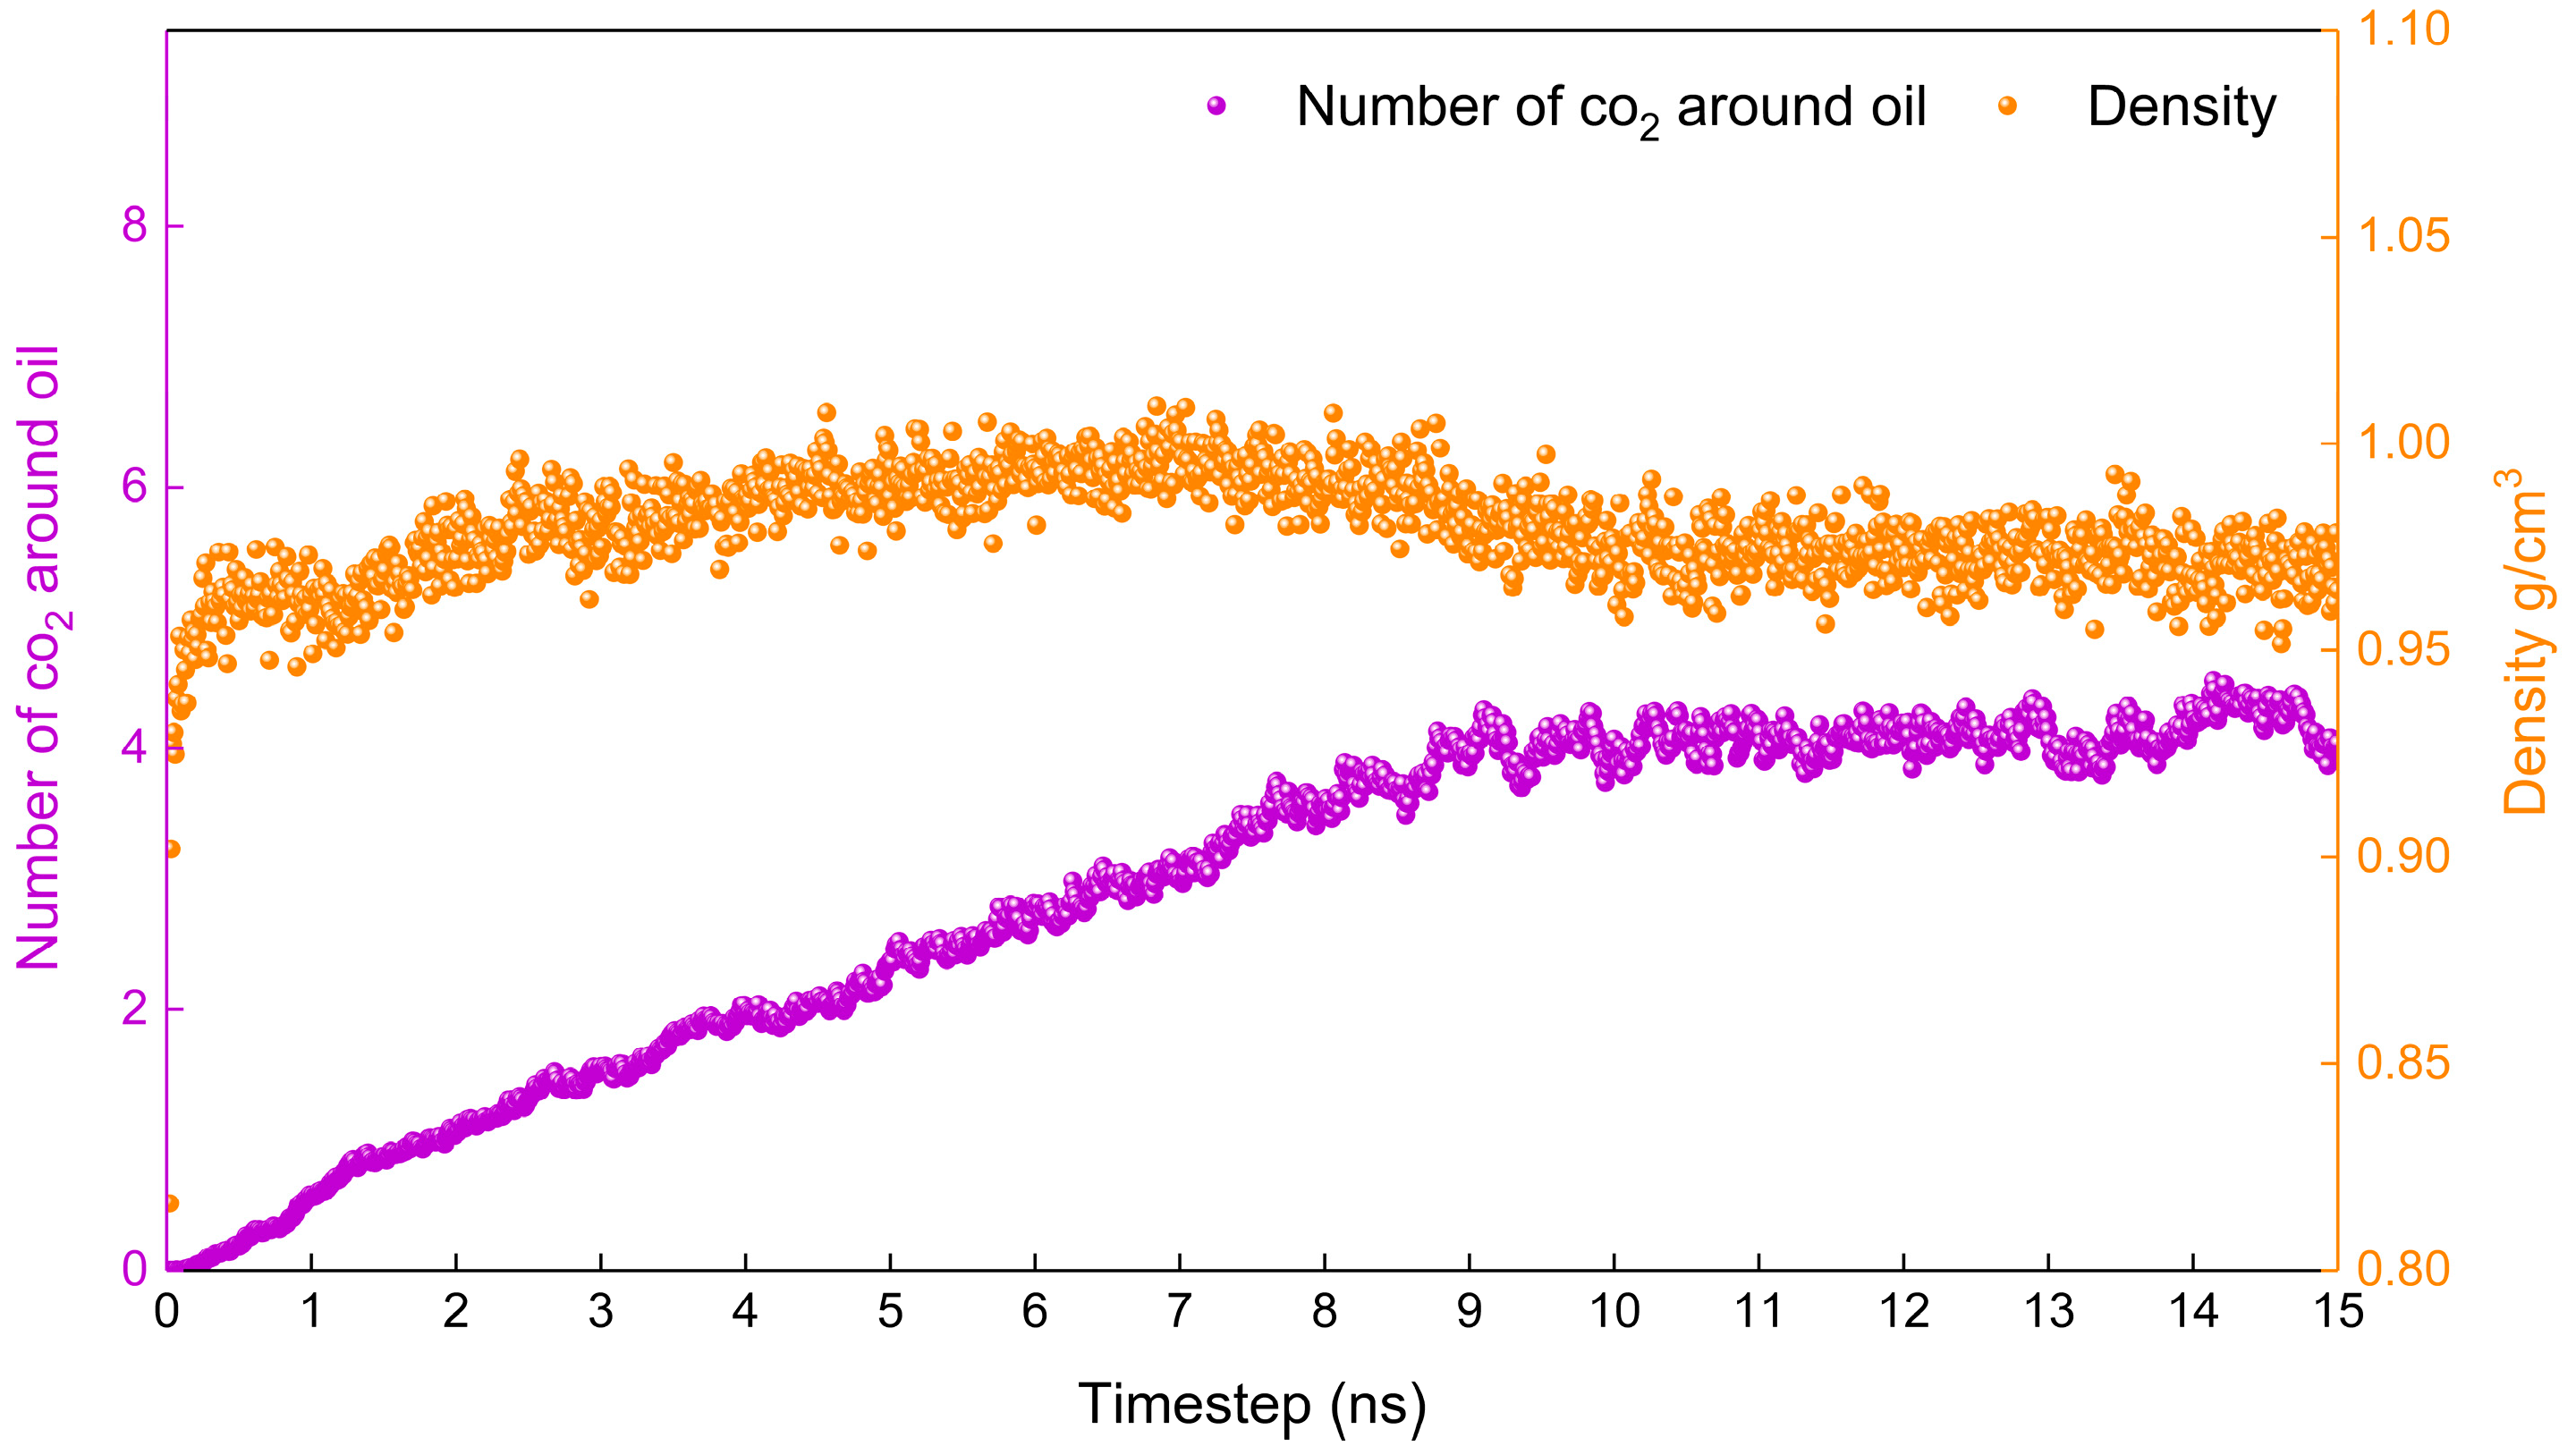
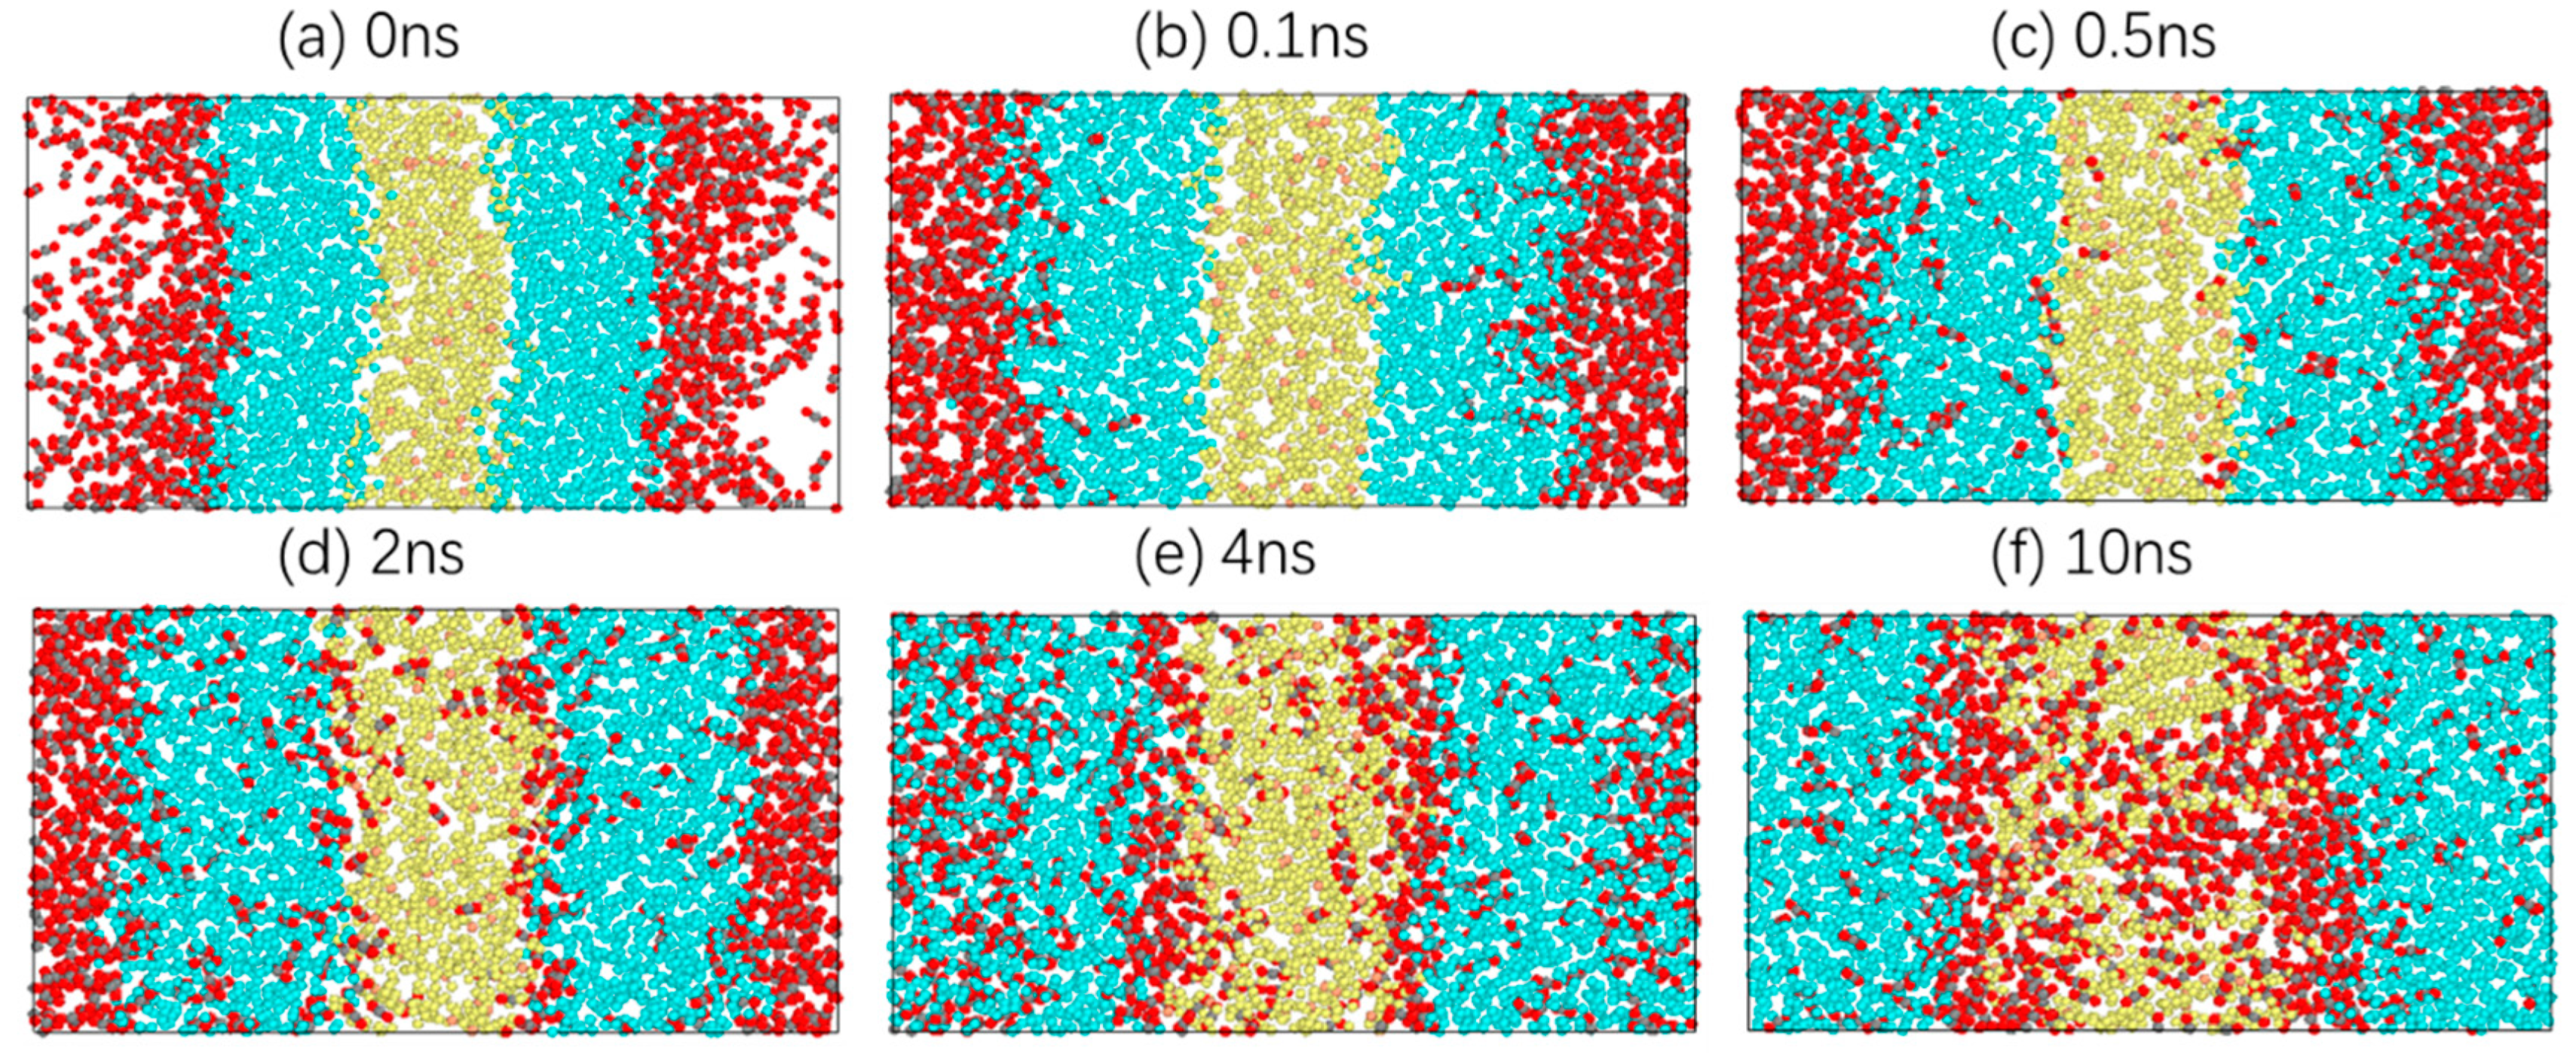
2.1.1. Diffusion Process of Carbon Dioxide in Crude Oil
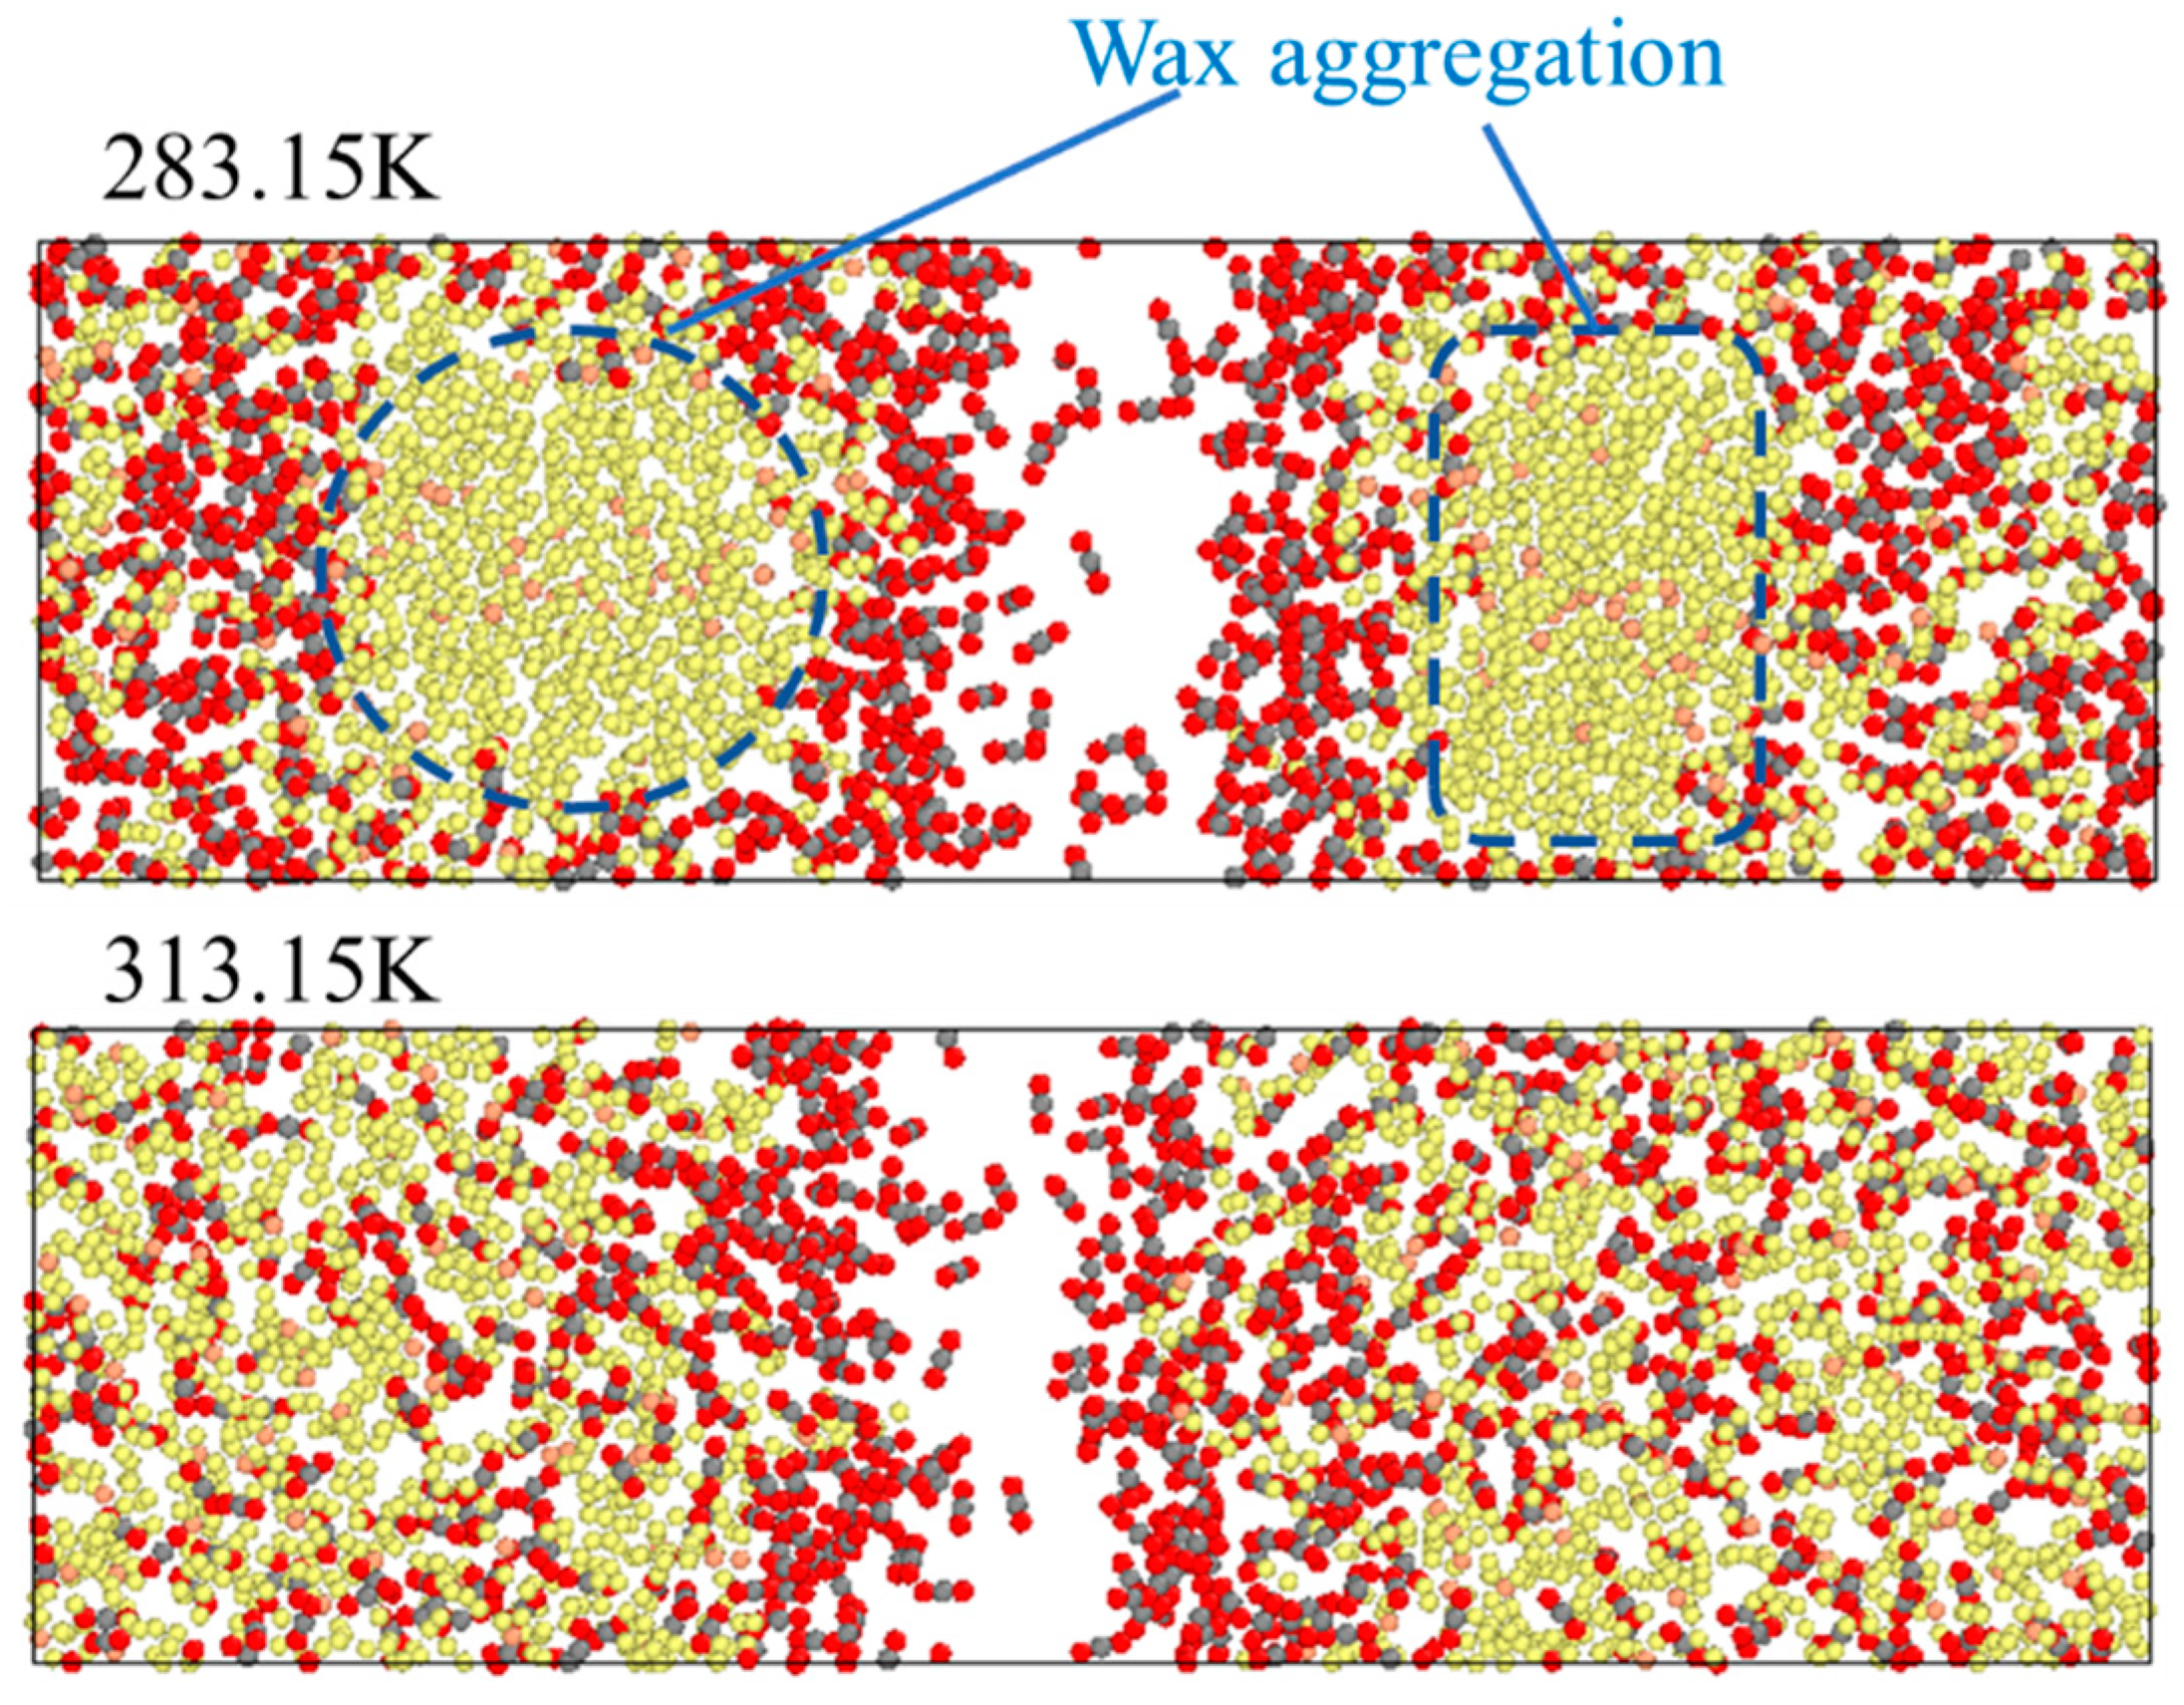
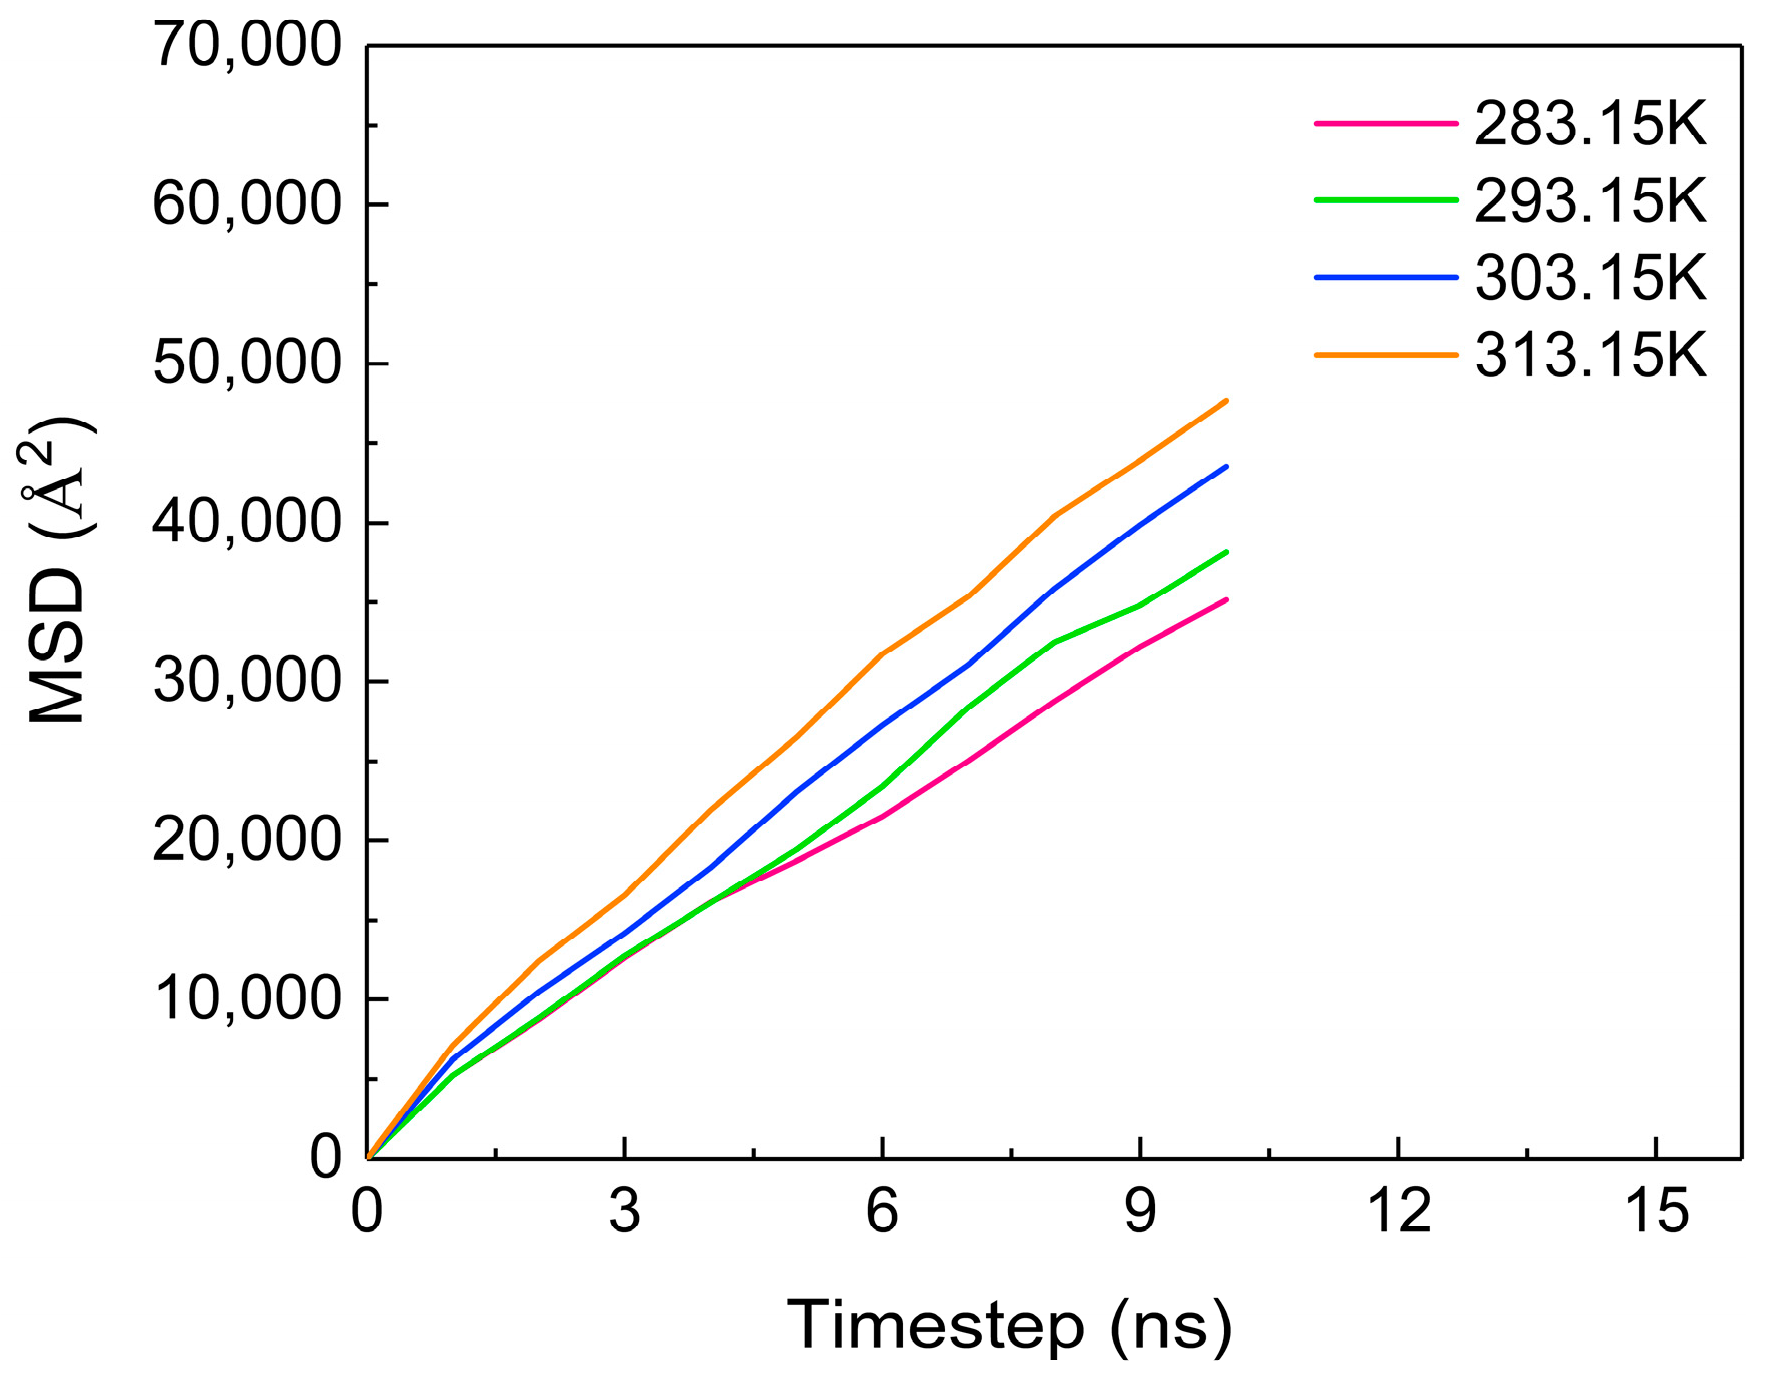
2.1.2. The Effect of Temperature on the Diffusion Process
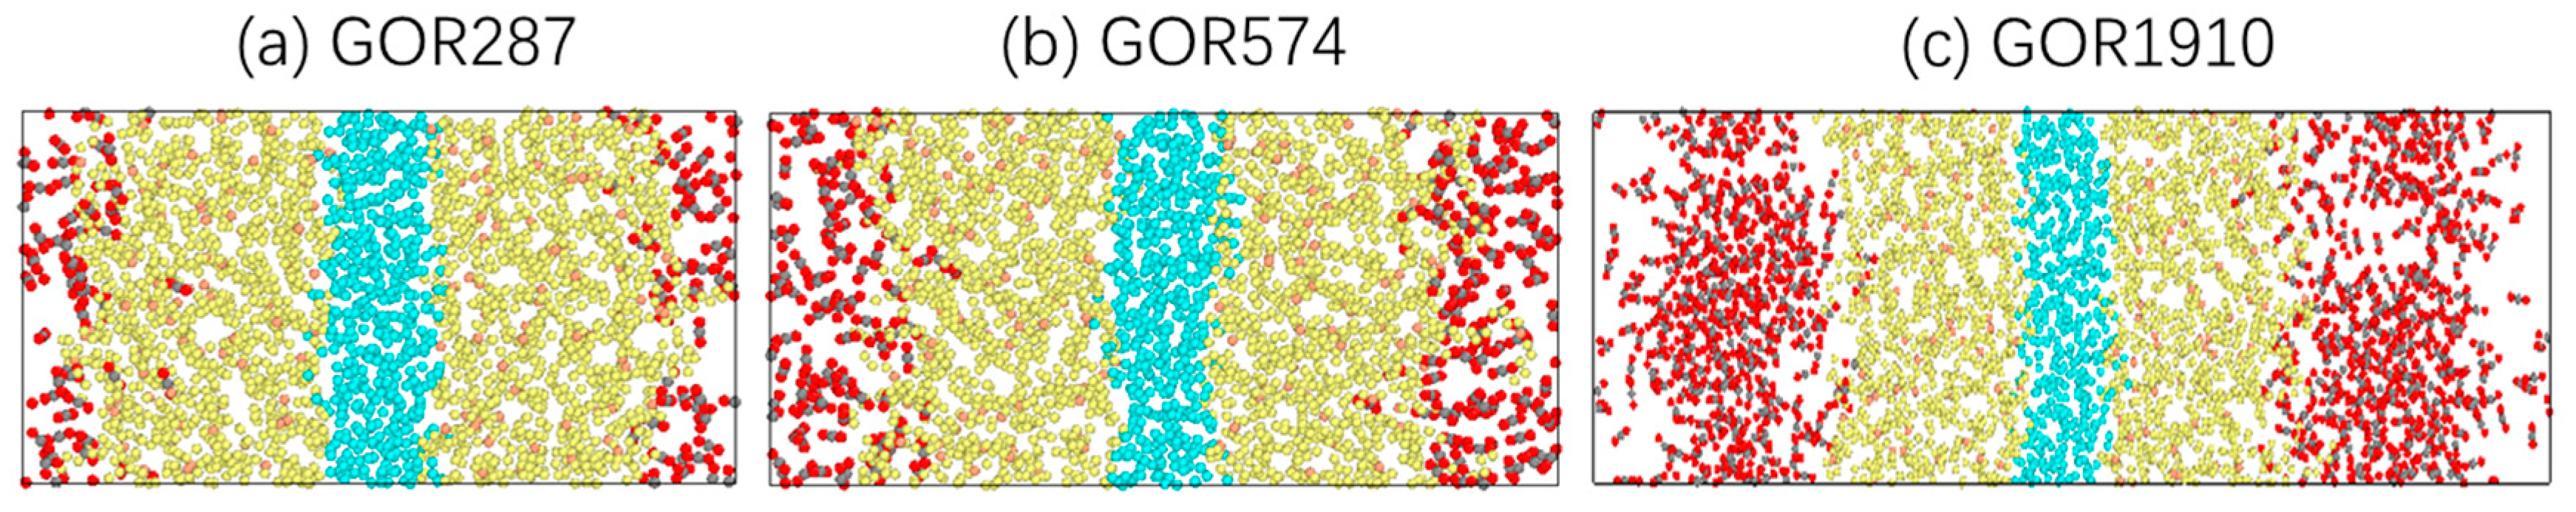
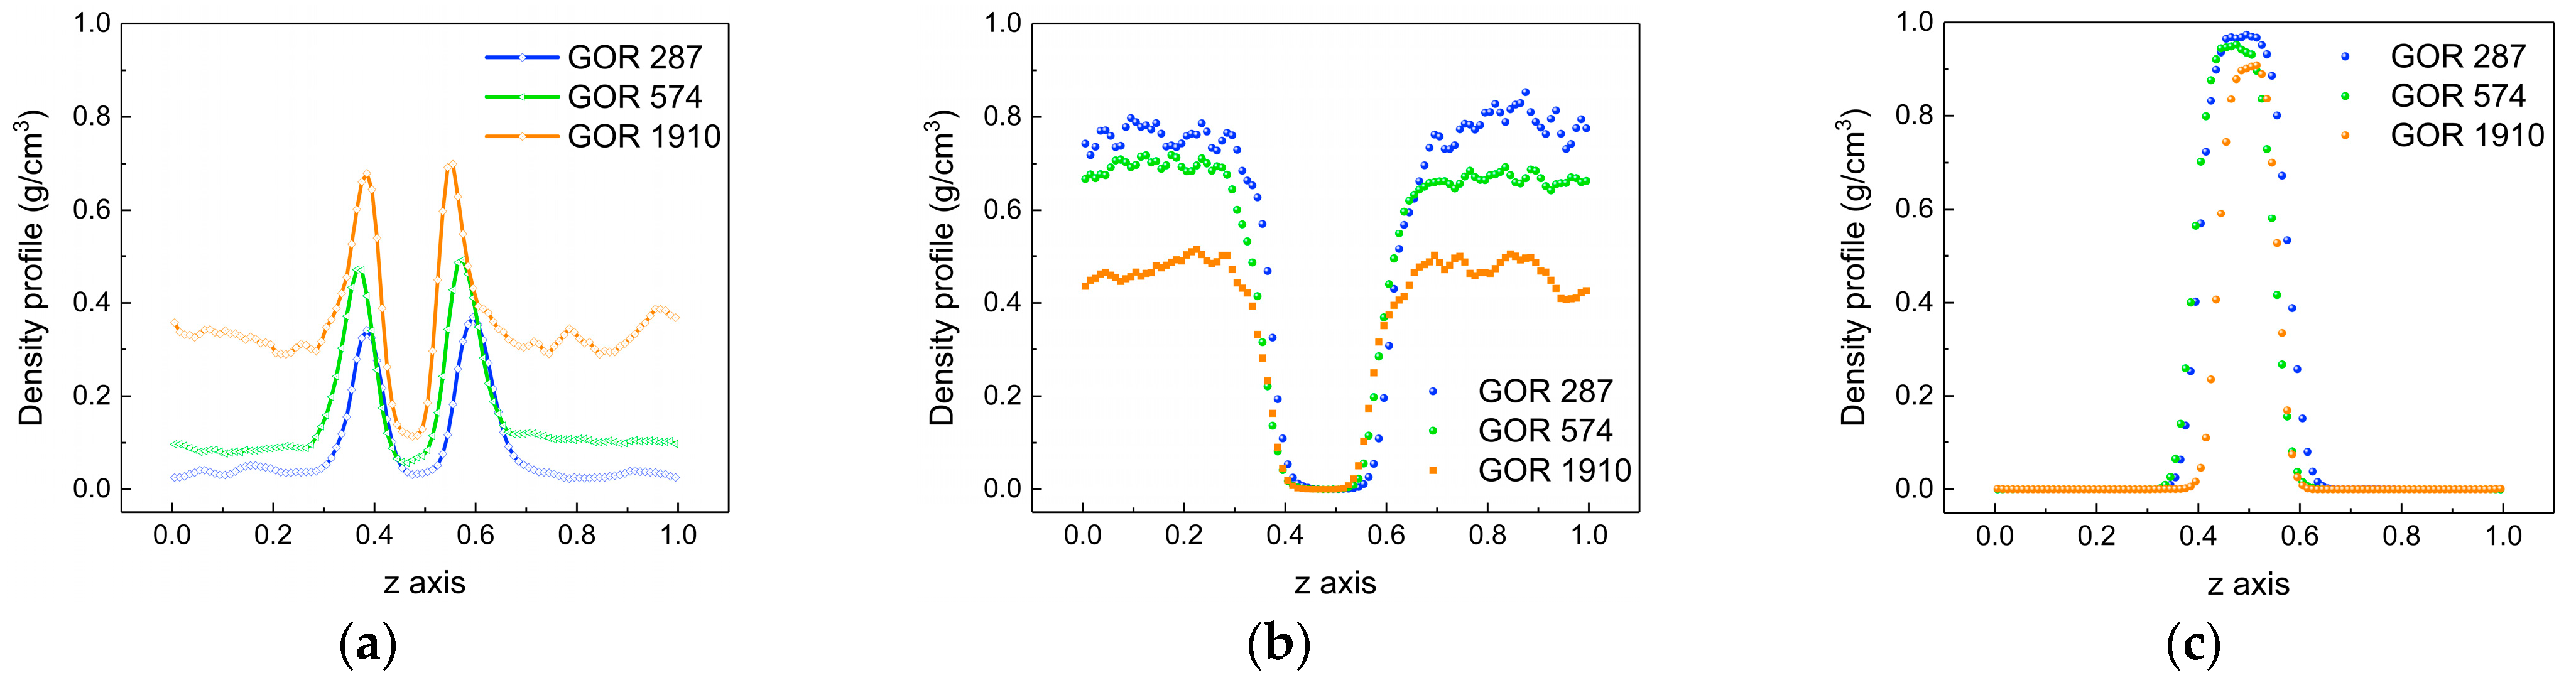
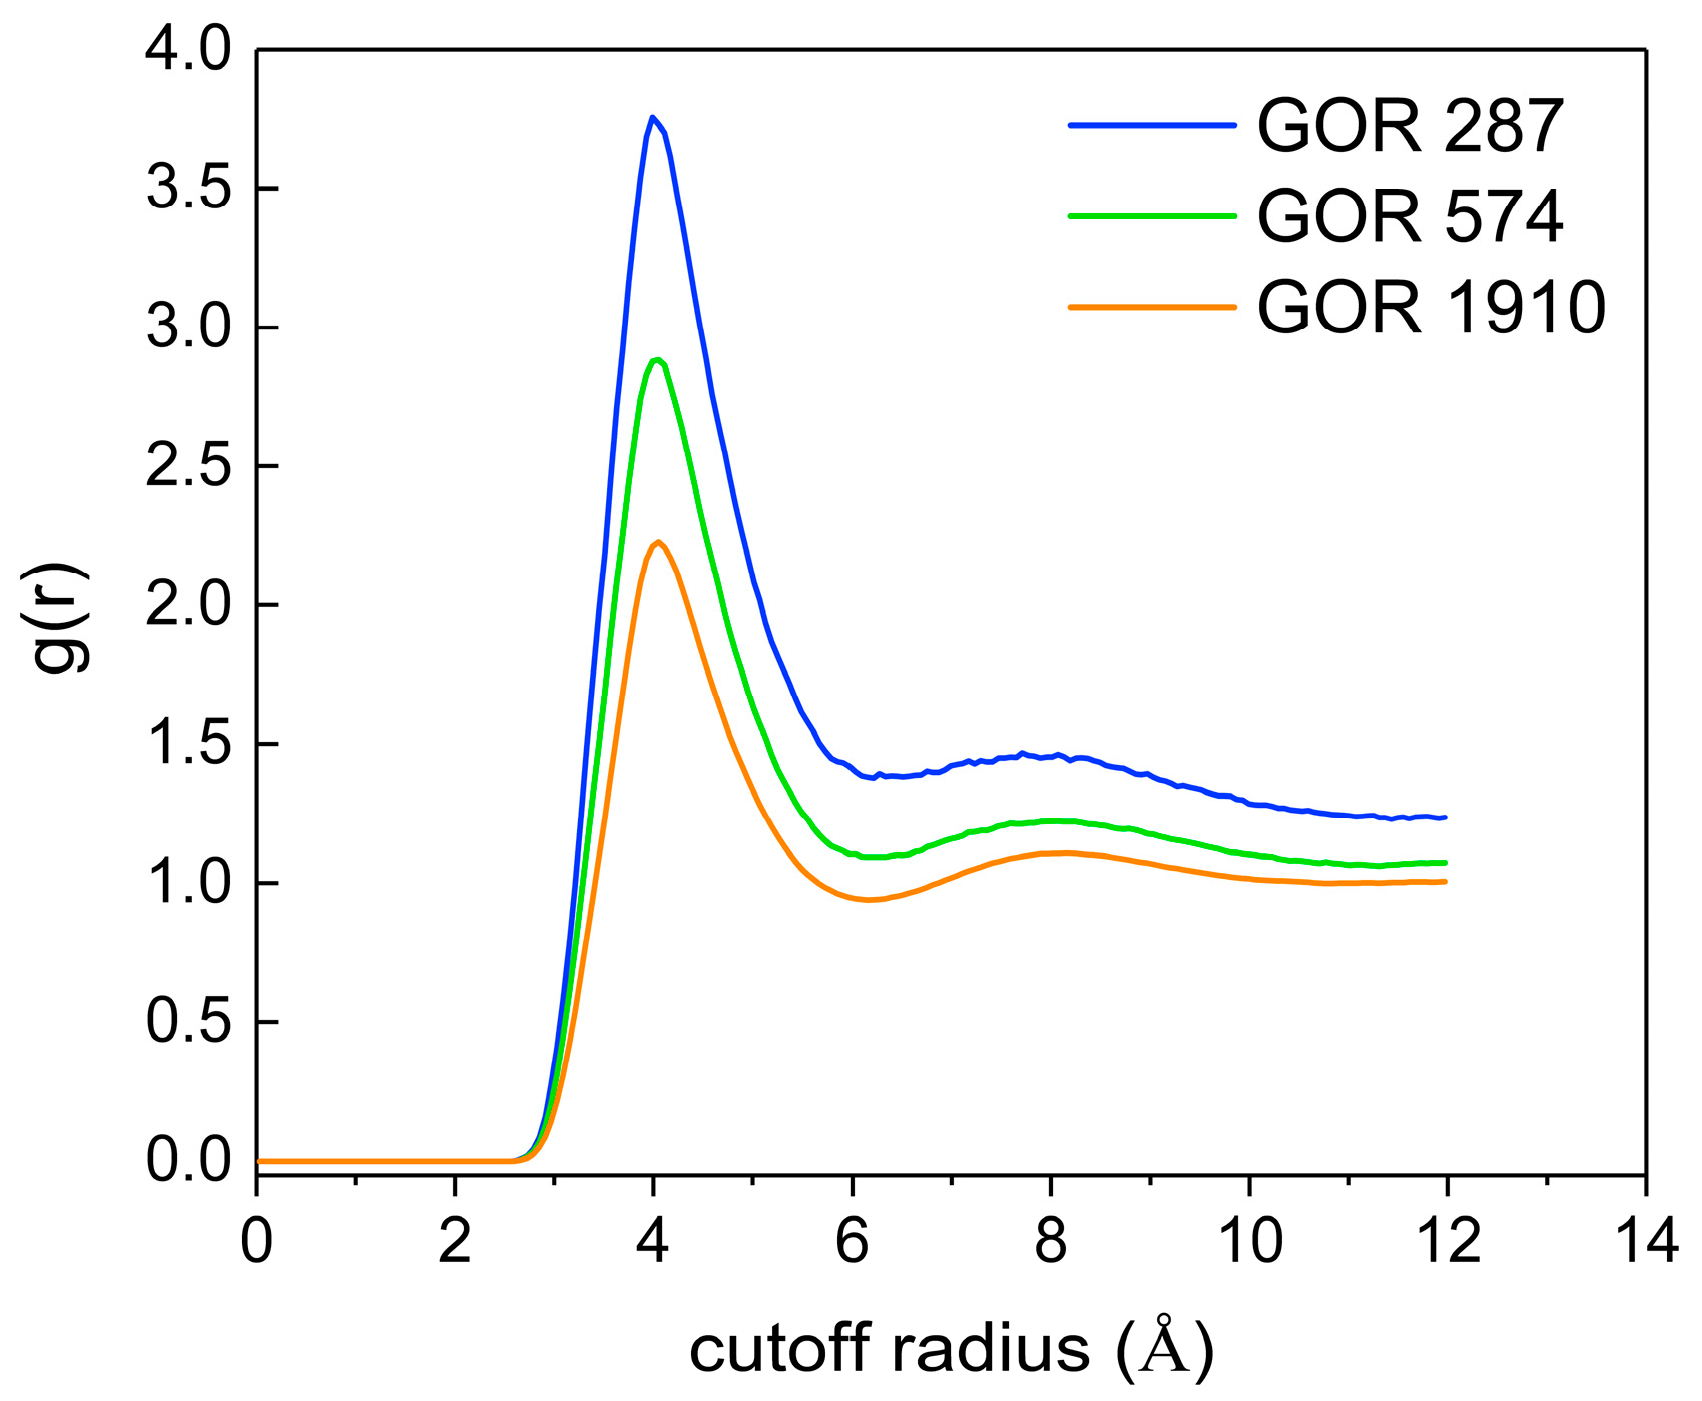
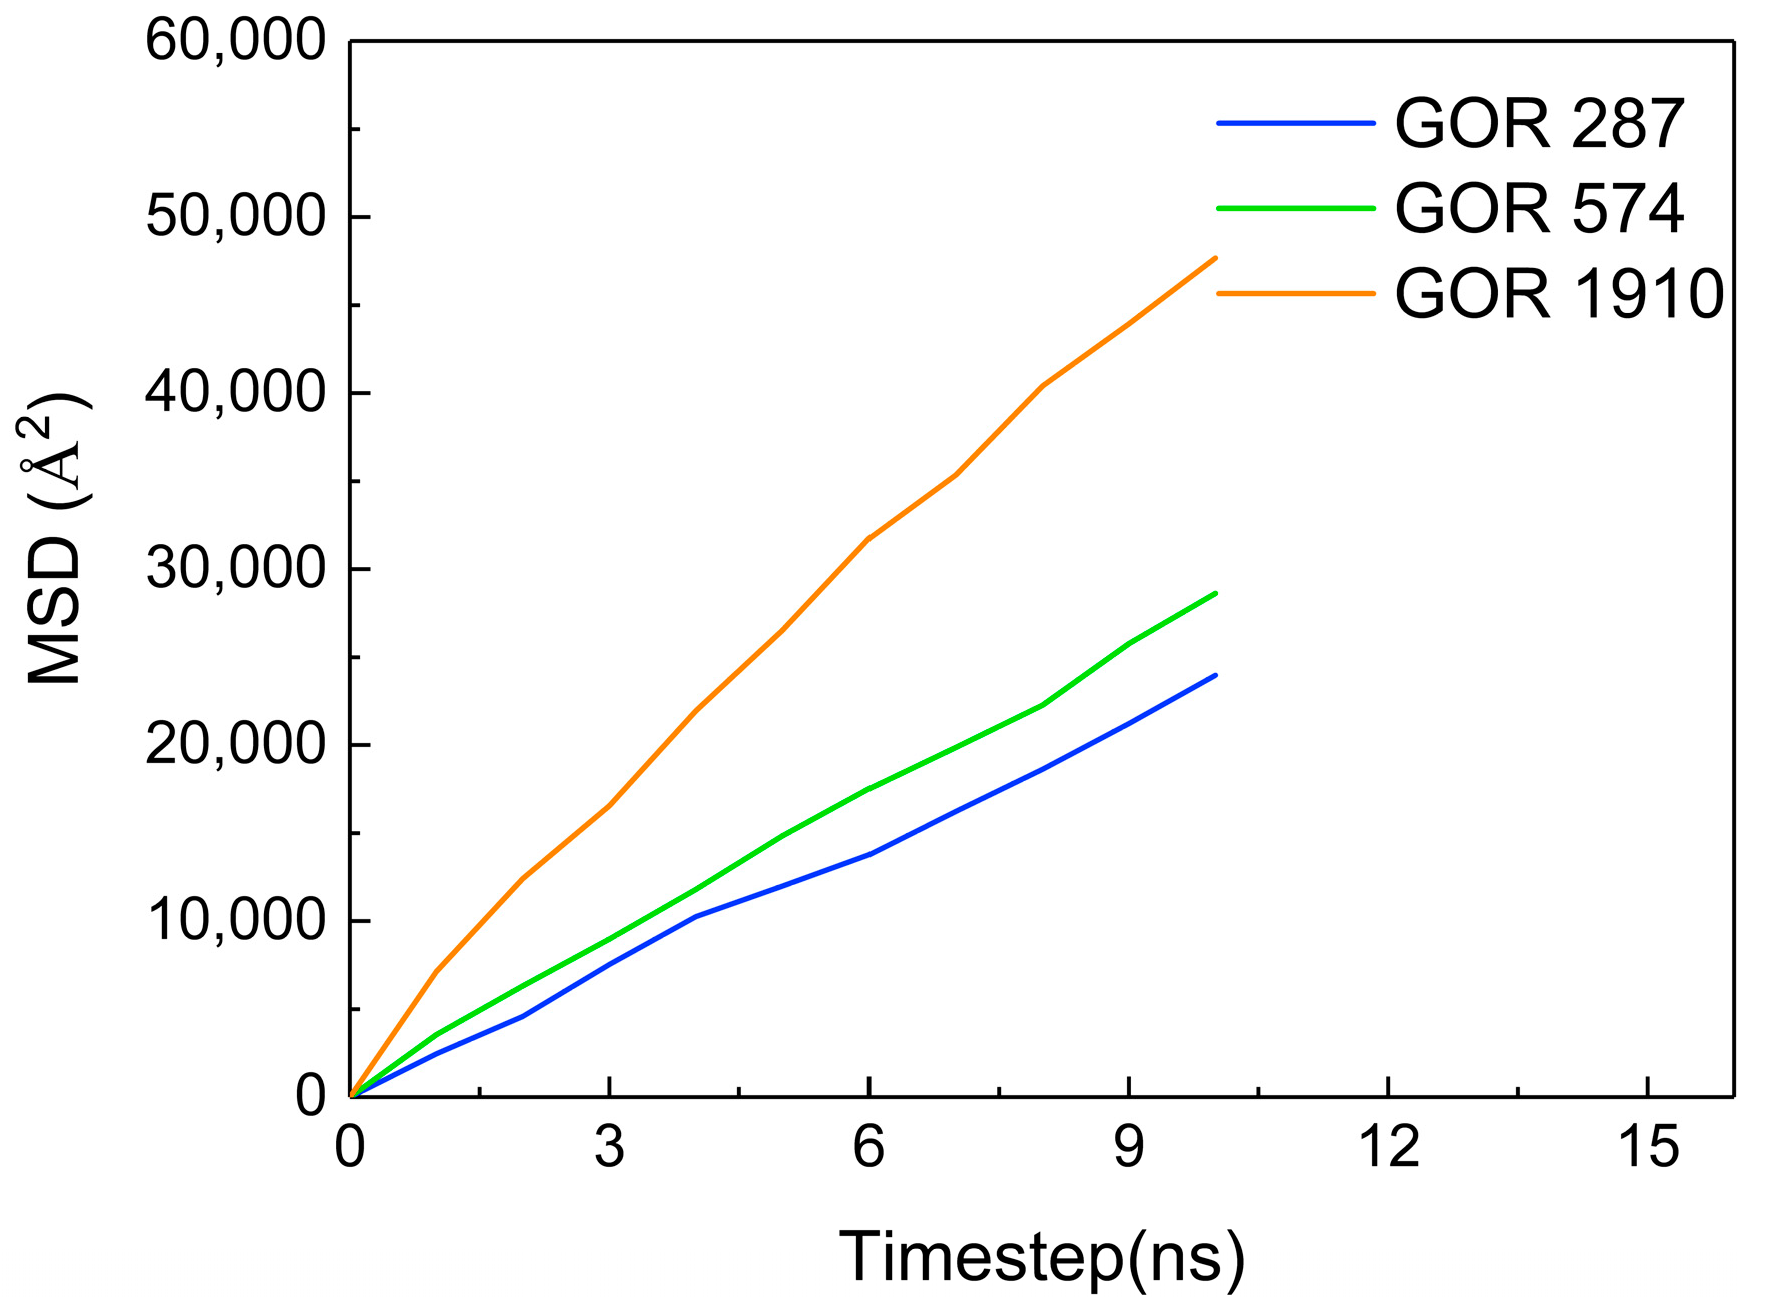
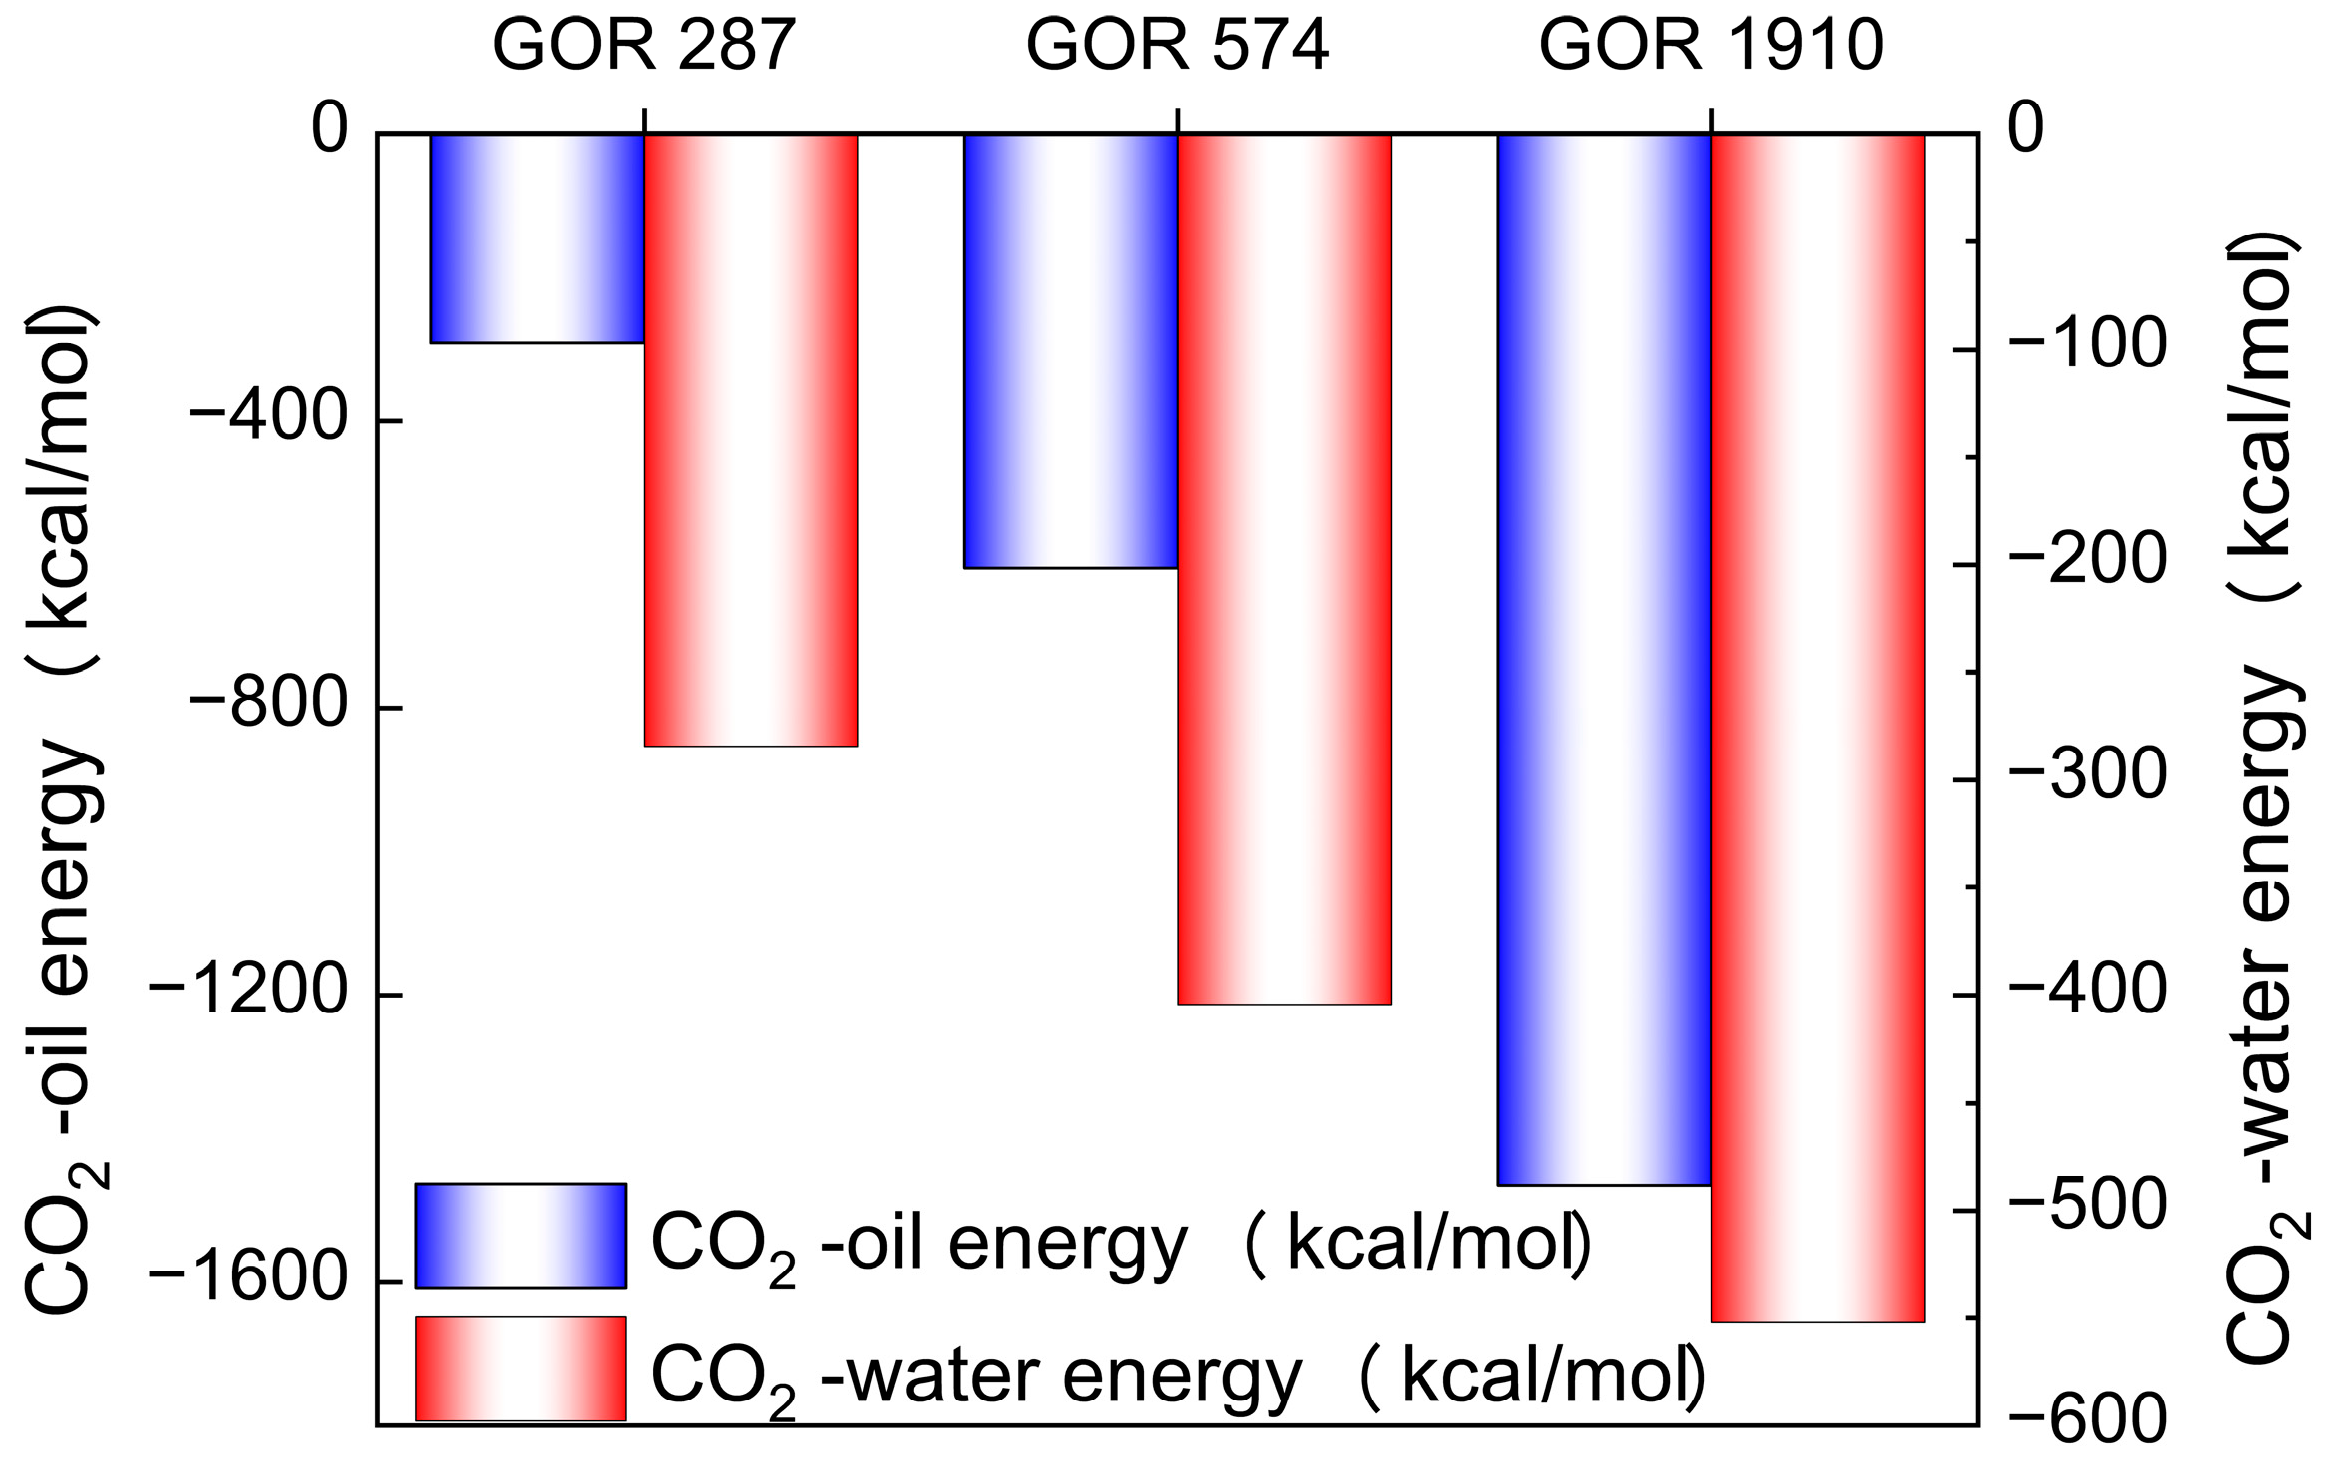
2.2. The Effect of the Gas–Oil Ratio on the Diffusion Process of Carbon Dioxide in the Crude Oil System
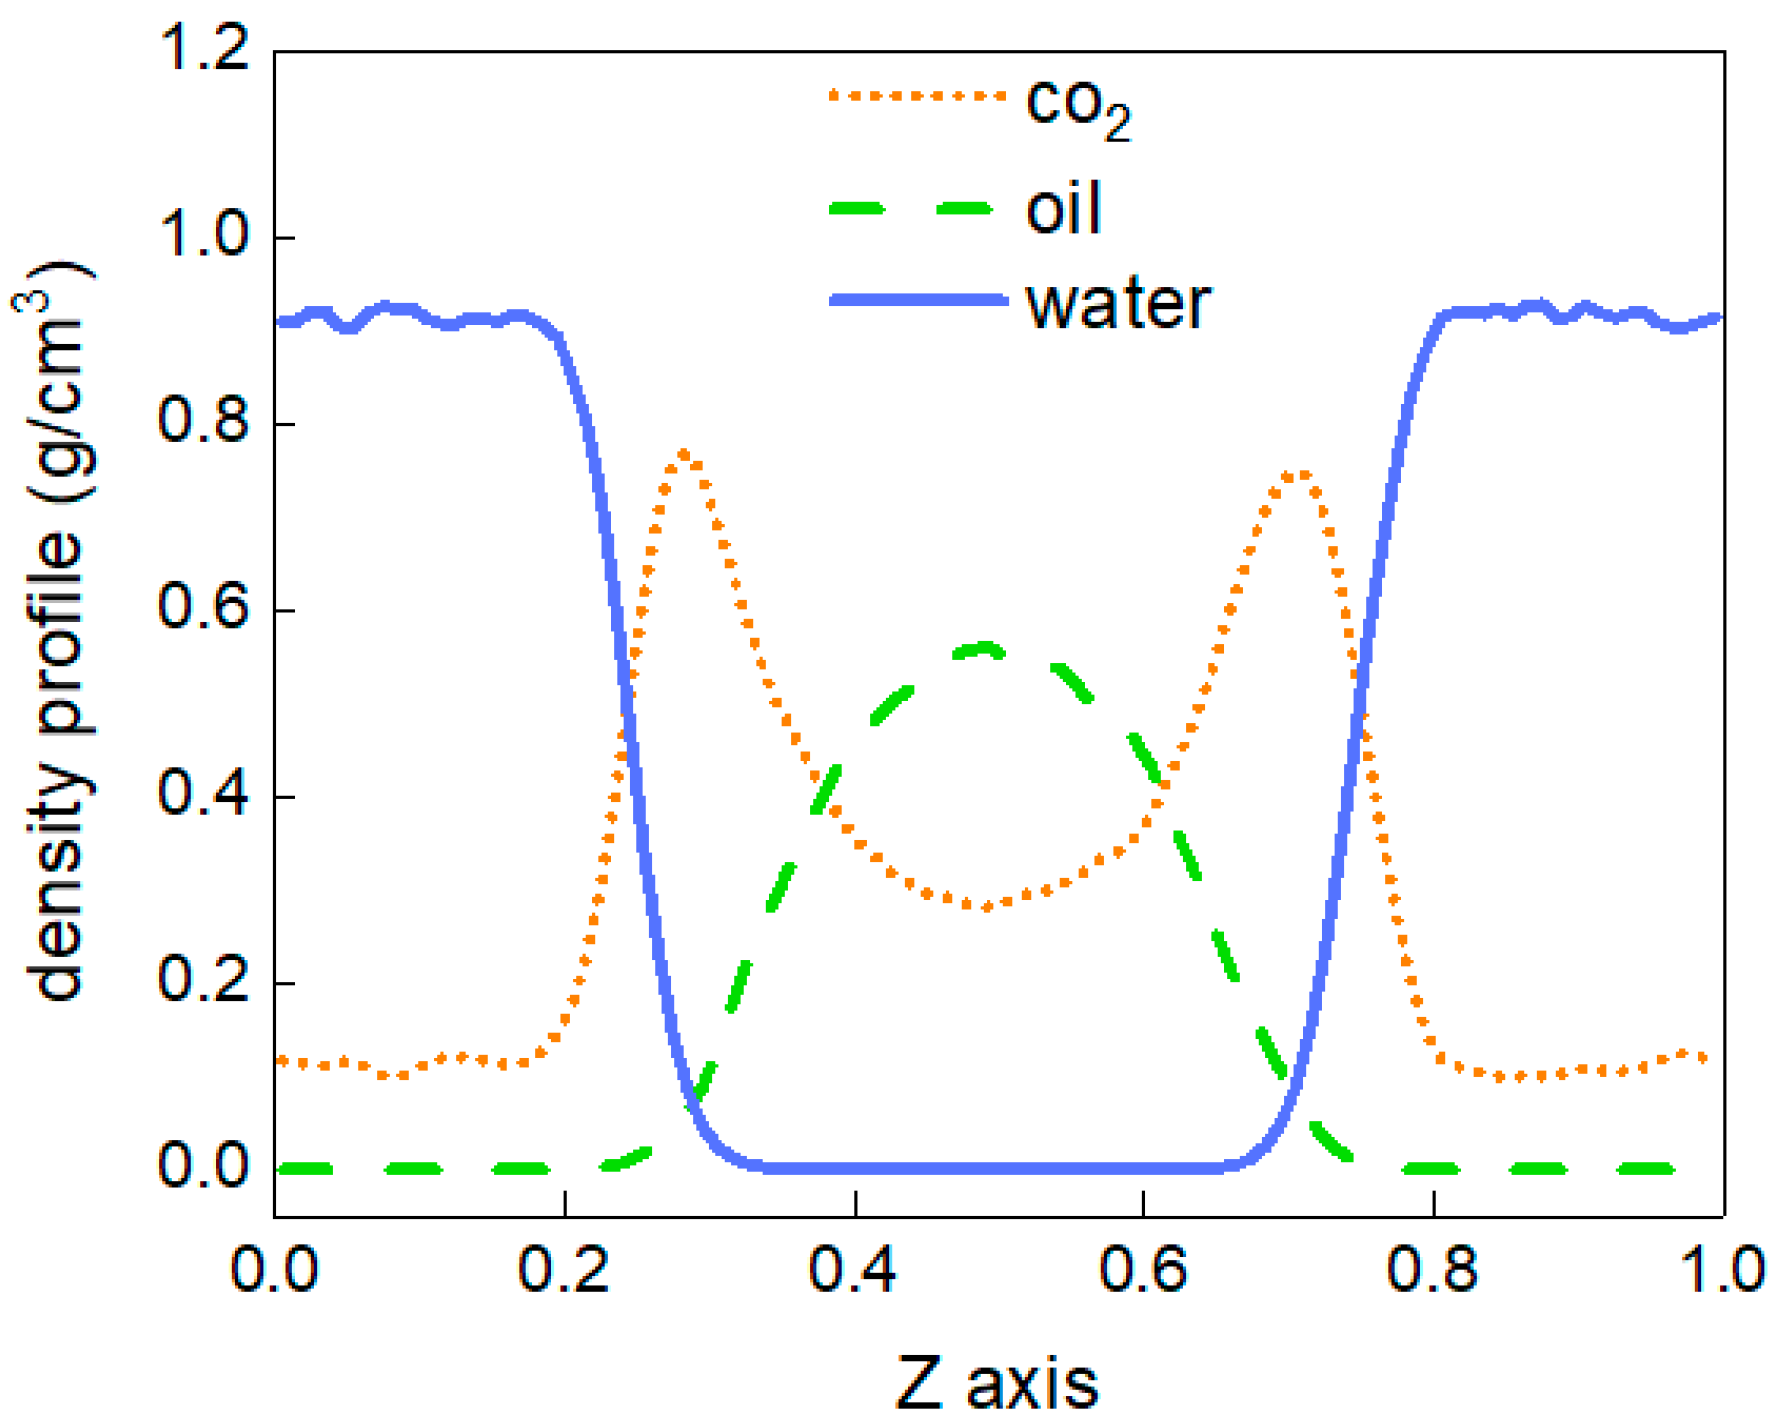
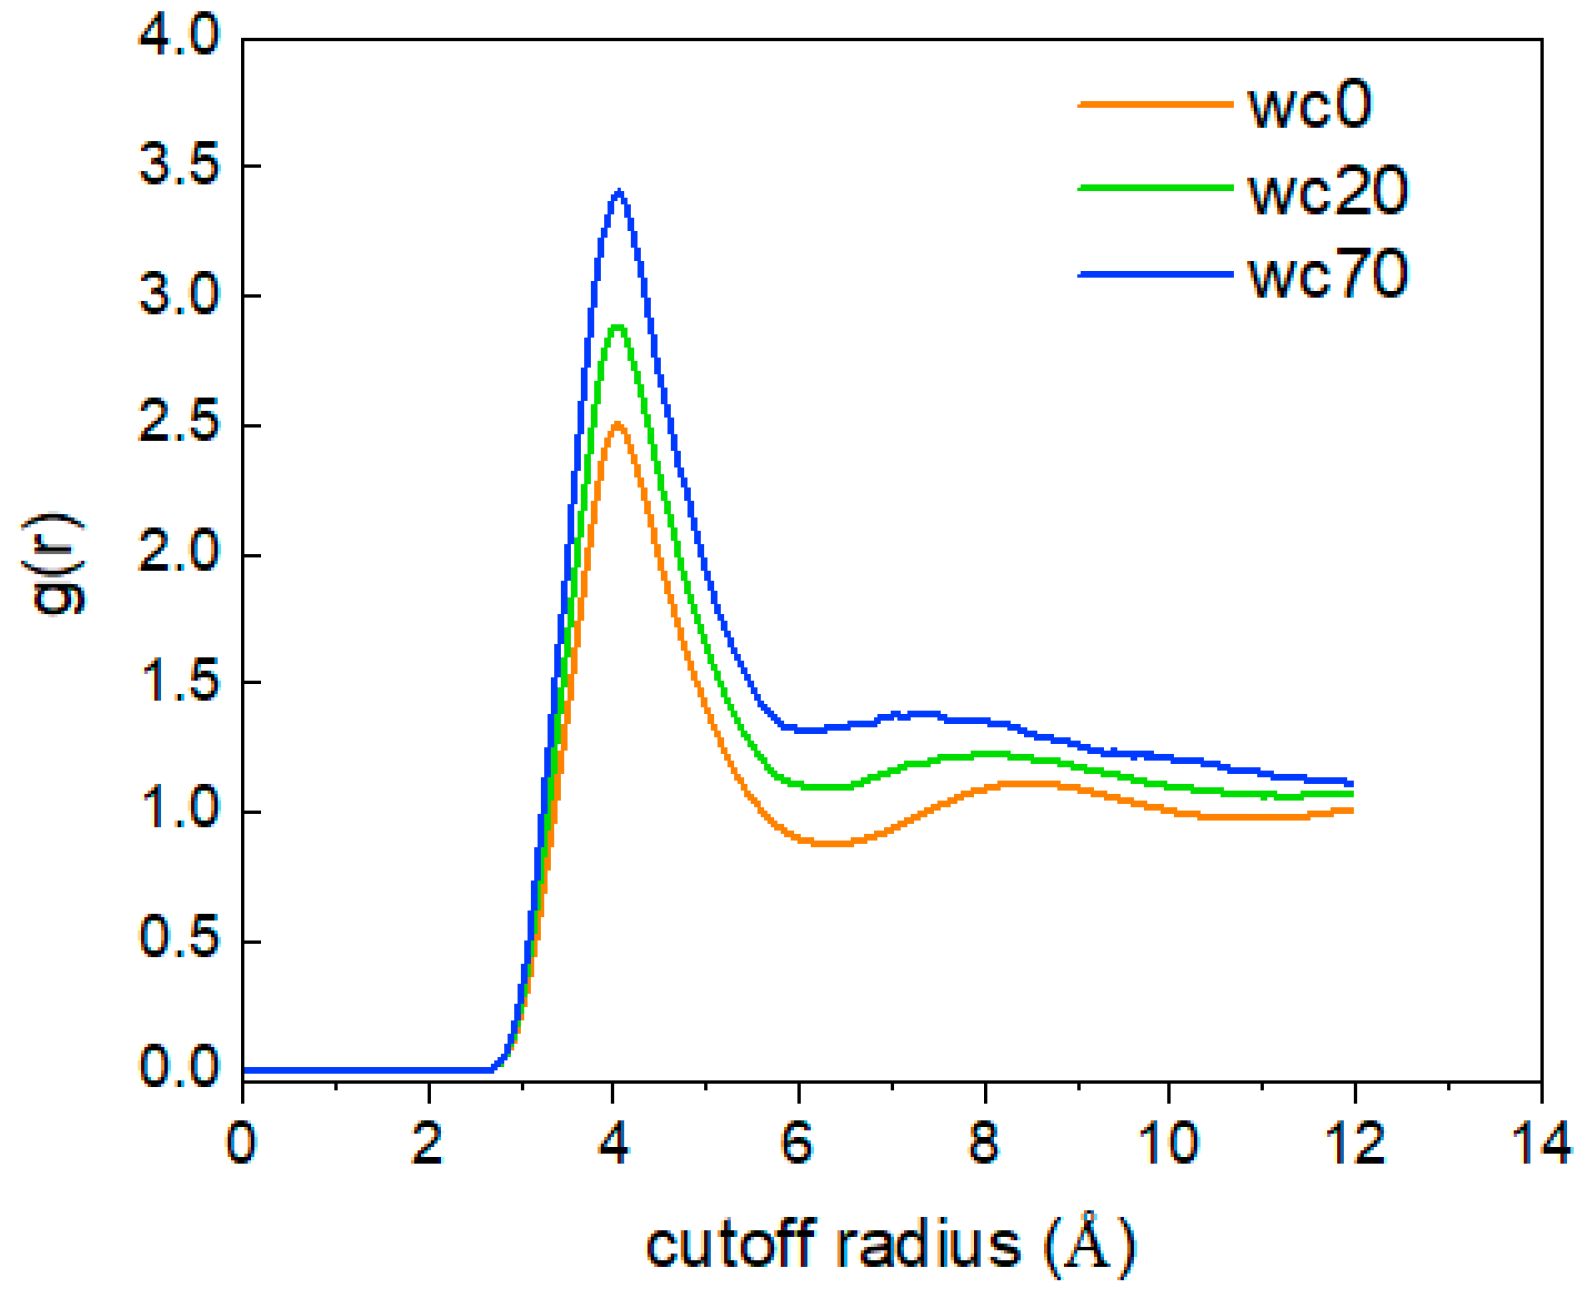
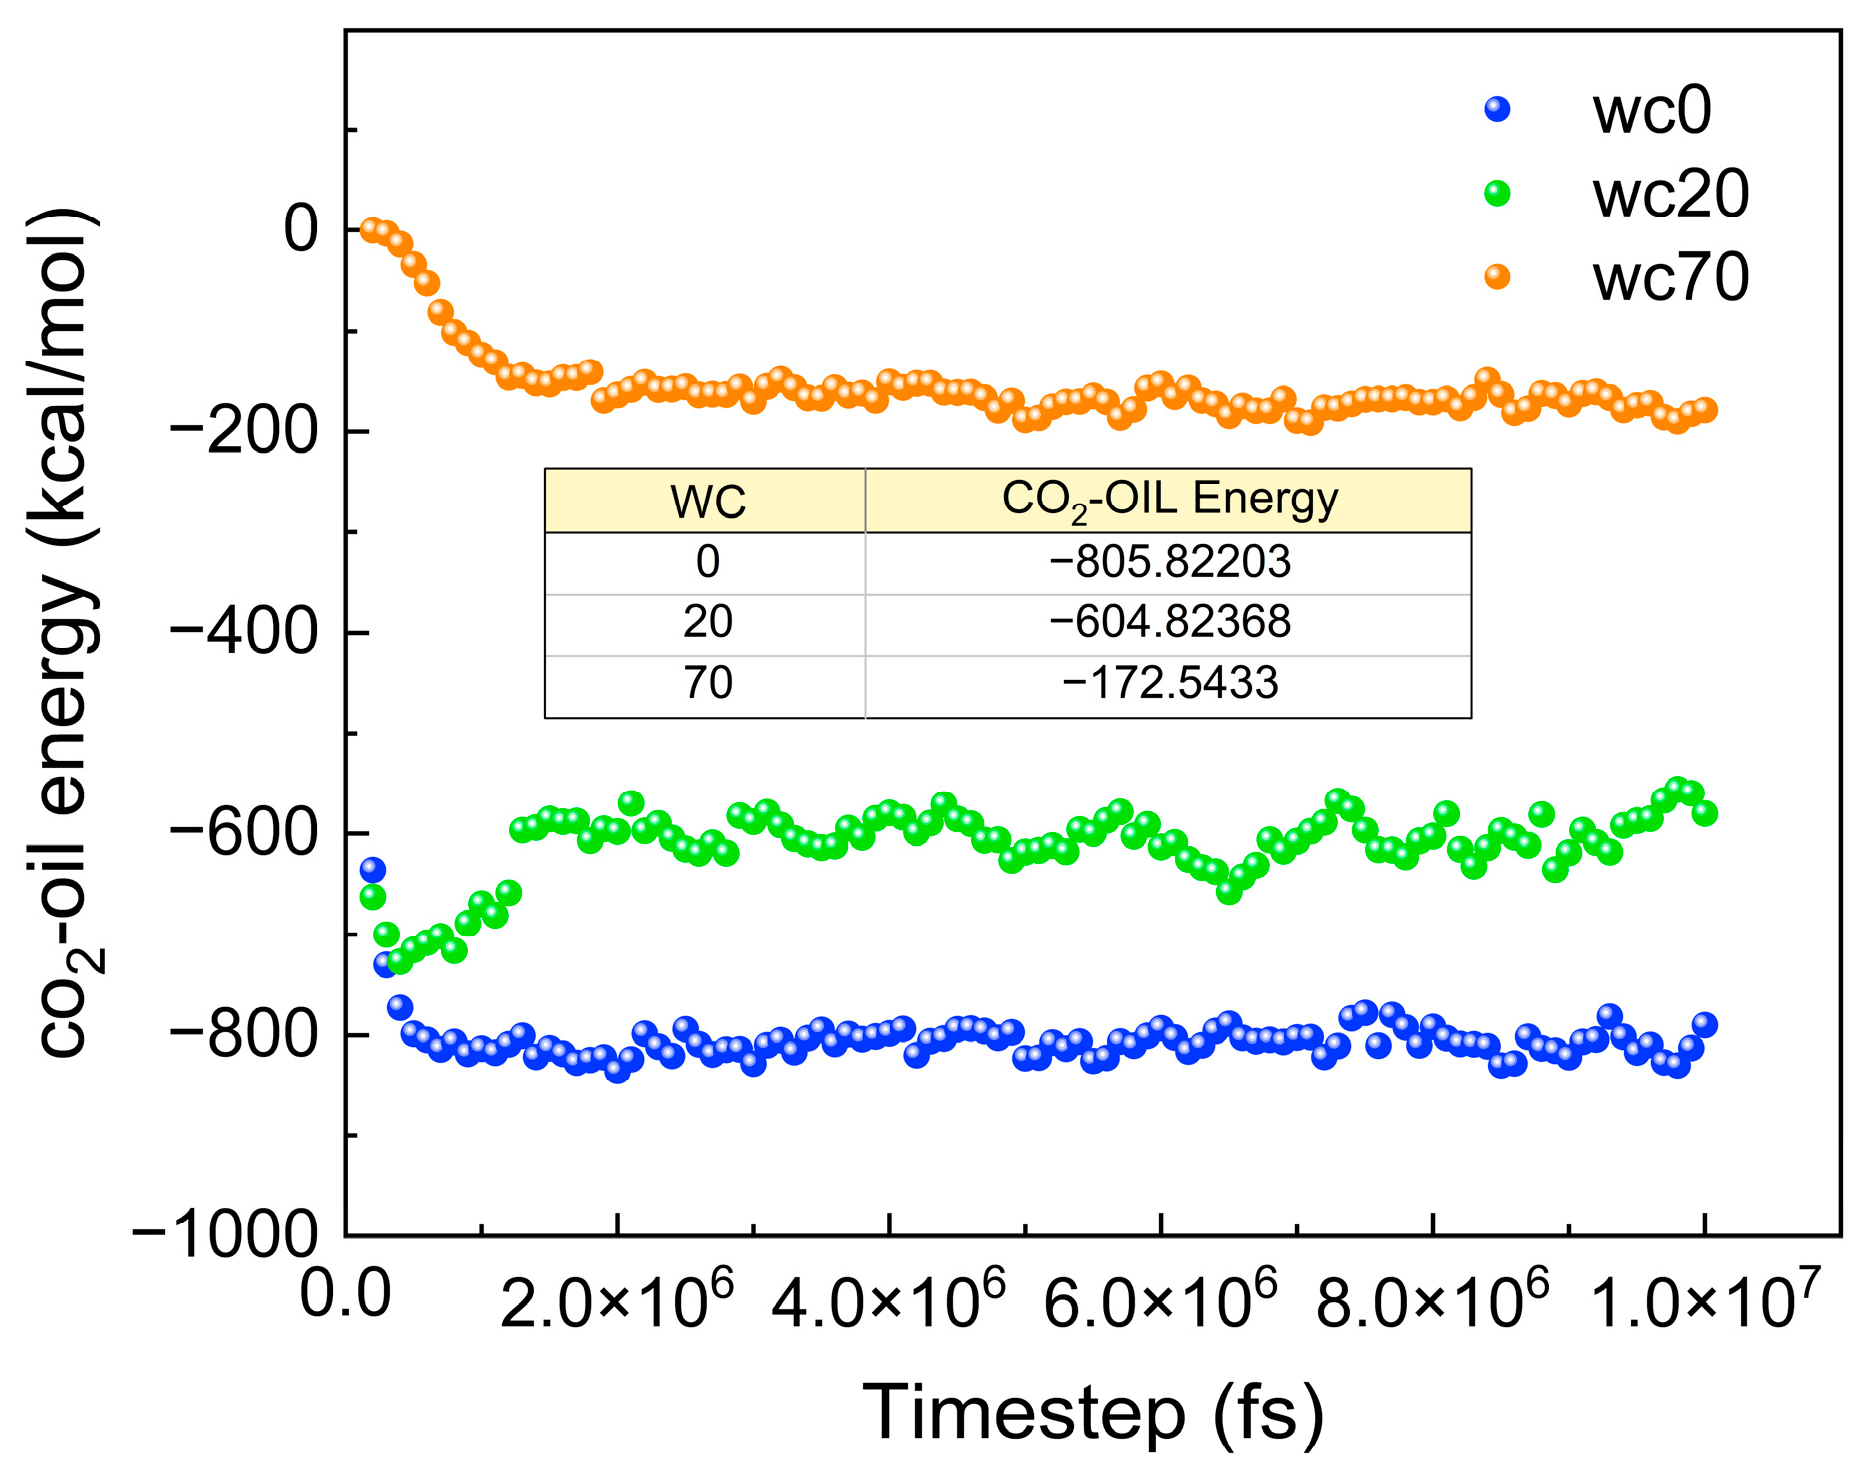
2.3. The Effect of Water Content on the Diffusion Process of Carbon Dioxide in the Crude Oil System
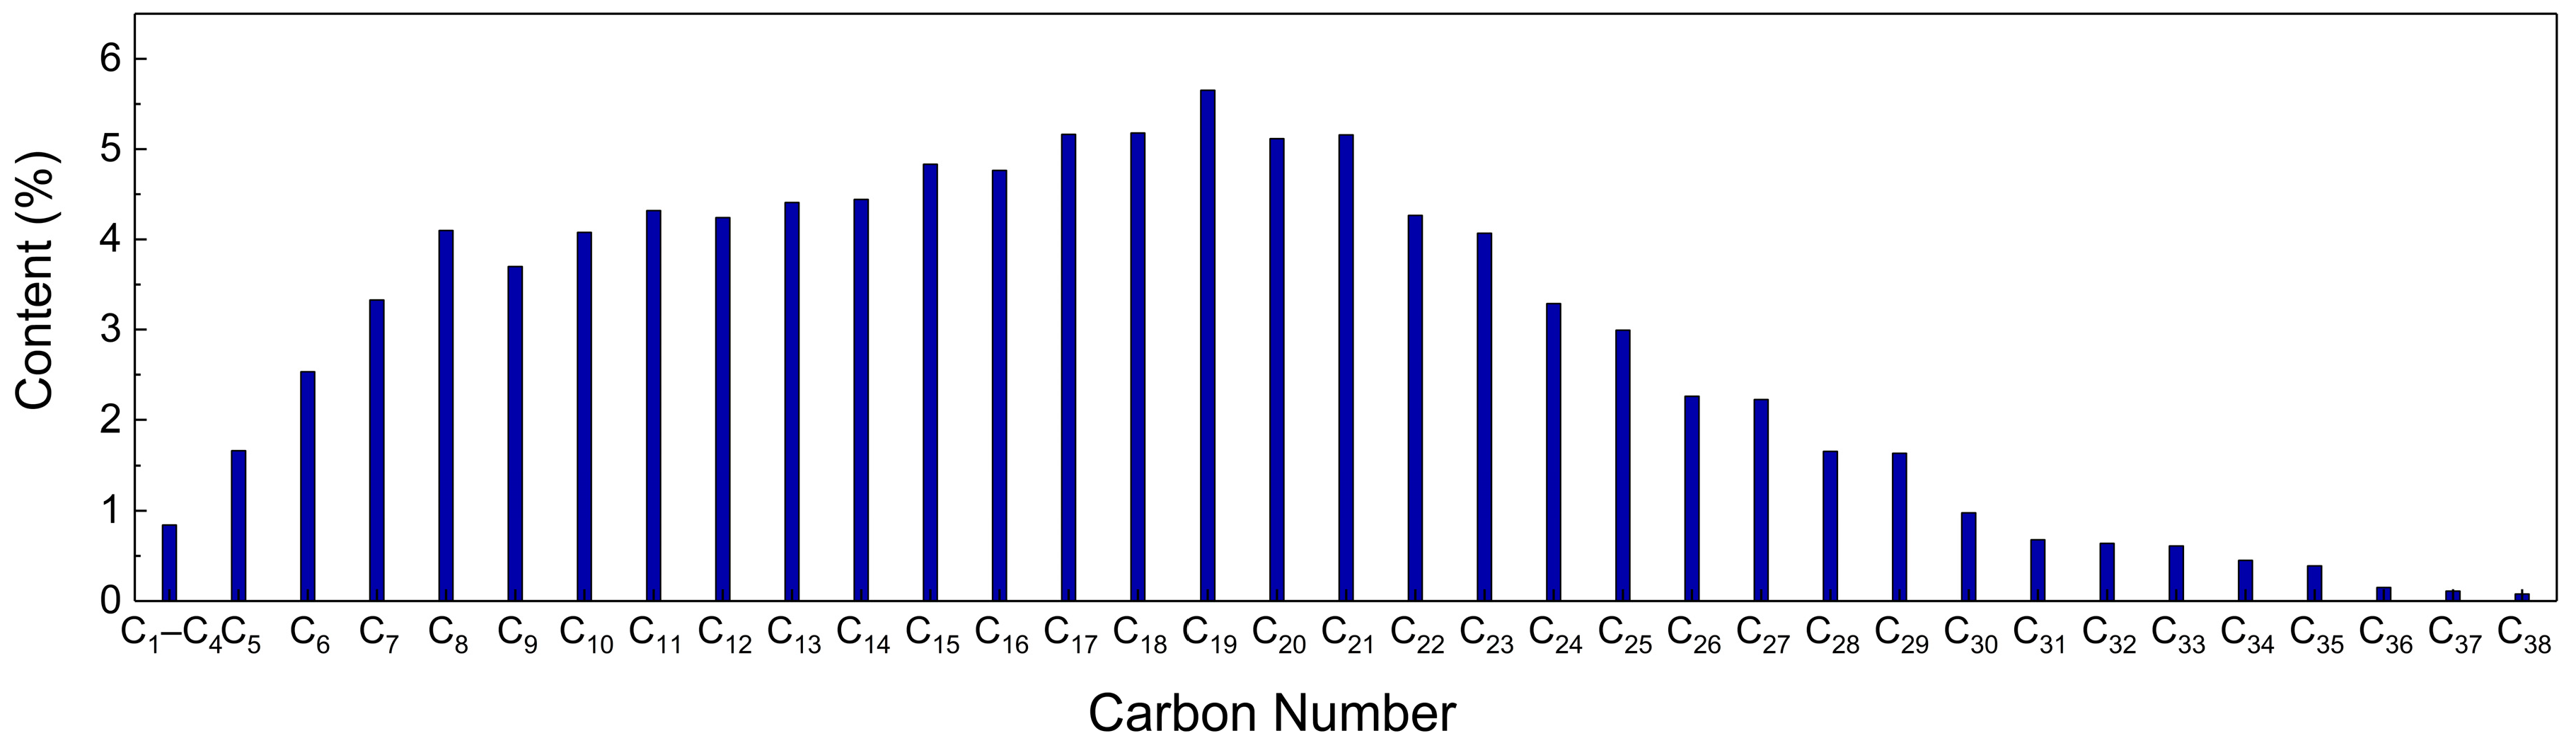
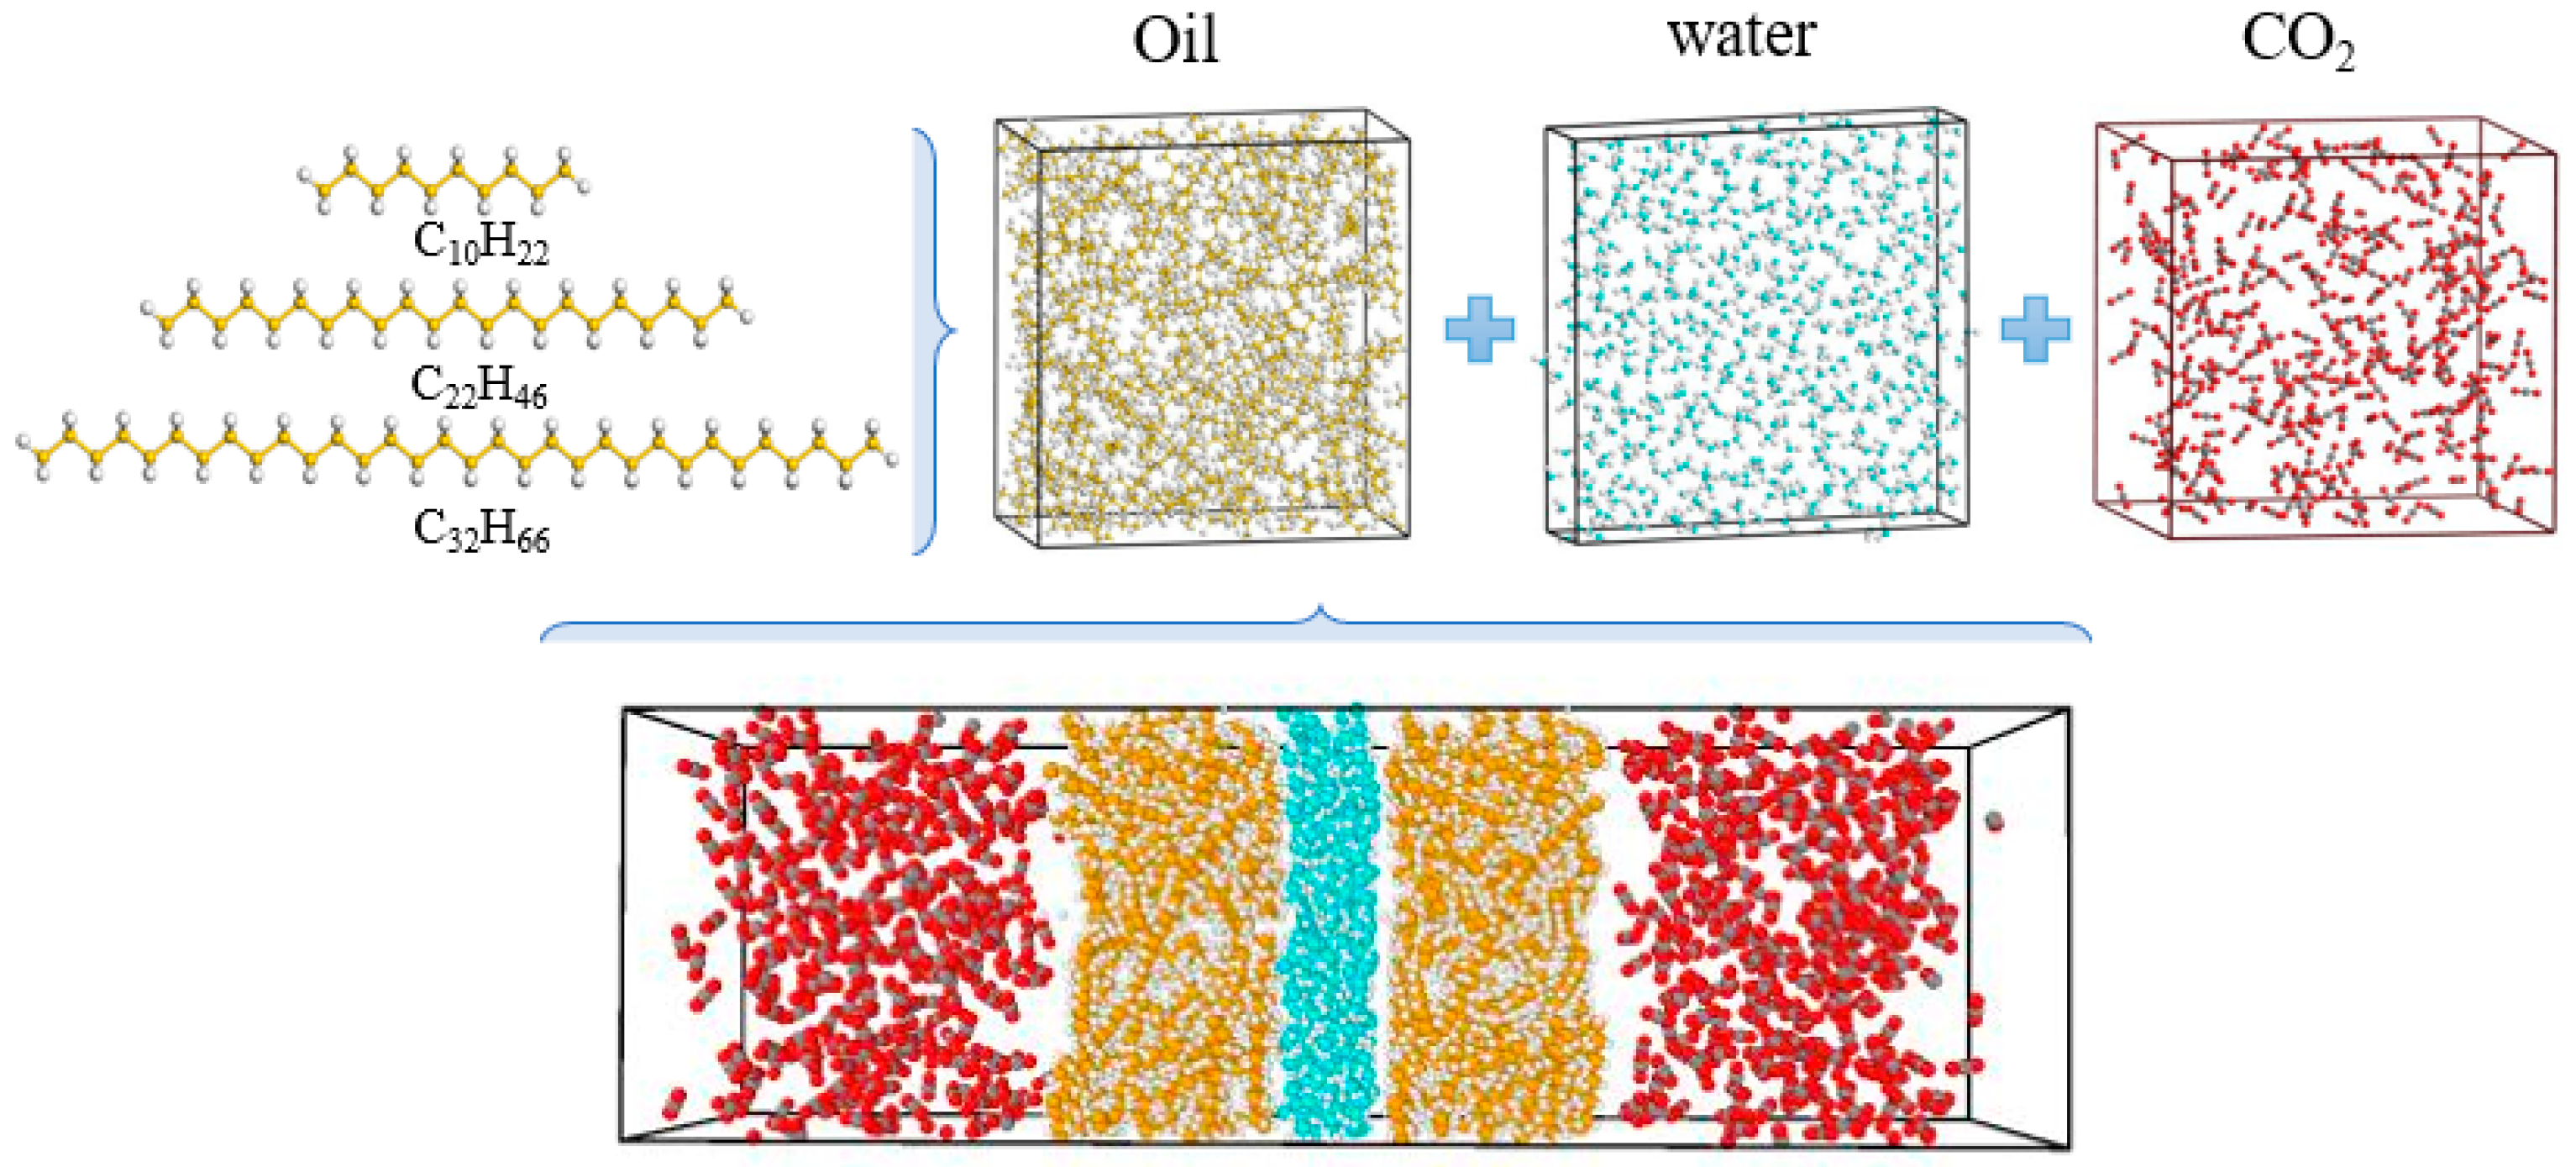
3. Model
4. Simulation Methods and Details
4.1. Force Field
4.2. Simulation Details
5. Conclusions
- (1)
- For fluids produced via CO2 flooding, when the mass transfer of CO2 reaches stability, most of the CO2 molecules are distributed at the oil–water interface, indicating that the force of the oil–water interface on CO2 molecules is greater than that of oil and water molecules on CO2 molecules. Carbon dioxide molecules are more likely to diffuse into the oil phase than the water phase, indicating that the force of oil molecules on CO2 molecules is greater than the force of water molecules on CO2 molecules.
- (2)
- Temperature is one of the main factors affecting the diffusion mass transfer process of CO2 and crude oil in fluids produced via CO2 flooding. The increase in temperature inhibits the diffusion mass transfer of CO2 molecules. The reason is that the increase in temperature makes the random motion of CO2 molecules more intense, thus increasing the distance between CO2 molecules, and oil and water molecules, and resulting in a decrease in the force between CO2 molecules, and oil and water molecules, which decreases the ability of CO2 molecules to undergo diffusion mass transfer.
- (3)
- The gas–oil ratio changes greatly in the early and late stages of oilfield development, and its influence on the diffusion mass transfer of CO2 molecules cannot be ignored. An increase in the gas–oil ratio can enhance the ECO2-oil and ECO2-water, making it easier for CO2 molecules to enter the oil and water phases, and thus promoting the diffusion mass transfer of CO2 molecules.
- (4)
- When the water content changes, the distributions of the arrangements of oil and water molecules change greatly, which has a significant influence on the diffusion mass transfer process of CO2 molecules. The increase in the water content reduces ECO2-oil, thus decreasing the diffusion mass transfer of CO2 in the oil phase.
Author Contributions
Funding
Institutional Review Board Statement
Informed Consent Statement
Data Availability Statement
Conflicts of Interest
Nomenclature
| symbol | parameter | unit |
| Total molecular potential energy function | / | |
| Van der Waals potential energy function | / | |
| Coulomb potential energy function | / | |
| Bond expansion potential energy function | / | |
| Bond bending potential energy function | / | |
| Bond torsion potential energy function | / | |
| The energy parameters | kcal/mol | |
| Reference energy parameters | kcal/mol | |
| The length parameters | Å | |
| Distance between atomic pairs | Å | |
| q | Charge of the atom | e |
| Intermolecular distance of atoms i and j | Å | |
| Elastic constant of bond stretching | Kcal/(mol·Å2) | |
| Elastic constant of bond angle bending. | Kcal/(mol·rad2) | |
| Bond angle | Å | |
| Proper dihedral angle | ° | |
| Force field parameters related to proper dihedral angle | / | |
| Reference bond length | Å | |
| Bond length | Å | |
| Reference bond angle | Å |
References
- Aminu, M.D.; Nabavi, S.A.; Rochelle, C.A.; Manovic, V. A review of developments in carbon dioxide storage. Appl. Energy 2017, 208, 1389–1419. [Google Scholar] [CrossRef]
- Leung, D.Y.C.; Caramanna, G.; Maroto-Valer, M.M. An overview of current status of carbon dioxide capture and storage technologies. Renew. Sustain. Energy Rev. 2014, 39, 426–443. [Google Scholar] [CrossRef]
- de Coninck, H.; Benson, S.M. Carbon dioxide capture and storage: Issues and prospects. Annu. Rev. Environ. Resour. 2014, 39, 243–270. [Google Scholar] [CrossRef]
- Mohammed, S.; Mansoori, G.A. Molecular insights on the interfacial and transport properties of supercritical CO2/brine/crude oil ternary system. J. Mol. Liq. 2018, 263, 268–273. [Google Scholar] [CrossRef]
- Du, F.; Ma, H.; Gu, Y. Three different periods of CO2 dissolution into a light crude oil. Can. J. Chem. Eng. 2019, 97, 330–343. [Google Scholar] [CrossRef]
- Kumar, N.; Sampaio, M.A.; Ojha, K.; Hoteit, H.; Mandal, A. Fundamental aspects, mechanisms and emerging possibilities of CO2 miscible flooding in enhanced oil recovery: A review. Fuel 2022, 330, 125633. [Google Scholar] [CrossRef]
- Song, Y.; Xu, Y.; Wang, Z. An experimental study on efficient demulsification for produced emulsion in alkaline/surfactant/polymer flooding. J. Energy Resour. Technol. 2022, 144, 093001. [Google Scholar] [CrossRef]
- Cheng, Q.; Li, Z.; Song, D.; Gao, W.; Wu, H.; Xie, H.; Chen, Y.; Gu, L.; Liu, Y. Study on weak link of energy utilization in oil transfer station system: Insights from energy level analysis method. Energy Rep. 2020, 6, 1097–1105. [Google Scholar] [CrossRef]
- Wang, Z.; Liu, Y.; Li, J.; Zhuge, X.; Zhang, L. Study on Two-Phase Oil-Water Gelling Deposition Behavior in Low-Temperature Transportation. Energy Fuels 2016, 30, 4570–4582. [Google Scholar] [CrossRef]
- Hu, R.; Trusler, J.P.M.; Crawshaw, J.P. Effect of CO2 dissolution on the rheology of a heavy oil/water emulsion. Energy Fuels 2017, 31, 3399–3408. [Google Scholar] [CrossRef]
- Chen, J.; He, L.; Luo, X.; Zhang, C. Foaming of crude oil: Effect of acidic components and saturation gas. Colloids Surf. A Physicochem. Eng. Asp. 2018, 553, 432–438. [Google Scholar] [CrossRef]
- Wu, X.; Zhang, Y.; Zhang, K.; Liu, B.; Zuo, J.Y.; Chen, G.; Xiao, P. An experimental investigation of liquid CO2-in-water emulsions for improving oil recovery. Fuel 2021, 288, 119734. [Google Scholar] [CrossRef]
- Nowrouzi, I.; Manshad, A.K.; Mohammadi, A.H. Effects of dissolved carbon dioxide and ions in water on the dynamic interfacial tension of water and oil in the process of carbonated smart water injection into oil reservoirs. Fuel 2019, 243, 569–578. [Google Scholar] [CrossRef]
- Hawthorne, S.B.; Miller, D.J. A comparison of crude oil hydrocarbon mobilization by vaporization gas drive into methane, ethane, and carbon dioxide at 15.6 MPa and 42 °C. Fuel 2019, 249, 392–399. [Google Scholar] [CrossRef]
- Lashkarbolooki, M.; Riazi, M.; Ayatollahi, S. Effect of CO2 and natural surfactant of crude oil on the dynamic interfacial tensions during carbonated water flooding: Experimental and modeling investigation. J. Pet. Sci. Eng. 2017, 159, 58–67. [Google Scholar] [CrossRef]
- Ferreira, F.A.V.; Barbalho, T.C.S.; Araújo, I.R.S.; Oliveira, H.N.M.; Chiavone-Filho, O. Characterization, pressure-volume-temperature properties, and phase behavior of a condensate gas and crude oil. Energy Fuels 2018, 32, 5643–5649. [Google Scholar] [CrossRef]
- Zhang, W.; Guo, P.; Ge, X.; Du, J.; Wang, Z. Influence factors on CO2 solubility in cycloalkanes and cycloalkane volume expansion: Temperature, pressure and molecular structure. J. Mol. Liq. 2021, 332, 115859. [Google Scholar] [CrossRef]
- Zhang, X.; Zheng, W.; Zhang, T.; Ge, J.; Jiang, P.; Zhang, G. CO2 in water foam stabilized with CO2-dissolved surfactant at high pressure and high temperature. J. Pet. Sci. Eng. 2019, 178, 930–936. [Google Scholar] [CrossRef]
- Li, X.; Wang, P.; Wang, S.; Feng, Q.; Xue, Q. Dynamics and miscible behaviors of hydrocarbon gas and crude oil in nanoslits: Effects of light gas type and crude oil components. Chem. Eng. J. 2021, 405, 127012. [Google Scholar] [CrossRef]
- Li, X.; Wang, P.; Wang, S.; Feng, Q.; Xue, Q. The miscible behaviors and mechanism of CO2/CH4/C3H8/N2 and crude oil in nanoslits: A molecular dynamics simulation study. Fuel 2021, 304, 121461. [Google Scholar]
- Li, B.; Liu, G.; Xing, X.; Chen, L.; Lu, X.; Teng, H.; Wang, J. Molecular dynamics simulation of CO2 dissolution in heavy oil resin-asphaltene. J. CO2 Util. 2019, 33, 303–310. [Google Scholar] [CrossRef]
- Li, C.; Pu, H.; Zhong, X.; Li, Y.; Zhao, J.X. Interfacial interactions between Bakken crude oil and injected gases at reservoir temperature: A molecular dynamics simulation study. Fuel 2020, 276, 118058. [Google Scholar] [CrossRef]
- Song, J.; Zhu, Z.; Liu, L. Mechanism of Hexane Displaced by Supercritical Carbon Dioxide: Insights from Molecular Simulations. Molecules 2022, 27, 8340. [Google Scholar] [CrossRef] [PubMed]
- Tang, J.; Li, Q.; Wang, S.; Yu, H. Thermo-economic optimization and comparative analysis of different organic flash cycles for the supercritical CO2 recompression Brayton cycle waste heat recovery. Energy 2023, 278, 128002. [Google Scholar] [CrossRef]
- Gan, Y.; Cheng, Q.; Wang, Z.; Yang, J.; Sun, W.; Liu, Y. Molecular dynamics simulation of the microscopic mechanisms of the dissolution, diffusion and aggregation processes for waxy crystals in crude oil mixtures. J. Pet. Sci. Eng. 2019, 179, 56–69. [Google Scholar] [CrossRef]
- Wang, Q.; Liu, L.; Liu, C.; Song, J.; Gao, X. Size effect in determining the water diffusion rate in carbon nanotubes. J. Mol. Liq. 2021, 334, 116034. [Google Scholar] [CrossRef]
- Bhatia, S.K.; Bonilla, M.R.; Nicholson, D. Molecular transport in nanopores: A theoretical perspective. Phys. Chem. Chem. Physicsa 2011, 13, 15350–15383. [Google Scholar] [CrossRef]
- Chen, Y.; Zhang, L.; Sun, R.; Liang, H.; Sun, N.; Sun, L. Comparison of crude oil properties in produced fluids from CO2 flooding and H2O flooding. J. Pet. Process. 2013, 29, 508–512. [Google Scholar]
- Yang, S.L.; Hang, D.Z.; Sun, R.; Lv, W.F.; Wu, M.; Deng, H. Extraction of crude oil by CO2 and its effect on crude oil viscosity. J. China Univ. Pet. (Nat. Sci. Ed.) 2009, 33, 85–88. [Google Scholar]
- Sun, G.; Li, C.; Yang, S.; Yang, F.; Chen, Y. Experimental investigation of the rheological properties of a typical waxy crude oil treated with supercritical CO2 and the stability change in its emulsion. Energy Fuels 2019, 33, 4731–4739. [Google Scholar] [CrossRef]
- Jang, Y.H.; Blanco, M.; Creek, J.; Tang, Y.; Goddard, W.A. Wax inhibition by comb-like polymers: Support of the incorporation− perturbation mechanism from molecular dynamics simulations. J. Phys. Chem. B 2007, 111, 13173–13179. [Google Scholar] [CrossRef] [PubMed]
- Gan, Y.; Cheng, Q.; Chu, S.; Wang, Z.; Luan, G.; Sun, W.; Wang, S.; Liu, C.; Li, Q.; Liu, Y. Molecular dynamics simulation of waxy crude oil multiphase system depositing and sticking on pipeline inner walls and the micro influence mechanism of surface physical–chemical characteristics. Energy Fuels 2021, 35, 4012–4028. [Google Scholar] [CrossRef]
- Abascal, J.L.F.; Vega, C. A general purpose model for the condensed phases of water: TIP4P/2005. J. Chem. Phys. 2005, 123, 234505. [Google Scholar] [CrossRef] [PubMed]
- Trinh, T.T.; Vlugt, T.J.H..; Kjelstrup, S. Thermal conductivity of carbon dioxide from non-equilibrium molecular dynamics: A systematic study of several common force fields. J. Chem. Phys. 2014, 141, 134504. [Google Scholar] [CrossRef] [PubMed]
- Nieto-Draghi, C.; de Bruin, T.; Pérez-Pellitero, J.; Bonet Avalos, J.; Mackie, A.D. Thermodynamic and transport properties of carbon dioxide from molecular simulation. J. Chem. Phys. 2007, 126, 064509. [Google Scholar] [CrossRef] [PubMed]
- Aimoli, C.G.; Maginn, E.J.; Abreu, C.R.A. Force field comparison and thermodynamic property calculation of supercritical CO2 and CH4 using molecular dynamics simulations. Fluid Phase Equilibria 2014, 368, 80–90. [Google Scholar] [CrossRef]
- Wang, S.; Cheng, Q.; Gan, Y.; Li, Q.; Liu, C.; Sun, W. Effect of Wax Composition and Shear Force on Wax Aggregation Behavior in Crude Oil: A Molecular Dynamics Simulation Study. Molecules 2022, 27, 4432. [Google Scholar] [CrossRef] [PubMed]
- Li, Q.; Deng, X.; Liu, Y.; Cheng, Q.; Liu, C. Gelation of waxy crude oil system with ethylene-vinyl acetate on solid surface: A molecular dynamics study. J. Mol. Liq. 2021, 331, 115816. [Google Scholar] [CrossRef]
- Liu, L.; Hu, C.; Nicholson, D.; Bhatia, S.K. Inhibitory effect of adsorbed water on the transport of methane in Carbon nanotubes. Langmuir 2017, 33, 6280–6291. [Google Scholar] [CrossRef] [PubMed]
- Chen, H.; Sholl, D.S. Rapid diffusion of CH4/H2 mixtures in single-walled carbon nanotubes. J. Am. Chem. Soc. 2004, 126, 7778–7779. [Google Scholar] [CrossRef]


| Temperature (K) | 283.15 | 293.15 | 303.15 | 313.15 |
| Diffusion coefficient (10−9 m2/s) | 5.67 | 6.33 | 7.17 | 7.83 |
| GOR (m3/t) | 287 | 574 | 1910 |
| Diffusion coefficient (10−9 m2/s) | 3.83 | 4.67 | 7.83 |
| WC (%) | 0 | 20 | 70 |
| Diffusion coefficient (10−9 m2/s) | 6.50 | 4.67 | 3.67 |
| Force Field Model | Atom Type | /(kcal/mol) | /Å | q/e | |
|---|---|---|---|---|---|
| CO2 | EPM2-FLEX | C | 0.0559 | 2.757 | 0.6512 |
| O | 0.1599 | 3.033 | −0.3256 | ||
| CnH2n+2 | OPLS | C(RCH3) | 0.066 | 3.5 | −0.180 |
| C(R2CH2) | 0.066 | 3.5 | −0.120 | ||
| H | 0.03 | 2.5 | 0.06 | ||
| H2O | TIP4P/2005 | H | 0 | 0 | 0.5879 |
| O | 0.1852 | 3.1589 | −1.1794 |
Disclaimer/Publisher’s Note: The statements, opinions and data contained in all publications are solely those of the individual author(s) and contributor(s) and not of MDPI and/or the editor(s). MDPI and/or the editor(s) disclaim responsibility for any injury to people or property resulting from any ideas, methods, instructions or products referred to in the content. |
© 2023 by the authors. Licensee MDPI, Basel, Switzerland. This article is an open access article distributed under the terms and conditions of the Creative Commons Attribution (CC BY) license (https://creativecommons.org/licenses/by/4.0/).
Share and Cite
Wang, S.; Cheng, Q.; Li, Z.; Qi, Y.; Liu, Y. Molecular Dynamics Study on the Diffusion Mass Transfer Behaviour of CO2 and Crude Oil in Fluids Produced via CO2 Flooding. Molecules 2023, 28, 7948. https://doi.org/10.3390/molecules28247948
Wang S, Cheng Q, Li Z, Qi Y, Liu Y. Molecular Dynamics Study on the Diffusion Mass Transfer Behaviour of CO2 and Crude Oil in Fluids Produced via CO2 Flooding. Molecules. 2023; 28(24):7948. https://doi.org/10.3390/molecules28247948
Chicago/Turabian StyleWang, Shuang, Qinglin Cheng, Zhidong Li, Yaming Qi, and Yue Liu. 2023. "Molecular Dynamics Study on the Diffusion Mass Transfer Behaviour of CO2 and Crude Oil in Fluids Produced via CO2 Flooding" Molecules 28, no. 24: 7948. https://doi.org/10.3390/molecules28247948
APA StyleWang, S., Cheng, Q., Li, Z., Qi, Y., & Liu, Y. (2023). Molecular Dynamics Study on the Diffusion Mass Transfer Behaviour of CO2 and Crude Oil in Fluids Produced via CO2 Flooding. Molecules, 28(24), 7948. https://doi.org/10.3390/molecules28247948