Article

Temperature-Dependent Kinetic Study of the Reactions of Hydrogen Atoms with H2S and C2H4S

Institut de Combustion, Aérothermique, Réactivité et Environnement (ICARE), CNRS, 45071 Orléans, France
Molecules 2023, 28(23), 7883; https://doi.org/10.3390/molecules28237883
Submission received: 25 October 2023 / Revised: 16 November 2023 / Accepted: 29 November 2023 / Published: 30 November 2023
(This article belongs to the Section Physical Chemistry)

Abstract

:
A discharge-flow reactor combined with modulated molecular beam mass spectrometry technique was employed to determine the rate constants of H-atom reactions with hydrogen sulfide and thiirane. The rate constants for both reactions were determined at a total pressure of 2 Torr from 220 to 950 K under pseudo-first-order conditions by monitoring either consumption of H atoms in excess of H2S (C4H4S) or the molecular species in excess of atomic hydrogen. For H + H2S reaction, a suggested previously strong curvature of the Arrhenius plot was confirmed: kl = 8.7 × 10⁻¹³ × (T/298)2.87 × exp(−125/T) cm3 molecule−1 s−1 with a conservative uncertainty of 15% at all temperatures. Non-Arrhenius behavior was also observed for the reaction of H-atom with C2H4S, with the experimental rate constant data being best fitted to a sum of two exponential functions: k2 = 1.85 × 10⁻¹⁰ exp(−1410/T) + 4.17 × 10⁻¹² exp(−242/T) cm3 molecule−1 s−1 with an independent of temperature uncertainty of 15%.

Graphical Abstract

1. Introduction

The present work reports temperature-dependent measurements of rate constants for two elementary reactions involving hydrogen atoms, with H2S and C2H4S. The H-atom reaction with H2S is of importance in combustion chemistry and industrial processes, and is included in a detailed chemical mechanism to describe reactions in the H2–S2–H2S system [1]:
H + H2S → SH + H2
The temperature dependence of the rate constant of reaction (1), which proceeds through the abstraction of a hydrogen atom, is also of theoretical interest, in particular for assessing the effect of quantum tunneling [2,3]. Reaction (1) has been intensively studied over the past few decades, both experimentally [4,5,6,7,8,9,10,11,12,13,14,15] and theoretically [2,3,13,15,16]. Although there is now some experimental and theoretical evidence for the curvature of the Arrhenius plot for reaction (1), it has never actually been observed experimentally in any single study conducted over a sufficiently wide temperature range. All previous experimental work was carried out over a limited temperature range, and “unmodified” Arrhenius expressions were reported for the reaction rate constant. One of the aims of this work was to provide experimental evidence of the curvature of the Arrhenius dependence of k1 within the framework of one study through rate constant measurements over an extended temperature range, T = 220–950 K.
It is known that reactions of C2H4S (thiirane, ethylene sulfide) with various atoms are rapid and proceed through S-atom abstraction, leading to almost stoichiometric production of ethylene and sulfur-containing radicals [17,18,19,20]. This allows the desulfurization reactions of thiirane to be used in laboratory research both as sources of radicals and as scavengers of unwanted active species. The reaction of C2H4S with hydrogen atoms leads to the formation of SH (an important intermediate in atmospheric and combustion chemistry [21,22]), and can be used as an alternative source of SH radicals to those involving H2S [23].
H + C2H4S → SH + C2H4
The kinetic information on reaction (2) is rather scarce and uncertain. Only two measurements of the reaction rate constant were reported, by Yokota et al. [24] at T = 300–425 K using the relative rate method, and in absolute measurements by Lee et al. from 223 to 423 K [20]. The activation energies reported in two studies are very close; however, the absolute values of the reaction rate constant differ by a factor of 3. The objective of the present work was to provide new measurements of the rate constant over an extended temperature range, T = 220–950 K.

2. Results and Discussion

2.1. Reaction H + H2S

2.1.1. Measurements of the Reaction Rate Constant

All measurements were carried out under flow conditions at nearly 2 Torr of total pressure of Helium, and with detection of the gas phase species involved using mass spectrometry [23].
The reaction rate constant was determined under pseudo-first-order conditions either from H2S decays ([H2S]0 ≤ 4 × 10¹¹ molecule cm−3) in excess of hydrogen atoms, or from the kinetics of H-atom consumption ([H]0 ≤ 2 × 10¹¹ molecule cm−3) monitored in excess of hydrogen sulfide. The concentrations of the excess reactants were varied between 0.18 and 6.64 × 10¹³ molecule cm−3 for H-atom, and between 0.85 and 44.7 × 10¹³ molecule cm−3 for [H2S] (see Table 1). The linear flow velocity in the reactor was in the range of 1025–3400 cm s−1.
Examples of H2S decays observed at different excess concentrations of hydrogen atoms are shown in Figure 1. The consumption of the excess reactant, H atoms, along the reaction zone did not exceed a few percent (mainly due to the wall loss, kw < 10 s−1). In all cases, the average concentration of H was used in the calculations. The concentration of H2S decays exponentially, [H2S] = [H2S]0 × exp(−k1 × t), where k1 = k1[H] is the pseudo-first-order rate constant of H2S loss.
The pseudo-first-order rate constants, k1, determined from the slopes of the straight lines like those in Figure 1, are shown in Figure 2, as a function of H-atom concentration.
One can note that the intercepts in Figure 2 are close to zero, which is consistent with the observed lack of H2S consumption in the absence of hydrogen atoms in the reactor. Diffusion corrections were applied to all the measured values of k1 in order to take into account the axial and radial gradient of H2S concentration in the flow tube [25]. Corrections were generally less than 3%, and only at T = 950 K were they somewhat higher, reaching 7%. The slopes of the straight lines in Figure 2 provide the bimolecular rate constants at respective temperatures, which are summarized in Table 1.
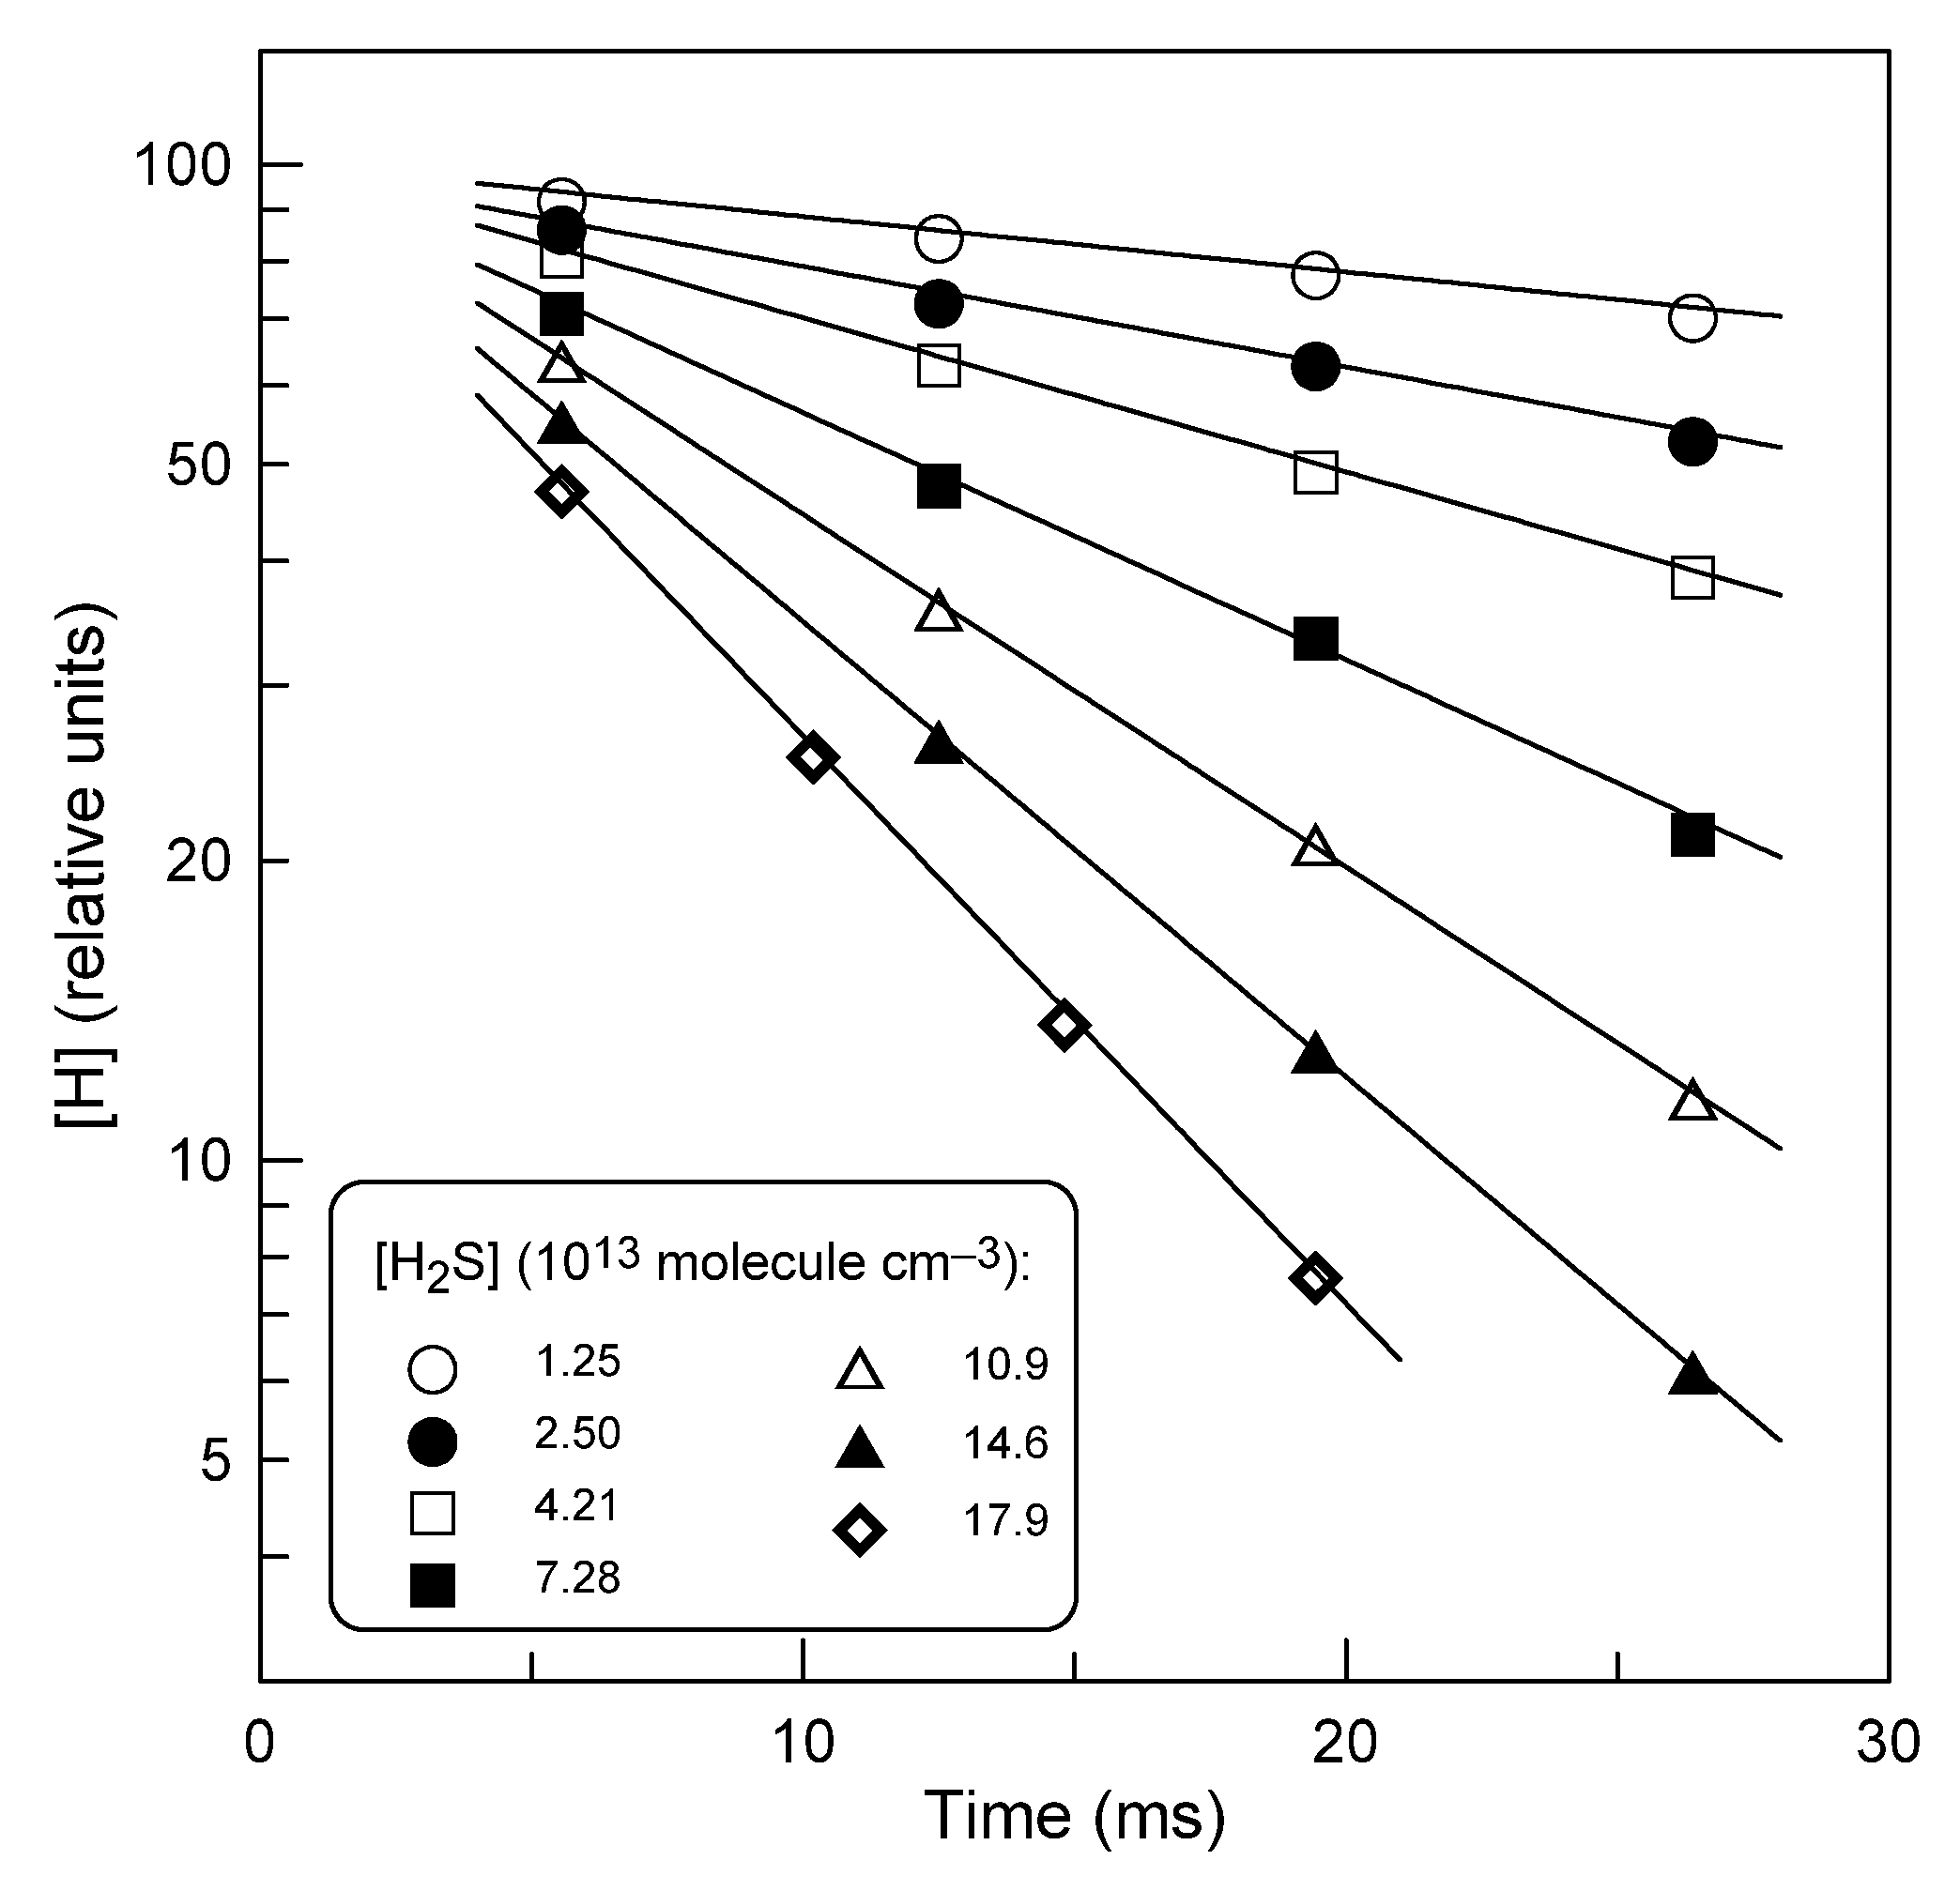
In the second series of experiments, the kinetics of H-atom consumption in an excess of hydrogen sulfide was recorded. Figure 3 displays typical exponential decays of [H] with time, [H] = [H]0 × exp(−k1×t), where k1 = k1[H2S] + kw is the pseudo-first-order rate constant, with kw representing the heterogeneous loss of H atoms.
Examples of the typical second-order plots observed at different temperatures are shown in Figure 4. The low intercept values of the plots in Figure 4 are in agreement with the wall loss rate of H atoms, kw < 10 s−1, measured in the absence of H2S in the reactor. Diffusion corrections applied to the measured values of k1 did not exceed 10%. Final values of k1 determined in this series of experiments are presented in Table 1. The combined uncertainty on k1 was estimated to be around 15% for both series of experiments by adding in quadrature statistical error (≤2%) and those on the measurements of the absolute concentration of H2S (≈7%), (H) (≈10%), flows (3%), pressure (2%), and temperature (1%).
Reaction (1) produces SH radicals, and H-atom kinetics can be potentially impacted by the fast secondary reaction:
H + SH → S + H2
The rate constant of reaction (3) is not well known. Measurements of k3 available in the literature are scattered between 1.1 × 10⁻¹¹ and 4.15 × 10⁻¹¹ cm3 molecule−1 s−1 at room temperature [4,8,10,26]. Although this secondary reaction is quite fast, its impact on the measurements of k1 can be considered negligible due to the low initial concentrations of H atoms used ([H]0 ≤ 2 × 10¹¹ molecule cm−3).

2.1.2. Comparison with Previous Data

Figure 5 shows the temperature-dependent data available for k1. As noted in the Introduction section and as can be seen in Figure 5, the rate constant for reaction (1) is relatively well established.
The most reliable measurements of k1 at room temperature [8,10,11,12] (not shown in Figure 5 for clarity) are in good agreement with each other. Bradley et al. [8] measured k1 in a flow reactor using electron spin resonance for detection of hydrogen atoms: kl = 8.3 × 10⁻¹³ cm3 molecule−1 s−1. The same value was reported for k1 by Nicholas et al. [10] who monitored the concentrations of SH and S2 intermediates upon decomposition of H2S in a pulsed radio-frequency discharge and derived k1 from computer simulation of SH and S2 profiles. Husain and Slater [11] reported an absolute value of kl = (8.6 ± 0.5) × 10−13 cm3 molecule−1 s−1, determined via the pulsed photolysis resonance fluorescence method. Finally, Clyne and Ono [12] measured kl = (7.41 ± 0.39) × 10−13 cm3 molecule−1 s−1, employing resonance fluorescence method in a discharge flow system. It can be noted that the present value of kl measured around room temperature, e.g., (6.0 ± 0.9) × 10−13 cm3 molecule−1 s−1 at T = 295 K, is somewhat lower than these previous measurements.
The first temperature-dependent measurement of the rate constant for reaction (1) was conducted by Mihelcic and Schindler [5], who used a discharge flow system combined with ESR detection of hydrogen atoms. The following Arrhenius equation was reported: kl = (1.7 ± 0.1) × 10−11 exp(−845 ± 25)/T] cm3 molecule−1 s−1 at T = 243–368 K. Kurylo et al. [6], using flash photolysis coupled with resonance fluorescence, carried out absolute measurements of kl over a temperature range of 190–464 K, and reported kl = (1.29 ± 0.15) × 10−11 exp[ −(860 ± 30)/T] cm3 molecule−1 s−1. At high temperatures (T > 800 K), the rate constant of reaction (1) has been determined in three studies [9,13,14]. Pratt and Rogers [9] in their mass spectrometric study of the early stages of the exchange reaction in H2S/D2 mixture deduced values of kl at T = 808–937 K, which are shown in Figure 5. Yoshimura et al. [13] and Woiki and Roth [14] studied reaction (1) behind reflected shock waves, applying atomic resonance absorption spectroscopy for the measurements of H-atom concentration, and reported kl = 3.2 × 10⁻¹⁰ exp(−2491/T) at T = 1053–2237 K and kl = 4.15 × 10⁻¹⁰ exp(−2890/T) cm3 molecule−1 s−1 at T = 1160–1722 K, respectively. As one can see in Figure 5, the results of these high temperature measurements are in good agreement. Finally, in the most recent study of the reaction (1) [15], k1 was measured via the flash photolysis resonance fluorescence technique and found to be: kl = 6.6 × 10⁻¹¹ exp(−1347/T) cm3 molecule−1 s−1 at T = 298–598 K.
The present measurements of kl are in very good agreement with those of Kurylo et al. [6], Pratt and Rogers [9], and, in the range of experimental uncertainty, with the data from Peng et al. [15]. The kl values measured by Mihelcic and Schindler [5] are a bit higher than others. Rommel and Schiff [7] suggested that the kl values reported by Michelcic and Schindler [5] may have been overestimated. In fact, the values of kl were derived from decays of H atoms under experimental conditions, where initial H2S concentration was comparable to that of hydrogen atoms. In addition, secondary reaction (3), which should operate under such conditions, was not taken into account.
The present data for kl obtained in a wide temperature range clearly show a well-pronounced curvature of the Arrhenius plot. The fit of the current data with the modified Arrhenius expression (the continuous black line in Figure 5) yields
kl = 8.7 × 10⁻¹³ × (T/298)2.87 × exp(−125/T) cm3 molecule−1 s−1.
This expression for kl is recommended from the present study in the temperature range 220–950 K, with a conservative (independent of temperature) overall 2σ uncertainty of 15%. The black dashed lines in Figure 5 represent the deviations from this equation by a factor of 1.3, showing that practically all existing data (except at the highest temperatures) fall into this range.
It should be noted that the curvature of the Arrhenius plot is observed experimentally for the first time, although it was suggested in some previous studies. All previous experimental work was carried out over a limited temperature range, and resulted in “unmodified” Arrhenius expressions for kl. Yoshimura et al. [13] based on their measurements of kl at room and high temperatures (Figure 5) suggested a strong non-Arrhenius dependence of kl on temperature, which was explained by a conventional transition-state theory combined with ab initio calculations. Peng et al. [15], combining their experimental data (T = 298–598 K) with those available in the literature, reported kl = 5.8 × 10⁻¹⁷ × T1.94 exp(−455/T) cm3 molecule−1 s−1 (blue dotted line in Figure 5). This expression reasonably (within 25%) describes the kl data from the present work. The theoretical analysis carried out by the authors also supported the significant curvature of the Arrhenius plot. The experimentally observed non-Arrhenius temperature dependence of kl was also reasonably reproduced by the recent quantum dynamics calculations of Qi et al. [2], concluding that the non-Arrhenius behavior is caused by the pronounced quantum tunneling. The calculations of Qi et al. [2] showed that both abstraction and exchange mechanisms are important for the H + H2S reaction. Unfortunately, the available experimental data do not make it possible to define the contribution of these two mechanisms as a function of temperature.

2.2. Reaction H + C2H4S

2.2.1. Measurements of the Reaction Rate Constant

A similar experimental protocol described above for reaction (1) was also applied to measure the rate constant of the reaction of hydrogen atoms with thiirane. As in the previous case, the rate constant of reaction (2) was determined under pseudo-first order conditions by two methods: from kinetics of thiirane consumption ([C2H4S]0 ≤ 3.6 × 10¹¹ molecule cm−3) in excess of hydrogen atoms and from H-atom decays ([H]0 ≤ 2.1 × 10¹¹ molecule cm−3) recorded in excess of C2H4S. The concentrations of the corresponding excess reactants are shown in Table 2. The flow velocity in the reactor was in the range (1045–3250) cm s−1. Examples of second-order plots obtained from C2H4S and H-atom decays are shown in Figure 6 and Figure 7, respectively. The similarity of the results obtained with different initial concentrations of C2H4S (Figure 6, T = 220 K) and hydrogen atoms (Figure 7) indicates a minor influence of possible secondary chemistry on the measurements of k2. The final values of k2 determined at different temperatures from the slopes of the straight lines like those in Figure 6 and Figure 7 are shown in Table 2.

2.2.2. Comparison with Previous Data

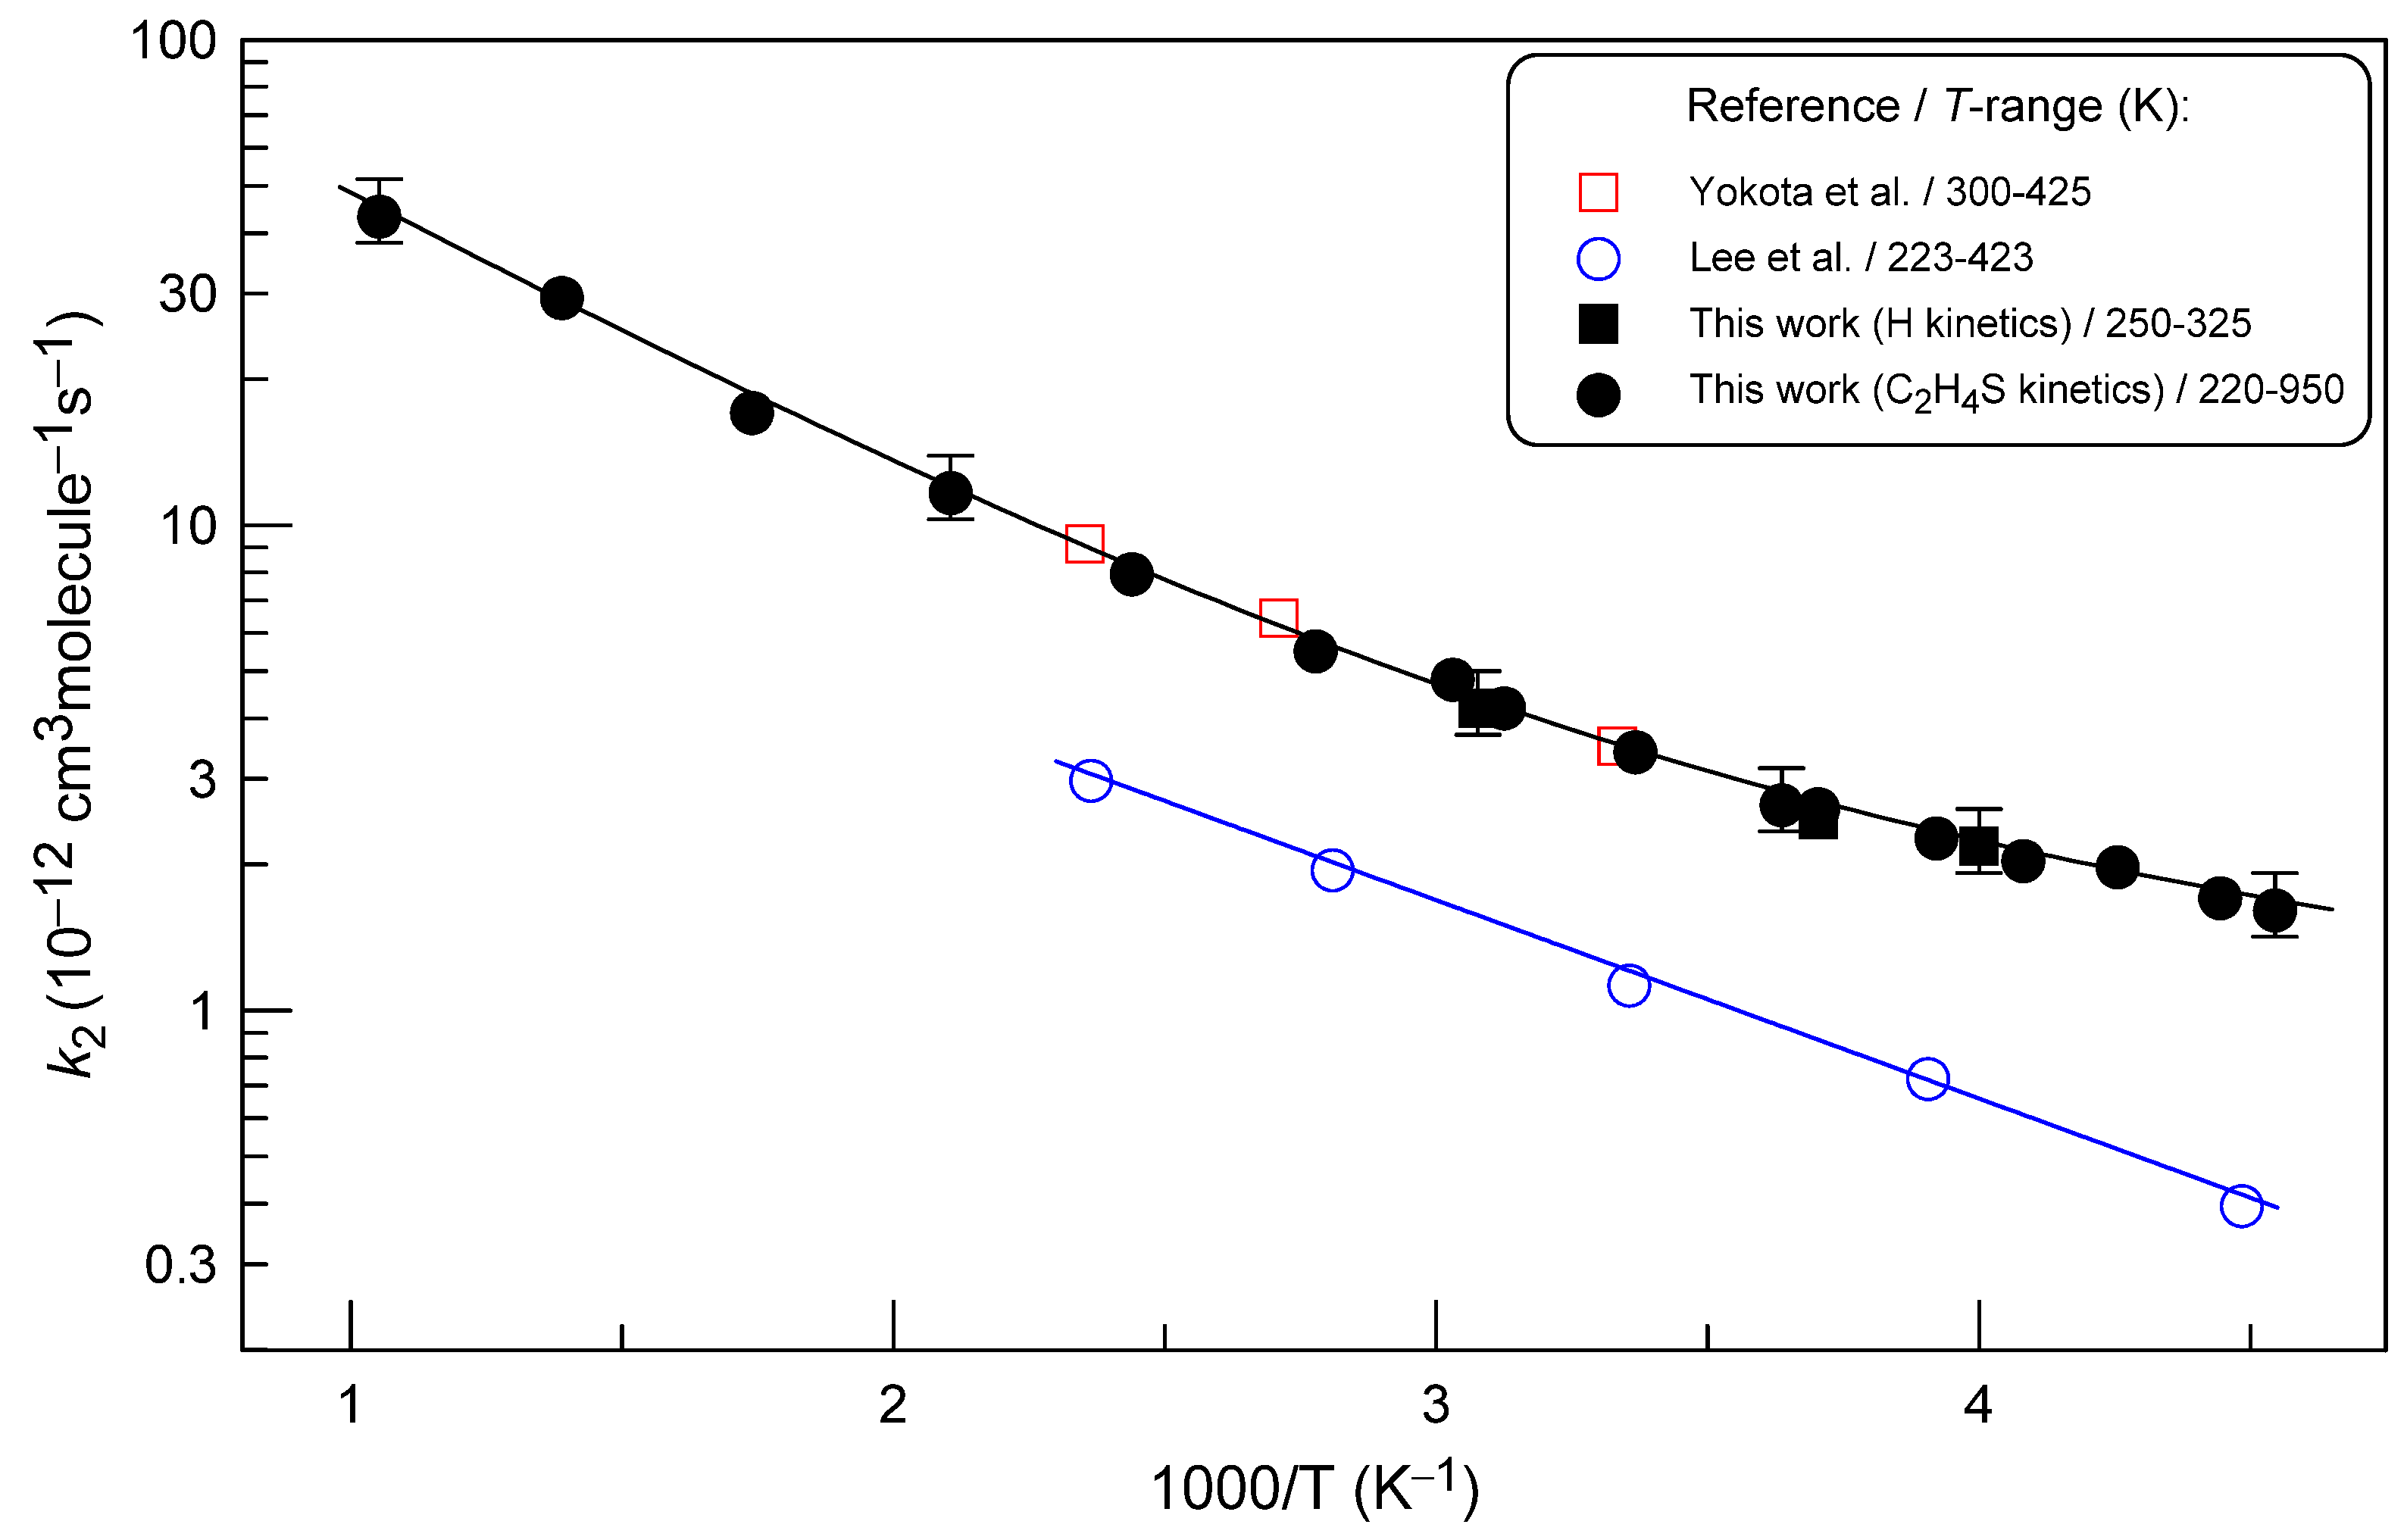
The rate constant of the H + C2H4S reaction is displayed as a function of temperature in Figure 8. The present data on the temperature dependence of k2 are best represented by the sum of two exponential functions (the continuous black line in Figure 8):
k2 = 1.85×10⁻¹⁰ exp(−1410/T) + 4.17×10⁻¹² exp(−242/T) cm3 molecule−1 s−1
at T = 220–950 K (with an estimated conservative uncertainty of 15% at all temperatures).
To our knowledge, only two studies of the reaction are available in the literature. Yokota et al. [24] studied the reaction of thiirane with hydrogen atoms produced from the mercury photosensitization of H2. The reaction rate constant was determined relative to that of the H-atom reaction with H2S at three temperatures between 300 and 425 K: k2 = (9.5 ± 1.2) × 10−11 exp[−(980 ± 88)/T] cm3 molecule−1 s−1. The relative rate data were placed on an absolute basis with the values of k1 reported by Kurylo et al. [6], which can be considered valid to date (see Figure 5). Lee et al. [20] carried out absolute measurements of k2 using the flash photolysis–resonance fluorescence technique, and reported k2 = (2.87 ± 0.12) × 10−11 exp[−(945 ± 12)/T] cm3 molecule−1 s−1 over a temperature range from 223 to 423 K. The present data for k2 clearly support the results of the relative rate measurements of Yokota et al. [24], being higher by a factor of 3–4 compared with the absolute measurements of Lee et al. [20] (Figure 8). The reason for such a large discrepancy is difficult to determine at this stage. Perhaps the point is in determining the absolute concentrations of thiirane, which (i) was photolyzed in the study of Lee at al. [20] to generate H atoms, and (ii) is known to decompose during storage.
In the study of Yokota et al. [24], C2H4, H2S, and elemental sulfur were detected as reaction products in accordance with the formation of SH radical and C2H4 in the primary step, followed by the production of H2S and S in the self-reaction of SH radicals:
SH + SH → S + H2S
S + C4H4S → S2 + C2H4
In this work, we also observed the formation of SH, S and S2 under specific conditions (high concentrations of both reactants); however, quantitative measurements were quite difficult, and were not performed.

3. Materials and Methods

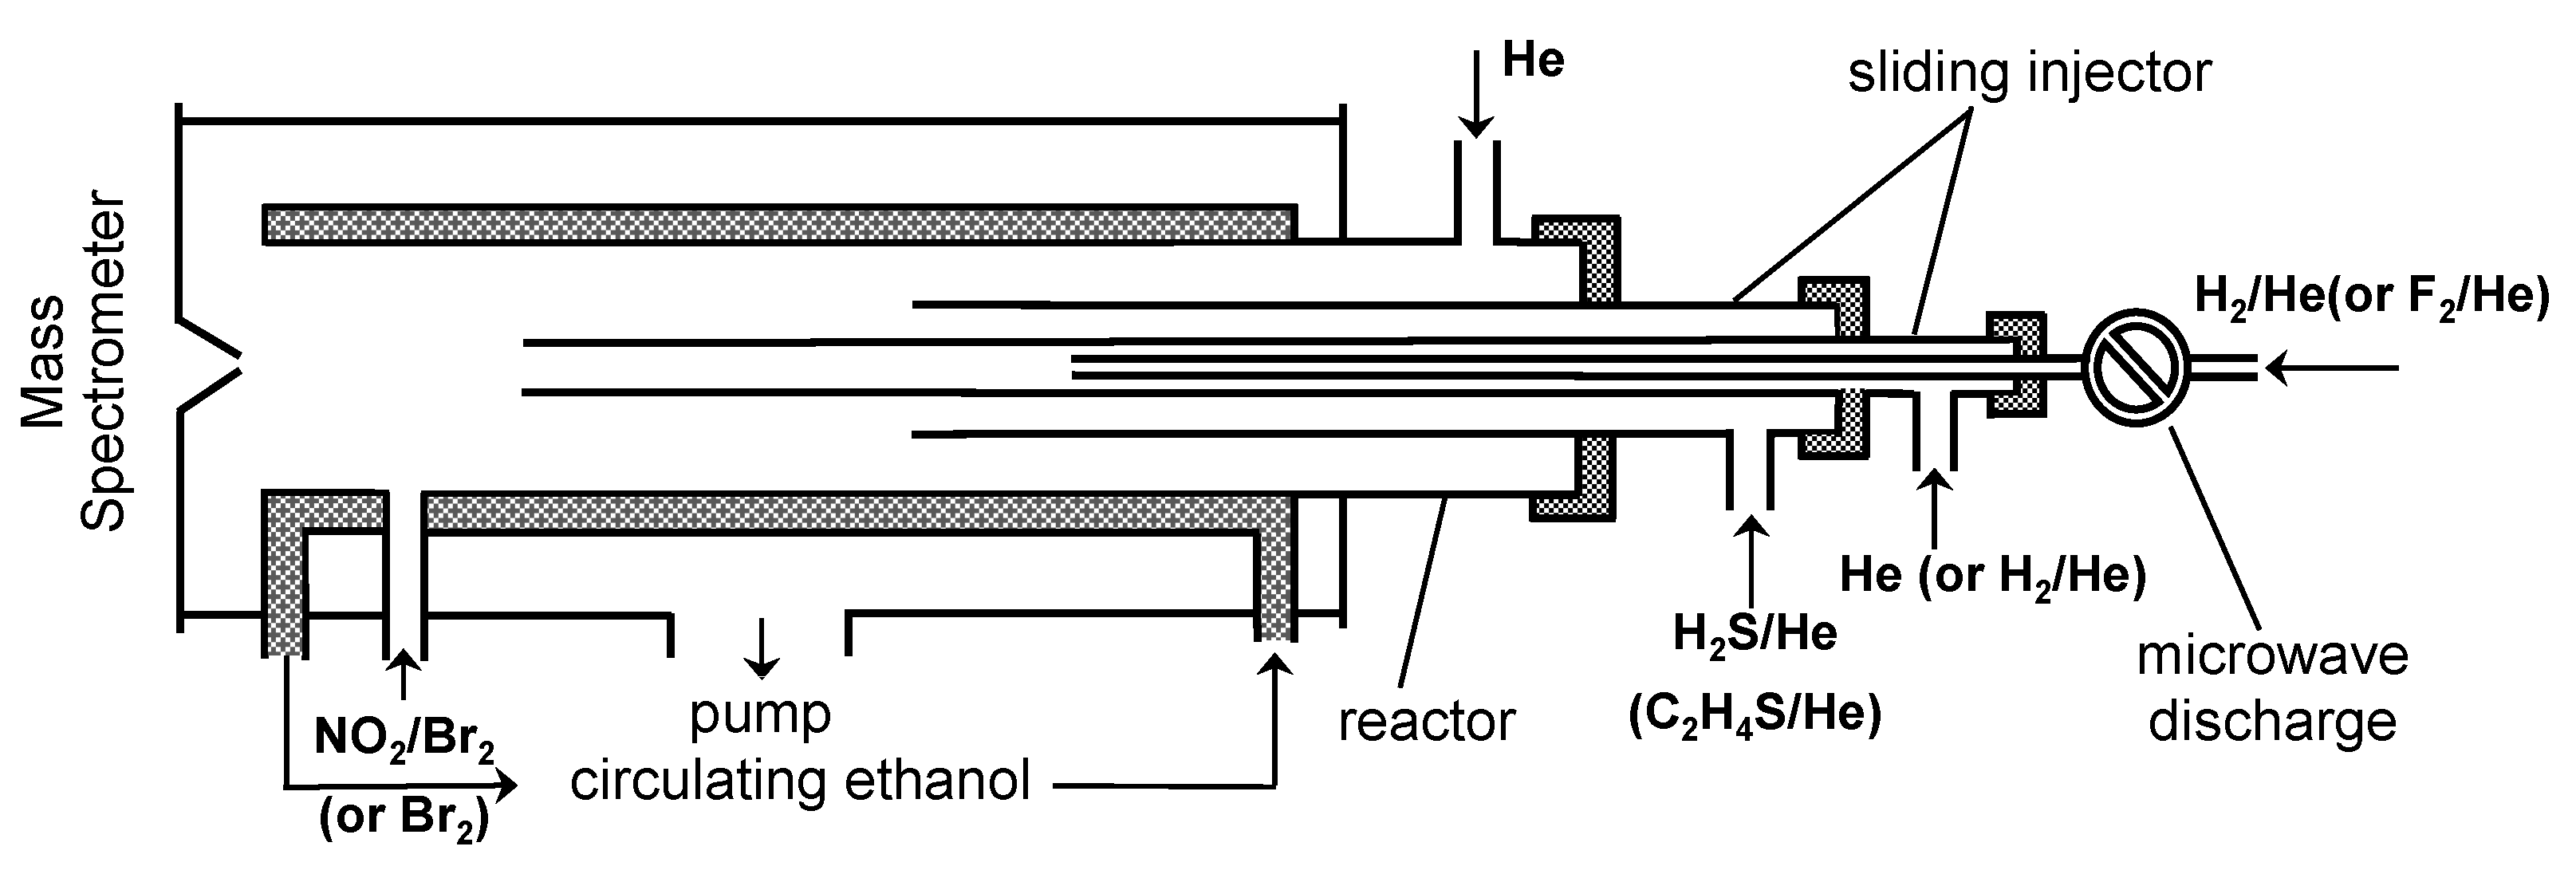
All experiments were performed in a conventional discharge fast-flow reactor coupled with a modulated molecular beam-sampling quadrupole mass spectrometer for the detection of the gas phase species [23]. Two different flow reactors (45 cm length and 2.4 cm i.d.) available in the laboratory were used. The low-temperature flow reactor, a Pyrex tube coated with halocarbon wax with a jacket for the circulation of thermostatically controlled ethanol (Figure 9), covered a temperature range between 220 and 330 K. The high-temperature flow reactor was employed over a temperature range of 295−950 K and consisted of an electrically heated uncoated Quartz tube with water-cooled attachments.
Hydrogen atoms were produced using two methods. The first one employed the microwave discharge of H2/He mixtures. In the second method, H atoms were formed in the fast reaction of F atoms with H2,
F + H2 → H + HF
k6 = 1.24 × 10⁻¹⁰ exp(−507/T) cm3 molecule−1 s−1 (T = 220–960 K) [27].
In this case, the fluorine atoms were generated in the microwave discharge of F2/He mixtures and titrated with an excess of H2 in the movable injector (Figure 9). The fraction of F2 dissociated in the microwave discharge exceeded 95%. Ensuring that there was no molecular fluorine in the reactor was important in the presence of thiirane, since it was observed that these two stable compounds show high reactivity towards each other.
Low concentrations of hydrogen atoms were monitored using their chemical conversion to stable species HOBr (m/z = 96/98) upon addition of the NO2/Br2 mixture 5 cm upstream of the sampling cone of the mass spectrometer (Figure 9). In this configuration, H atoms are converted to HOBr in two successive rapid reactions (7) and (8):
H + NO2 → OH + NO
k7 = (1.47 ± 0.26) × 10−10 cm3 molecule−1 s−1 (T = 195–2000 K) [28],
OH + Br2 → Br + HOBr
k8 = 2.16 × 10⁻¹¹ exp(207/T) cm3 molecule−1 s−1 (T = 220–950 K) [29].
The concentrations of NO2 and Br2 were chosen so that the hydrogen atoms reacted primarily with NO2 rather than with Br2 in reaction (9):
H + Br2 → Br + HBr
k9 = 7.06 × 10⁻¹¹ (T/298)0.88 exp(182/T) cm3 molecule−1 s−1 (T = 220–950 K) [30].
In experiments with high concentrations of hydrogen atoms (kinetics of H2S, and C2H4S consumption in excess of H), they were detected at m/z = 80/82 (HBr+) after being transformed to HBr in reaction (9).
The absolute calibration of the mass spectrometer for HOBr was accomplished using reaction (8) in excess of Br2, and relating the consumed fraction of Br2 to the concentration of HOBr produced: [HOBr] = Δ[Br2]. Absolute HBr concentrations were determined using two methods. In the first method, the absolute concentration of HBr was calculated from the flow rate of a manometrically prepared HBr/He mixture. The second method was the chemical transformation of the H atom into HBr in reaction (9), linking the consumed fraction of Br2 and the concentration of HBr formed: [HBr] = Δ[Br2]. The results of the two methods coincided within a few percent. The absolute concentrations of other stable species (Br2, NO2, F2, H2, H2S and C2H4S) in the reactor were calculated from their flow rates, obtained from the measurements of the pressure drop of their monometrically prepared mixtures in He stored in calibrated volume flasks.
The purities of the gases used were as follows: He > 99.999% (Alphagaz); Br2 > 99.99% (Aldrich); F2, 5% in helium (Alphagaz); HBr > 99.8% (Praxair); H2 > 99.998% (Alphagaz); NO2 > 99% (Alphagaz); H2S > 99.5% (Alphagaz); C2H4S (Merck), 98%.

4. Conclusions

In this work, we have investigated the kinetics of the reactions of H atoms with hydrogen sulfide and thiirane, using a discharge flow reactor combined with mass spectrometry. For the H + H2S reaction, previously assumed on the basis of experimental and theoretical data, the strong curvature of the Arrhenius plot was confirmed via measurements of the reaction rate constant over an extended temperature range (220–950 K). Similar curved Arrhenius dependence was also observed for reaction of H atoms with C2H4S, which was studied at T = 220–950 K (and for the first time at T > 425 K). The reaction was found to be fast enough to be used as an alternative (free of H2S) source of SH radicals (an important intermediate in combustion and atmospheric chemistry) in laboratory studies.

Funding

This research was funded by ANR through the PIA (Programme d’Investissement d’Avenir), grant number ANR-10-LABX-100-01.

Institutional Review Board Statement

Not applicable.

Informed Consent Statement

Not applicable.

Data Availability Statement

The data supporting reported results are available in this article.

Conflicts of Interest

The author declares no conflict of interest.

References

  1. Sendt, K.; Jazbec, M.; Haynes, B.S. Chemical kinetic modeling of the H/S system: H2S thermolysis and H2 sulfidation. Proc. Combust. Inst. 2002, 29, 2439–2446. [Google Scholar] [CrossRef]
  2. Qi, J.; Lu, D.; Song, H.; Li, J.; Yang, M. Quantum and quasiclassical dynamics of the multi-channel H + H2S reaction. J. Chem. Phys. 2017, 146, 124303. [Google Scholar] [CrossRef]
  3. Lamberts, T.; Kästner, J. Tunneling Reaction Kinetics for the Hydrogen Abstraction Reaction H + H2S → H2 + HS in the Interstellar Medium. J. Phys. Chem. A 2017, 121, 9736–9741. [Google Scholar] [CrossRef]
  4. Cupitt, L.T.; Glass, G.P. Reaction of atomic oxygen with hydrogen sulphide. Trans. Faraday Soc. 1970, 66, 3007–3015. [Google Scholar] [CrossRef]
  5. Mihelcic, D.; Schindler, R.N. ESR-spektroskopische Untersuchung der Reaktion von atomarem Wasserstoff mit H2S. Ber. Bunsenges. Phys. Chem. 1970, 74, 1280–1288. [Google Scholar] [CrossRef]
  6. Kurylo, M.J.; Peterson, N.C.; Braun, W. Absolute Rate of the Reaction H+H2S. J. Chem. Phys. 1971, 54, 943–946. [Google Scholar] [CrossRef]
  7. Rommel, H.; Schiff, H.I. The Reactions of H Atoms with H2S and COS. Int. J. Chem. Kinet. 1972, 4, 547–558. [Google Scholar] [CrossRef]
  8. Bradley, J.N.; Trueman, S.P.; Whytock, D.A.; Zaleski, T.A. Electron spin resonance study of the reaction of hydrogen atoms with hydrogen sulphide. J. Chem. Soc. Faraday Trans. 1 1973, 69, 416–425. [Google Scholar] [CrossRef]
  9. Pratt, G.; Rogers, D. Homogeneous isotope exchange reactions. Part 3.—H2S + D2. J. Chem. Soc. Faraday Trans. 1 Phys. Chem. Condens. Phases 1977, 73, 54–61. [Google Scholar] [CrossRef]
  10. Nicholas, J.E.; Amodio, C.A.; Baker, M.J. Kinetics and mechanism of the decomposition of H2S, CH3SH and (CH3)2S in a radio-frequency pulse discharge. J. Chem. Soc. Faraday Trans. 1 Phys. Chem. Condens. Phases 1979, 75, 1868–1875. [Google Scholar] [CrossRef]
  11. Husain, D.; Slater, N.K.H. Kinetic study of the reactions of hydrogen and deuterium atoms with HBr and DBr by time-resolved resonance fluorescence. J. Chem. Soc. Faraday Trans. 2 Mol. Chem. Phys. Mol. Chem. Phys. 1980, 76, 276–285. [Google Scholar] [CrossRef]
  12. Clyne, M.A.A.; Ono, Y. Determination of the rate constant of reaction of ground-state CI and H atoms with H2S using resonance fluorescence in a discharge flow. Chem. Phys. Lett. 1983, 94, 597–602. [Google Scholar] [CrossRef]
  13. Yoshimura, M.; Koshi, M.; Matsui, H.; Kamiya, K.; Umeyama, H. Non-Arrhenius temperature dependence of the rate constant for the H + H2S reaction. Chem. Phys. Lett. 1992, 189, 199–204. [Google Scholar] [CrossRef]
  14. Woiki, D.; Roth, P. A Shock Tube Study of the Reactions of H Atoms with COS, CS2, and H2S. Isr. J. Chem. 1996, 36, 279–283. [Google Scholar] [CrossRef]
  15. Peng, J.; Hu, X.; Marshall, P. Experimental and ab Initio Investigations of the Kinetics of the Reaction of H Atoms with H2S. J. Phys. Chem. A 1999, 103, 5307–5311. [Google Scholar] [CrossRef]
  16. Kurosaki, Y.; Takayanagi, T. Theoretical study of the non-Arrhenius temperature dependence of thermal rate constants for the H+H2S → H2+SH reaction. J. Chem. Phys. 1999, 111, 10529–10536. [Google Scholar] [CrossRef]
  17. Bedjanian, Y. Rate constant and products of the reaction of O(3P) atoms with thiirane over the temperature range 220–950 K. Int. J. Chem. Kinet. 2022, 54, 552–558. [Google Scholar] [CrossRef]
  18. Murrells, T.P. Elementary reactions of the SCl radical. Part1.—Rate constants and mechanisms of the reaction Cl + C2H4S → SCl + C2H4, SCl + SCl → products and SCl + Cl2 → SCl2+ Cl. J. Chem. Soc. Faraday Trans. 2 Mol. Chem. Phys. 1988, 84, 67–83. [Google Scholar] [CrossRef]
  19. Van Roodselaar, A.; Safarik, I.; Strausz, O.P. The reactions of S(3PJ) atoms with thiiranes. Int. J. Chem. Kinet. 1984, 16, 899–907. [Google Scholar] [CrossRef]
  20. Lee, J.H.; Stief, L.J.; Timmons, R.B. Absolute rate parameters for the reaction of atomic hydrogen with carbonyl sulfide and ethylene episulfide. J. Chem. Phys. 1977, 67, 1705–1709. [Google Scholar] [CrossRef]
  21. Hynes, A.J.; Wine, P.H. Kinetics and Mechanisms of the Oxidation of Gaseous Sulfur Compounds. In Gas-Phase Combustion Chemistry; Gardiner, W.C., Ed.; Springer: New York, NY, USA, 2000; pp. 343–388. [Google Scholar]
  22. Tyndall, G.S.; Ravishankara, A.R. Atmospheric oxidation of reduced sulfur species. Int. J. Chem. Kinet. 1991, 23, 483–527. [Google Scholar] [CrossRef]
  23. Bedjanian, Y. Rate Coefficients of the Reactions of Fluorine Atoms with H2S and SH over the Temperature Range 220–960 K. Molecules 2022, 27, 8365. [Google Scholar] [CrossRef]
  24. Yokota, T.; Ahmed, M.G.; Safarik, I.; Strausz, O.P.; Gunning, H.E. Reaction of hydrogen atoms with thiirane. J. Phys. Chem. 1975, 79, 1758–1762. [Google Scholar] [CrossRef]
  25. Kaufman, F. Kinetics of elementary radical reactions in the gas phase. J. Phys. Chem. 1984, 88, 4909–4917. [Google Scholar] [CrossRef]
  26. Langford, R.B.; Oldershaw, G.A. Flash photolysis of H2S. J. Chem. Soc. Faraday Trans. 1 Phys. Chem. Condens. Phases 1972, 68, 1550–1558. [Google Scholar] [CrossRef]
  27. Bedjanian, Y. Rate constants for the reactions of F atoms with H2 and D2 over the temperature range 220-960 K. Int. J. Chem. Kinet. 2021, 53, 527–535. [Google Scholar] [CrossRef]
  28. Su, M.C.; Kumaran, S.S.; Lim, K.P.; Michael, J.V.; Wagner, A.F.; Harding, L.B.; Fang, D.C. Rate Constants, 1100 ≤ T ≤ 2000 K, for H + NO2 → OH + NO Using Two Shock Tube Techniques:  Comparison of Theory to Experiment. J. Phys. Chem. A 2002, 106, 8261–8270. [Google Scholar] [CrossRef]
  29. Bedjanian, Y. Temperature-Dependent Rate Constant for the Reaction of Hydroxyl Radical with 3-Hydroxy-3-methyl-2-butanone. J. Phys. Chem. A 2019, 123, 10446–10453. [Google Scholar] [CrossRef]
  30. Bedjanian, Y. Rate constant of H atom reaction with Br2 determined between 220 and 950 K. Chem. Phys. Lett. 2023, 825, 140616. [Google Scholar] [CrossRef]
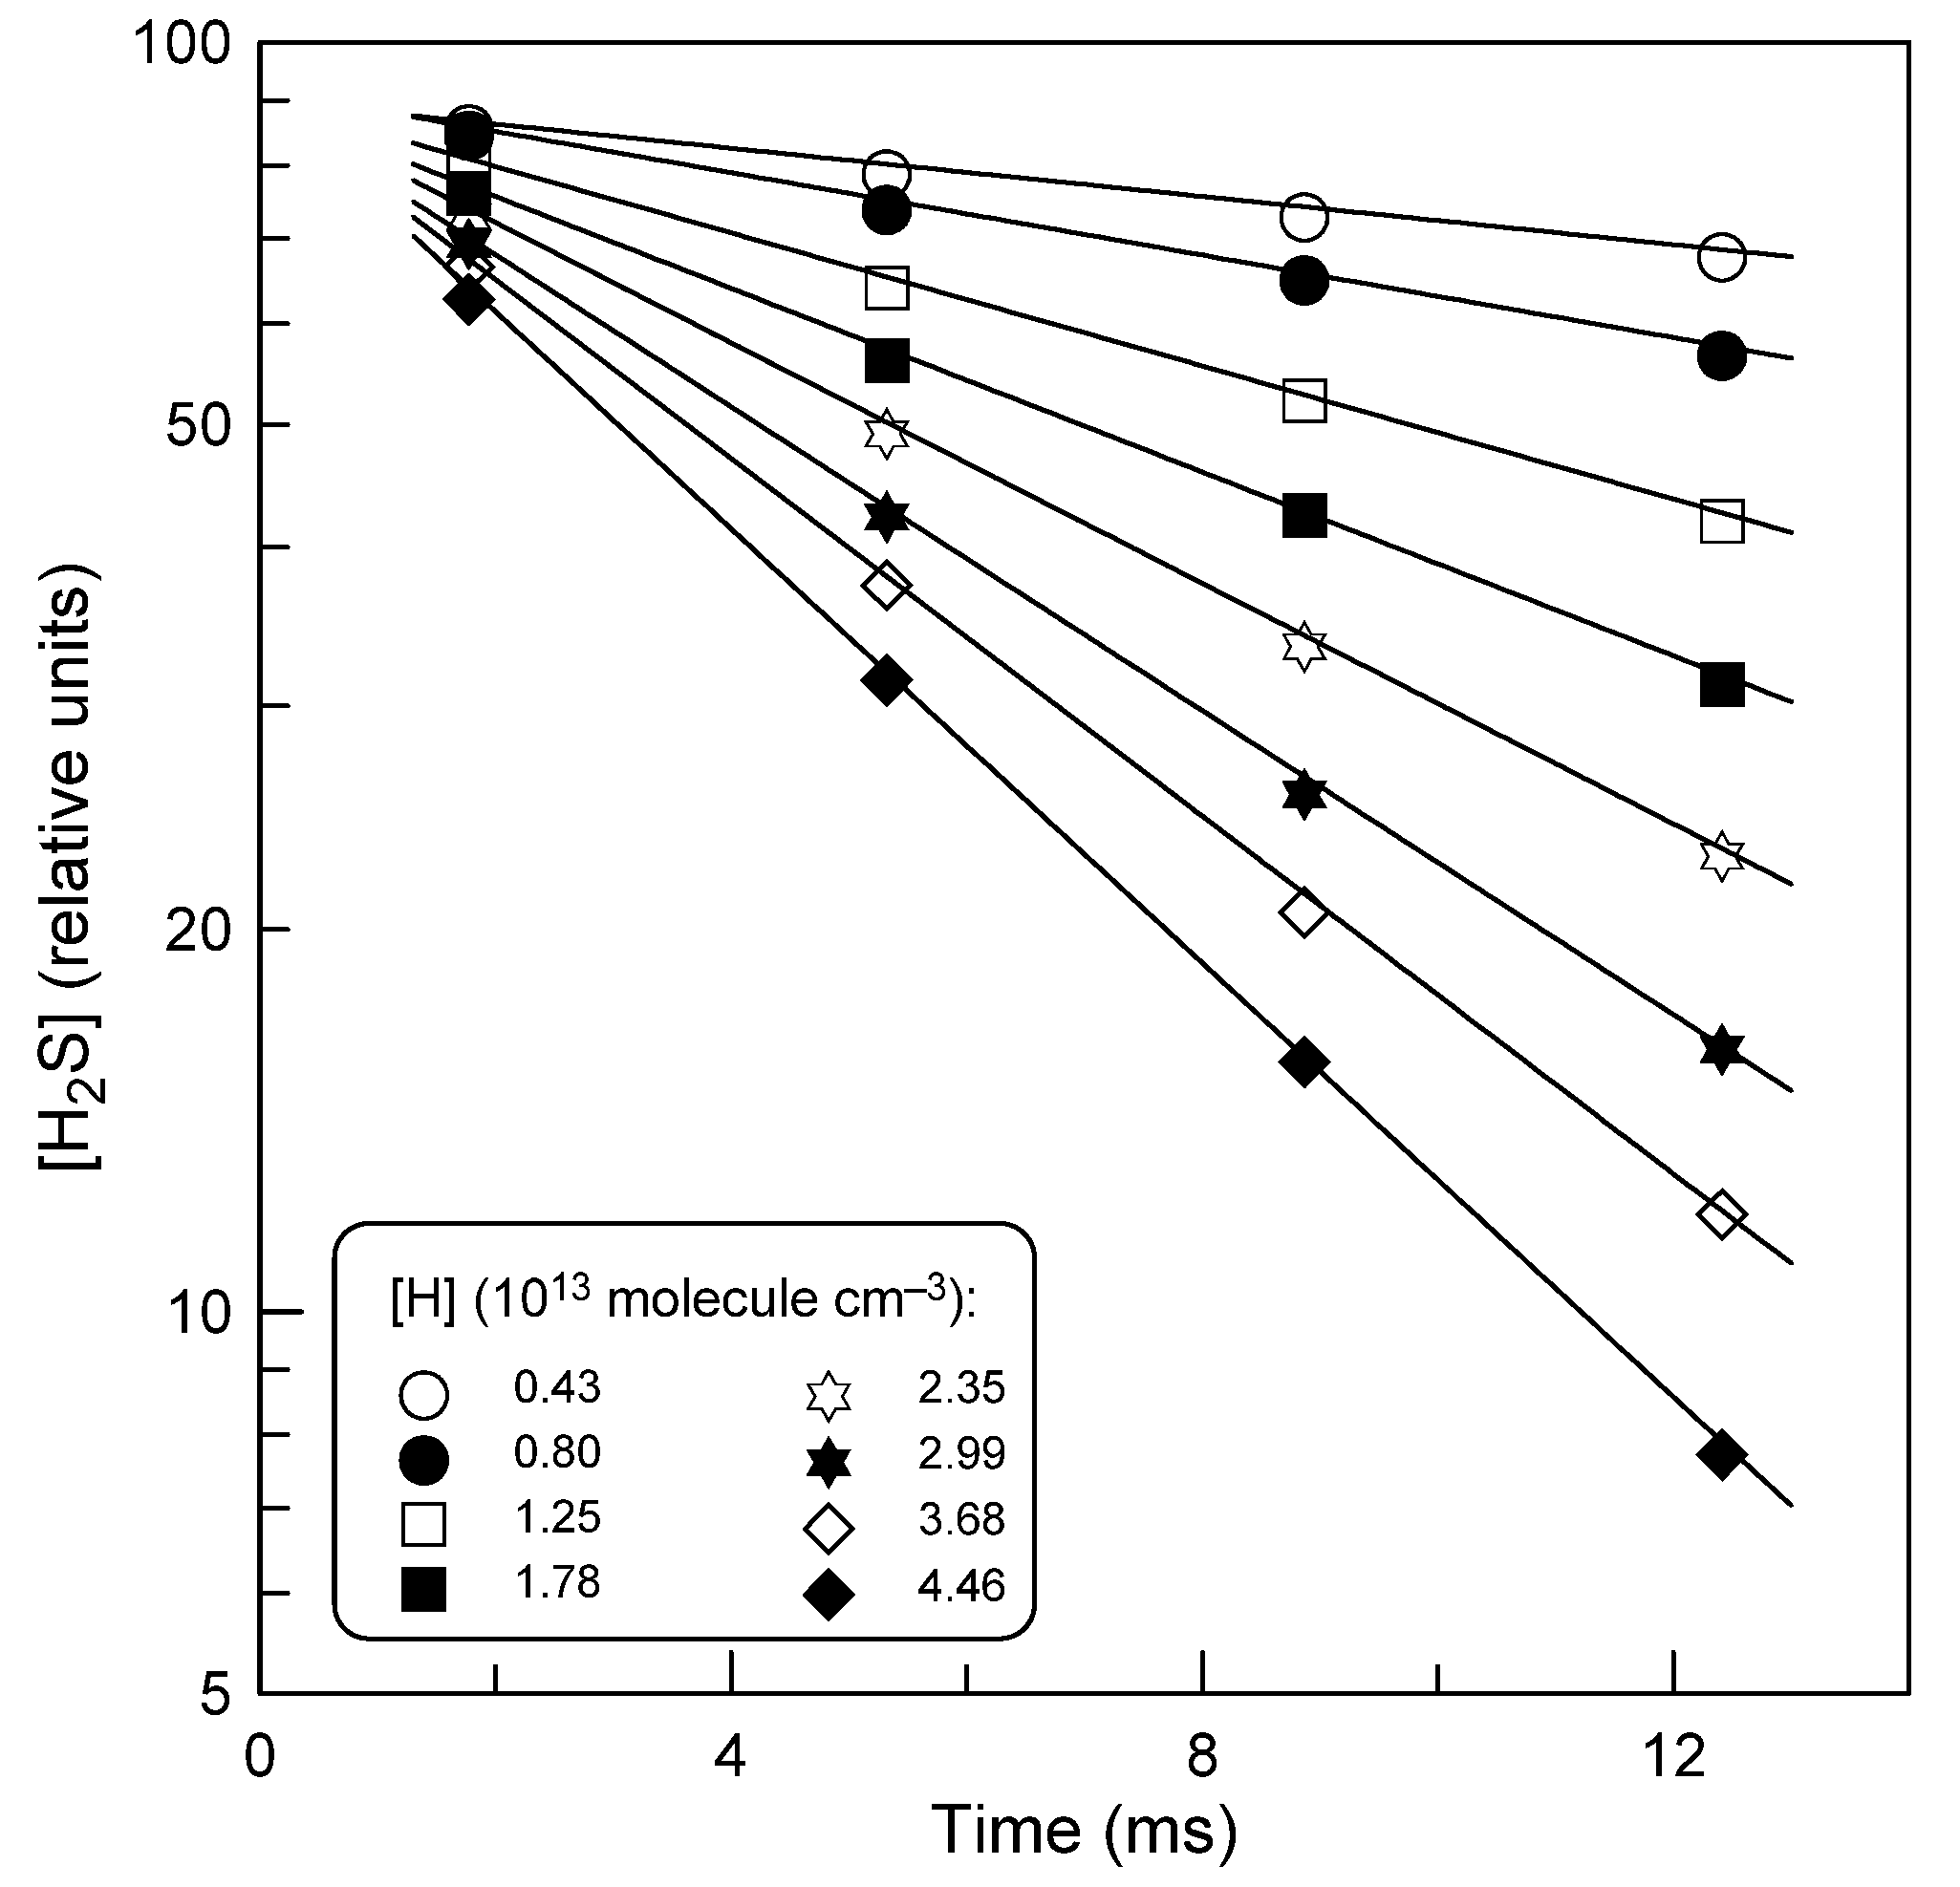
Figure 1. Reaction H + H2S: example of H2S decays observed with different concentrations of H atoms at T = 575 K.
Molecules 28 07883 g001
Figure 2. Reaction H + H2S: dependence of the pseudo-first-order rate constant, k1 = k1[H], on the concentration of H atoms at different temperatures.
Molecules 28 07883 g002
Figure 3. Reaction H + H2S: typical H-atom decays observed in the presence of different concentrations of H2S at T = 325 K.
Molecules 28 07883 g003
Figure 4. Reaction H + H2S: dependence of the pseudo-first order rate constant, k1 = k1[H2S] + kw, on the concentration of H2S at different temperatures.
Molecules 28 07883 g004
Figure 5. Temperature dependence of the rate constant of reaction (1). Uncertainties shown for the present measurements of k1 correspond to estimated total uncertainty of 15%.
Molecules 28 07883 g005
Figure 6. Reaction H + C2H4S: pseudo-first-order rate constant, k2 = k2[H], as a function of the concentration of H atoms at different temperatures.
Molecules 28 07883 g006
Figure 7. Reaction H + C2H4S: dependence of the pseudo-first-order rate constant, k2 = k2[C2H4S] + kw, on the concentration of C2H4S at T = 325 K measured with two different initial concentrations of H atoms.
Molecules 28 07883 g007
Figure 8. Summary of the measurements of k2. Uncertainties shown for selected present measurements of k2 correspond to the estimated total uncertainty of 15%.
Molecules 28 07883 g008
Figure 9. Low-temperature flow reactor: configuration used in the measurements of the rate constants of reactions (1) and (2).
Molecules 28 07883 g009
Table 1. Experimental conditions and results of the measurements of the rate constant of reaction (1).
T (K)[Excess Reactant] ak1 bReactor Surface cMethod d
2206.51–24.20.24 ± 0.01HWH kinetics
2354.80–28.80.26 ± 0.01HWH kinetics
2503.66–28.40.31 ± 0.01HWH kinetics
2701.60–44.70.39 ± 0.01HWH kinetics
2850.85–27.80.49 ± 0.01HWH kinetics
2950.66–4.370.60 ± 0.01QH2S kinetics
3051.09–19.70.59 ± 0.01QH kinetics
3251.25–20.40.77 ± 0.02HWH kinetics
3300.46–6.640.88 ± 0.02HWH2S kinetics
3600.62–5.581.07 ± 0.02QH2S kinetics
4100.45–4.601.58 ± 0.02QH2S kinetics
4750.57–5.872.61 ± 0.03QH2S kinetics
5750.43–4.464.61 ± 0.08QH2S kinetics
7200.33–3.319.96 ± 0.08QH2S kinetics
9500.18–2.6120.6 ± 0.3QH2S kinetics
a Units of 1013 molecule cm−3. b units of 10−12 cm3 molecule−1s−1; statistical 2σ uncertainty is given, total estimated uncertainty is 15%. c HW: halocarbon wax; Q: quartz. d k1 derived from H2S (H2S kinetics) or H-atom (H kinetics) decays monitored in excess of H and H2S, respectively.
Table 2. Experimental conditions and results of the measurements of the rate constant of reaction (2).
T (K)[Excess Reactant] ak2 bReactor Surface cMethod d
2200.21–9.191.67 ± 0.04HWC2H4S kinetics
2250.40–8.821.77 ± 0.03HWC2H4S kinetics
2350.8–7.732.05 ± 0.04HWC2H4S kinetics
2450.26–7.252.11 ± 0.03HWC2H4S kinetics
2500.23–3.862.26 ± 0.06HWH kinetics
2550.45–8.282.35 ± 0.04HWC2H4S kinetics
2700.24–4.032.56 ± 0.07HWH kinetics
2700.56–6.442.7 ± 0.04HWC2H4S kinetics
2750.48–6.732.75 ± 0.07HWC2H4S kinetics
2970.11–3.843.54 ± 0.04QC2H4S kinetics
3200.33–6.034.36 ± 0.04HWC2H4S kinetics
3250.36–4.864.35 ± 0.08HWH kinetics
3300.30–4.544.99 ± 0.06HWC2H4S kinetics
3600.23–3.345.71 ± 0.06QC2H4S kinetics
4100.18–2.588.23 ± 0.07QC2H4S kinetics
4750.15–2.2412.1 ± 0.1QC2H4S kinetics
5750.18–1.9417.7 ± 0.1QC2H4S kinetics
7200.14–1.3630.5 ± 0.2QC2H4S kinetics
9500.09–1.0844.9 ± 0.1QC2H4S kinetics
a Units of 1013 molecule cm−3. b units of 10−12 cm3 molecule−1s−1; statistical 2σ uncertainty is given; total estimated uncertainty is 15%. c HW: halocarbon wax; Q: quartz. d k2 derived from C2H4S (C2H4S kinetics) or H-atom (H kinetics) decay monitored in excess of H and C2H4S, respectively.
Disclaimer/Publisher’s Note: The statements, opinions and data contained in all publications are solely those of the individual author(s) and contributor(s) and not of MDPI and/or the editor(s). MDPI and/or the editor(s) disclaim responsibility for any injury to people or property resulting from any ideas, methods, instructions or products referred to in the content.