Article

Excited-State Dynamics of Bis(tetraethylammonium) Di-µ-bromo-dibromodicuprate(I) Thin Films

Physical Chemistry 2, Department Chemistry and Biology, Faculty IV: School of Science and Technology, University of Siegen, Adolf-Reichwein-Str. 2, 57076 Siegen, Germany
*
Author to whom correspondence should be addressed.
Molecules 2023, 28(23), 7841; https://doi.org/10.3390/molecules28237841
Submission received: 30 October 2023 / Revised: 19 November 2023 / Accepted: 26 November 2023 / Published: 29 November 2023
(This article belongs to the Section Physical Chemistry)

Abstract

:
Organic–inorganic halocuprates based on monovalent copper are promising luminescent compounds for optoelectronic applications; however, their relaxation processes in the excited electronic state are severely underexplored. In this contribution, we prepare thin films of bis(tetraethylammonium) di-µ-bromo-dibromodicuprate(I) [N(C2H5)4]2[Cu2Br4], abbreviated (TEA)2Cu2Br4, which features a “molecular salt” structure containing discrete [Cu2Br4]2− anions. This compound, which has an absorption peak at 283 nm, displays a blue, strongly Stokes-shifted emission with a peak at 467 nm. Transient photoluminescence (PL) experiments using broadband emission detection and time-correlated single-photon counting (TCSPC) both find an excited-state lifetime of 57 μs at 296 K. UV–Vis transient absorption experiments at 296 K covering time scales from femto- to microseconds provide evidence for the formation of the T1 state through intersystem crossing from S1 with a time constant of 184 ps. The triplet state subsequently decays to S0 predominantly by phosphorescence. In addition, the time constants for carrier–optical phonon scattering (1.8 ps) and acoustic phonon relaxation (8.3 ns and 465 ns) of (TEA)2Cu2Br4 are provided.

Graphical Abstract

1. Introduction

Copper(I)-based materials are promising systems for light-emitting diode (LED) applications because of their high photoluminescence quantum yield and their environmentally benign properties [1,2,3]. One important subgroup are the halocuprates(I), which feature anion chromophores and reach PL quantum yields above 90% [4,5,6,7]. Considerable synthesis efforts have been dedicated to halocuprate(I) systems with closed-shell organic countercations mainly by the groups of Jagner, Willett, and Hartl, and compounds with zero-, one- and two-dimensional anions were obtained [8,9,10]. These early investigations focused on the structural characterization of these compounds without exploring their spectroscopic properties in detail [11].
Only recently, this class of materials has experienced a renaissance, initiated by the drive to find less toxic and more chemically stable alternatives for lead perovskites in LED applications. A range of halocuprates(I) have been explored as crystals, nanoparticles, and thin films featuring inorganic [1,5,6,7,12] or organic countercations [13,14,15,16,17,18]. While these studies found a high PL quantum yield for many of these compounds, a thorough understanding of the underlying luminescence mechanisms is still missing, especially the relation between the photoinduced charge carrier dynamics and the specific structure (0D, 1D, or 2D) of the halocuprate(I) anions and the impact of the countercation.
Detailed spectroscopic information on the electronic relaxation of such compounds can be provided by ultrafast broadband transient absorption and emission experiments. For instance, we recently carried out ultrafast broadband UV–Vis transient absorption measurements on the carrier dynamics of CsCu2I3 thin films, which feature “infinitely long” [Cu2I3]nn anion chains [19]. In these experiments, we detected the disappearance of free exciton (FE) emission as a decay of their stimulated emission band at 320 nm. We were able to provide a time constant for the formation and cooling of self-trapped excitons (STEs) of 12 ps, consistent with a small activation energy in the meV range. The emission band of the STEs was strongly red-shifted and peaked at 564 nm (2.20 eV). These findings were largely confirmed by two later investigations, which suggested additional processes affecting the transient absorption response, such as phonon-assisted cooling and reorganization [20,21].
More recently, we studied the thin films of (CH3NH3)4Cu2Br6 (denoted as (MA)4Cu2Br6 below), which also showed strongly Stokes-shifted emission with a peak at 530 nm (2.40 eV) [22]. This copper(I) compound represents a 0D “molecular salt” structure with “isolated” [Cu2Br6]4− ions. Time-resolved PL experiments provided an excited-state lifetime of 114 μs at 296 K. The results from the femto- to microsecond UV−Vis−NIR transient absorption experiments combined with DFT/TDDFT calculations suggested the formation of a long-lived, structurally relaxed triplet species through intersystem crossing (ISC) (61 ps), which almost exclusively decayed by phosphorescence. In addition, time scales for the structural relaxation and cooling processes were extracted from a kinetic analysis of the transient spectra. The calculations for the (MA)4Cu2Br6 crystal and the isolated [Cu2Br6]4− anion suggested a strong impact of the crystal environment on the structure of the anion [22].
In this paper, we extend our investigations toward another 0D halocuprate(I) system, namely bis(tetraethylammonium) di-µ-bromo-dibromodicuprate(I) ([N(C2H5)4]2[Cu2Br4]), in the following abbreviated as (TEA)2Cu2Br4. This system was originally synthesized and structurally characterized by Asplund and Jagner [23], and its thin-film absorption spectrum was reported by Papavassiliou et al. [24]. More recently, the absorption and emission properties of this compound were investigated in detail by Feng and coworkers [25] and by Liu et al. [26]. Lin, Zeng, and coworkers explored the application of this compound as an X-ray scintillator [27]. There are some conflicting results in the aforementioned studies, for instance, regarding the position of the absorption and emission bands and the excited-state lifetime of this molecular halocuprate(I) salt. In addition, the detailed electronic relaxation processes of (TEA)2Cu2Br4 after photoexcitation are not yet clear. We therefore present here a comprehensive investigation of this compound using steady-state and transient PL spectroscopy and UV–Vis transient absorption measurements in order to clarify the individual relaxation steps in the excited electronic states and the emission mechanism of (TEA)2Cu2Br4 thin films, which were prepared by spin coating.

2. Results and Discussion

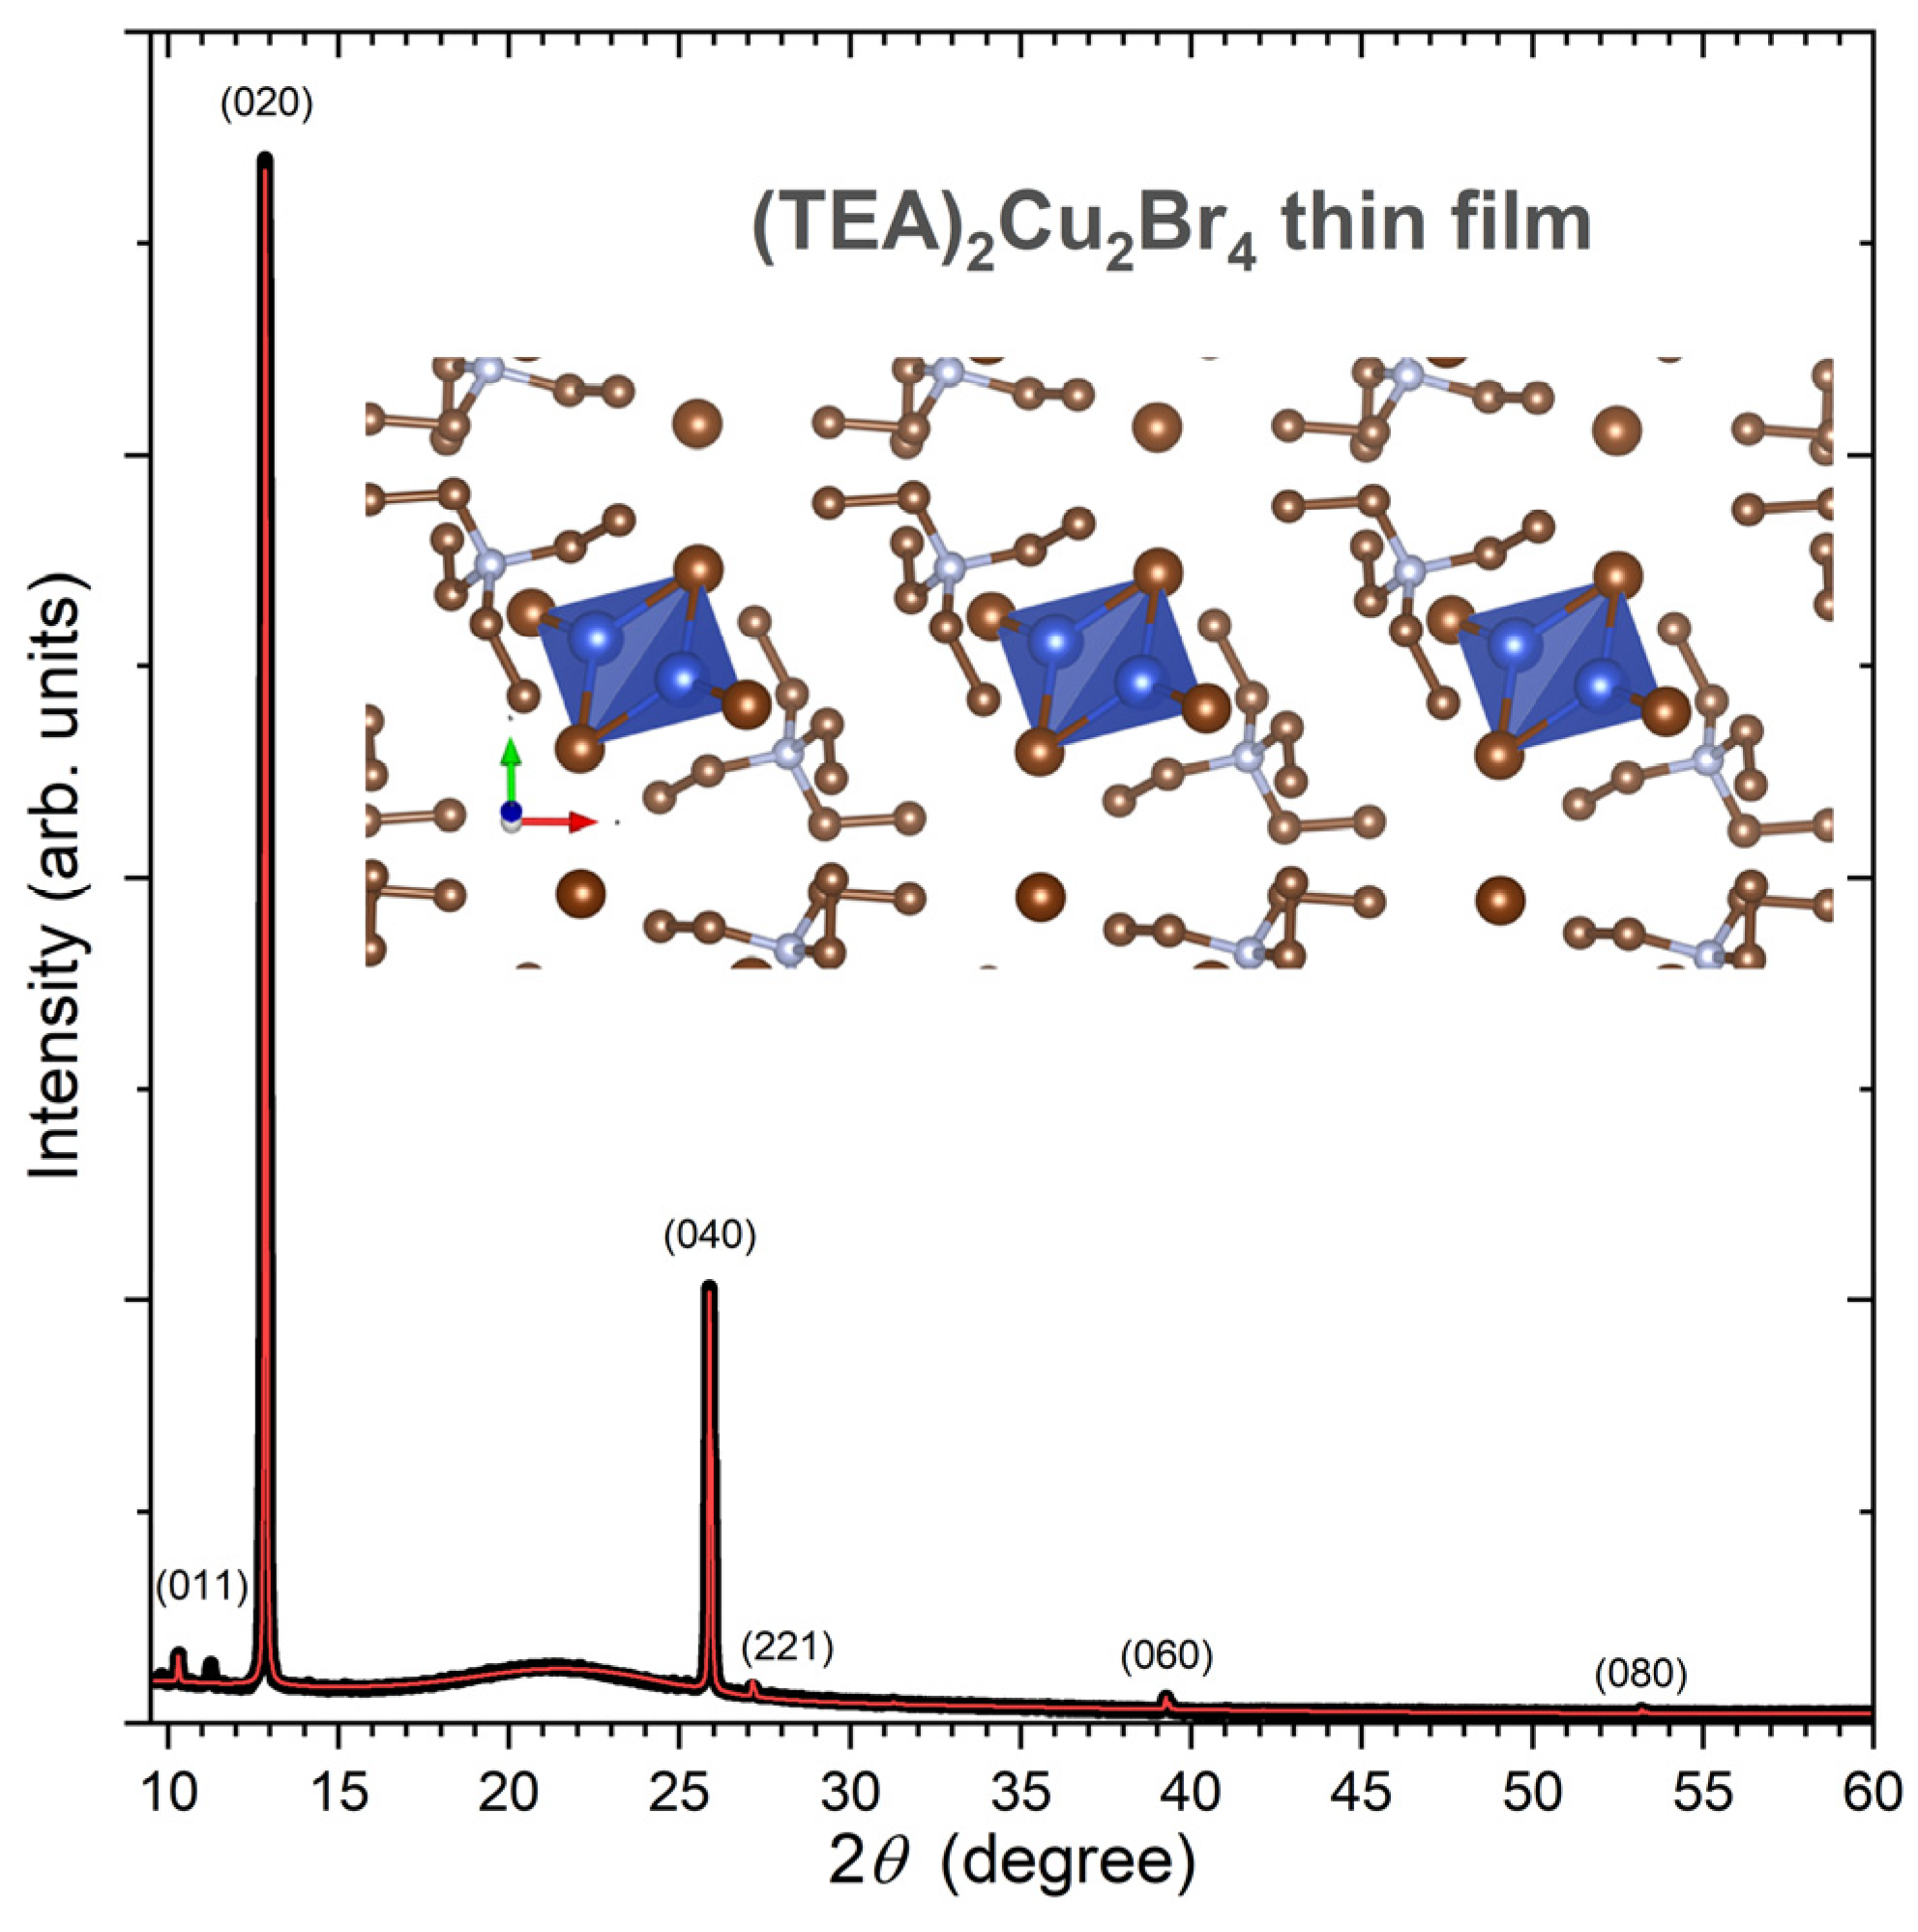
2.1. X-ray Diffraction of (TEA)2Cu2Br4 Thin Films

Figure 1 shows the experimental X-ray diffraction (XRD) pattern of a (TEA)2Cu2Br4 thin film on quartz (black line). The XRD pattern was analyzed by a Rietveld refinement procedure employing the program MAUD [28], using the structure reported by Chen et al. (monoclinic space group P 21/c, no. 14) as a starting point [25]. Interestingly, the XRD pattern exhibits a strong texture; therefore, (0k0) peaks (k = 2, 4, 6, and 8) are dominant. Other reflections, such as (011) and (221), are barely visible. From the fit (red line), we obtained the unit cell parameters a = 8.46(5) Å, b = 13.7606(4) Å, c = 11.08(2) Å, and β = 98.3(7)°. These can be, for instance, compared with the values of Chen et al., who found a = 8.3505(8) Å, b = 13.7641(13) Å, c = 11.0507(11) Å, and β = 97.076(9)°, based on their single-crystal data [25]. As expected, because of the strong texture effects of the film, only b is well defined in our case, and the scatter in the other parameters is expected, because of the limited number of diffraction peaks available. In any case, our XRD pattern confirms the successful synthesis of the (TEA)2Cu2Br4 thin film. A zoom-in into the “molecular salt” structure of this compound featuring isolated [Cu2Br4]2− anions is provided on the top right of Figure 1. It was obtained using the program VESTA 3 [29]. These anions are discrete centrosymmetric dimers, and the configuration of the bromide ligands around copper(I) is distorted trigonal planar [23].

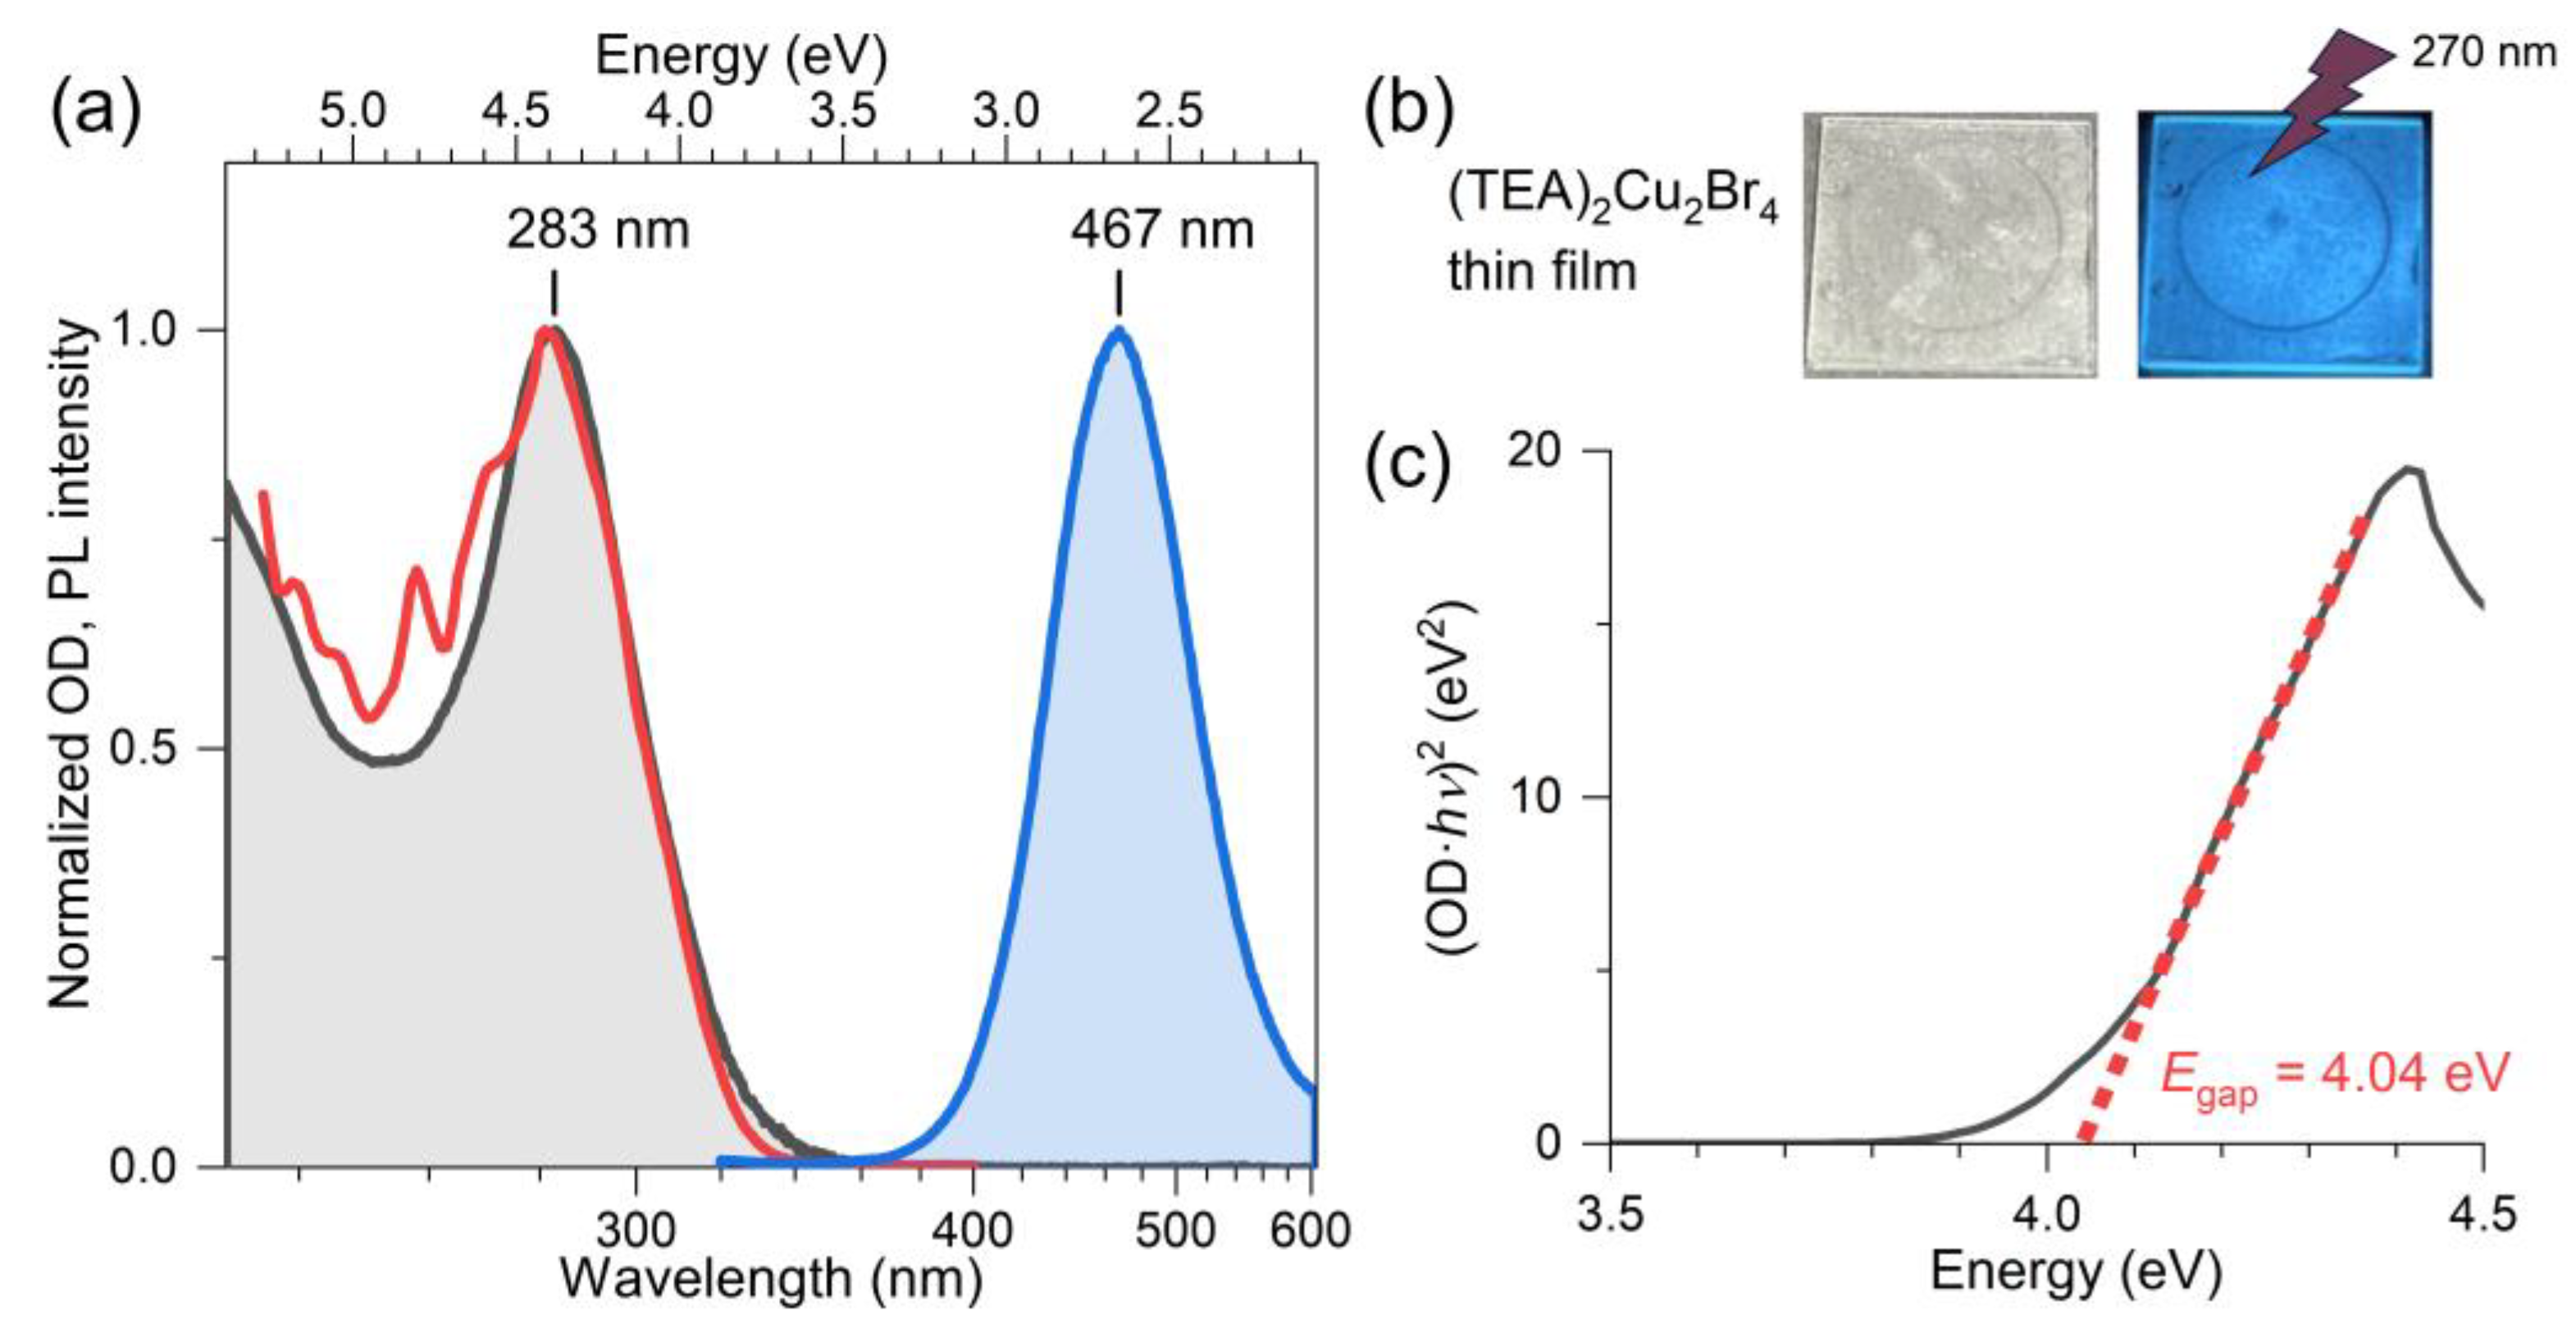
2.2. Steady-State Absorption and Photoluminescence of (TEA)2Cu2Br4 Thin Films

Figure 2a shows the steady-state absorption spectrum (black, baseline-corrected), the PL excitation spectrum recorded at the emission wavelength 460 nm (red), as well as the PL spectrum for the excitation wavelength of 310 nm (blue) for a (TEA)2Cu2Br4 thin film on a quartz substrate. The two photographs in panel b demonstrate that the film is colorless and that illumination by UV light (270 nm) results in an intense blue emission. The absorption spectrum in panel a has a peak at 283 nm (4.38 eV), and its shape is in good agreement with the PL excitation spectrum. The position of the absorption band agrees favorably with previous estimates of Papavassiliou et al. (276 nm) [24] and Liu et al. (280 nm) [26] for this compound. The Tauc plot analysis of the PL excitation spectrum, shown in panel c, which assumes a direct transition (i.e., a linear relationship for (OD·hv)2 vs. E close to the band edge), provides a value of 4.04 eV for the position of the direct band gap (Egap) of (TEA)2Cu2Br4. The peak of the broad emission band is located at 467 nm (EPL = 2.66 eV), and the band has a full width at half maximum (FWHM) of 520 meV. The position of the PL band is in good agreement with the results of Liu et al. (463 nm) [26] and Chen al. (476 nm) [25]. The considerable red shift of the PL band results in a large Stokes shift ΔEStokes = EgapEPL of 1.38 eV. The value may be compared with other halocuprates(I), such as CsCu2I3 (1.57 eV), featuring one-dimensional “infinitely long” [Cu2I3]nn chains [19] and the zero-dimensional molecular salt (MA)4Cu2Br6 (1.87 eV) [22]. Characteristic parameters of our spectra of (TEA)2Cu2Br4 (and also kinetic parameters for the transient optical studies reported below) are summarized in Table 1.

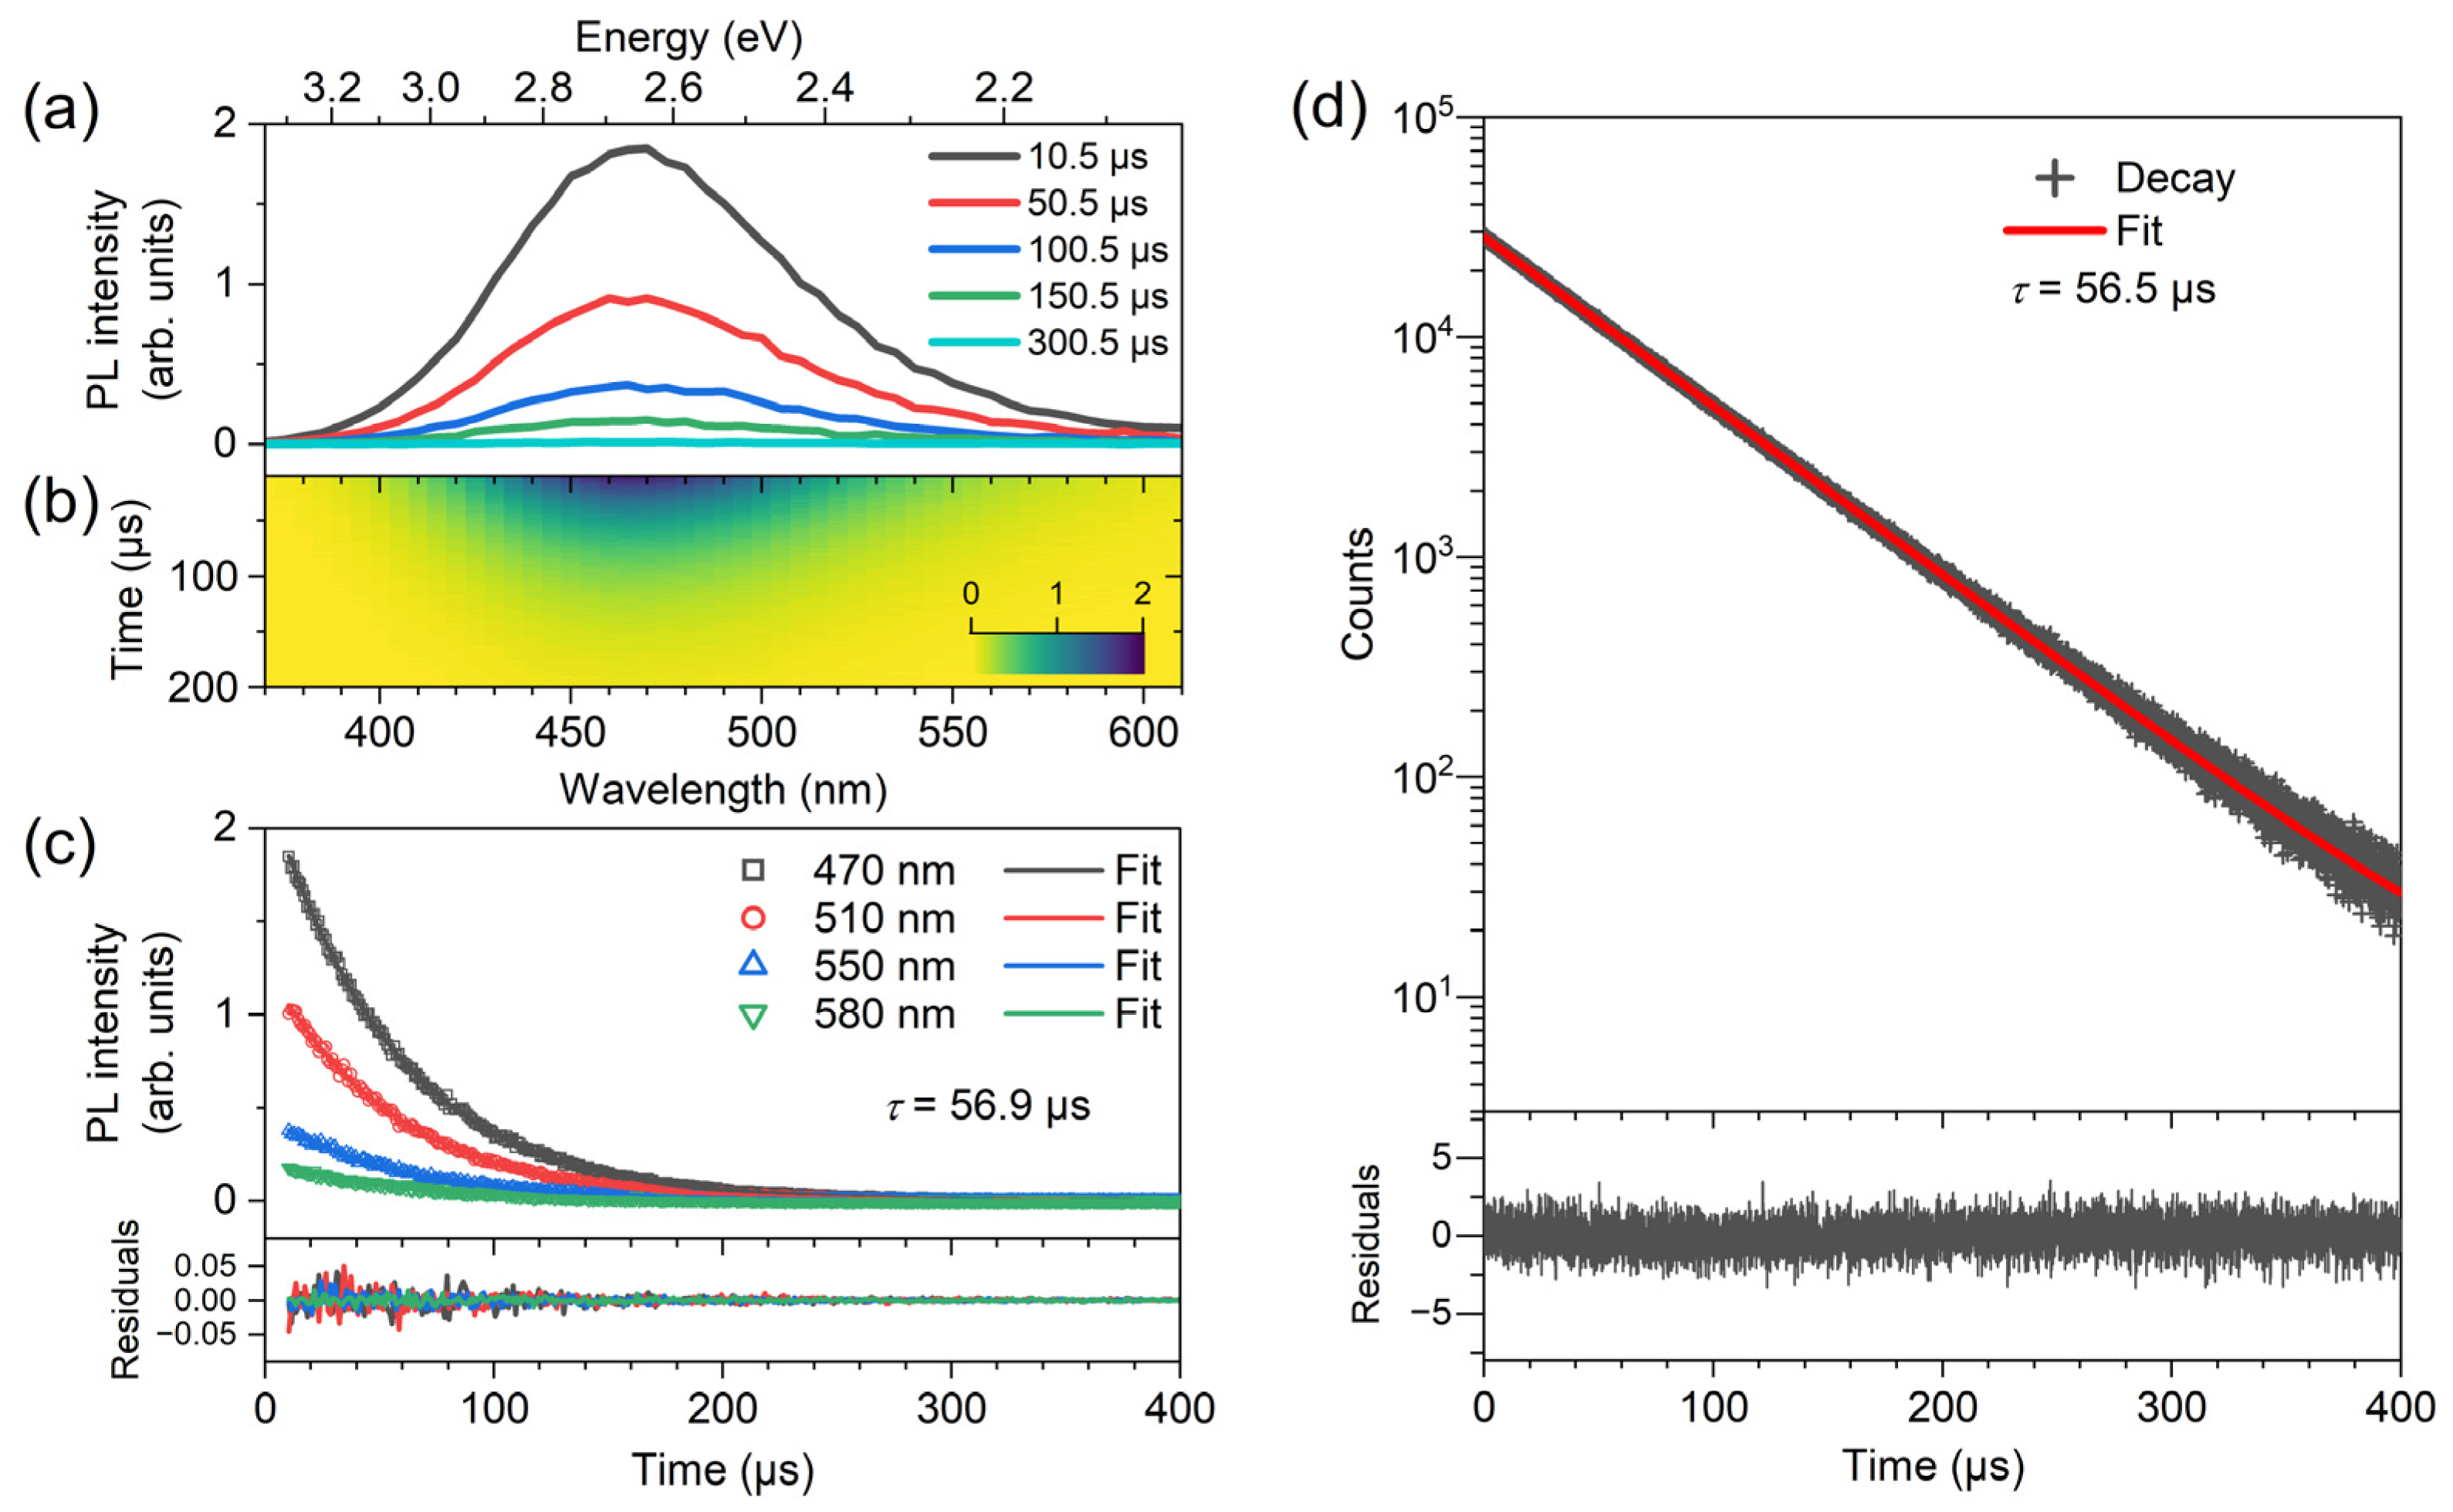
2.3. Transient PL Spectroscopy of (TEA)2Cu2Br4 Thin Films

Figure 3 contains transient PL spectra of a (TEA)2Cu2Br4 thin film, which were recorded over the wavelength range 370–610 nm upon excitation at 310 nm using a combination of a pulsed (80 Hz) xenon lamp and a monochromator. Panel a displays the PL spectra at selected times, and panel b shows the corresponding contour plot. One observes a uniform decay of the PL band. The kinetic traces shown in panel c were analyzed by a monoexponential fit using a shared time constant for all of the decays. The fit provided a value for the time constant τPL of 56.9 μs for the excited-state lifetime of (TEA)2Cu2Br4.
Due to the finite width of the light pulse of the excitation lamp in this setup (FWHM about 2 μs with a substantial tail), PL decays could be recorded only starting from 10 μs. To achieve better coverage of the whole PL decay profile with an improved time resolution and sensitivity, additional transient PL experiments were performed using time-correlated single-photon counting. A bandpass filter at 470 nm (FWHM 10 nm) was employed for detecting the emission of the (TEA)2Cu2Br4 thin film after excitation by bursts of LED pulses at 273 nm. The results of these measurements are shown in panel d of Figure 3. We observed a clean monoexponential decay over almost four orders of magnitude with a time constant τTCSPC of 56.9 μs, in very good agreement with the results of panel c. The value can be compared with previous time constants of 52 μs reported by Liu et al. [26], 58 μs of Lin, Zeng, and coworkers [27], and 53.5 μs provided by Chen et al. [25].

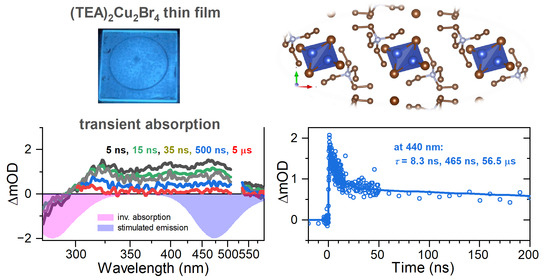
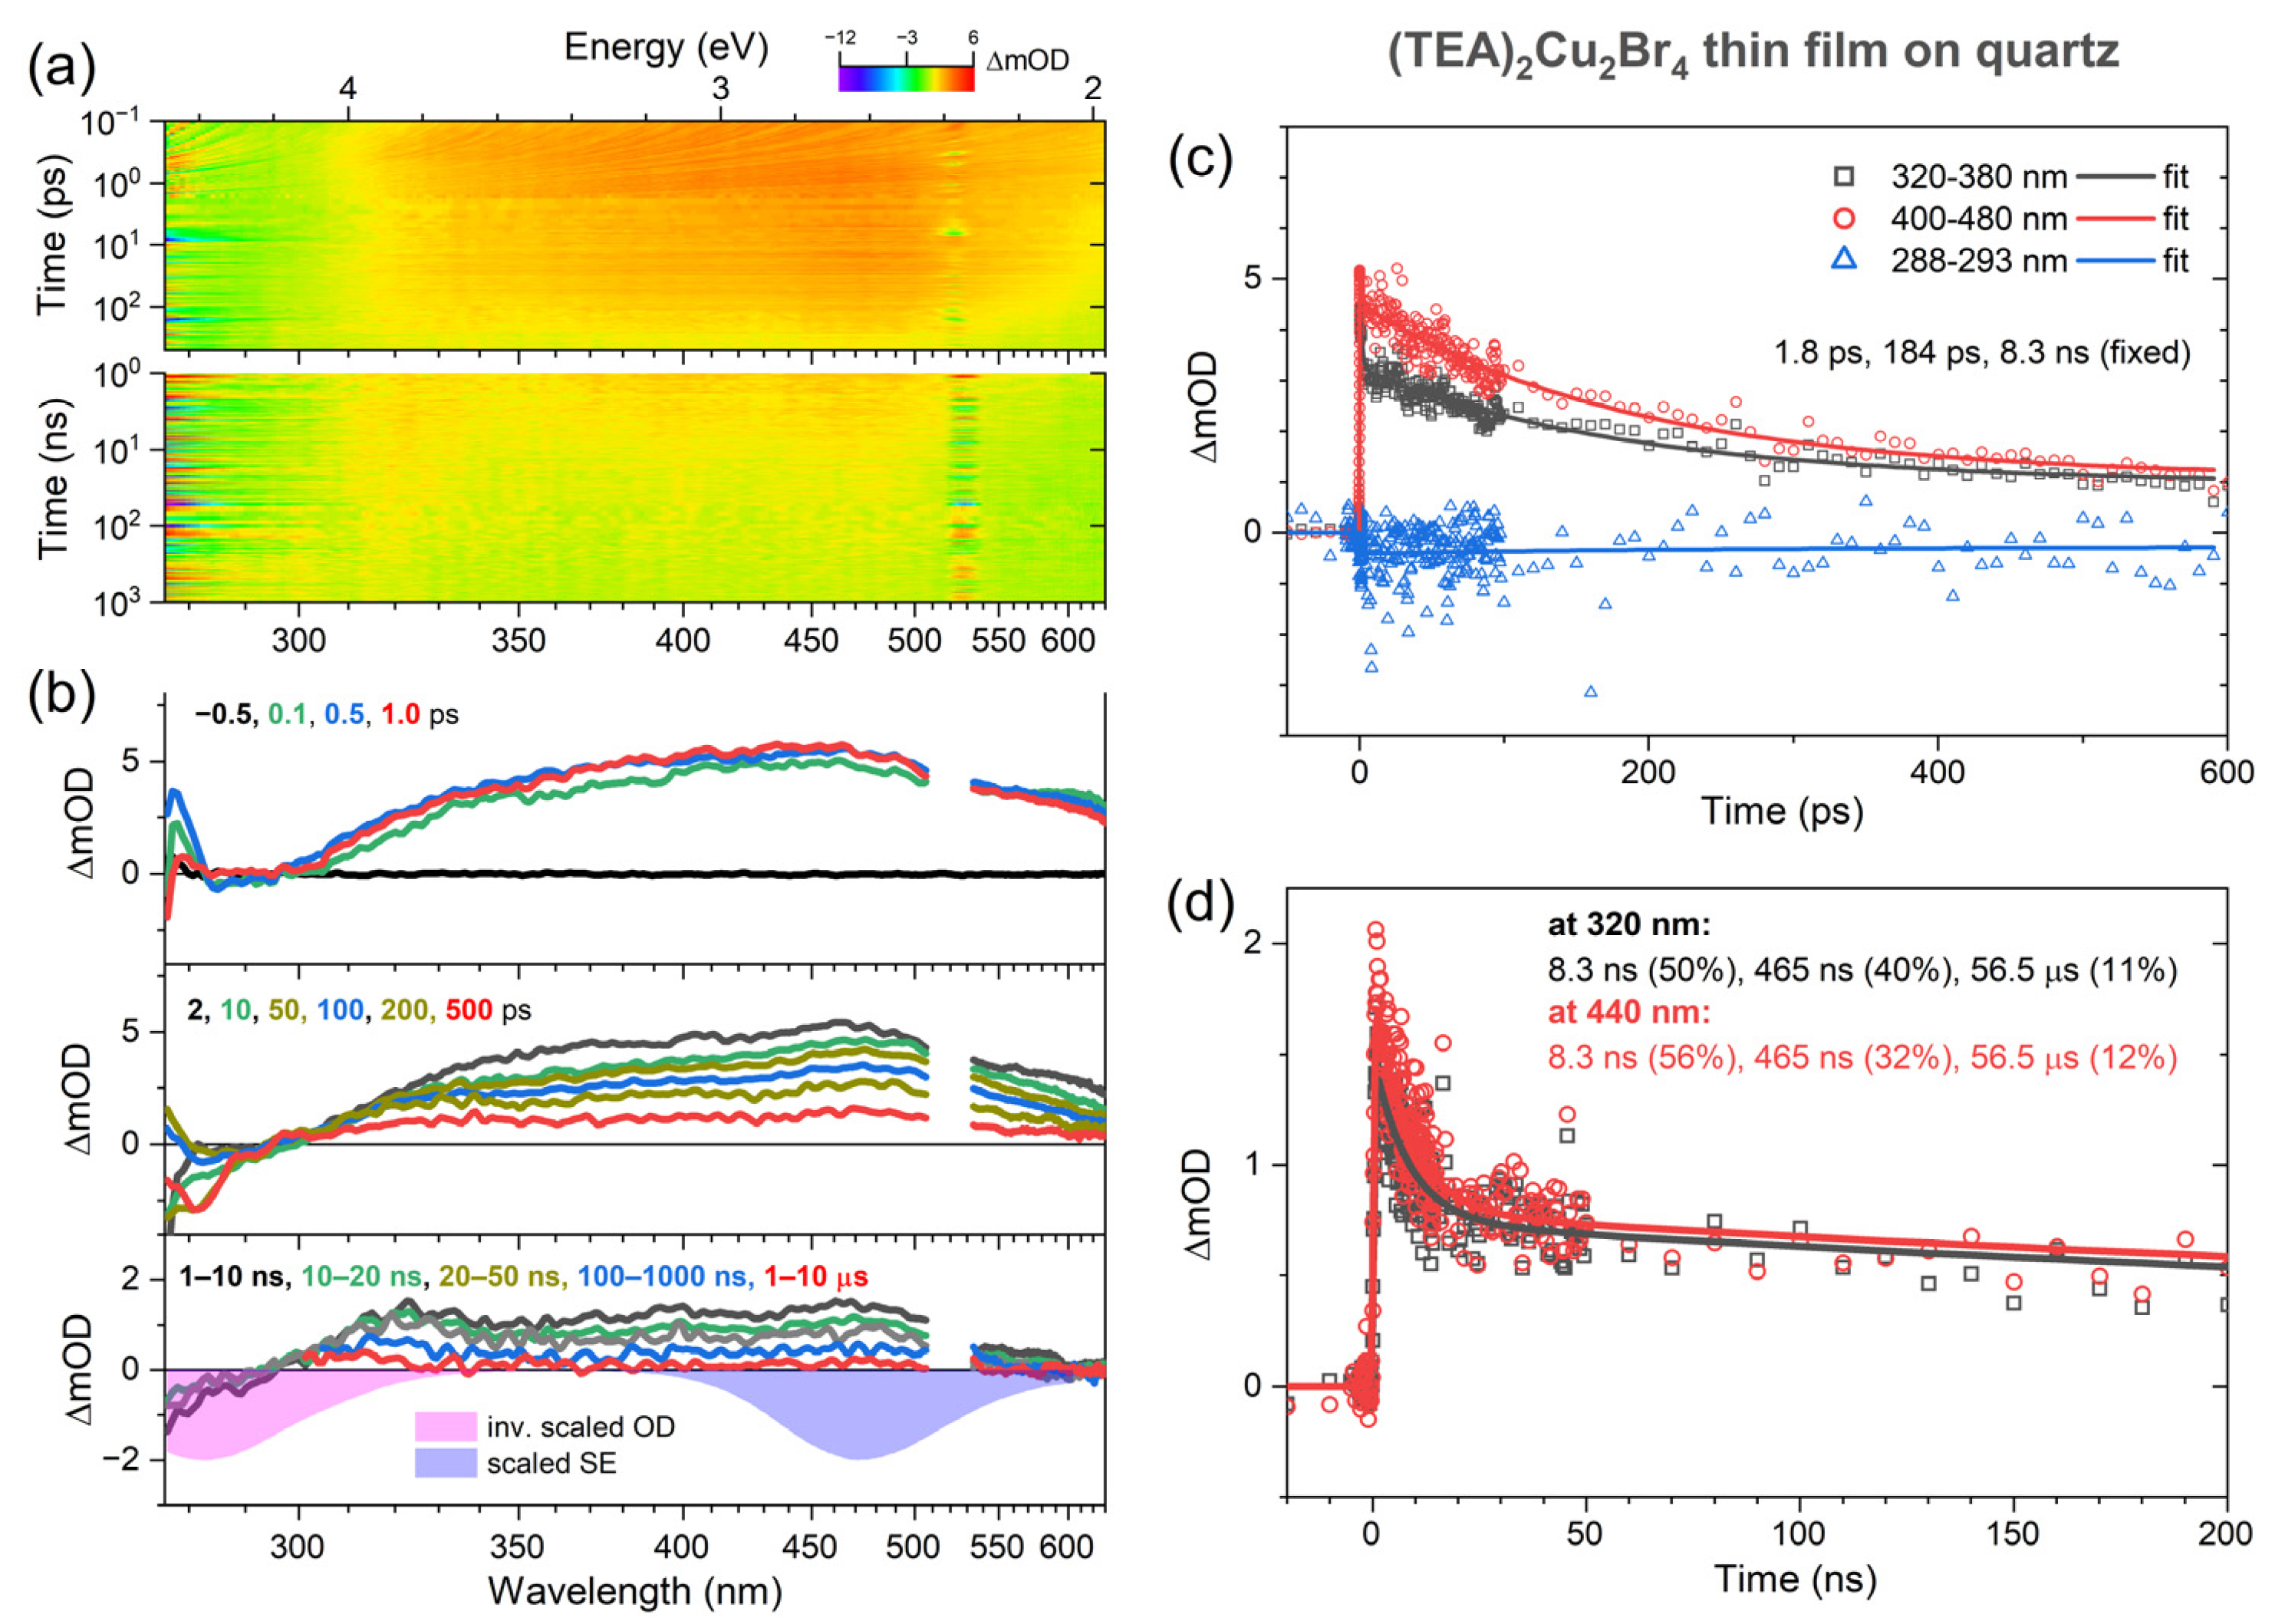
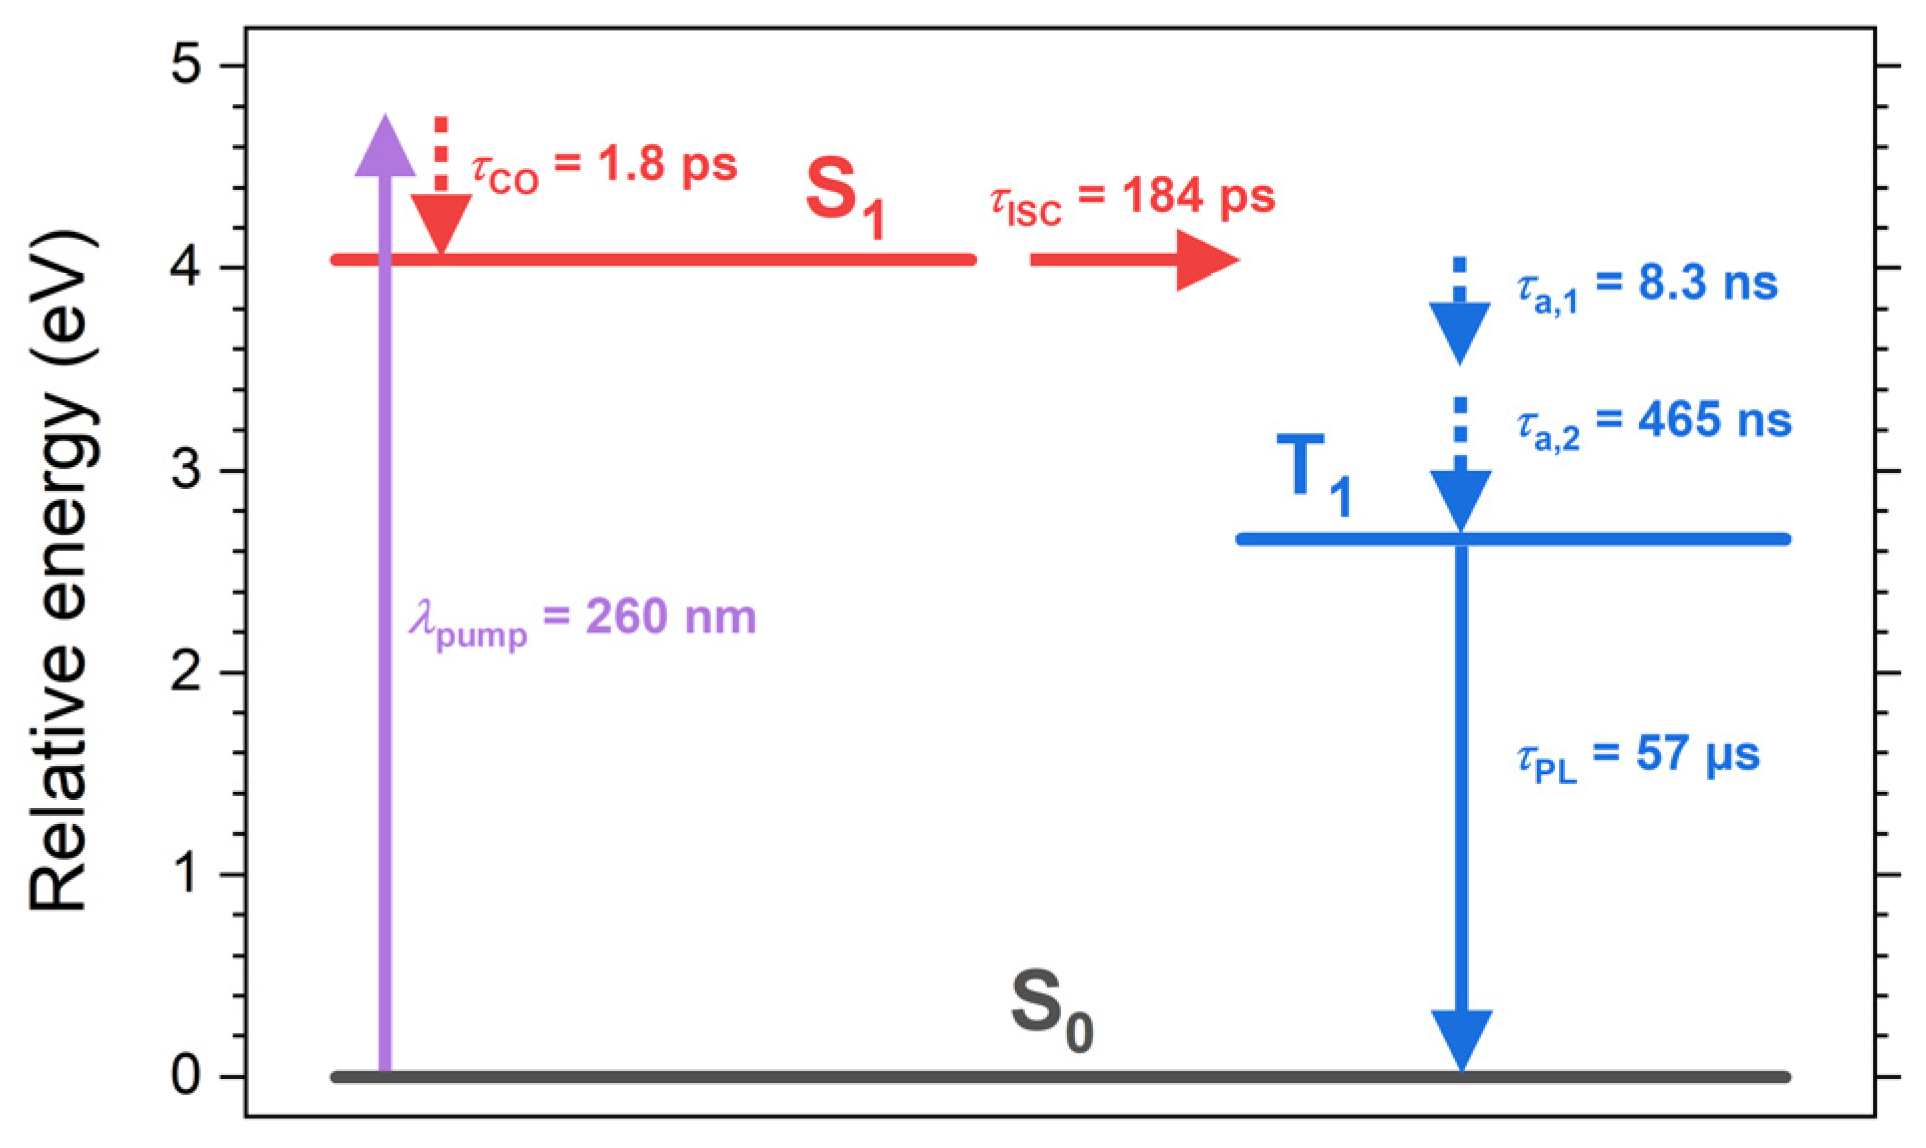
2.4. Transient Absorption Spectroscopy of (TEA)2Cu2Br4 Thin Films

Broadband UV–Vis transient absorption experiments were carried out to investigate the photoinduced dynamics of (TEA)2Cu2Br4 in more detail. They covered a time scale from femtoseconds to microseconds. The thin film was photoexcited with either femtosecond pulses at 260 nm or nanosecond pulses at 266 nm. The results are presented in Figure 4. Panel a contains contour plots of the transient absorption data for the measurements employing femtosecond (top) and nanosecond (bottom) excitation. Panel b shows selected transient absorption spectra at the delay times indicated, and panels c and d contain representative kinetics for time scales up to 600 ps and 200 ns, respectively.
Around zero delay time at the top of panel b, we see the immediate formation of a broad absorption band with a peak at about 470 nm, which spans the entire UV–Vis range. It overlaps with the negative ground-state bleach (GSB) region, which should be located below 330 nm (compare with the magenta-colored inverted steady-state absorption spectrum at the bottom of panel b). The GSB region is also overlapped by stray light contributions of the 260 nm pump pulse (less serious for nanosecond laser excitation at 266 nm). In a localized, “molecular” picture, we assigned the broad absorption band to S1 excited-state absorption (ESA) of the “isolated” [Cu2Br4]2− anions. An initial weak decay of this band with a time constant τCO of 1.8 ps was assigned to vibrational relaxation of the S1 state (corresponding to carrier-optical (CO) phonon scattering in a band structure picture of semiconductors).
In the following, the initially formed ESA band decays in an asymmetric fashion. The part around 470 nm decays substantially, whereas there is virtually no change around 320 nm. The resulting change in the band shape is more clearly seen when comparing the spectra in the nanosecond regime (see, for instance, the black spectrum averaged over the time range 1–10 ns), with broad peaks visible around 320 nm and 450 nm. We assigned this process to intersystem crossing from the S1 state to the also broadly absorbing T1 triplet state, and the time constant τISC for this decay is 184 ps. We observed similar dynamics in the case of the “molecular salt” (MA)4Cu2Br6, where the ISC process to the T1 state was also clearly identified, in that case, with a time constant of 61 ps [22]. The triplet mechanism is also consistent with the absence of a negative stimulated emission (SE) feature, which would be expected to appear around 470 nm (compare with the violet-colored steady-state SE spectrum at the bottom of panel b). Because of the forbidden nature of the T1 → S0 transition, this SE band must have a very small oscillator strength and is therefore not observable.
On even longer time scales, we see a further decay of the band with the time constants of 8.3 ns and 465 ns. This cannot be the decay from T1 to S0 (mainly by phosphorescence), because this lifetime was independently determined as 57 μs from the transient PL experiments in Figure 3. Instead, we assigned the dynamics to slower cooling processes in the T1 state (corresponding to acoustic phonon relaxation in a band structure picture with the time constants τa,1 and τa,2), where the substantial excess heat of the (TEA)2Cu2Br4 film is slowly dissipated into the quartz substrate. In fact, quite similar time constants of 12.5 ns and 1.47 μs for the same process were obtained in our previous transient absorption study of (MA)4Cu2Br6 on quartz [22]. The residual very slow decay in the transient absorption signal is consistent with the time constant of 57 μs from the transient PL experiments. Table 1 summarizes the time constants we obtained from our kinetics analysis, and Figure 5 shows a scheme of the electronic states, relaxation processes, and their respective time constants.
Our investigations therefore strongly support a “molecular” phosphorescence process as the emission mechanism of (TEA)2Cu2Br4, similar to what was previously observed for the bromocuprate(I) molecular salt (MA)4Cu2Br6 [22]. This finding is also in line with the results of investigations for related copper(I) systems. For instance, Yersin, Pfitzner, and coworkers observed an almost temperature-independent phosphorescence lifetime of about 180 μs for the compound 1,4-dimethyl-1,4-diazoniabicyclo [2.2.2]octane catena-tetra-μ-bromo-dicuprate(I), abbreviated (DABCOMe2)Cu2Br4, over the temperature range 50–200 K, which only slightly decreased to about 80 μs over the temperature range 200–300 K due to a nonradiative quenching mechanism [30]. Boden et al. found a weakly temperature-dependent emission lifetime (0.7–3 μs) with an intermediate maximum for the copper(I) system Cu4I4(4-Me)2 (4-Me = 4-methyl-2-(diphenylphosphino)-pyridine), which was also assigned to a phosphorescence process [31].
These results are somewhat different compared with those for the iodocuprate(I) system CsCu2I3, which features “infinitely long” [Cu2I3]nn chains. In the latter case, the PL was assigned to self-trapped exciton emission [19,32], yet this self-trapped exciton state might indeed also have triplet character. A mechanism based on thermally activated delayed fluorescence (TADF) can be safely excluded, because previous temperature-dependent transient PL experiments for (TEA)2Cu2Br4 by Liu et al. found a weak increase in the excited-state lifetime from about 35 μs at 77 K to 52 μs at 300 K [26]. This is not compatible with a TADF process, because an increase in temperature should make the reverse intersystem crossing (RISC) step from T1 to S1 faster and should thus lead to a reduction in the lifetime at a higher temperature.

3. Materials and Methods

3.1. Preparation of (TEA)2Cu2Br4 Thin Films

All preparation steps were carried out under a nitrogen atmosphere. Stoichiometrically equal amounts of CuBr (Sigma-Aldrich, Burlington, MA, USA, 99.999%) and (TEA)4NBr (Sigma-Aldrich, 99%) were dissolved in a mixture of dimethyl sulfoxide (Acros Organics, Geel, Belgium, extra dry, 99.7%) and dichloromethane (Fisher Scientific, Waltham, MA, USA, analytical grade, 99.9%) in a 3:2 molar ratio to obtain a solution with a slightly green color, which contained 15 wt% of the nominal composition (TEA)2Cu2Br4. To reduce any residual copper(II) and prevent oxidation of copper(I) to copper(II), two drops of hypophosphorous acid (Alfa Aesar, Ward Hill, MA, USA, 50 wt%) were added, which resulted in a discoloration of the solution. To achieve complete dissolution, the mixture was kept in a screw-cap jar and left for one hour in an ultrasonic bath. Prior to the preparation of the thin films, the quartz substrates (Tempotec Optics Co., Ltd., Fuzhou, China, JGS1) were thoroughly cleaned and then irradiated by UV light for 60 min (Dinies, Villingendorf, Germany, 2 UVC lamps with 11 W each) to remove any residual organic contaminants. Thin films were then deposited by spin coating the “(TEA)2Cu2Br4 solution” onto the substrates at 500 rpm for 30 s and then 2000 rpm for 30 s. Immediately after the spin coating, substrates were post-annealed at 80 °C for 60 min to remove residual solvent. Afterward, a protective layer was spin-coated on top of the halocuprate(I) film (500 rpm for 30 s and then 2000 rpm for 30 s) by using a 12.5 mg mL–1 solution of poly(methyl methacrylate) (Alfa Aesar) in anhydrous chlorobenzene (Sigma-Aldrich, 99.8%). The thin films were then annealed at 80 °C for 30 min to remove any solvent residues. The PMMA top layer protected the (TEA)2Cu2Br4 thin films against exposure to oxygen and humidity for short-term studies under atmospheric conditions.

3.2. X-ray Diffraction Experiments

The thin-film X-ray diffractograms were recorded on a diffractometer (PANalytical, Almelo, The Netherlands, X’Pert MPD PRO) using Cu radiation (Kα1 = 1.54060 Å, Kα2 = 1.54443 Å). A Rietveld refinement procedure was applied to simulate the diffractograms using the program MAUD, which included fitting of the baseline and also considered texture effects [28].

3.3. Steady-State and Time-Resolved Broadband Photoluminescence Spectroscopy

Steady-state and transient PL measurements of the thin-film samples were performed at 296 K using a spectrophotometer (Agilent, Santa Clara, CA, USA, Cary Eclipse) with the excitation and emission slit widths set at 5 nm. Transient PL decays were recorded over the wavelength range 370–610 nm at a step size of 5 nm after exciting the films at 310 nm using a pulsed xenon lamp (80 Hz, FWHM 2 μs) in combination with a monochromator. To avoid any contamination of the kinetics by contributions of the lamp pulse, the kinetics were collected starting from a delay time of 10 μs. They were recorded up to 1.0 ms, with a gate time of 2 μs and a time resolution of 1 μs. Ten individual kinetics were averaged for each wavelength. The transient spectra were obtained by transposing the set of wavelength-dependent kinetics. Finally, these PL spectra were post-processed by applying a calibration curve, which corrected for the wavelength-dependent sensitivity of the emission monochromator and photomultiplier detector.

3.4. Time-Correlated Single-Photon Counting

The TCSPC setup was described in detail previously [33]. Briefly, a UV–LED (Becker & Hickl, Berlin, Germany, UVL-FB-270) with a center wavelength of 273 nm and a pulse width of 500 ps was employed to excite the thin-film samples (T = 296 K) at vertical polarization by means of a wire grid polarizer (Thorlabs, Newton, NJ, USA, WP25M-UB). The surface of the thin film was mounted at an angle of 45° with respect to the excitation beam. To record the slow PL decay, the TCSPC module (Becker & Hickl, SPC-130IN, reverse start−stop configuration) was operated in the triggered-accumulation multichannel scaler (MCS) mode. A total of 2 μs long bursts of LED pulses (80 MHz, 160 pulses) were employed at a repetition frequency of 1 kHz. The PL was measured at an angle of 90° after passing a wire grid polarizer (Thorlabs WP25M-UB), which was set at the magic angle of 54.7°, and a bandpass filter with a center wavelength of 470 nm and an FWHM of 10 nm (Thorlabs, FB470-10). Photon detection was performed by a hybrid multialkali photodetector (Becker & Hickl, HPM-100-07) connected to the TCSPC module. The bin width of the recorded decay curve was 50 ns. The time constant of the exponential decay was extracted from a tail fit using the FAST program (Edinburgh Instruments, Livingston, UK).

3.5. Femtosecond and Nanosecond Transient Absorption Spectroscopy

Ultrafast broadband transient absorption experiments with up to 1.5 ns delay time were carried out on a setup based on a regeneratively amplified titanium:sapphire system (Coherent, Santa Clara, CA, USA, Libra USP-HE) with a center wavelength of 800 nm and a repetition frequency of 920 Hz. It covers the UV–Vis region (260–700 nm) [34] with a time resolution of about 80 fs and is based on the pump−supercontinuum probe (PSCP) technique [35]. The samples were excited at 460 Hz using the 260 nm output of an OPA system (Coherent, OPerA Solo). In order to access long delay times up to several hundred microseconds, the UV–Vis setup was combined with a Q-switched Nd:YAG microlaser (Standa, Vilnius, Lithuania, Standa-Q1TH), which was externally triggered at 460 Hz and synchronized with the electronics of the ultrafast regenerative amplifier system (jitter less than 350 ps) [22]. The second-harmonic output of the laser was frequency-doubled by an external BBO crystal, and the resulting 266 nm pulses (FWHM ca. 420 ps) were employed for exciting the halocuprate(I) thin film. The film sample (T = 296 K) had an optical density of about 0.16 at the excitation wavelength. It was mounted inside a nitrogen-flushed aluminum cell and translated by a piezo stage in the xy plane within a sample area of 2 × 2 mm2. The initial carrier number density was about 5 × 1018 cm−3. The kinetics of the charge carrier relaxation was described by a sum of three exponential functions.

4. Conclusions

Thin films of the halocuprate(I) (TEA)2Cu2Br4 were investigated by time-resolved emission and absorption spectroscopy from the femto- to microsecond time scales. The luminescence mechanism of this compound is based on the phosphorescence of the long-lived (57 μs) T1 triplet state, which is populated from the S1 state on a sub-200 ps time scale and is also responsible for the strongly Stokes-shifted photoluminescence. The emission process is governed by the molecular properties of the discrete [Cu2Br4]2− anions. In contrast, the ammonium-based countercations with aliphatic chains have only high-lying electronic states, which cannot electronically interact with the zero-dimensional halocuprate(I) chromophore. Because of their high photoluminescence quantum yield, halocuprate(I) compounds, such as (TEA)2Cu2Br4, are promising materials for LED applications. First examples of functioning electroluminescent devices have already been demonstrated, yet with quite a small external quantum efficiency below 1% [26]. Beyond optimizing device structures, future work will also need to address the reduction in the width of the emission band in these compounds to achieve a better color purity.

Author Contributions

Conceptualization, K.O. and T.L.; methodology, K.O., T.L. and M.S.; software, M.S.; investigation, D.G., K.O. and T.L.; writing—original draft preparation, K.O., T.L. and D.G.; writing—review and editing, K.O., T.L. and D.G.; supervision, K.O. and T.L. All authors have read and agreed to the published version of the manuscript.

Funding

The work of D.G. was funded through a doctoral stipend (K 212/14) by the “Fonds der Chemischen Industrie (FCI) im Verband der Chemischen Industrie e.V”.

Data Availability Statement

Data are contained within the article.

Acknowledgments

We thank M. Killian and T. Kowald (Chemistry and Structure of Novel Materials, University of Siegen) for providing the thin-film X-ray diffraction data. We also thank M. Morgenroth and K. Knötig for supporting D.G. in the lab during this project.

Conflicts of Interest

The authors declare no conflict of interest.

References

  1. Banerjee, D.; Saparov, B. Ultrabright Light Emission Properties of All-Inorganic and Hybrid Organic−Inorganic Copper(I) Halides. Chem. Mater. 2023, 35, 3364–3385. [Google Scholar] [CrossRef]
  2. Guo, Z.; Li, J.; Pan, R.; Cheng, J.; Chen, R.; He, T. All-inorganic copper(I)-based ternary metal halides: Promising materials toward optoelectronics. Nanoscale 2020, 12, 15560–15576. [Google Scholar] [CrossRef]
  3. Ravaro, L.P.; Zanoni, K.P.S.; de Camargo, A.S.S. Luminescent copper(I) complexes as promising materials for the next generation of energy-saving OLED devices. Energy Rep. 2020, 6, 37–45. [Google Scholar] [CrossRef]
  4. Creason, T.D.; McWhorter, T.M.; Bell, Z.; Du, M.-H.; Saparov, B. K2CuX3 (X = Cl, Br): All-Inorganic Lead-Free Blue Emitters with Near-Unity Photoluminescence Quantum Yield. Chem. Mater. 2020, 32, 6197–6205. [Google Scholar] [CrossRef]
  5. Jun, T.; Handa, T.; Sim, K.; Iimura, S.; Sasase, M.; Kim, J.; Kanemitsu, Y.; Hosono, H. One-step solution synthesis of white-light-emitting films via dimensionality control of the Cs–Cu–I system. APL Mater. 2019, 7, 111113. [Google Scholar] [CrossRef]
  6. Roccanova, R.; Yangui, A.; Nhalil, H.; Shi, H.; Du, M.-H.; Saparov, B. Near-Unity Photoluminescence Quantum Yield in Blue-Emitting Cs3Cu2Br5−xIx(0 ≤ x ≤ 5). ACS Appl. Electron. Mater. 2019, 1, 269–274. [Google Scholar] [CrossRef]
  7. Sebastia-Luna, P.; Navarro-Alapont, J.; Sessolo, M.; Palazon, F.; Bolink, H.J. Solvent-Free Synthesis and Thin-Film Deposition of Cesium Copper Halides with Bright Blue Photoluminescence. Chem. Mater. 2019, 31, 10205–10210. [Google Scholar] [CrossRef]
  8. Jagner, S.; Helgesson, G. On the Coordination Number of the Metal in Crystalline Halogenocuprates(I) and Halogenoargentates(I). Adv. Inorg. Chem. 1991, 37, 1–45. [Google Scholar]
  9. Hasselgren Arnby, C.; Jagner, S.; Dance, I. Questions for crystal engineering of halocuprate complexes: Concepts for a difficult system. CrystEngComm 2004, 6, 257–275. [Google Scholar] [CrossRef]
  10. Peng, R.; Li, M.; Li, D. Copper(I) halides: A versatile family in coordination chemistry and crystal engineering. Coord. Chem. Rev. 2010, 254, 1–18. [Google Scholar] [CrossRef]
  11. Hull, S.; Berastegui, P. Crystal structures and ionic conductivities of ternary derivatives of the silver and copper monohalides—II: Ordered phases within the (AgX)x − (MX)1−x and (CuX)x − (MX)1−x (M = K, Rb and Cs; X = Cl, Br and I) systems. J. Solid State Chem. 2004, 177, 3156–3173. [Google Scholar] [CrossRef]
  12. Yin, J.; Lei, Q.; Han, Y.; Bakr, O.M.; Mohammed, O.F. Luminescent Copper(I) Halides for Optoelectronic Applications. Phys. Status Solidi RRL 2021, 15, 2100138. [Google Scholar] [CrossRef]
  13. Du, Y.; Ma, L.; Yan, Z.; Xiao, J.; Wang, K.; Lin, T.; Han, X.; Xia, D. One-Dimensional Hybrid Copper(I) Iodide Single Crystal with Renewable Scintillation Properties. Inorg. Chem. 2023, 62, 11350–11359. [Google Scholar] [CrossRef] [PubMed]
  14. Zhou, S.; Chen, Y.; Li, K.; Liu, X.; Zhang, T.; Shen, W.; Li, M.; Zhou, L.; He, R. Photophysical studies for Cu(I)-based halides: Broad excitation bands and highly efficient single-component warm white-light-emitting diodes. Chem. Sci. 2023, 14, 5415–5424. [Google Scholar] [CrossRef] [PubMed]
  15. Gilley, I.W.; Creason, T.D.; McWhorter, T.M.; Saparov, B. Tunable Dual-Band White Light Emission from Gua3CuCl4 and Gua7Cu3X10·3DMF (X = Br, I). Adv. Photonics Res. 2022, 3, 2200172. [Google Scholar] [CrossRef]
  16. Meng, X.; Ji, S.; Wang, Q.; Wang, X.; Bai, T.; Zhang, R.; Yang, B.; Li, Y.; Shao, Z.; Jiang, J.; et al. Organic–Inorganic Hybrid Cuprous-Based Metal Halides for Warm White Light-Emitting Diodes. Adv. Sci. 2022, 9, 2203596. [Google Scholar] [CrossRef]
  17. Peng, H.; Wang, X.; Tian, Y.; Zou, B.; Yang, F.; Huang, T.; Peng, C.; Yao, S.; Yu, Z.; Yao, Q.; et al. Highly Efficient Cool-White Photoluminescence of (Gua)3Cu2I5 Single Crystals: Formation and Optical Properties. ACS Appl. Mater. Interfaces 2021, 13, 13443–13451. [Google Scholar] [CrossRef]
  18. Peng, H.; Yao, S.; Guo, Y.; Zhi, R.; Wang, X.; Ge, F.; Tian, Y.; Wang, J.; Zou, B. Highly Efficient Self-Trapped Exciton Emission of a (MA)4Cu2Br6 Single Crystal. J. Phys. Chem. Lett. 2020, 11, 4703–4710. [Google Scholar] [CrossRef]
  19. Kentsch, R.; Morgenroth, M.; Scholz, M.; Xu, K.; Schmedt auf der Günne, J.; Lenzer, T.; Oum, K. Direct Observation of the Exciton Self-Trapping Process in CsCu2I3 Thin Films. J. Phys. Chem. Lett. 2020, 11, 4286–4291. [Google Scholar] [CrossRef]
  20. Chen, C.-Y.; Lin, Y.-I.; Lai, P.-T.; Lin, H.-C.; Tan, G.-H.; Lin, H.-W.; Schaller, R.D. Self-Trapped and Free Exciton Dynamics in Vacuum-Deposited Cesium Copper Iodide Thin Films. Adv. Opt. Mater. 2022, 10, 2200005. [Google Scholar] [CrossRef]
  21. Xing, Z.; Zhou, Z.; Zhong, G.; Chan, C.C.S.; Li, Y.; Zou, X.; Halpert, J.E.; Su, H.; Wong, K.S. Barrierless Exciton Self-Trapping and Emission Mechanism in Low-Dimensional Copper Halides. Adv. Funct. Mater. 2022, 32, 2207638. [Google Scholar] [CrossRef]
  22. Merker, A.; Scholz, M.; Morgenroth, M.; Lenzer, T.; Oum, K. Photoinduced Dynamics of (CH3NH3)4Cu2Br6 Thin Films Indicating Efficient Triplet Photoluminescence. J. Phys. Chem. Lett. 2021, 12, 2736–2741. [Google Scholar] [CrossRef] [PubMed]
  23. Asplund, M.; Jagner, S. Crystal Structure of Bis(tetraethylammonium) Di-bromo-μ-dibromodicuprate(I), [N(C2H5)4]2[Cu2Br4]. Acta Chem. Scand. Ser. A 1984, 38, 135–139. [Google Scholar] [CrossRef]
  24. Papavassiliou, G.C.; Mousdis, G.A.; Terzis, A.; Raptopoulou, C.P. Excitonic Bands in the Optical Absorption Spectra of (Bu4N)CuBr2, (Et4N)2Cu2Br4, (Pr4N)2Cu4Br6, (Bu4N)2Cu2I4, (Me4N)Cu2I3, (Pr4N)4Ag4I8, (Me4N)Ag2I3, (Et4N)Ag2Br3, and Similar Compounds. Z. Für Naturforschung B 1999, 54, 109–112. [Google Scholar] [CrossRef]
  25. Chen, S.; Gao, J.; Chang, J.; Li, Y.; Huangfu, C.; Meng, H.; Wang, Y.; Xia, G.; Feng, L. Family of Highly Luminescent Pure Ionic Copper(I) Bromide Based Hybrid Materials. ACS Appl. Mater. Interfaces 2019, 11, 17513–17520. [Google Scholar] [CrossRef] [PubMed]
  26. Liu, X.; Yuan, F.; Zhu, C.; Li, J.; Lv, X.; Xing, G.; Wei, Q.; Wang, G.; Dai, J.; Dong, H.; et al. Near-unity blue luminance from lead-free copper halides for light-emitting diodes. Nano Energy 2022, 91, 106664. [Google Scholar] [CrossRef]
  27. Bin, X.; Wu, L.; Liu, J.; Lin, T.; Zeng, R. Fast Synthesis of Organic Copper Halide Crystals for X-ray Imaging. Crystals 2022, 12, 1799. [Google Scholar] [CrossRef]
  28. Lutterotti, L. Total pattern fitting for the combined size-strain-stress-texture determination in thin film diffraction. Nucl. Instrum. Methods Phys. Res. Sect. B 2010, 268, 334–340. [Google Scholar] [CrossRef]
  29. Momma, K.; Izumi, F. VESTA 3 for three-dimensional visualization of crystal, volumetric and morphology data. J. Appl. Cryst. 2011, 44, 1272–1276. [Google Scholar] [CrossRef]
  30. Maderlehner, S.; Leitl, M.J.; Yersin, H.; Pfitzner, A. Halocuprate(I) zigzag chain structures with N-methylated DABCO cations—Bright metal-centered luminescence and thermally activated color shifts. Dalton Trans. 2015, 44, 19305–19313. [Google Scholar] [CrossRef]
  31. Boden, P.; Di Martino-Fumo, P.; Busch, J.M.; Rehak, F.R.; Steiger, S.; Fuhr, O.; Nieger, M.; Volz, D.; Klopper, W.; Bräse, S.; et al. Investigation of Luminescent Triplet States in Tetranuclear CuI Complexes: Thermochromism and Structural Characterization. Chem. Eur. J. 2021, 27, 5439–5452. [Google Scholar] [CrossRef] [PubMed]
  32. Du, M.-H. Emission Trend of Multiple Self-Trapped Excitons in Luminescent 1D Copper Halides. ACS Energy Lett. 2020, 5, 464–469. [Google Scholar] [CrossRef]
  33. Morgenroth, M.; Scholz, M.; Guy, L.; Oum, K.; Lenzer, T. Spatiotemporal Mapping of Efficient Chiral Induction by Helicene-Type Additives in Copolymer Thin Films. Angew. Chem. Int. Ed. 2022, 61, e202203075. [Google Scholar] [CrossRef] [PubMed]
  34. Oum, K.; Lenzer, T.; Scholz, M.; Jung, D.Y.; Sul, O.; Cho, B.J.; Lange, J.; Müller, A. Observation of Ultrafast Carrier Dynamics and Phonon Relaxation of Graphene from the Deep-Ultraviolet to the Visible Region. J. Phys. Chem. C 2014, 118, 6454–6461. [Google Scholar] [CrossRef]
  35. Dobryakov, A.L.; Kovalenko, S.A.; Weigel, A.; Pérez Lustres, J.L.; Lange, J.; Müller, A.; Ernsting, N.P. Femtosecond pump/supercontinuum-probe spectroscopy: Optimized setup and signal analysis for single-shot spectral referencing. Rev. Sci. Instrum. 2010, 81, 113106. [Google Scholar] [CrossRef]
Figure 1. Experimental (black) and simulated (red) XRD pattern of a (TEA)2Cu2Br4 thin film at 293 K. The simulation and hkl assignments are based on a Rietveld refinement using the program MAUD [28]. The broad background around 21° arises from the amorphous quartz substrate. On the top right, a zoom-in into the crystal structure of this molecular salt is provided, which contains discrete [Cu2Br4]2− anions (colors of atoms: Cu (blue), Br (bronze), C (gold), and N (silver)). The structure was visualized using VESTA 3 [29].
Molecules 28 07841 g001
Figure 2. (a) Normalized steady-state absorption (black), PL excitation (red, λem = 460 nm), and PL spectra (blue, λexc = 310 nm of a (TEA)2Cu2Br4 thin film on quartz at 296 K. (b) Photos of the colorless thin film (left) and the blue emission of the film upon photoexcitation with continuous-wave light from a UV–LED with a peak wavelength of 270 nm (right). (c) Tauc plot of the PL excitation spectrum assuming a direct band gap of the material.
Molecules 28 07841 g002
Figure 3. Transient photoluminescence decay of a (TEA)2Cu2Br4 thin film on quartz at 296 K. (a) Selected broadband PL spectra at the times indicated. (b) Contour map of the PL decay. (c) PL kinetics at selected wavelengths after excitation at 310 nm providing a common decay time constant of 56.9 μs. The fit residuals are displayed in the bottom panel. (d) Transient PL decay from TCSPC experiments upon excitation by bursts of LED pulses at 273 nm. The TCSPC data are shown as black crosses (one data point every 50 ns), and the red line represents a monoexponential fit with a time constant of 56.5 μs. The fit residuals (dark gray line) are provided in the panel at the bottom.
Molecules 28 07841 g003
Figure 4. Transient absorption response of a (TEA)2Cu2Br4 thin film on quartz. (a) Contour plots for excitation with femtosecond laser pulses at 260 nm (top) and nanosecond laser pulses at 266 nm (bottom). Increased noise around 520 nm and 532 nm, respectively, arises from the second order of the pump beam stray light in the grating spectrograph. (b) Selected spectra from the femtosecond experiments (upper two panels) and the nanosecond measurements (bottom panel) at the time delays indicated. The magenta and violet spectra in the bottom panel correspond to the inverted steady-state absorption spectrum and the steady-state emission spectrum, respectively. (c,d) Selected kinetics including triexponential fits for the femto- and nanosecond experiments at the wavelengths indicated.
Molecules 28 07841 g004
Figure 5. Schematic overview of the electronic states, relaxation processes, and their respective time constants for the thin film of the molecular salt (TEA)2Cu2Br4 on quartz based on the steady-state and time-resolved spectroscopic data summarized in Table 1. λpump indicates an example for an excitation wavelength employed in the femtosecond transient absorption measurements.
Molecules 28 07841 g005
Table 1. Summary of the parameters obtained from the steady-state absorption and photoluminescence experiments and time constants extracted from the kinetic analysis of the TCSPC and transient absorption experiments for (TEA)2Cu2Br4 thin films.
DescriptionQuantity (Unit)Value
Position of absorption peakEabs (eV)4.38
Position of direct band gap (from Tauc plot)Egap (eV)4.04
Position of PL peakEPL (eV)2.66
Width of PL spectrumΔEPL (eV)0.52
Stokes shift (EgapEPL)ΔEStokes (eV)1.38
Carrier-optical phonon scatteringτCO (ps)1.8
S1 → T1 intersystem crossing (ISC)τISC (ps)184
Acoustic phonon relaxationτa,1 (ns)8.3
τa,2 (ns)465
T1 → S0 (mainly phosphorescence, ISC negligible)τPL (μs)56.9
τTCSPC (μs)56.5
Disclaimer/Publisher’s Note: The statements, opinions and data contained in all publications are solely those of the individual author(s) and contributor(s) and not of MDPI and/or the editor(s). MDPI and/or the editor(s) disclaim responsibility for any injury to people or property resulting from any ideas, methods, instructions or products referred to in the content.

