1. Introduction
Myristica fragrans Houtt. is the dried, mature seed kernel of nutmeg found in Malaysia, Indonesia, the West Indies and elsewhere [
1].
M. fragrans is widely used as a domestic spice for cooking, in cakes and in drinks [
2]. It is mainly used as a condiment owing to its unique flavour, colour or preservation effect [
1].
M. fragrans contains a variety of functionally active components, such as essential oils, lignans, phenylpropanoids, total phenolics and flavonoids. It has functional activities such as anticancer, antioxidant, bacteriostatic, etc. [
3].
Essential oils are among the main components of
M. fragrans [
4].
M. fragrans essential oils have the odour and taste of
M. fragrans and can be used as a flavouring agent instead of
M. fragrans powder. The essential oils are considered as promising food preservatives due to their proven antibacterial and antioxidant properties [
5]. Both active and toxic components are present in
M. fragrans essential oils. Three common toxic ingredients are myristicin, safrole and elemicin [
6]. Myristicin can cause hepatic steatosis, leading to necrosis [
7]. The toxic dose of myristicin is 1–2 mg, beyond which it may cause poisoning leading to many health problems associated with brain problems and, in severe cases, to death [
8]. Safrole is both hallucinogenic and carcinogenic [
1], but there are no clear consumption dose limits in the available studies. Elemicin exposure can cause hepatomegaly and hepatic ossification, and the levels of elemicin in food and spices are in the range of 1.2–150 mg/kg [
9]. Abuse of
M. fragrans as a psychoactive drug at doses of 3–5 g can lead to psychoactive effects, and the intake doses shall not exceed 20–25 g [
6].
Lignans, one of the main functional components of
M. fragrans, have the same functional activity as
M. fragrans and are non-volatile [
10]. They have antioxidant, bacteriostatic, anti-inflammatory, anti-cancer, anti-diabetes, liver and nerve protection, prevention of osteoporosis and other activities [
11]. Among them, the lignan component dehydrodiisoeugenol is the active ingredient of
M. fragrans and is chemically stable, with a strong antibacterial and inhibitory effect on intrahepatic lipid oxidation [
12,
13]. Due to its high content and activity, it is used as an evaluation indicator for the processing of
M. fragrans [
14].
People are now paying great attention to the nutritional hygiene and safety of food, and the presence of factors harmful to the human body in food will directly affect the safety of consumers. Food production and storage processes will produce a series of chemical changes; therefore, the choice of appropriate processing technology is important to improve food safety. There are many processes in food processing, such as frying, steaming, simmering and so on.
M. fragrans implies other processing methods such as flour simmering, bran simmering, etc., and the alcohol extract of ·OH, O
2−· and its scavenging capacity are lower than before processing, while its antioxidant activity is also reduced [
15]. Moreover, during the bran simmering processing operation, burning can easily occur with the increase in temperature. Simmering is a widespread processing method, the main purpose of which is to remove some of the essential oils and irritating components, thus reducing the side effects [
16]. After simmering,
M. fragrans is brittle and fragile, making it easy to eat. In talcum powder simmering, talcum powder is used to absorb some of the volatile and irritating ingredients to reduce the side effects or moderate the medicinal properties and enhance their effect. Talcum powder simmering is also used for a variety of foods such as
Aucklandia lappa Decne.,
M. fragrans,
Pueraria lobata (Willd.) Ohwi and
Terminalia chebula Retz. [
17]. The contents of volatiles in
M. fragrans are closely related to the processing temperature, time and excipients, which can reduce toxic substances and facilitate the consumption of foods.
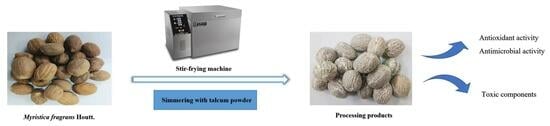
This study investigated the M. fragrans simmering process for talcum powder from three aspects: talcum powder dosage, processing temperature and processing time. The overall desirability values of dehydrodiisoeugenol and essential oils content were selected as indicators of the process. To compare the changes in the chemical components, the antioxidant and antibacterial effects of M. fragrans essential oils before and after processing (marked OMB and OMA, respectively) were recorded. The changes in M. fragrans toxicity before and after processing were also assessed by zebrafish animal models. It is essential to develop a simple and efficient processing technique, especially for the M. fragrans flavour industry, in order to reduce toxicity and improve product quality. It may also serve as reference for the processing of other foods.
2. Results and Discussion
2.1. Single-Factor Experiment
The standard curve equation for dehydrodiisoeugenol was y = 1.1738x + 0.1319, R2 = 0.9999, and the linearity was well in the range of 1.875~60 µg/mL. And the content of dehydrodiisoeugenol before processing was 0.24%.
The effect of processing temperature within the range of 100–180 °C was studied with a processing time of 15 min and a talcum powder dosage of 50 g. The results show that the content of dehydrodiisoeugenol increased and then decreased with increasing temperature, and the content of OMA gradually decreased. Based on the highest overall desirability (OD) value of 79.17, a temperature of 140 °C was selected (No. 1–5 of
Table 1).
The effect of processing time within the range of 10–30 min was studied at a processing temperature of 140 °C and a talcum powder dosage of 50 g. The dehydrodiisoeugenol content and OMA content increased and then decreased with increasing time. Based on the highest OD value of 83.33, the time of 20 min was selected (No. 6–10 of
Table 1).
Talcum powder dosage in the range of 30–70 g was studied at a processing temperature of 140 °C and a processing time of 20 min. The dehydrodiisoeugenol content also increased and then decreased with increasing talcum powder dosage, while the effect on OMA content was not significant. Based on the highest OD value of 95.83, the talcum powder dosage of 40 g was selected (No. 11–15 of
Table 1).
Therefore, the optimal processing temperature, processing time and talcum powder dosage were 140 °C, 20 min and 40 g, respectively.
2.2. Optimisation of Orthogonal Experiments
Combining the experimental results of a single factor, the orthogonal experimental design was carried out with three factors of processing temperature (A), processing time (B) and talcum powder dosage (C) as the independent variables, and the OD value of dehydrodiisoeugenol and OMA content were referred to as the evaluating indices to obtain the orthogonal experimental design and the results of the analyses (
Table 2) and the analysis of variance (ANOVA) (
Table 3).
Intuitive analysis shows that the results of factor A (processing temperature) are as follows: A2 > A3 > A1; for factor B (processing time), they are B3 > B2 > B1; and for factor C (talcum powder dosage), they are C3 > C1 > C2. From the intuitive analysis, the optimal concoction process was A2B3C3. The ANOVA shows that, although there is no significant difference, the order of influence of the factors on the experimental results is A > B > C, i.e., the processing temperature has the greatest influence on the results, followed by the processing time and then the talcum powder dosage.
Combined with the ANOVA and intuitive analysis of orthogonal tests, the optimal processing conditions were A2B3C3. The processing temperature was 140 °C, the processing time was 25 min and the talcum powder dosage was 50 g. The final optimum processing parameters were determined as follows: processing temperature of 140 °C, processing time of 25 min and talcum powder dosage of 50%. The mean value of processed dehydrodiisoeugenol content was 0.25% with a relative standard deviation (RSD) of 2.16%, and the mean value of OMA yield was 6.43% with an RSD of 2.50%.
The present study showed a significant reduction in the content of essential oils at a temperature of 140 °C, which is lower than that found in the literature at 170 °C compared to the talcum powder stir-frying processing technique [
14], which was of 6.9% in the literature and of 6.43% in the present study’s processing process. This further suggests that talcum powder simmering could adsorb volatile and irritant components, thereby reducing the content of toxic components. Dong et al. measured the average content of dehydrodiisoeugenol in the flour simmering process to be 0.27%, but it was necessary to peel the skin by hand, and when peeling the flour, the flour could easily stick to
M. fragrans, which was not easy to handle, and at the same time, there was less exudation of the oil substance [
18].
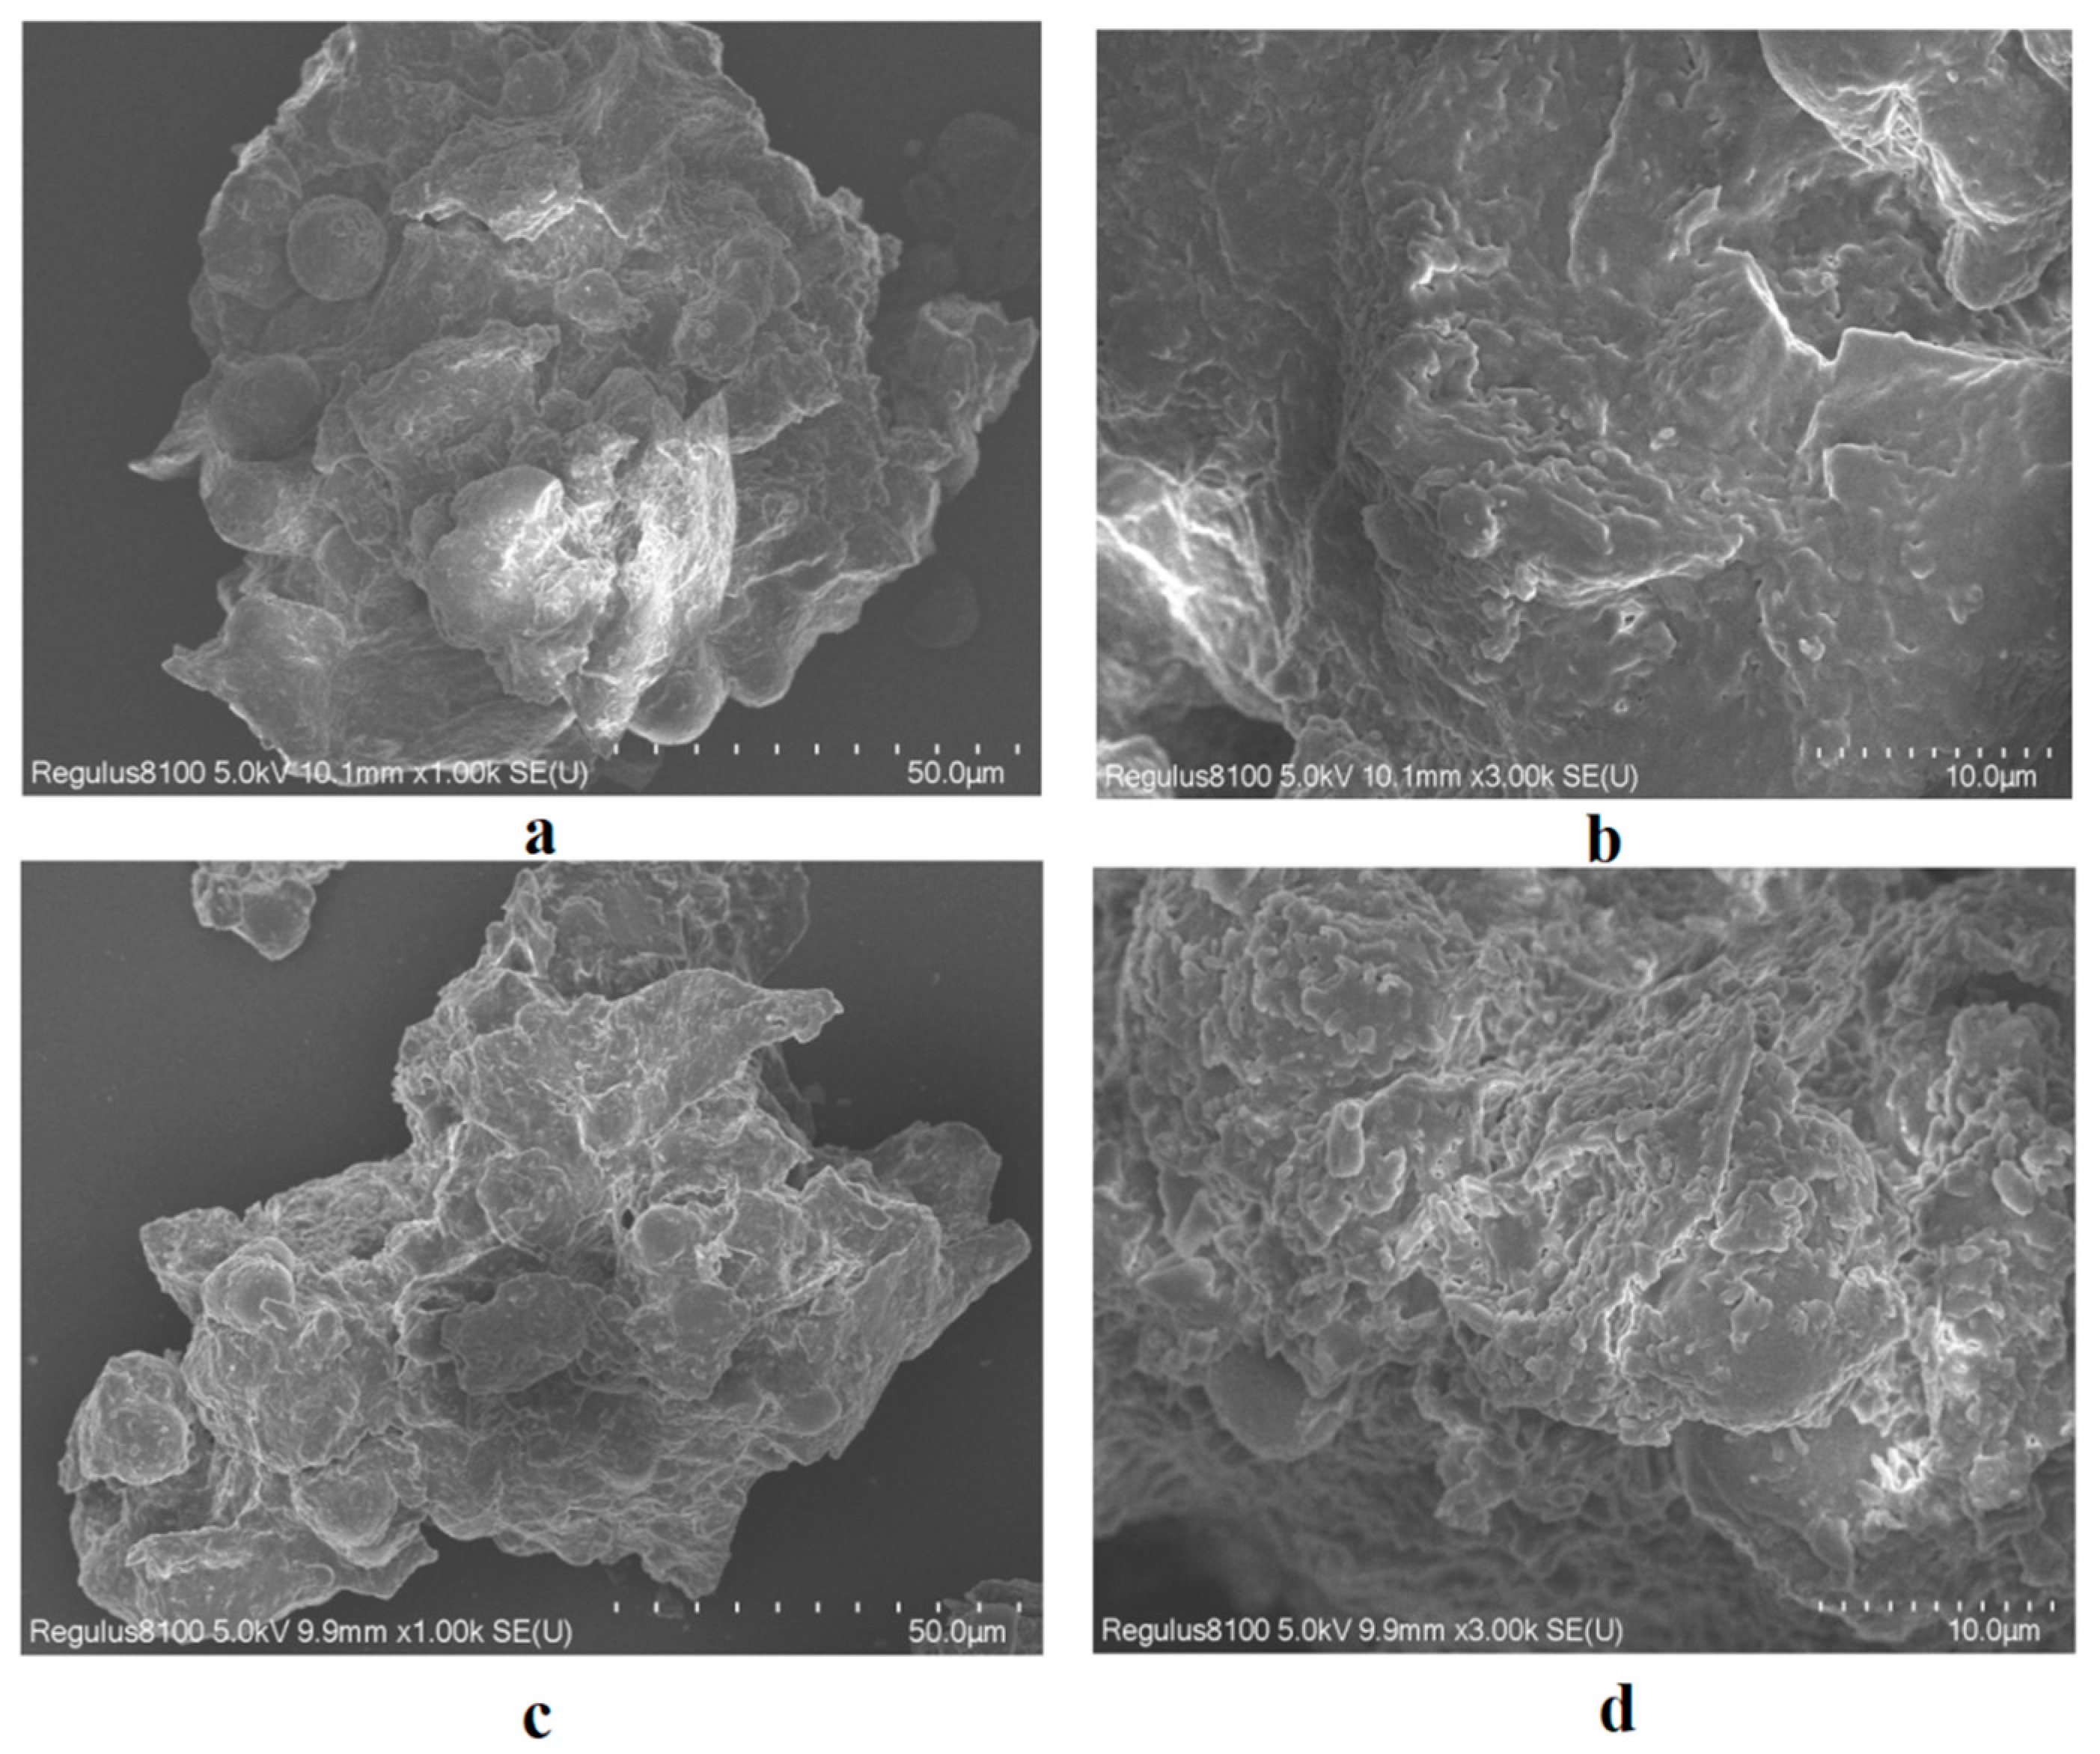
2.3. Scanning Electron Microscopy (SEM)
The SEM image shows that the unprocessed
M. fragrans is relatively smooth and intact (
Figure 1a,b). Starch granules were mostly single granules, with a few complex granules composed of 2–6 fractions, and they showed evident umbilical dots. The degree of crushing and deformation of the powder was enhanced after processing for
M. fragrans (
Figure 1c,d), which may be due to the high processing temperature.
2.4. Gas Chromatography–Mass Spectrometry (GC-MS)
Twenty-eight compounds were identified from OMB, accounting for 99.44% of the total. The most abundant compound was fenchlorphos (21.23%), followed by methyleugenol (15.98%), myristicin (12.95%) and elemicin (8.29%). Twenty-one compounds from OMA were identified, accounting for 99.76% of the total. The most abundant compound was fenchlorphos (26.23%), followed by myristicin (15.9%), α-pinene (14.82%) and β-pinene (10.3%).
The contents of toxic safrole and elemicin were reduced by 0.11% and 5.96%, respectively. The relative content of myristicin in OMA (15.9%) was higher than that in OMB (12.95%) (
Table 4). This difference may be attributed to two reasons. First, the boiling points of safrole and elemicin are 232 °C and 146 °C, respectively, which are below the temperature of the gasification chamber of 250 °C and are more volatile. Myristicin has a boiling point of 276 °C, which is higher than the temperature of that the gasification chamber, and volatilises relatively little. Second, the relatively few constituents isolated and identified from OMA resulted in a little higher relative amount of myristicin. Importantly, the total content of the three toxic components, namely myristicin, safrole and elemicin, decreased from 1.91% to 1.16% relative to the total
M. fragrans content before and after processing, indicating that the toxic components were reduced by 39%. Talcum powder is an excipient that absorbs oils and can adhere to the volatile and irritating components from the surface of
M. fragrans after processing, so the content of myristicin, safrole and elemicin decreases after sieving [
16].
Fenchlorophos is a widely used organophosphorus pesticide with a relatively high boiling point. It is a residue of the pesticide during the growth of
M. fragrans [
19]. The content of active ingredients such as α-pinene and β-pinene increased by 92% and 35%, respectively. The boiling point of methyl eugenol is 254 °C and the decrease in content may be due to a longer processing time and higher processing temperature [
20]. The results show a reduction in the content of the toxic components of essential oils after processing.
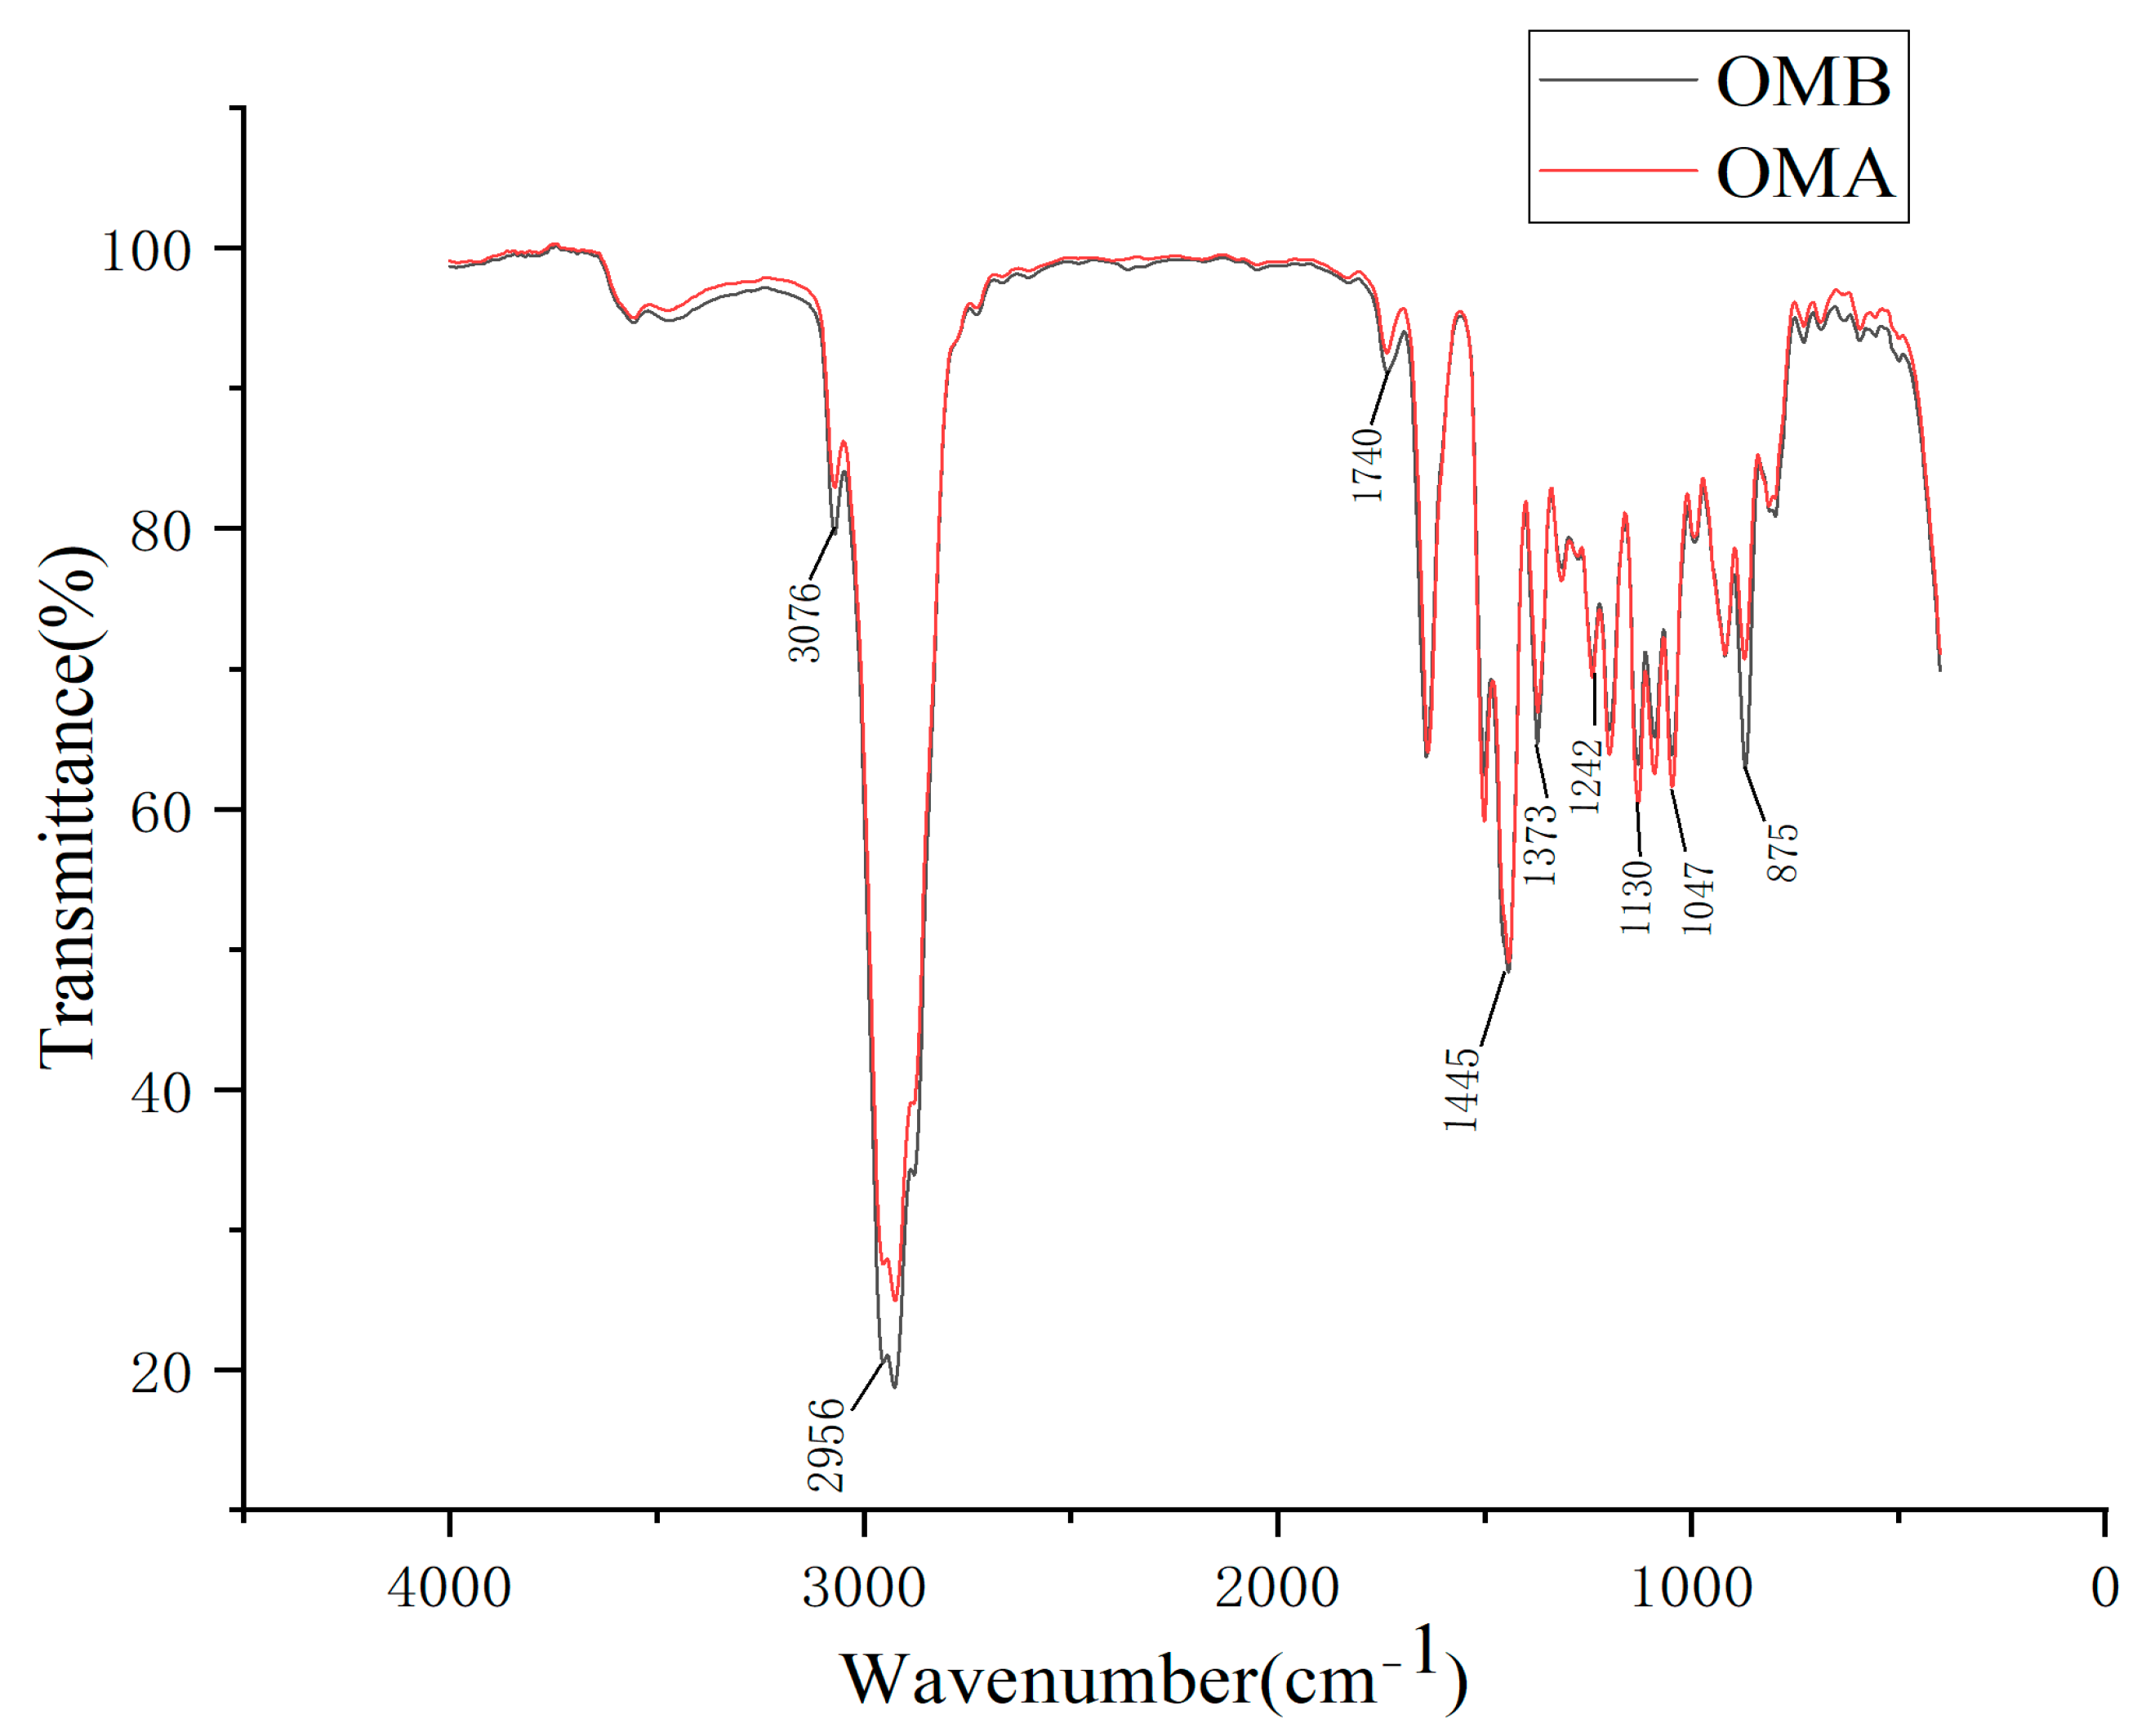
2.5. Fourier Transform Infrared Spectrometry (FT-IR)
Figure 2 shows the FTIR diagrams of OMB and OMA. The correlation coefficients of wavenumber at each point in the two infrared spectra calculated on SPSS24.0 were all 1. The two types of essential oils have the same functional groups.
The peak at 3076 cm
−1 is the C-H stretching vibration of alkenes. The peaks at 1373 and 2956 cm
−1 are the stretching vibration of saturated C-H in -CH
3. The peak at 1250 cm
−1 may be due to the symmetric expansion of the C-O-C of the aromatic acid ester and vibrational stretching of the C-OH group of the phenolic component, whereas the peak at 1445 cm
−1 represents the vibrational bending absorption of C-OH by the alcohol moieties [
21]. The peak at 1130 cm
−1 is one strong peak of aliphatic ether. The peak at 1047 cm
−1 is the R-O stretching vibration of aromatic ether [
22]. The peak at 875 cm
−1 is the C-H out-of-plane bending vibration absorption of aromatic hydrocarbons [
23].
The main functional groups in
Figure 2 are basically consistent with the compounds in
Table 4, and the peak shapes of the two spectrograms before and after processing are basically the same. These results show that the processing changes the content of the essential oils, while the type of chemical composition does not change much.
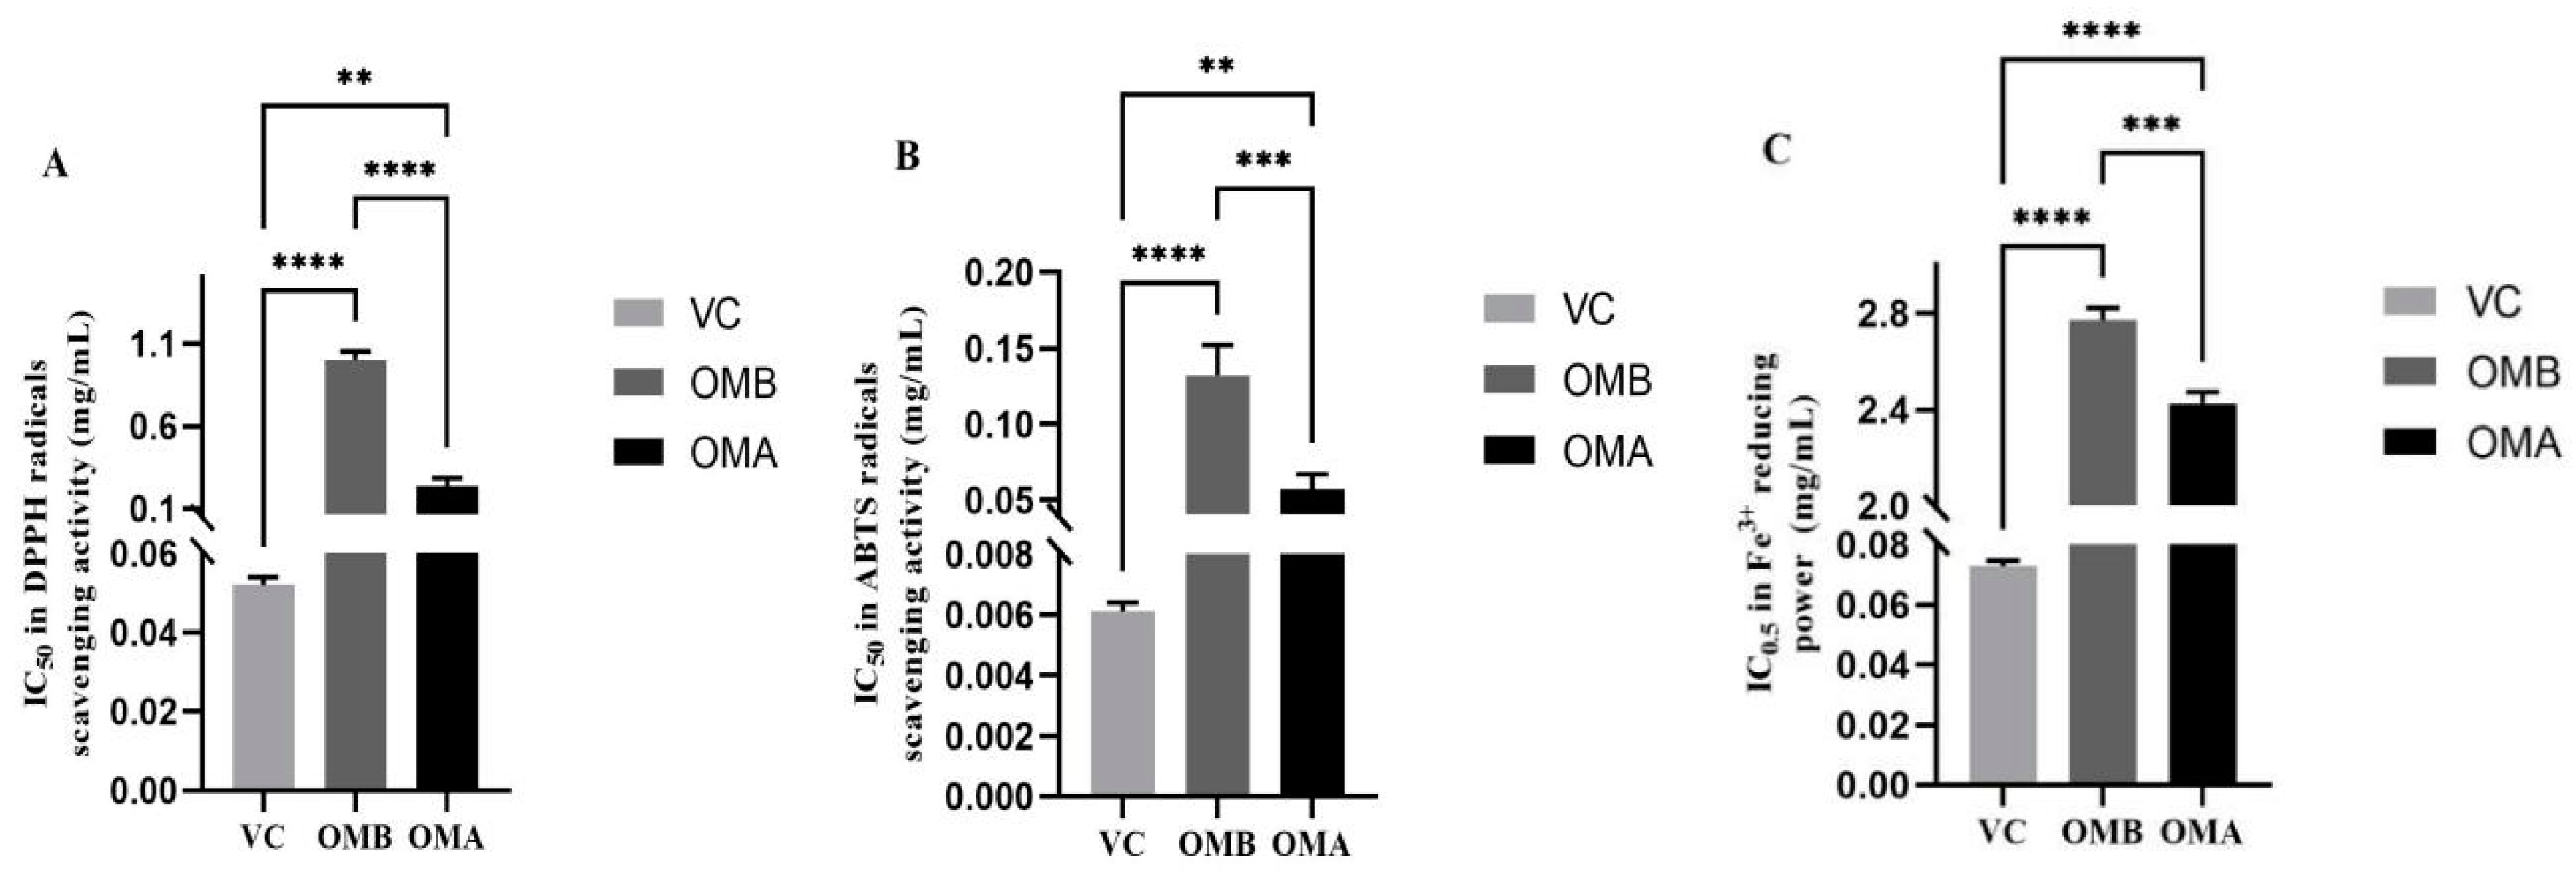
2.6. Effect of Processing on Antioxidant Activity
There was a dose–effect relationship between OMB and OMA on the scavenging of 2,2-Diphenyl-1-picrylhydrazyl (DPPH) radicals in the range of 0.1–0.8 mg/mL (
Figure 3A). In the range of 0.01–0.4 mg/mL, there was a certain dose–effect relationship on the scavenging rate of 2,2′-azinobis-(3-ethylbenzthiazoline-6-sulphonate) (ABTS) radicals (
Figure 3B). The IC
50 of OMB and OMA against DPPH radicals scavenging activity was 1.002 ± 0.05 and 0.233 ± 0.05 mg/mL, respectively, and that against ABTS·
+ scavenging activity was 0.132 ± 0.04 and 0.057± 0.05 mg/mL, respectively, indicating that OMA has higher antioxidant activity than OMB. The IC
50 for Vitamin C (Vc) in DPPH was 0.052 ± 0.002 mg/mL and for ABTS it was 0.006 ± 0.0003 mg/mL. In the concentration range from 1 to 6 mg/mL, some reducing power was observed for Fe
3+ (
Figure 3C). The absorbance of OMB was 0.213~0.709 ± 0.03, and the absorbance of OMA was 0.225~0.755 ± 0.02. The absorbance of OMA was higher than that of OMB over the concentration range. In a word, OMA showed higher antioxidant capacity than OMB in all three systems.
The enhanced antioxidant effect of OMA may be attributed to the increased contents of α-phellandrene and myrcene. Although myristicin and elemicin have antioxidant effects [
24], these effects have not been affected by their reduced contents. This indicates that there is a synergy between the chemical components.
2.7. Effect of Processing on Antibacterial Activity
The results of essential oils against all strains of microorganisms tested are shown in
Table 5. The minimum inhibitory concentration (MIC) of OMA against
Staphylococcus aureus,
Bacillus pumilus and
Escherichia coli were all lower than for OMB (
Table 5), indicating that OMA has enhanced bacteriostatic activity. No bacteriostatic activity was measured against
Saccharomyces cerevisiae or
Candida albican.
Essential oils contain antioxidant and bacteriostatic constituents, including α-phellandrene and β-myrcene [
25]. α-Pinene and β-pinene have an antibacterial effect on
Escherichia coli,
Staphylococcus aureus and other microorganisms, and their antibacterial abilities are improved with the increase in dosage [
26]. Elemicin possesses strong antibacterial effects [
9]. Other chemical components may also have a synergistic effect.
With the reduction in elemicin contents in OMA, the antioxidant and antimicrobial effects are improved, indicating that processing plays a role in food safety and that the optimised process could be used in food processing.
2.8. Zebrafish Embryo Upgrowth Toxicity
The survival rates of zebrafish embryos at different concentrations (1.5, 3, 6, 12, 25 and 50 µg/mL) under 0–168 h post fertilisation (hpf) conditions are shown in
Table 6. At the lower concentrations of 1.5 and 3 µg/mL, there was no significant decrease in survival and OMA showed a high survival rate of up to 90%. At 6, 12 and 25 ug/mL for 96 hpf, the survival rates were 50%, 50% and 40% for OMB and 70%, 70% and 60% for OMA, respectively, which were significantly different. At 50 µg/mL, the survival rate dropped significantly to 20% at 48, 72 and 96 hpf for OMB, respectively, and the
p-value before and after processing was less than 0.05, which was significant. The survival rate of OMA was higher than that of OMB after 96 hpf at different concentrations, and both were significantly different. The results of the survival rates are as follows: control > OMA > OMB. The survival rate of OMB was significantly lower than that of OMA.
It can be concluded that, in agreement with the results of GC-MS and IR analysis, the toxicity of OMA was reduced and the simmering method had a reducing effect on toxicity. The main reason for this is that the talcum powder in the simmering process can adhere to volatile and irritating components such as safrole and elemicin, and therefore its toxic content decreases after sieving.
3. Material and Methods
3.1. Materials and Reagents
M. fragrans was purchased from Hebei Golden Leaf Pharmaceutical Co., Ltd. (LOT: 200501C159). The materials were identified by Prof. Xiudong Yang (Jilin Institute of Chemical Technology, Jilin, China) and determined as Myristica fragrans Houtt. 2,2-Diphenyl-1-picrylhydrazyl (DPPH) and 2,2′-azinobis-(3-ethylbenzthiazoline-6-sulphonate) (ABTS) were provided by TCI Chemical Industry Development Co., Ltd., Shanghai, China. Wild-type (AB line) zebrafish were purchased from the Shandong YiXiYue Biotechnology Co., Ltd., Shandong, China. All reagents were of analytical grade.
3.2. Simmering M. fragrans with Talcum Powder
The stir-frying machine was raised to the desired temperature. Then, the talcum powder was poured in and simmered until it became flexible (about 3 min). Next, the whole M. fragrans was placed in the machine and simmered for the desired time. Then, it was removed rapidly, and the talcum powder was sieved, cooled to room temperature and placed in a dry bag.
3.3. Detection of Dehydrodiisoeugenol
Take 3.0 mg of dehydrodiisoeugenol standard and methanol as solvent. The standard solution of dehydrodiisoeugenol was prepared as 1.875, 3.75, 7.5, 15, 30 and 60 µg/mL, and the standard curve was plotted with the peak area as the vertical coordinate and the concentration of the control as the horizontal coordinate. The processed M. fragrans was ground into powder and passed through a 20-mesh sieve. The powder (0.5 g) was placed into a conical flask with a stopper and added to 50 mL of methanol under ultrasonic treatment (250 W, 30 kHz) for 30 min. After cooling, weigh again, and make up the lost weight with methanol, shake well, filter and take the filtrate as the sample solution.
The standard and sample solution were filtered through a 0.45 μm membrane, while 20 μL of filtrate was injected into the Ultimate 3000 HPLC (Thermo, New York, NY, USA) equipped with an Ultimate 3000 diode array detector (DAD, Thermo) and a Inertsil ODS-3 column (5 μm, 4.6 × 250 mm). The mobile phase was methanol and water (75:25) with the elution. The flow rate was 1.0 mL/min and the column temperature was 25 °C. The detection wavelength was 274 nm. The content of dehydrodiisoeugenol is calculated according to Equation (1):
where C is the concentration of dehydrodiisoeugenol, V is the dilution ratio of the solution and M is the mass of
M. fragrans powder.
3.4. Extraction of M. fragrans Essential Oils
M. fragrans essential oils were extracted for 5 h through steam distillation with 20 g of powder and 300 mL of water under the processing temperature of 140 °C, the processing time of 25 min and the talcum powder dosage of 50 g. The obtained oils were dried with anhydrous sodium sulfate and stored at 4 °C until analysis. The essential oil yield was calculated according to Equation (2):
3.5. Calculation of the Composite Weighted Score
In order to comprehensively investigate the influence of the processing conditions, the dehydrodiisoeugenol and essential oils content were assigned their weights, and the test results of multiple indicators were converted into single indicators through weighted sum, which not only avoided the limitations and inaccuracies caused by the evaluation of a single factor, but also took into account the influence on multiple indicators, so as to make the optimisation of the process more scientific and rationalised. Dehydrodiisoeugenol is the active ingredient of
M. fragrans and is chemically stable, the essential oils contain toxic components and the temperature and time of processing have an effect on the essential oils’ content and vary greatly. The coefficients were set to 1 for essential oils and 3 for dehydrodiisoeugenol in order to make the effect of essential oils on the experimental results small. Dehydrodiisoeugenol content (75%) and essential oils content (25%) were used as evaluation indices for analysis. A comprehensive weighted scoring method was used for scoring, and the scoring index for dehydrodiisoeugenol content was Y
1, for essential oils content it was Y
2 and the maximum OD value was the optimal processing condition.
where Y
min is the minimum value in the indicator, Y
max is the maximum value in the indicator and the OD value is Y.
3.6. Single-Factor Experiments
Three factors including processing time (10, 15, 20, 25 and 30 min), processing temperature (100, 120, 140, 160 and 180 °C) and talcum powder dosage (30, 40, 50, 60 and 70 g), each at five levels, were selected. In a single-factor experiment, only one factor was changed while the other two were unchanged. The content of dehydrodiisoeugenol and essential oil was determined for each serving of 100 g M. fragrans and the OD was calculated.
3.7. Optimisation of Orthogonal Experiments
The statistical analysis software Orthogonal Design Assistant V 3.1 was used to design the orthogonal experiments. A three-factor, three-level experiment was designed using processing temperature, processing time and talcum powder dosage as independent variables and OD values of dehydrodiisoeugenol and volatile oil scores as evaluation indicators.
3.8. SEM
SEM allows for observation of the micro-morphological characterisation of substances and allows for a more intuitive comparison of the effects of processing on them. The
M. fragrans powder before and after processing was observed by SEM [
27]. The sieved powder with an internal diameter of 850 ± 29 μm was gold-sprayed for 120 s, and then examined by SEM (Regulus 8100, Hitachi, Tokyo, Japan) at an acceleration voltage of 5.0 kV (500–3000 magnification).
3.9. FT-IR of Essential Oils
FT-IR allows for the observation of functional groups in the structure of essential oils and for a further comparison of the changes in the composition of essential oils before and after processing. The IR spectra of OMB and OMA were obtained using an FT-IR meter (Gangdong SCI. & TECH. Development Co. Ltd., Tianjin, China). First, OMB or OMA (50 μL) was processed and covered evenly to form a thin layer. Then, infrared spectra were measured in the range of 500–4000 cm−1. The instrument resolution was 0.74 cm−1, scanned 32 times. SPSS24.0 was used to calculate the wavenumber correlation coefficient of each spot in the two IR spectra.
3.10. GC-MS of Essential Oils
GC-MS technology allows for an accurate analysis of the composition of essential oils and comparison of changes in the composition of essential oils before and after processing. The presence of OMB and OMA was investigated by GC-MS (Shimadzu GC-MS-2010-plus, shimadzu, Kyoto, Japan) [
28]. The chromatographic conditions included an Rxi 5MS capillary column (30 m, 0.25 mm, 0.25 µm) with helium as carrier gas at 1 mL/min, and a sample volume of 1.0 μL. The GC oven was kept at 6 °C for 6 min, adjusted to 250 °C at a rate of 3 °C/min and then kept constant for 30 min. The injection port temperature was 250 °C and the column pressure was 49.5 kPa. For MS, an electron ionisation source at 230 °C was used. The electron energy was 70 eV and the scanning mass range was 40–500
m/
z. The essential oils were diluted 10 times with methanol and filtered through microporous membrane for GC-MS. Constituents were identified from mass spectra and retention time using the NIST library. The relative content of each constituent (%) was calculated based on the peak area of GC.
3.11. Antioxidant Activity of Essential Oils
Three parallel experiments were performed for each sample, and the average value was taken. Vitamin C was used as a positive control. The concentration of a sample that inhibited 50% of the radical (IC50) was calculated.
DPPH radical scavenging activity was determined according to the method of Wang et al. [
27]. The essential oils were dissolved in ethanol, and a series of solutions at different concentrations (0.1–0.8 mg/mL) were conducted. The absorbance was measured with a UV spectrometer at 517 nm. The ethanol was used as a blank.
ABTS·
+ scavenging activity was determined according to the method of Li et al. [
28]. The essential oils were dissolved in absolute ethanol, and a series of solutions at different concentrations (0.01–0.4 mg/mL) were made. Then, the absorbance at 734 nm was measured and ABTS (2.0 mL) plus 2.0 mL of absolute ethanol was used as a control.
FRAP was measured according to JD Adámez et al. [
29]. The essential oils were dissolved in absolute ethanol, and a series of solutions at different concentrations (0.5–5 mg/mL) were made. The absorbance at 700 nm was detected.
3.12. Antimicrobial Activity of Essential Oils
The MIC was detected using a broth microdilution assay [
28]. All the bacterial strains, including
Staphylococcus aureus ATCC 29213,
Saccharomyces cerevisiae ATCC 27457,
Bacillus pumilus ATCC 700814,
Escherichia coli ATCC 25922 and
Candida albican ATCC 10231, were bought from Beijing Yuding Xinjie Technology Co., Beijing, China. Samples of 5 concentrations (15.625–500 µg/mL) were made with 20% dimethyl sulfoxide (DMSO) solution as the solvent. In a 96-well plate, 180 µL of a bacterial standard suspension (10
8 CFU/mL) and 20 µL of a sample solution were added to each well. The sample concentration in the following wells was reduced by serial dilution 2-fold. Chloramphenicol was used as a positive control and 20% DMSO solution without essential oils was used as a negative control.
3.13. Assessment of Zebrafish Embryo Upgrowth Toxicity
All adult zebrafish were kept in rearing conditions (28 °C, pH 7.8–8.0, 14/10 h light/dark cycle) in a rearing facility [
30]. Zebrafish were fed twice daily. Male and female zebrafish were placed in the incubator in a 2:1 ratio, with males and females separated by a partition, which was withdrawn the following day, and fertilised eggs were obtained the next morning 14 h later. Embryos were obtained from natural spawning induced by turning on the light in the morning. Embryos were washed and disinfected with 0.01% (
v/
v) methylene blue solution for breeding.
Healthy embryos were selected under a microscope at 48 hpf and 10 embryos per well were randomly placed in a sterile 6-well plate. A solvent control (0.04% DMSO) and a sample solution for each group (concentration gradient of 1.5, 3, 6, 12, 25 and 50 μg/mL) was added to each well in a final volume of 2 mL. The exposed solution was replaced after 24 h. At the same time, dead embryos were removed and mortality was recorded. The number of embryos surviving at different time points after administration was then recorded at 24, 48, 72, 96, 120, 144 and 168 hpf, respectively (repeated experiments, n = 3).
3.14. Statistical Analysis
Experimental data were statistically tested by using SPSS24.0. One-way analysis of variance (ANOVA) was used by GraphPad Prism 9.0. All assays were conducted in triplicate. Results were expressed as means ± SD. The main effects were the samples before and after processing as well as the selected concentration, and the random effects were indicators that the experiment was repeated.


