
Phosphogypsum-Modified Vinasse Shell Biochar as a Novel Low-Cost Material for High-Efficiency Fluoride Removal
Abstract
:1. Introduction
2. Results and Discussion
2.1. Characterization Analysis
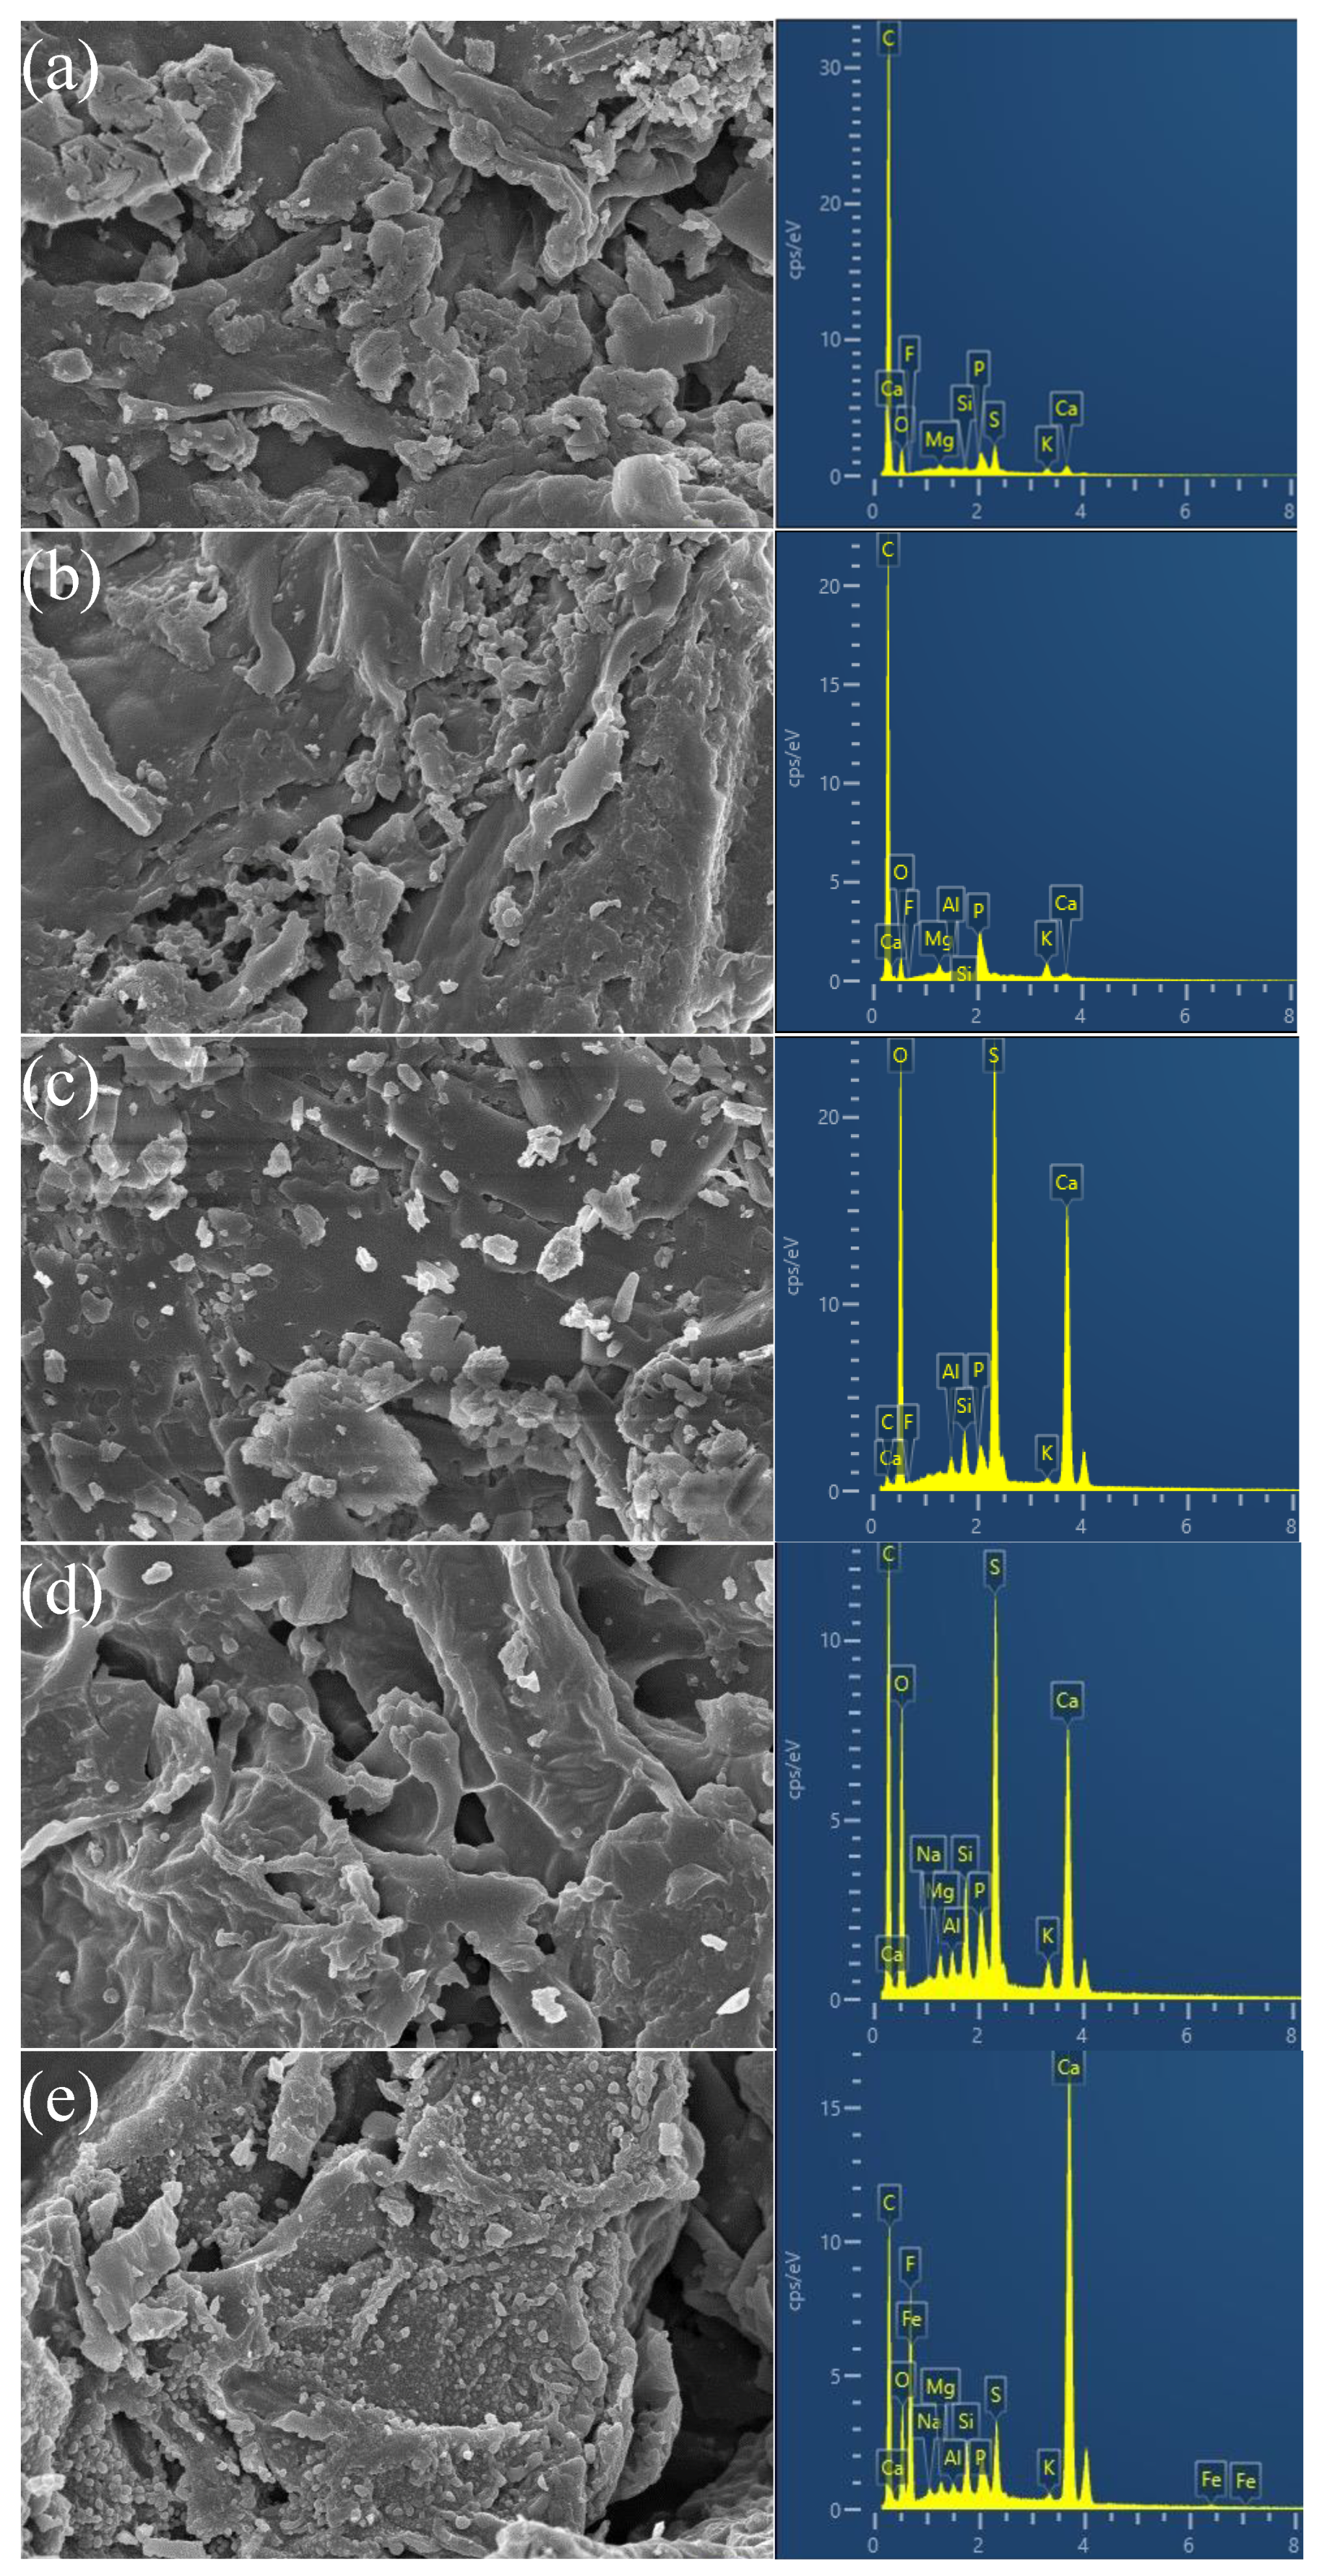
2.1.1. SEM-EDS
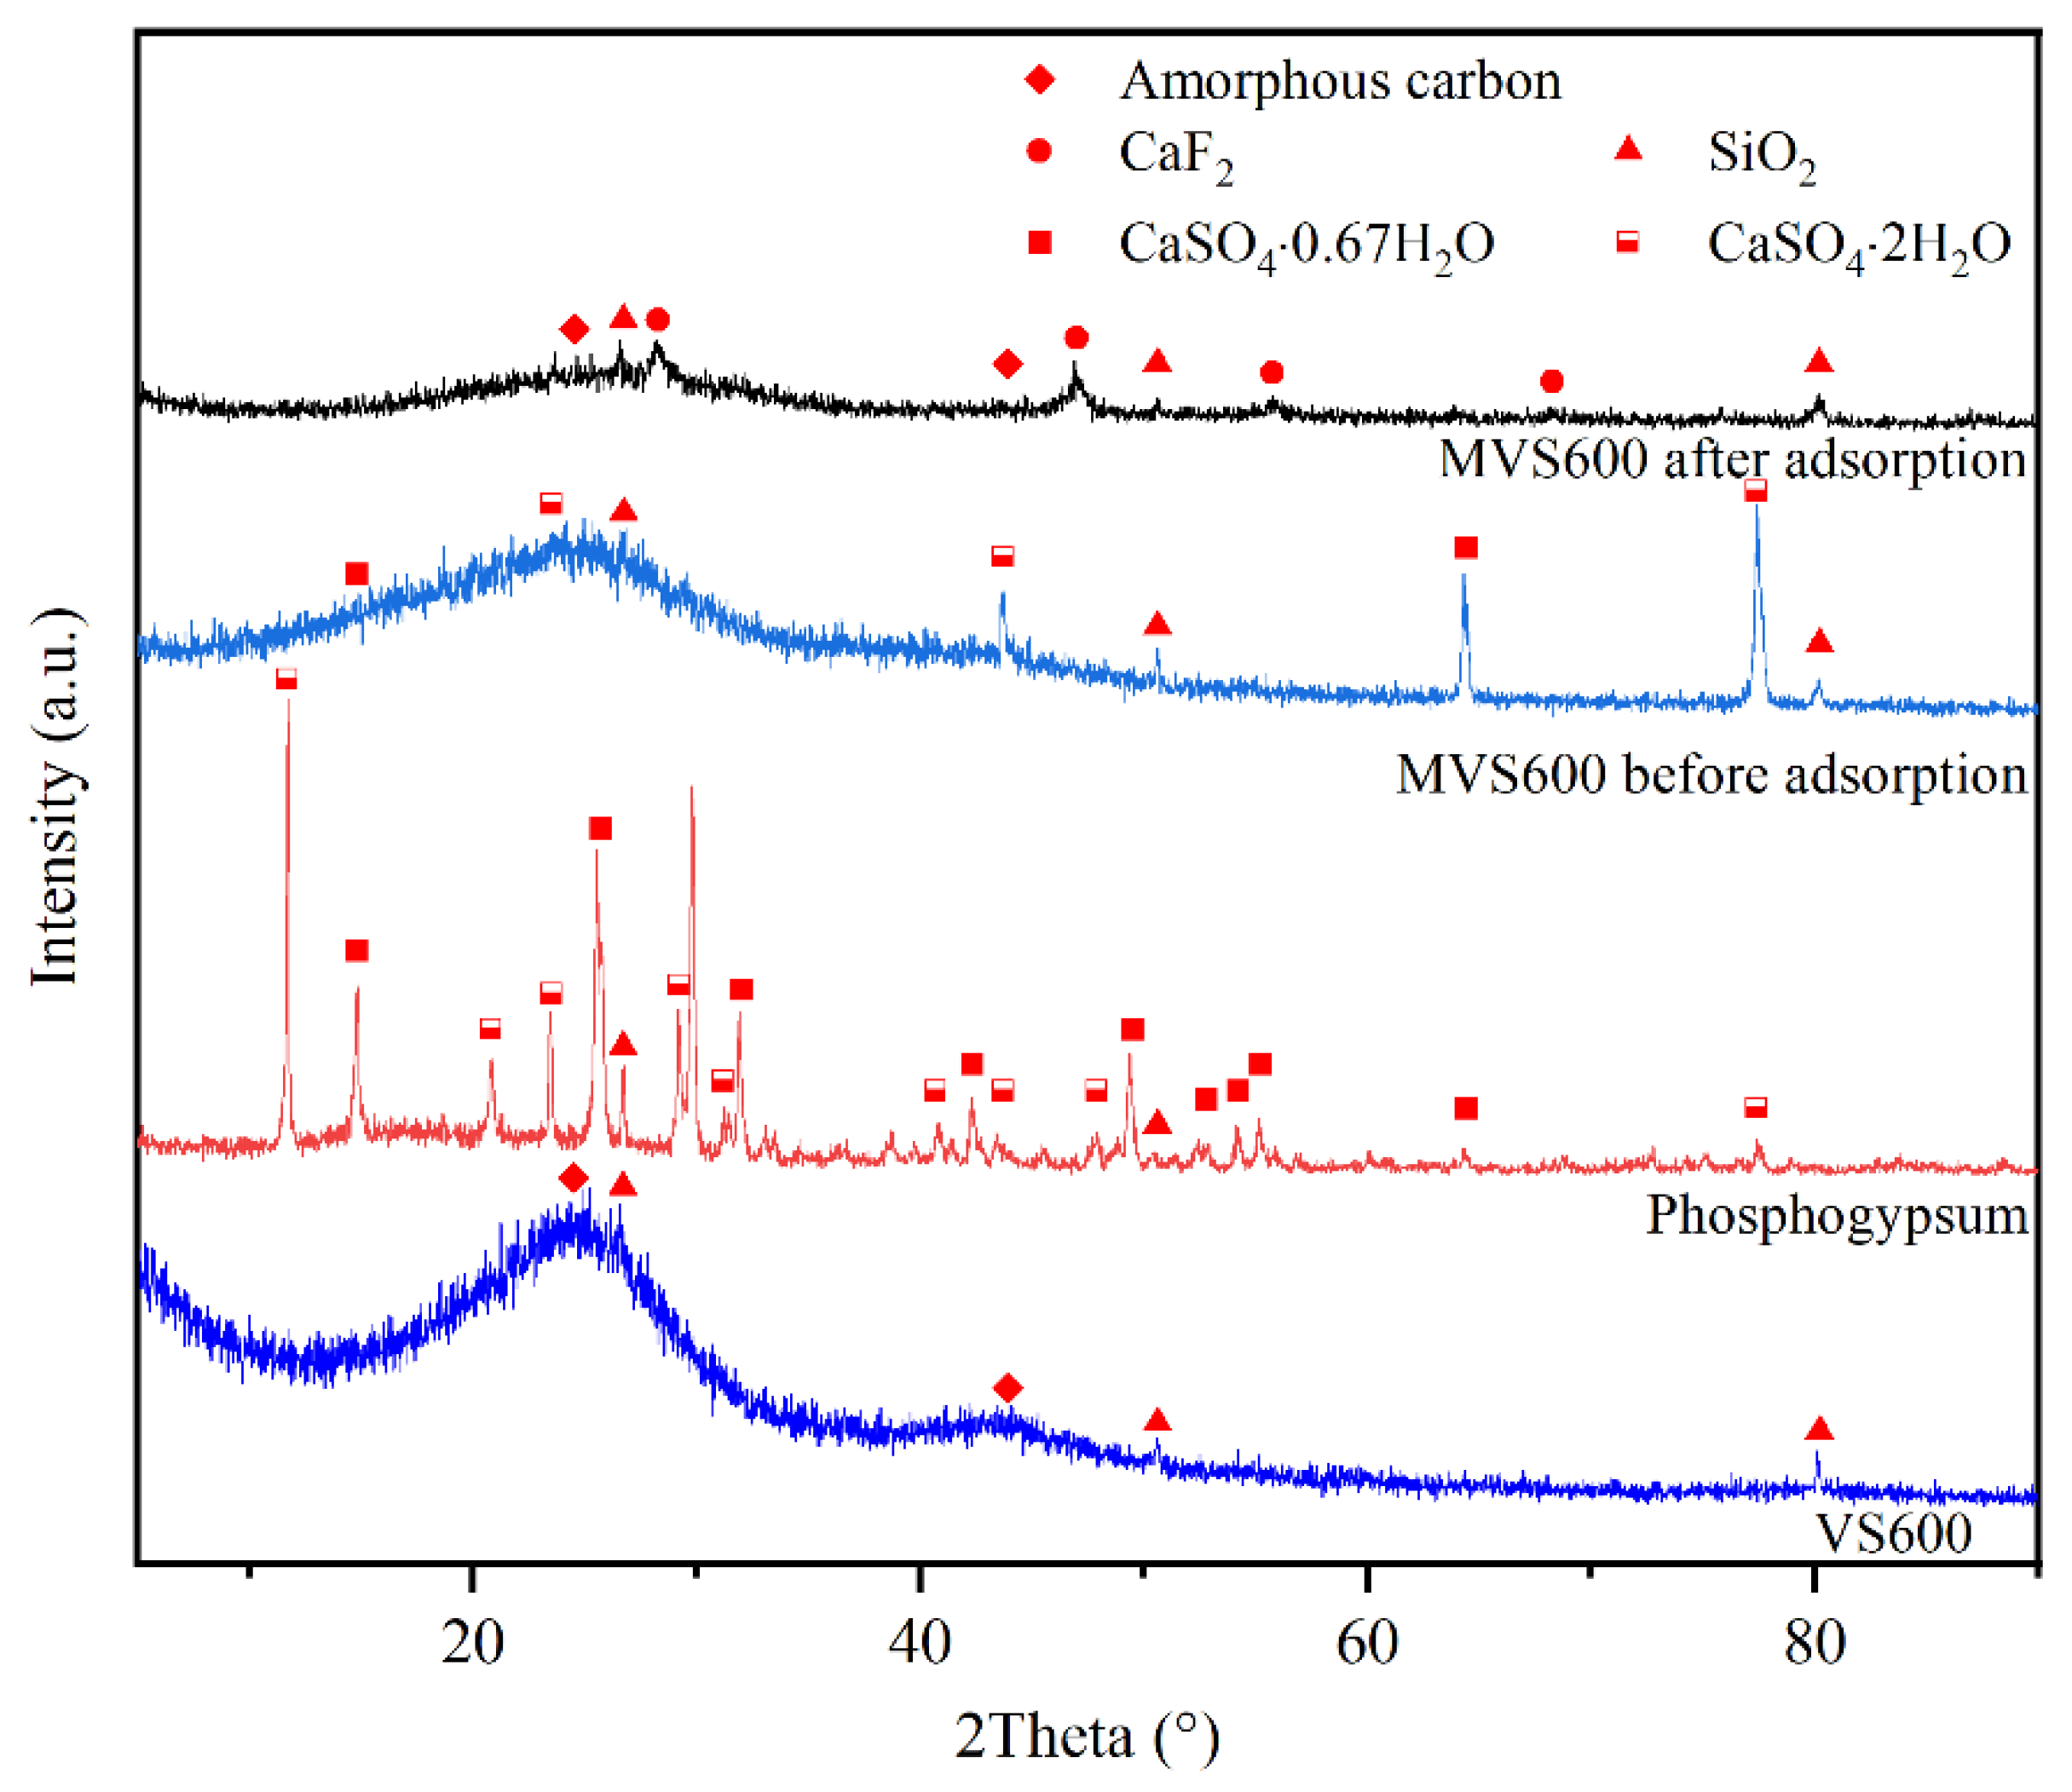
2.1.2. XRD
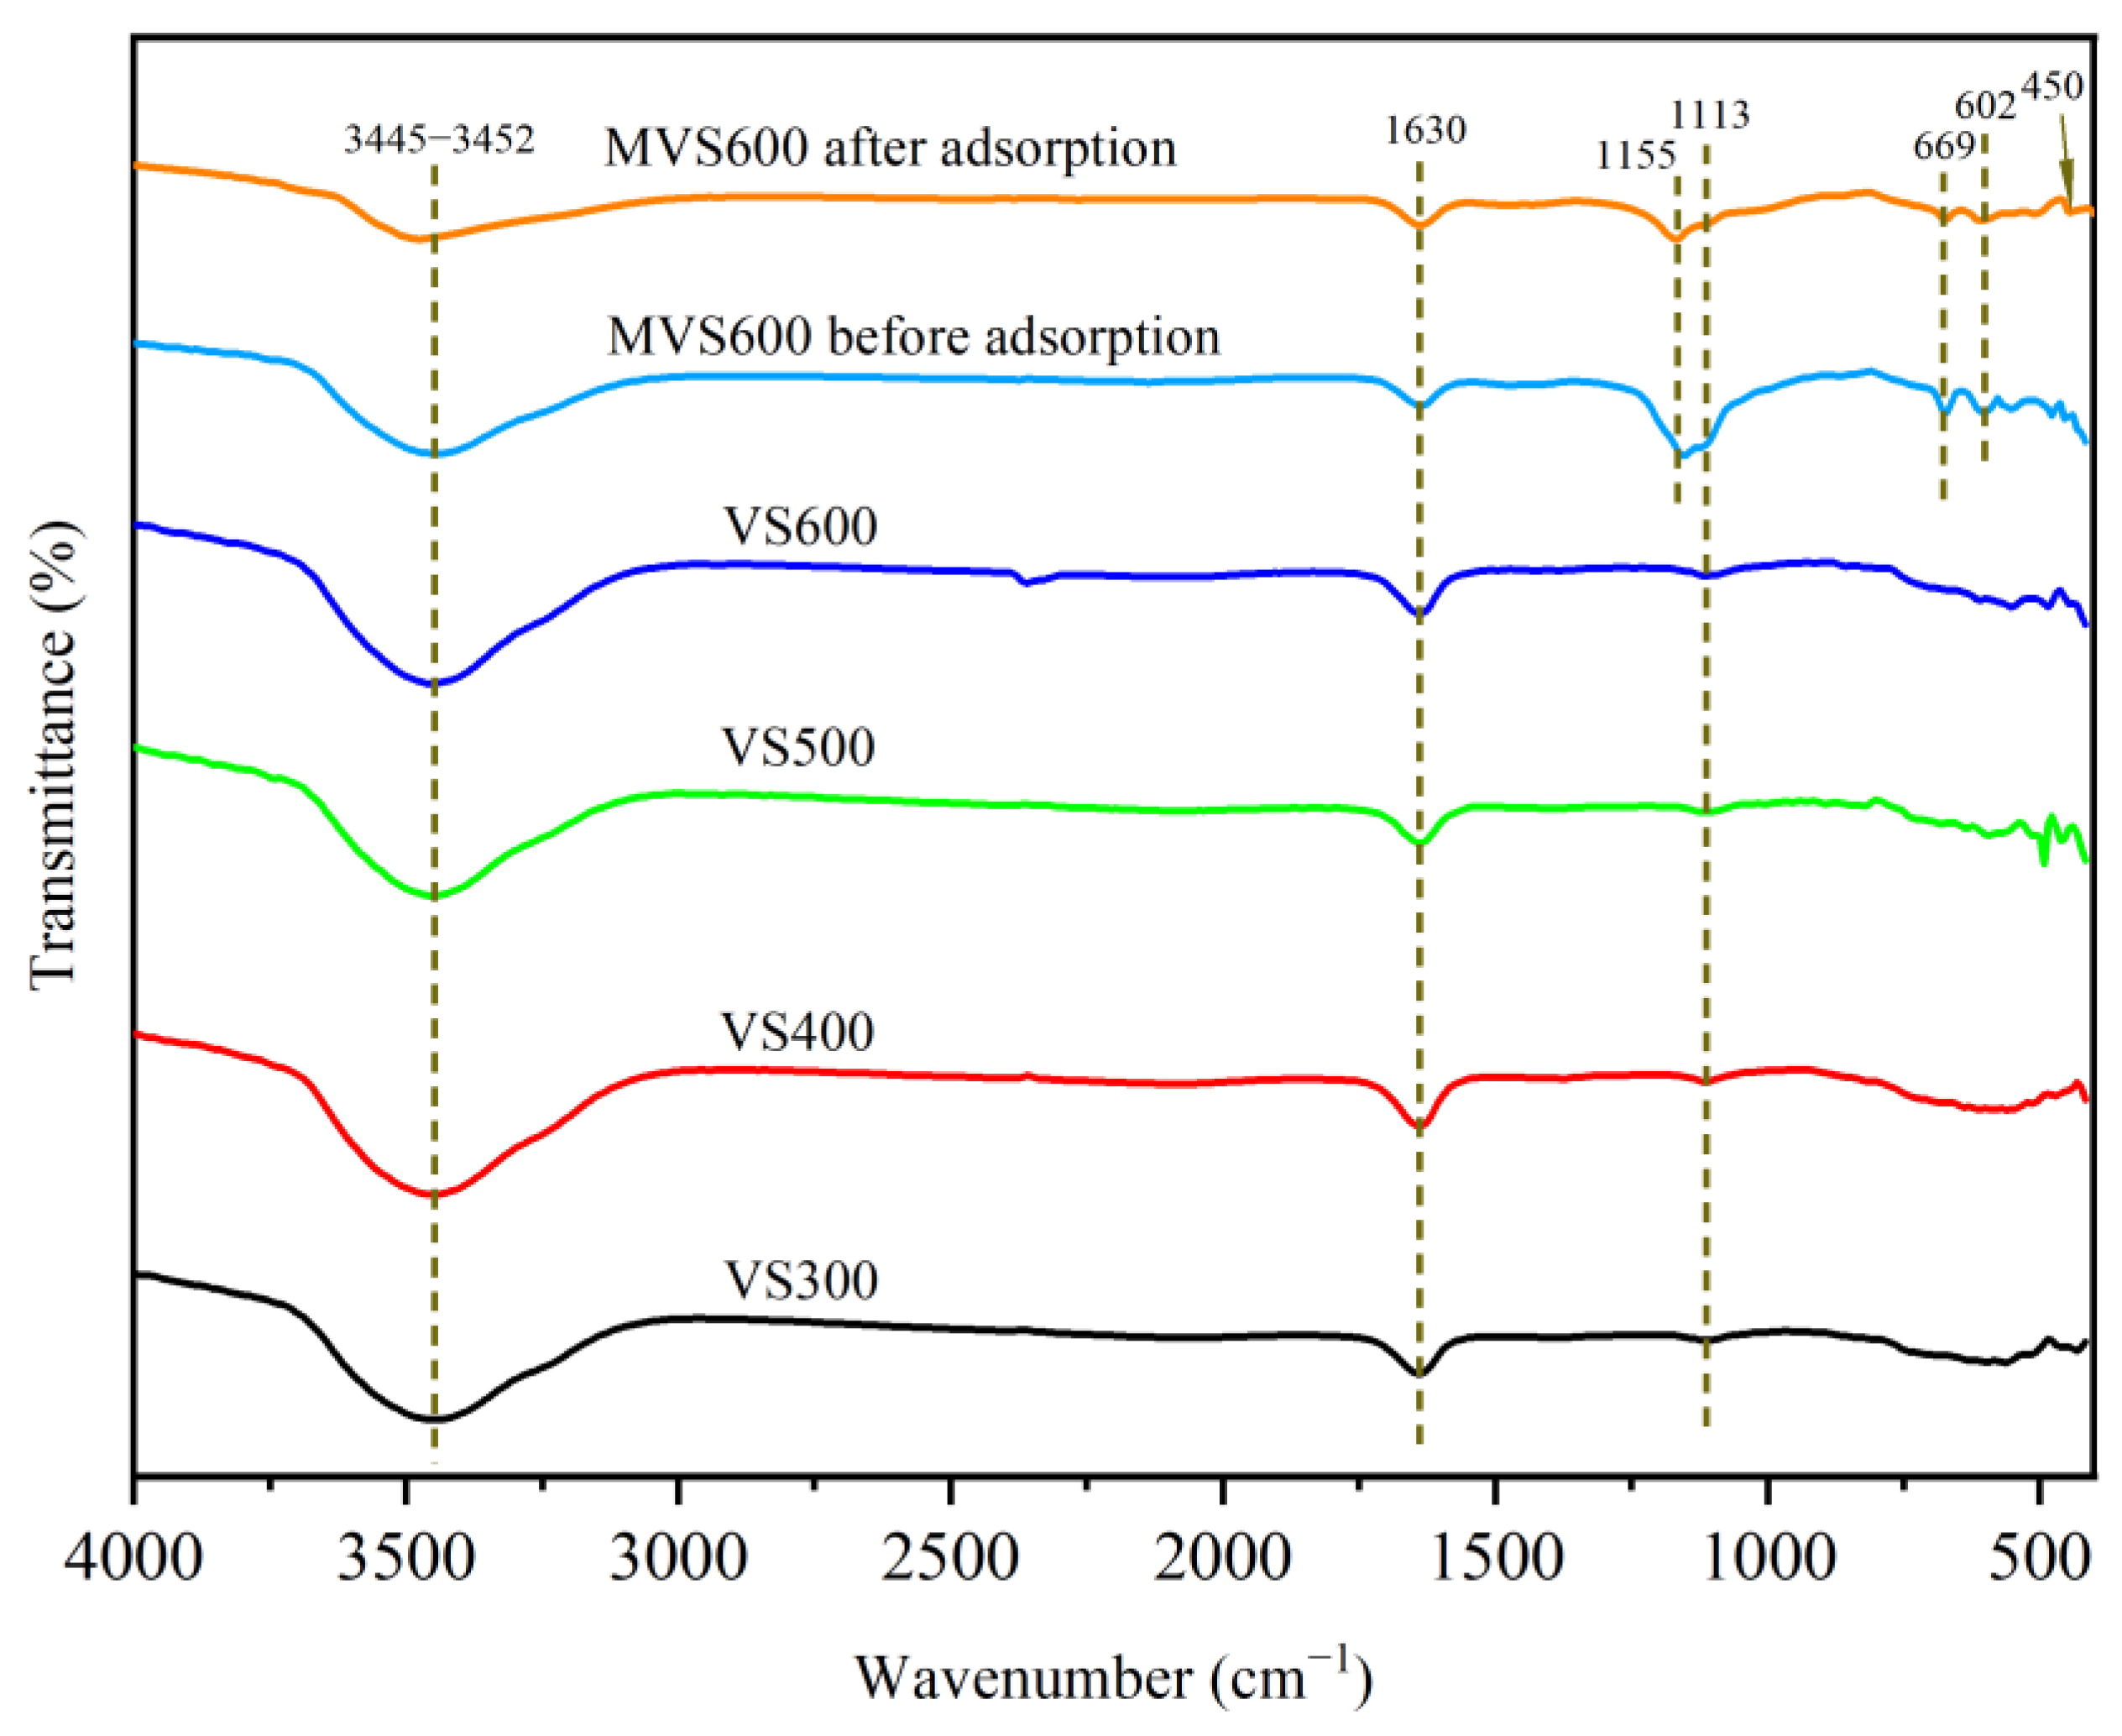
2.1.3. FTIR
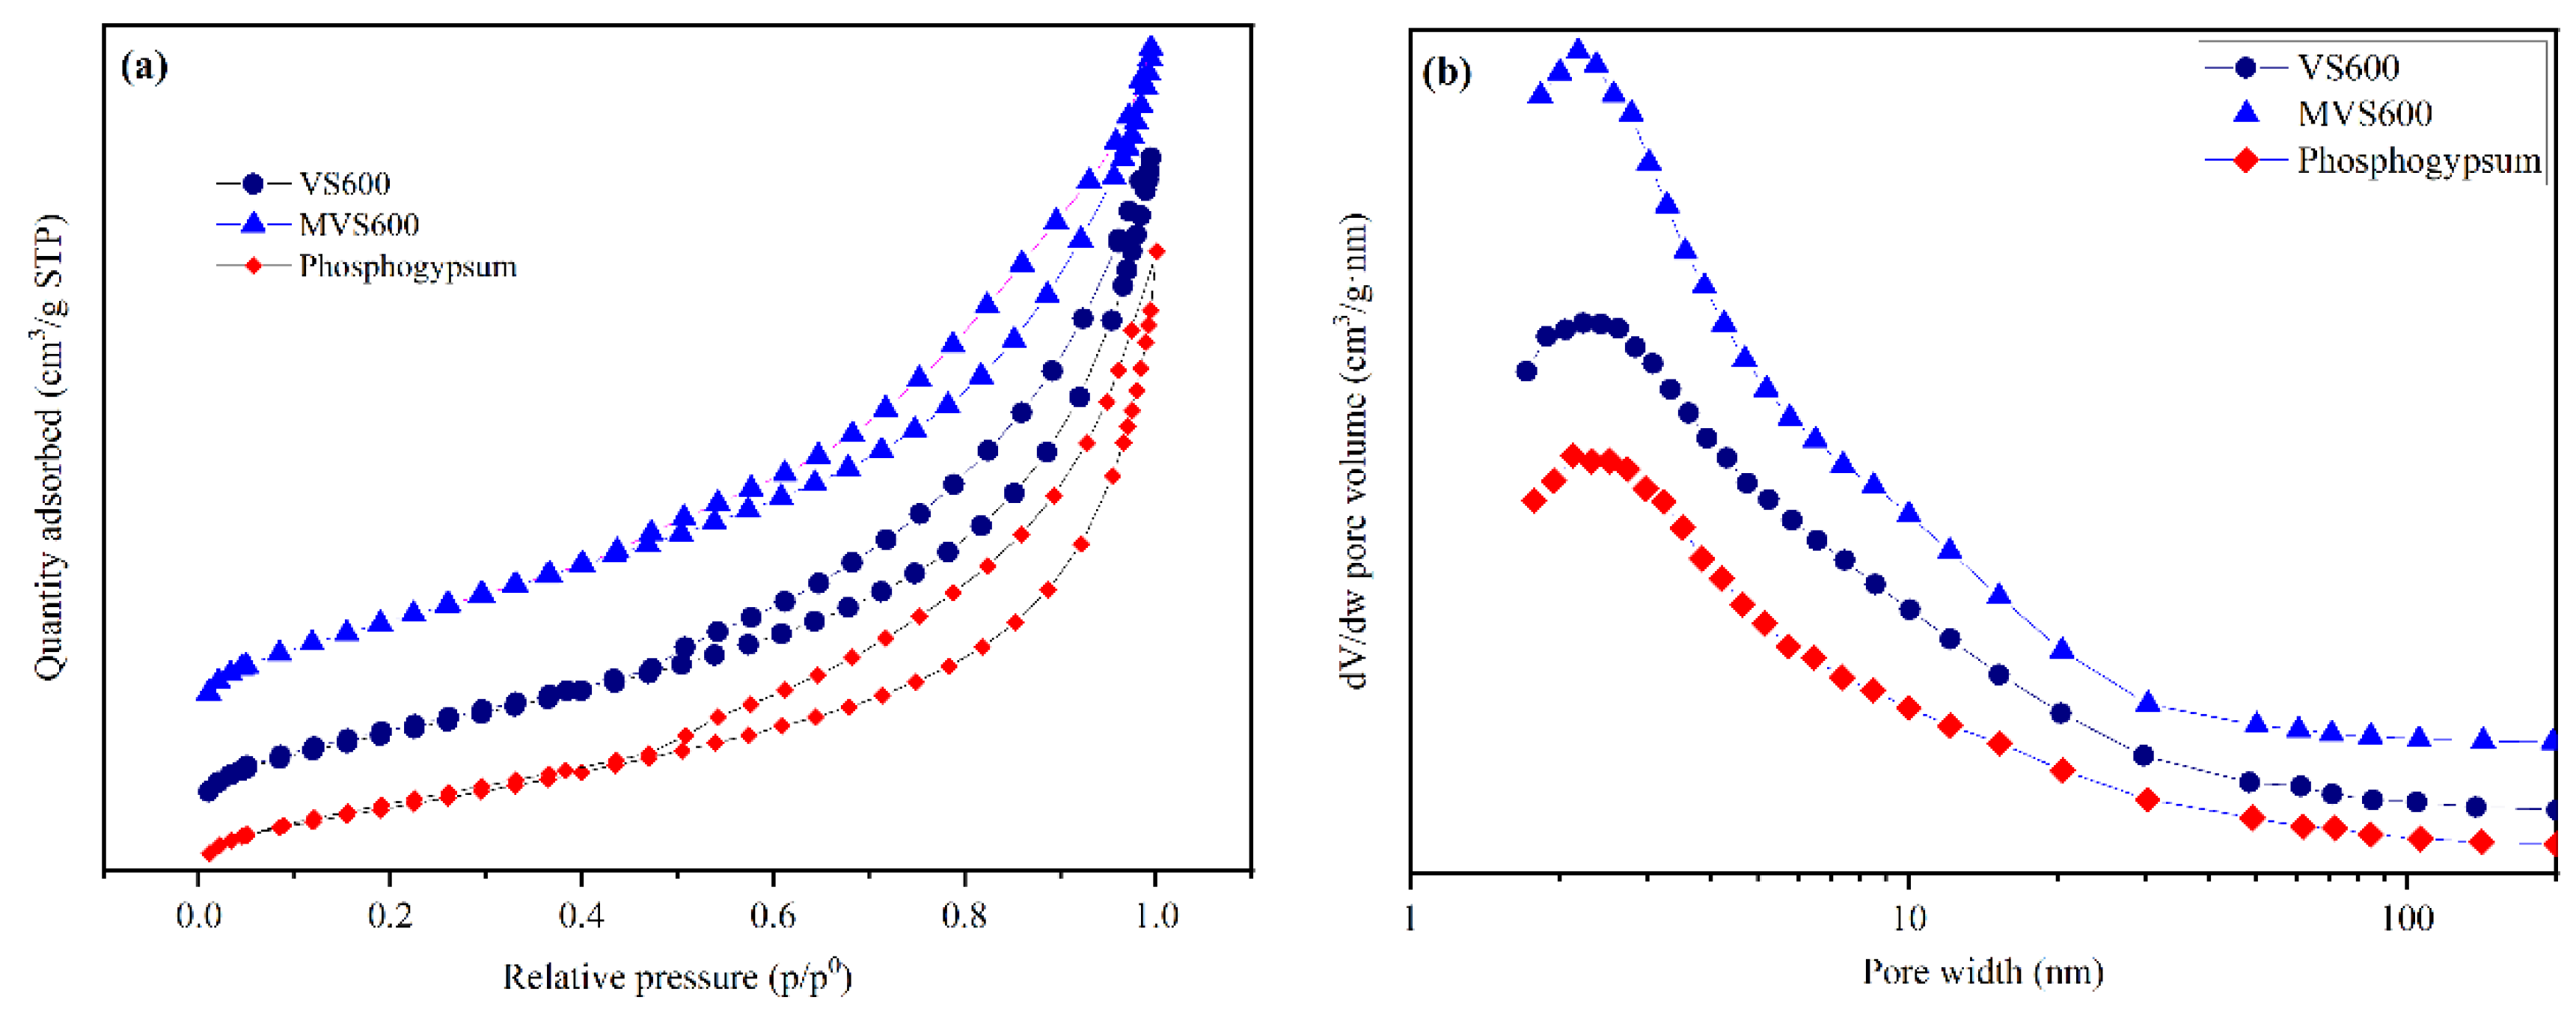
2.1.4. BET
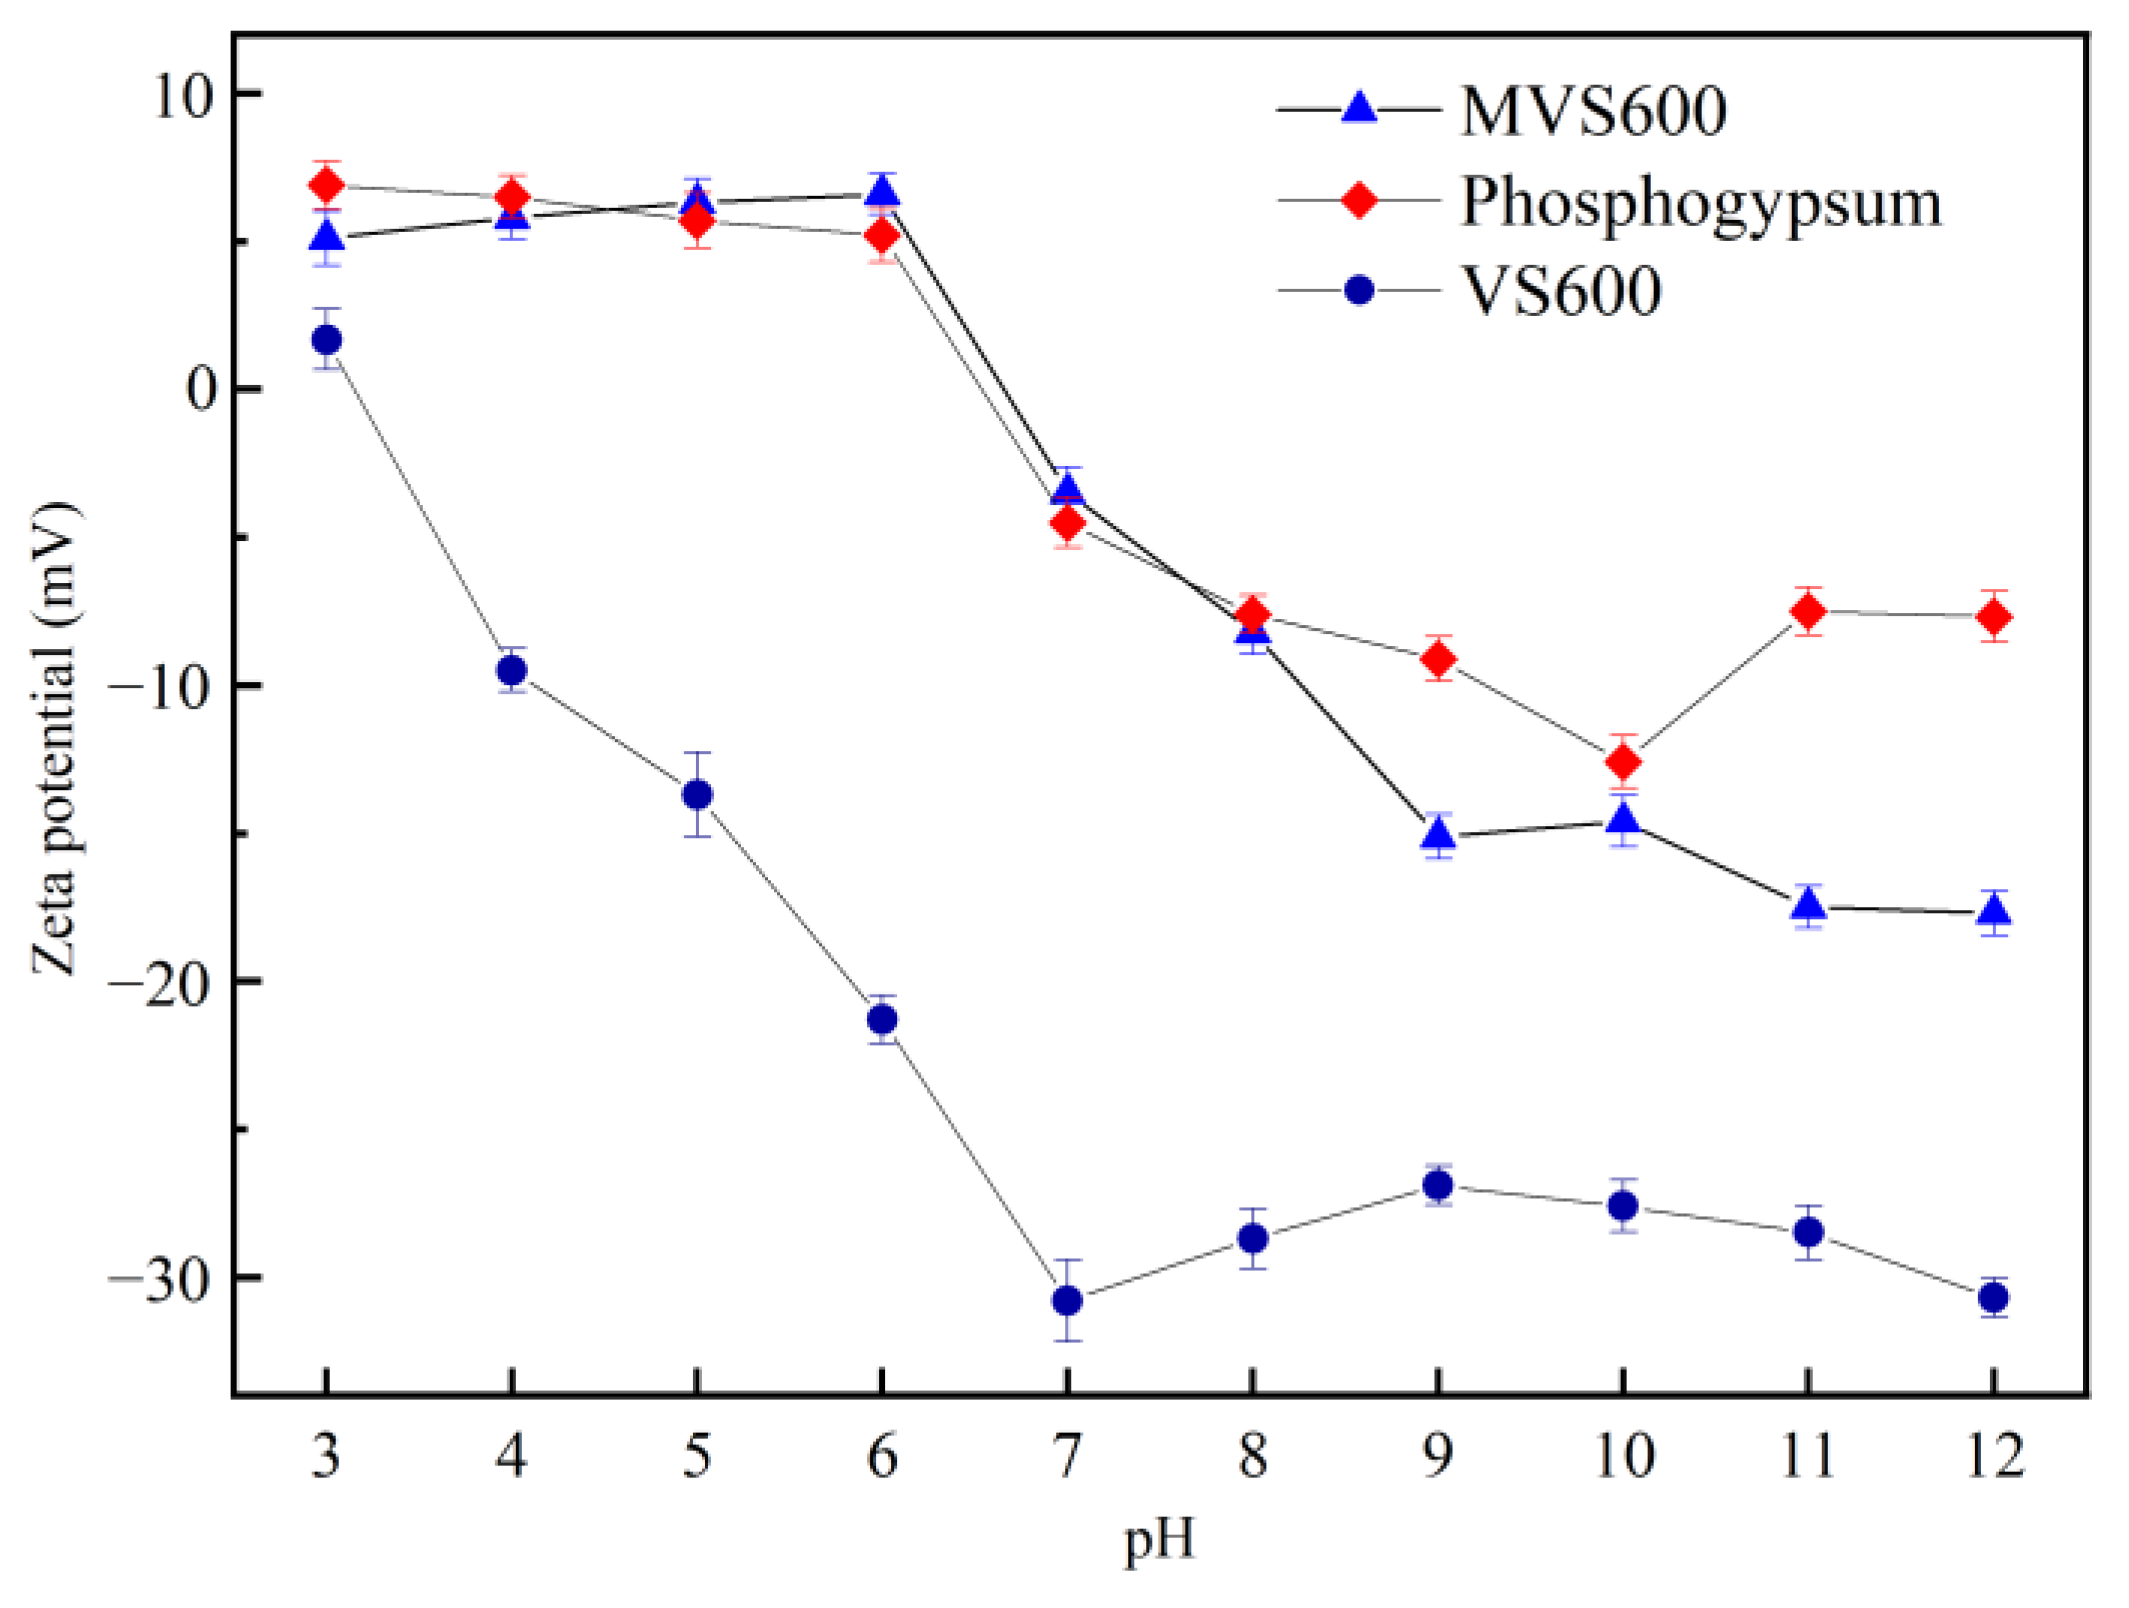
2.1.5. Zeta Potential
2.1.6. XPS
2.2. Batch Adsorption
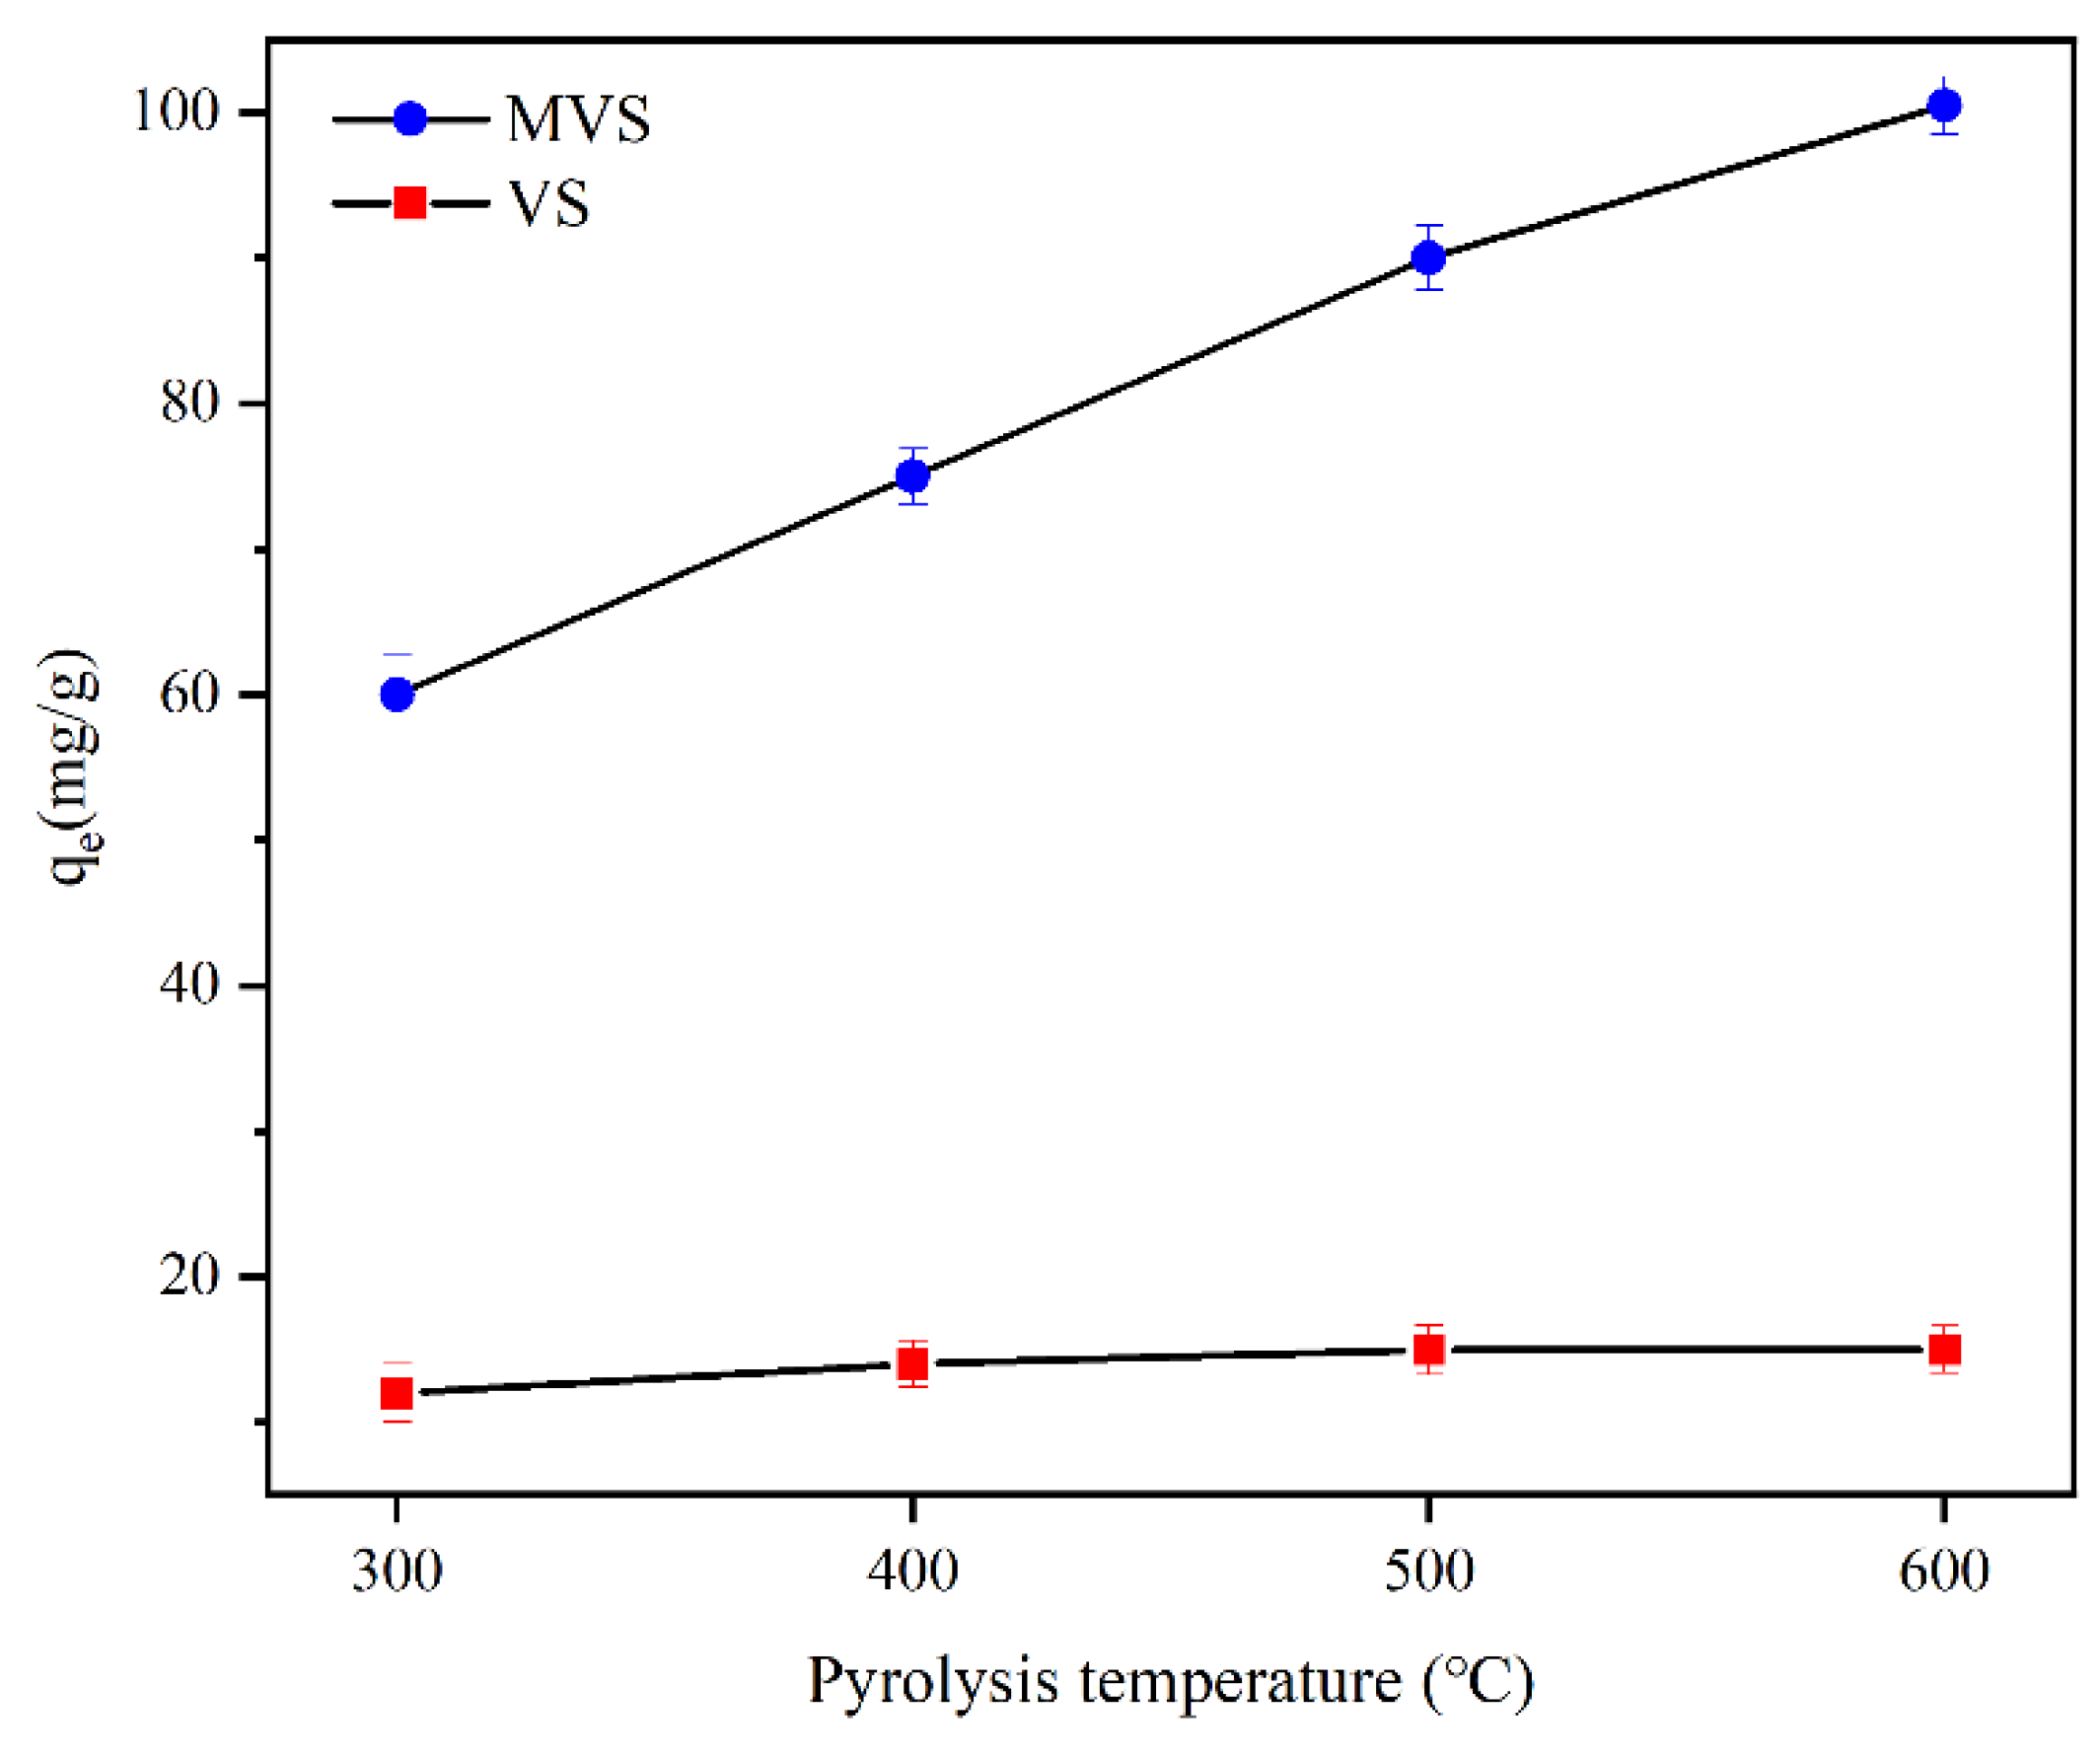
2.2.1. Effect of Pyrolysis Temperature
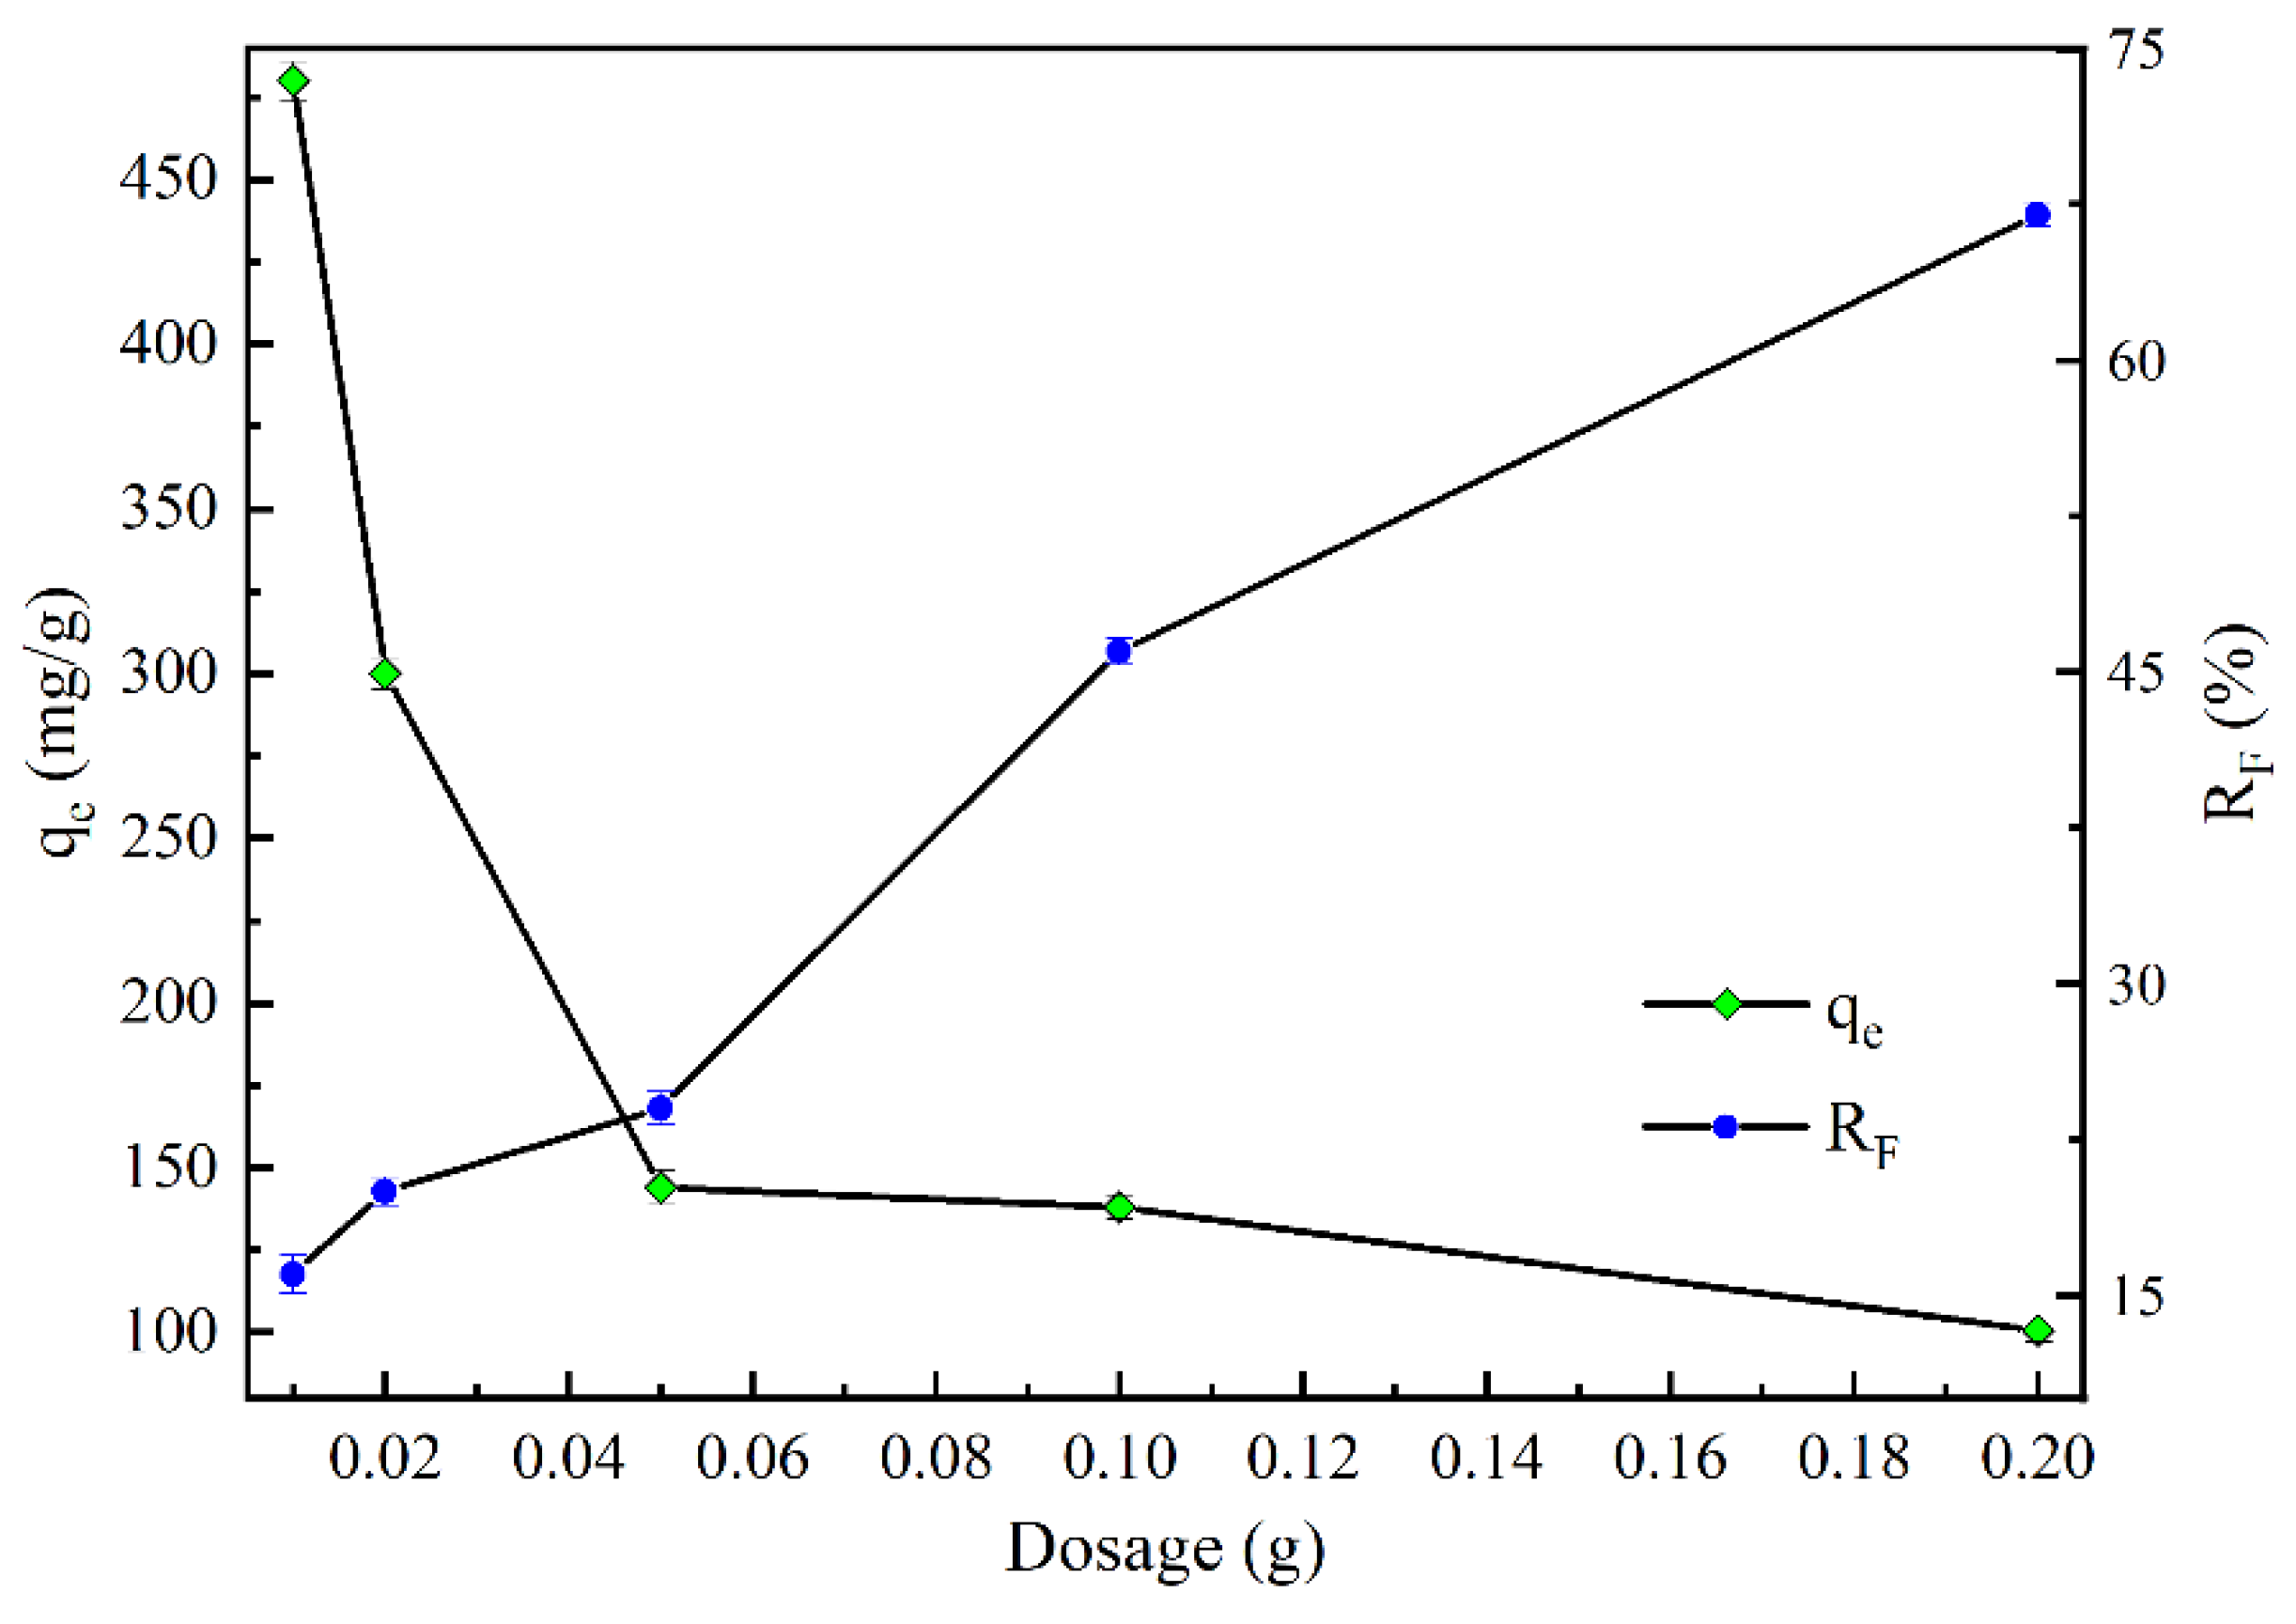
2.2.2. Effect of Dosage
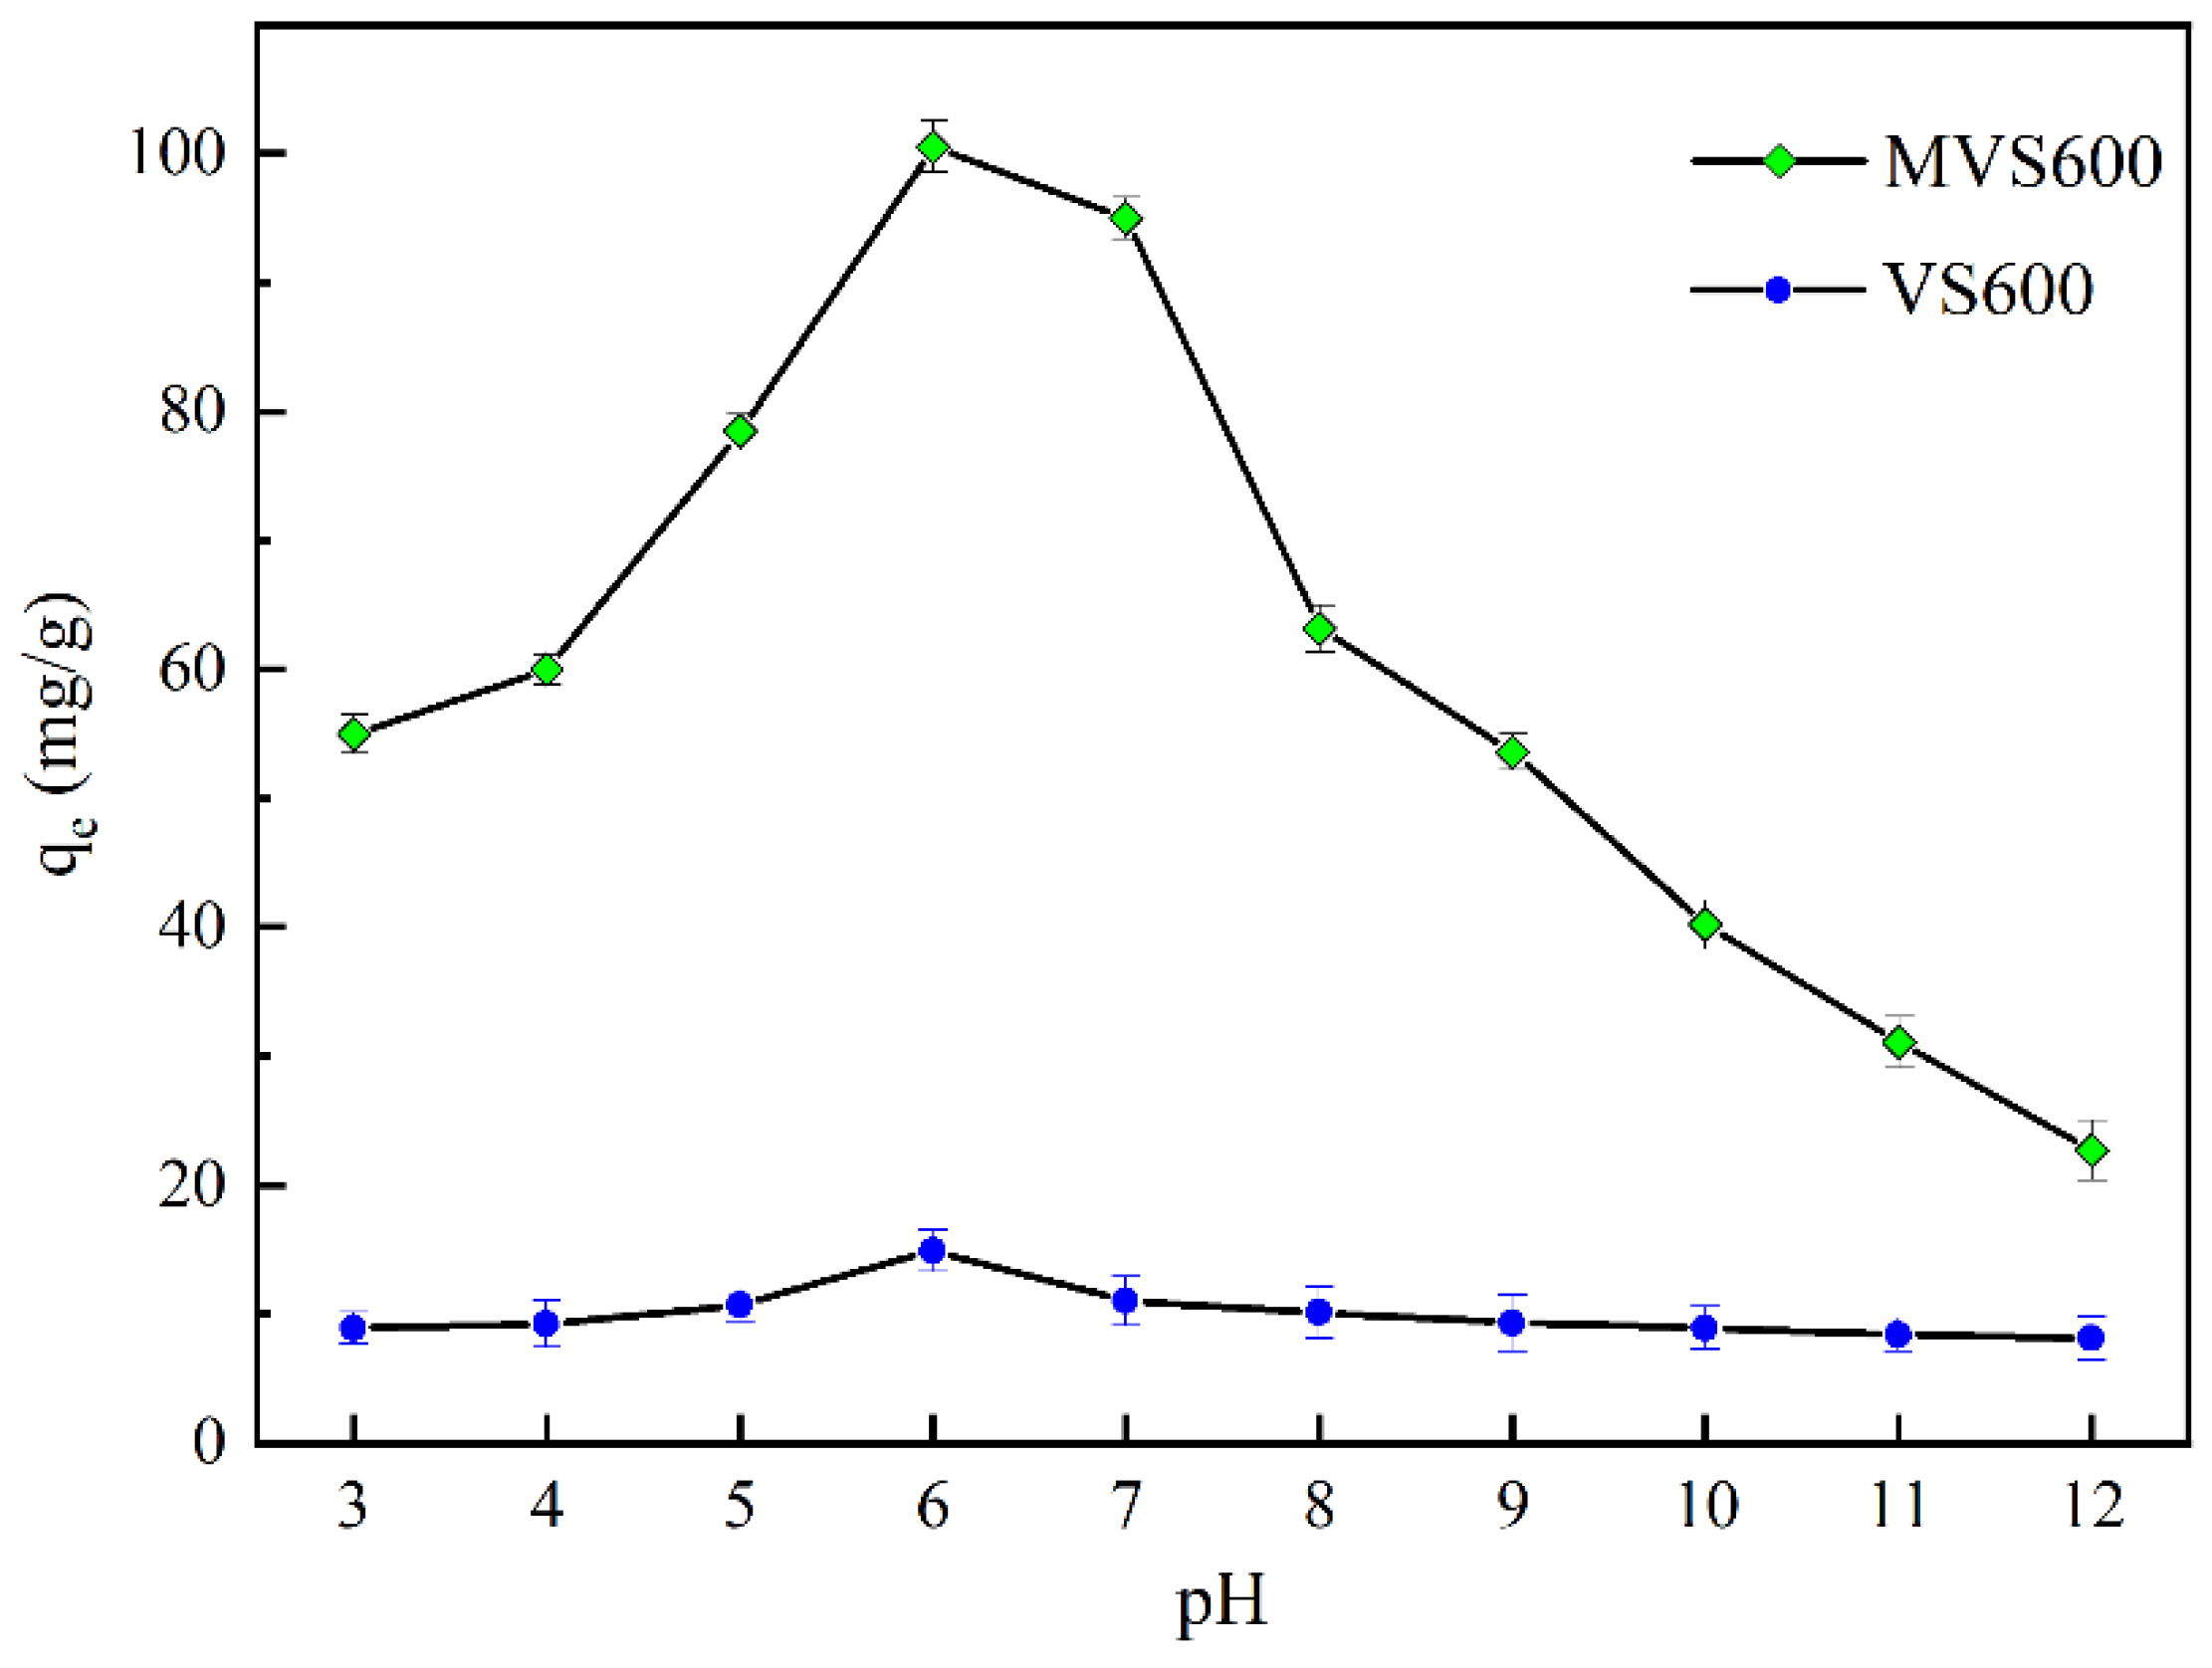
2.2.3. Effect of pH
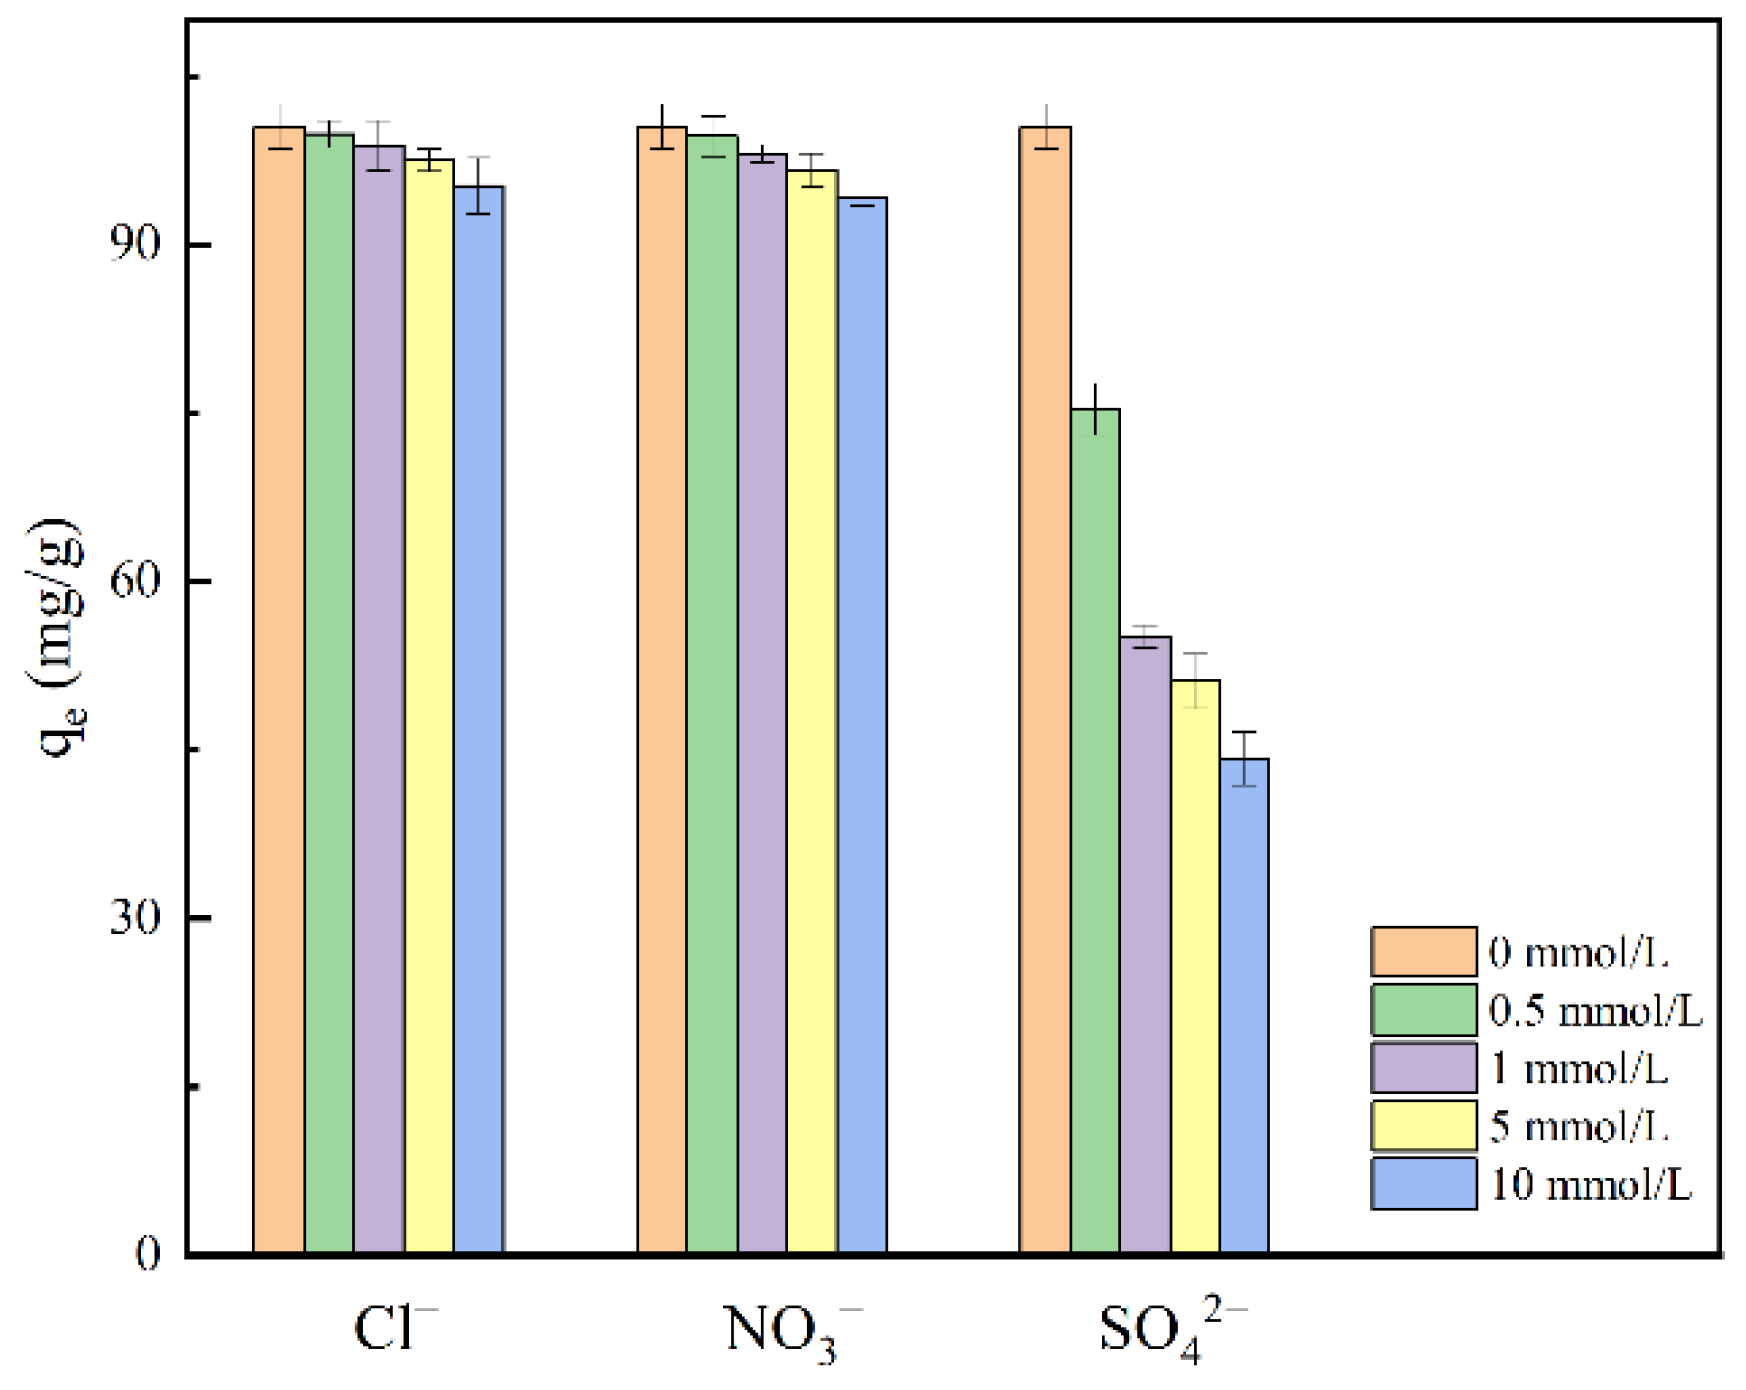
2.2.4. Effect of Co-Existing Anions
2.3. Adsorption Kinetics Analysis
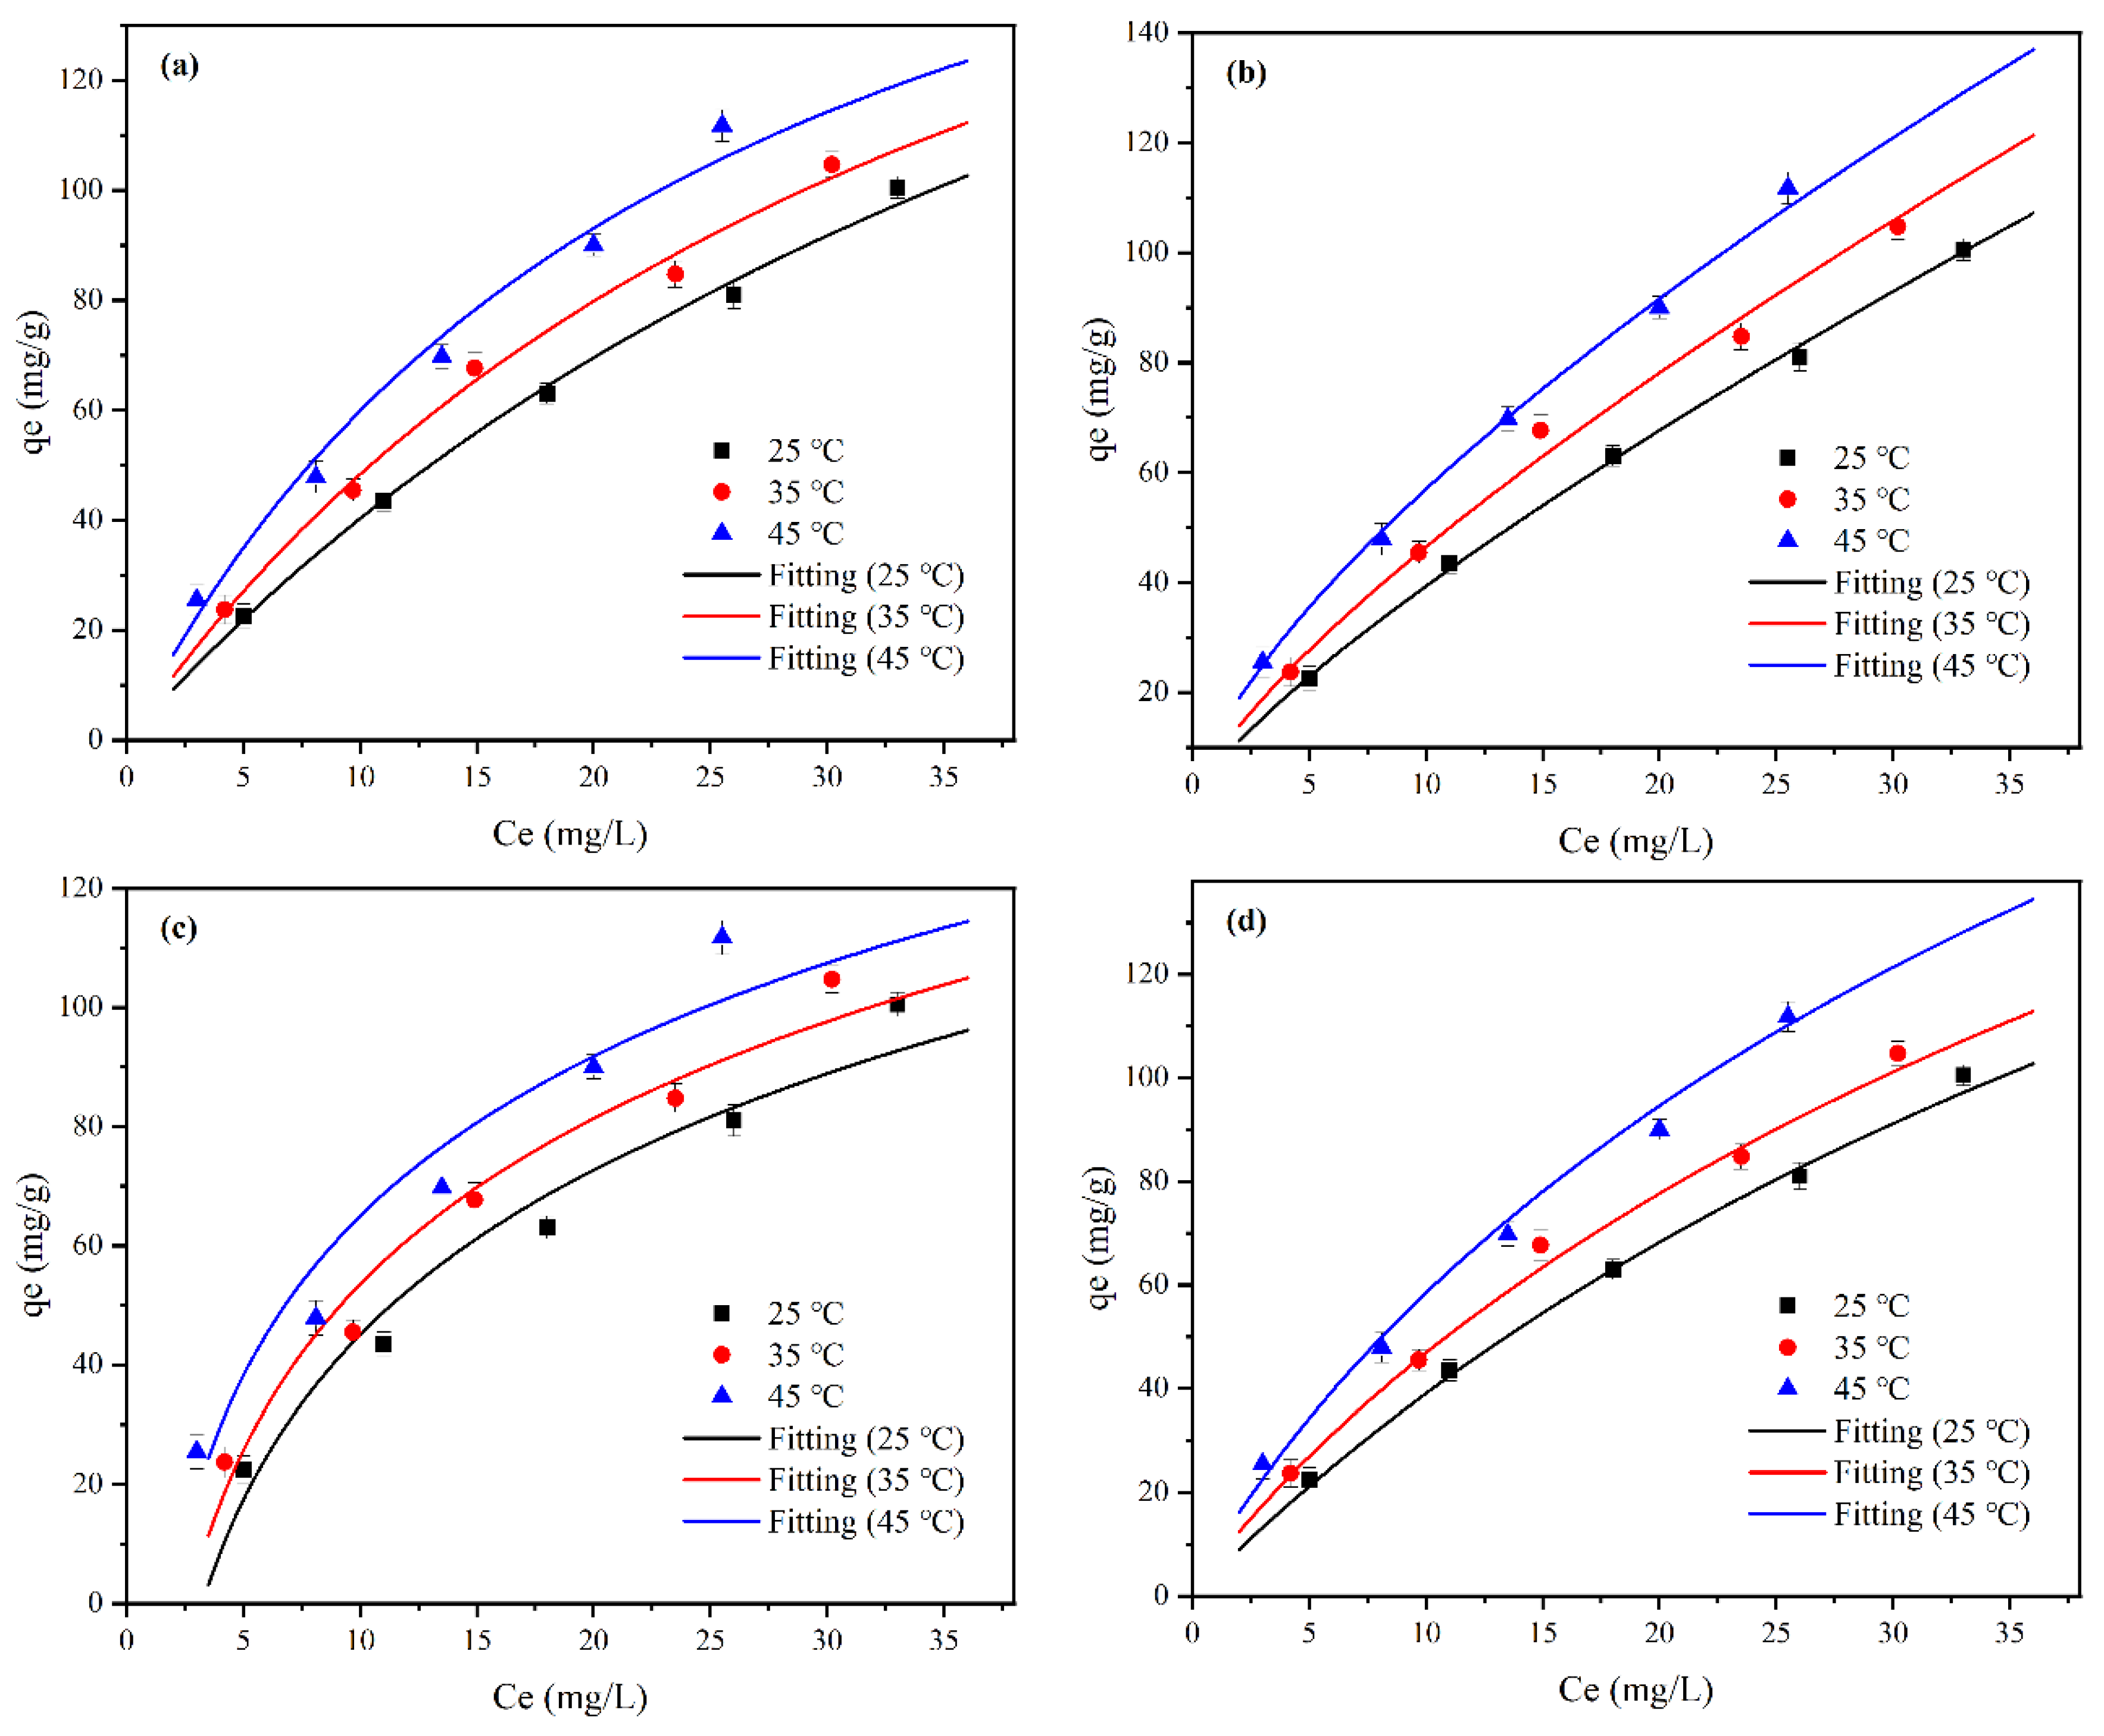
2.4. Adsorption Isotherm Study
2.5. Adsorption Thermodynamic Study
2.6. Mechanism of F− Adsorption
- (1)
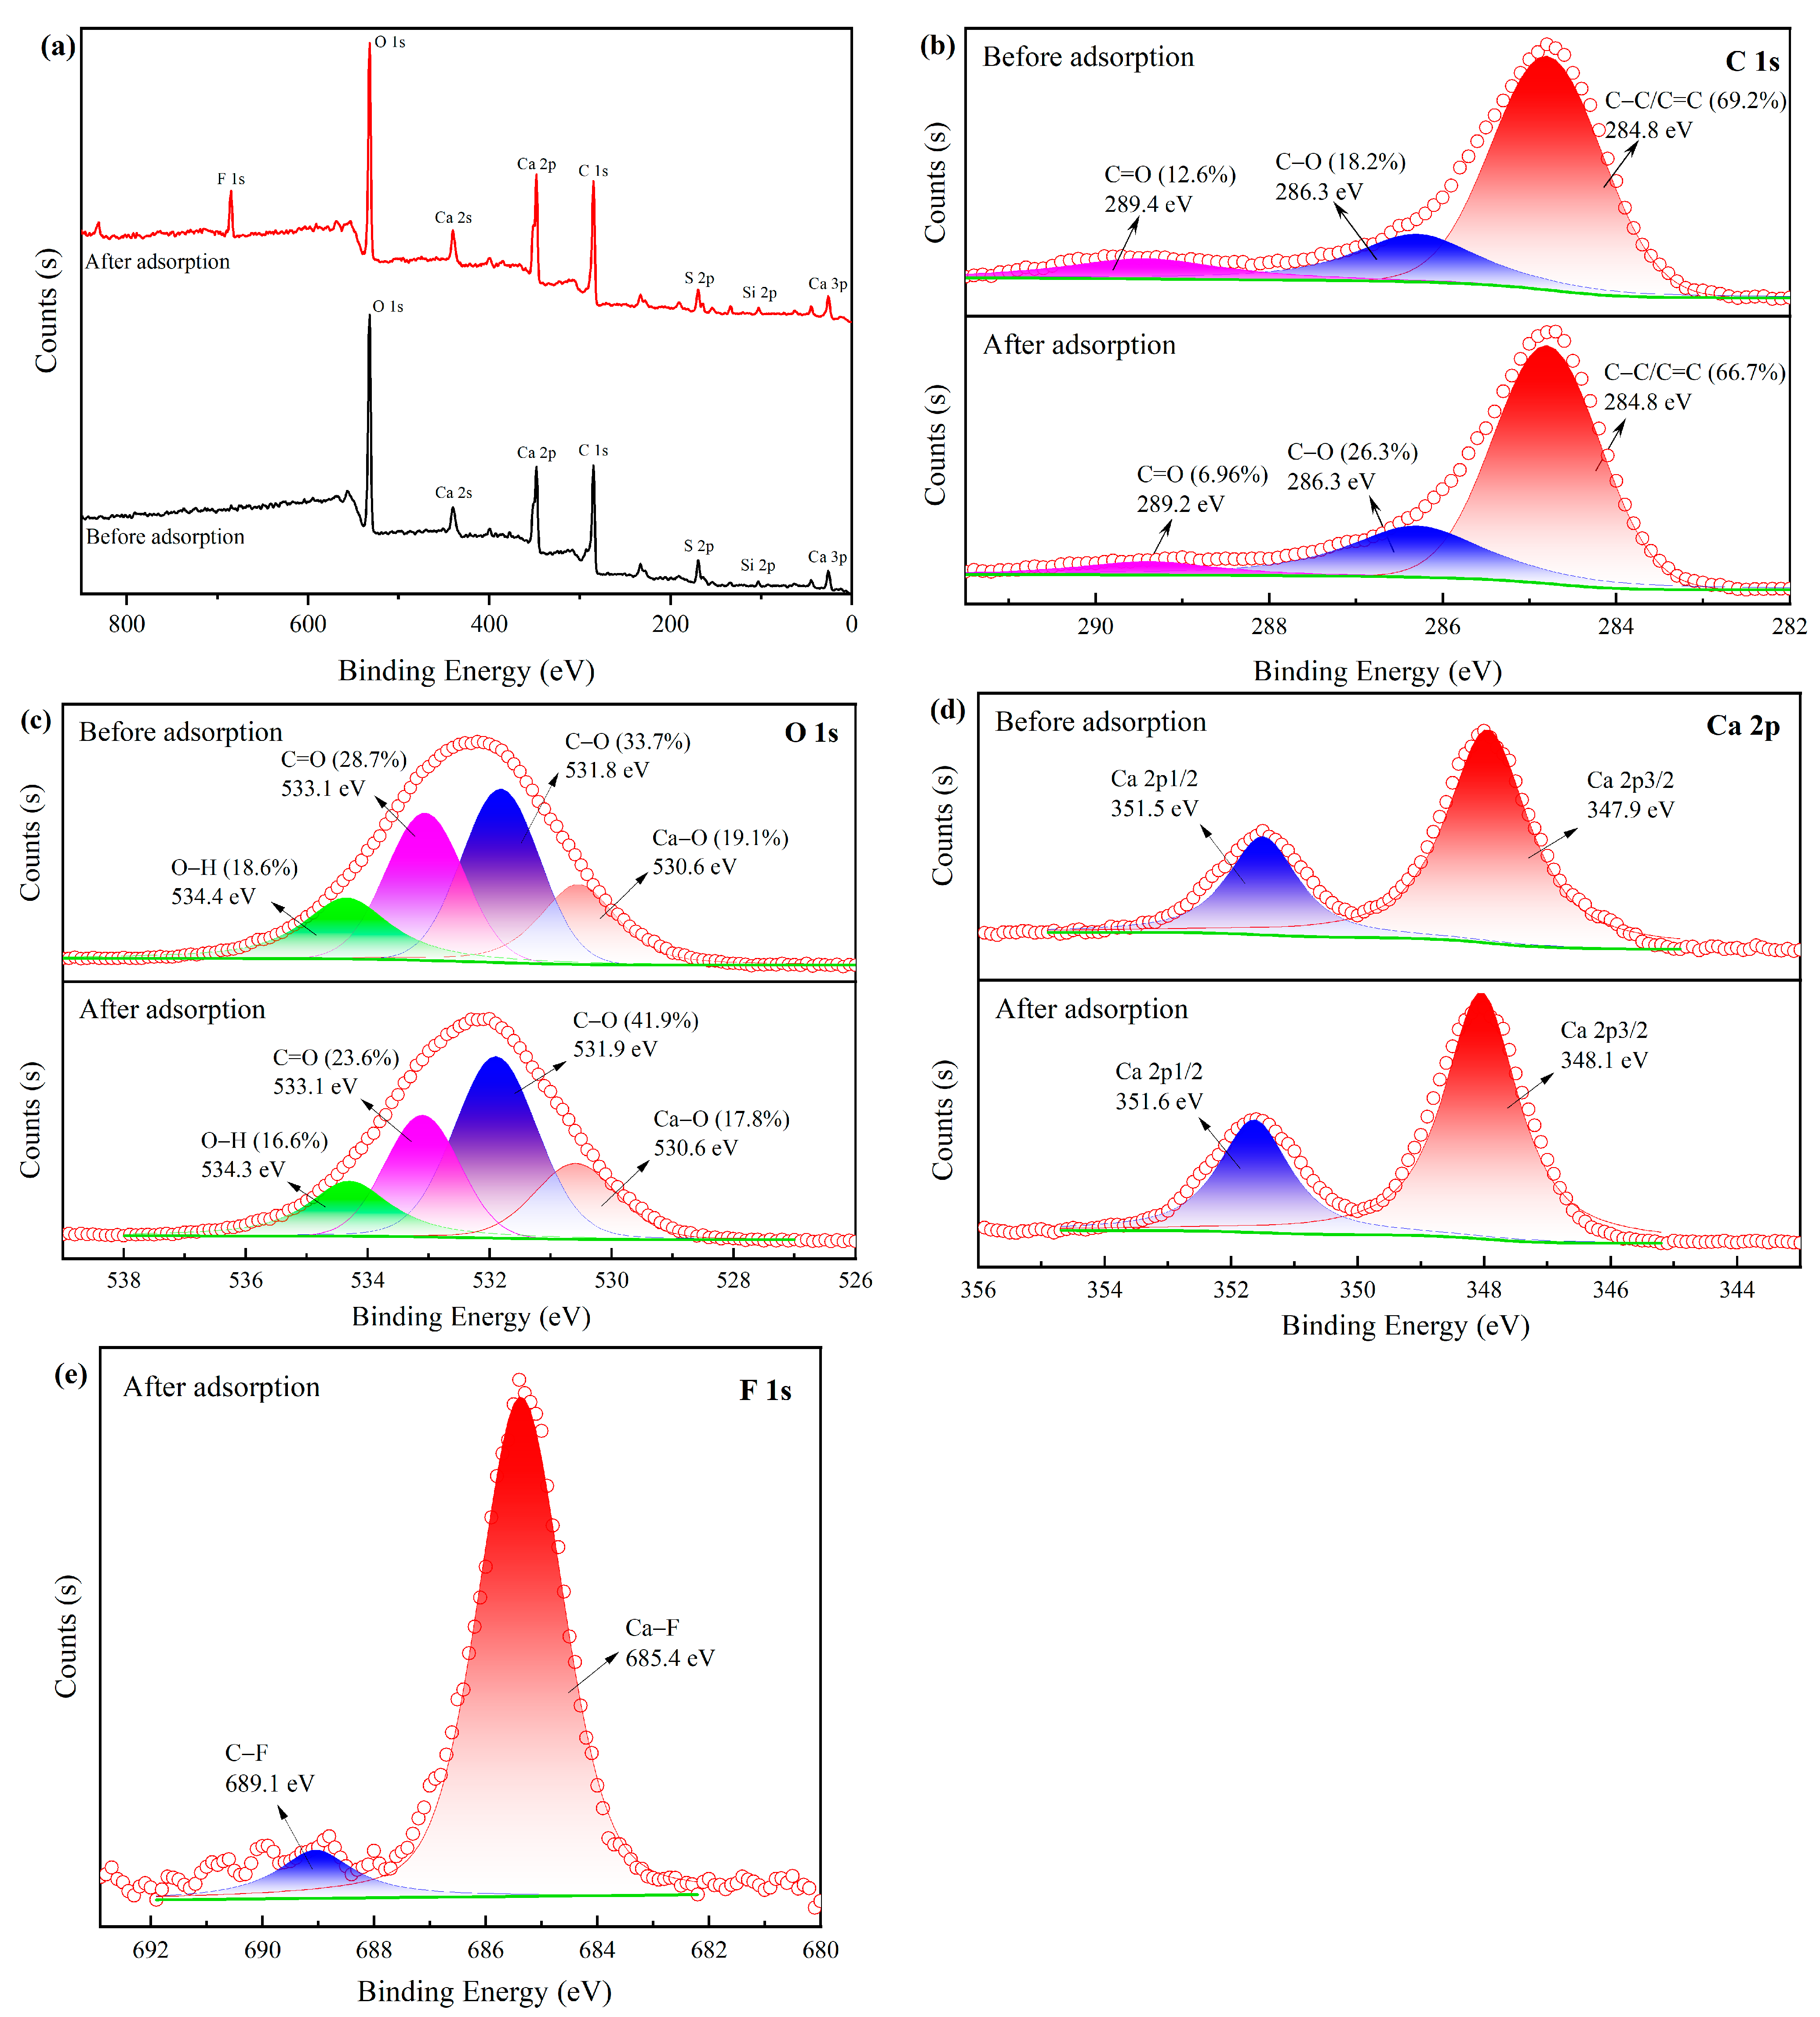
- Ion exchange. The analysis of FTIR and XPS revealed that the surface of MVS600 was rich in hydroxyl groups, and the content of the hydroxyl group became less after adsorption. This indicated that when fluoride approached MVS600, the hydroxyl groups on the surface were replaced by fluorine ions, as shown in Equation (1);
- (2)
- Chemical precipitation. Both XRD analysis and XPS analysis confirmed the production of CaF2. F− and Ca2+ on the MVS600 surface had a very tight attraction for each other and easily formed CaF2 precipitates, as shown in Equation (2);
- (3)
- Electrostatic attraction. It could be seen from the zeta potential analysis under low pH conditions that the C–O groups on the surface of MVS600 were protonated to C–OH+ and carried a large number of positive charges. Negatively charged fluorine ions were removed by electrostatic interaction with them, as shown in Equation (3). The formation of weakly ionized HF under strongly acidic conditions and deprotonation of surface functional groups under alkaline conditions reduced the degree of F adsorption. Under near-neutral conditions, F− adsorption could be described using other equations;
- (4)
- Hydrogen bonding. Due to the high electronegativity of O and F, the shared electron pair of –OH groups on the surface of MVS600 was biased toward O, so H easily interacted with F and formed an –OH⋯F hydrogen bond, as shown in Equation (4). This might be responsible for the change in O–H binding energy before and after adsorption in the XPS spectra.
3. Experimental Section
3.1. Reagents
3.2. Preparation of Materials
3.3. Physicochemical Characterization
3.4. Adsorptive Experiments
3.4.1. Adsorption Kinetics Modeling
3.4.2. Adsorption Isotherm Modeling
3.4.3. Adsorption Thermodynamics
4. Conclusions
Author Contributions
Funding
Institutional Review Board Statement
Informed Consent Statement
Data Availability Statement
Conflicts of Interest
References
- Raju, N.J. Prevalence of fluorosis in the fluoride enriched groundwater in semi-arid parts of eastern India: Geochemistry and health implications. Quat. Int. 2017, 443, 265–278. [Google Scholar] [CrossRef]
- Yadav, K.K.; Kumar, S.; Pham, Q.B.; Gupta, N.; Rezania, S.; Kamyab, H.; Yadav, S.; Vymazal, J.; Kumar, V.; Tri, D.Q.; et al. Fluoride contamination, health problems and remediation methods in Asian groundwater: A comprehensive review. Ecotoxicol. Environ. Saf. 2019, 182, 109362. [Google Scholar] [CrossRef] [PubMed]
- Kimambo, V.; Bhattacharya, P.; Mtalo, F.; Mtamba, J.; Ahmad, A. Fluoride occurrence in groundwater systems at global scale and status of defluoridation–State of the art. Groundw. Sustain. Dev. 2019, 9, 100223. [Google Scholar] [CrossRef]
- WHO. Guidelines for Drinking-Water Quality, 4th ed.; Incorporating the 1st Addendum; World Health Organization: Geneva, Switzerland, 2017. Available online: https://www.who.int/publications/i/item/9789241549950 (accessed on 9 August 2023).
- Kumar, R.; Sharma, P.; Yang, W.; Sillanpää, M.; Shang, J.; Bhattacharya, P.; Vithanage, M.; Maity, J.P. State-of-the-art of research progress on adsorptive removal of fluoride-contaminated water using biochar-based materials: Practical feasibility through reusability and column transport studies. Environ. Res. 2022, 214, 114043. [Google Scholar] [CrossRef] [PubMed]
- Malago, J.; Makoba, E.; Muzuka, A.N.N. Fluoride Levels in Surface and Groundwater in Africa: A Review. Am. J. Water Sci. Eng. 2017, 3, 1. [Google Scholar] [CrossRef]
- Adimalla, N.; Qian, H.; Nandan, M. Groundwater chemistry integrating the pollution index of groundwater and evaluation of potential human health risk: A case study from hard rock terrain of south India. Ecotoxicol. Environ. Saf. 2020, 206, 111217. [Google Scholar] [CrossRef]
- Tang, X.; Zhou, C.; Xia, W.; Liang, Y.; Zeng, Y.; Zhao, X.; Xiong, W.; Cheng, M.; Wang, Z. Recent advances in metal–organic framework-based materials for removal of fluoride in water: Performance, mechanism, and potential practical application. Chem. Eng. J. 2022, 446, 137299. [Google Scholar] [CrossRef]
- Nabbou, N.; Belhachemi, M.; Boumelik, M.; Merzougui, T.; Lahcene, D.; Harek, Y.; Zorpas, A.A.; Jeguirim, M. Removal of fluoride from groundwater using natural clay (kaolinite): Optimization of adsorption conditions. Comptes Rendus Chim. 2019, 22, 105–112. [Google Scholar] [CrossRef]
- Duvva, L.K.; Panga, K.K.; Dhakate, R.; Himabindu, V. Health risk assessment of nitrate and fluoride toxicity in groundwater contamination in the semi-arid area of Medchal, South India. Appl. Water Sci. 2022, 12, 11. [Google Scholar] [CrossRef]
- Wang, Z.; Gu, X.; Zhang, Y.; Zhang, X.; Ngo, H.H.; Liu, Y.; Jiang, W.; Tan, X.; Wang, X.; Zhang, J. Activated nano-Al2O3 loaded on polyurethane foam as a potential carrier for fluorine removal. J. Water Process. Eng. 2021, 44, 102444. [Google Scholar] [CrossRef]
- Kumar, P.S.; Suganya, S.; Srinivas, S.; Priyadharshini, S.; Karthika, M.; Sri, R.K.; Swetha, V.; Naushad, M.; Lichtfouse, E. Treatment of fluoride-contaminated water. A review. Environ. Chem. Lett. 2019, 17, 1707–1726. [Google Scholar] [CrossRef]
- Du, Y.; Wang, D.; Wang, W.; Fu, J.; Chen, X.; Wang, L.; Yang, W.; Zhang, X. Electrospun Nanofibrous Polyphenylene Oxide Membranes for High-Salinity Water Desalination by Direct Contact Membrane Distillation. ACS Sustain. Chem. Eng. 2019, 7, 20060–20069. [Google Scholar] [CrossRef]
- Zhao, X.; Zhang, B.; Liu, H.; Qu, J. Simultaneous removal of arsenite and fluoride via an integrated electro-oxidation and electrocoagulation process. Chemosphere 2011, 83, 726–729. [Google Scholar] [CrossRef] [PubMed]
- Jagtap, S.; Yenkie, M.K.; Labhsetwar, N.; Rayalu, S. Fluoride in Drinking Water and Defluoridation of Water. Chem. Rev. 2012, 112, 2454–2466. [Google Scholar] [CrossRef]
- Huang, H.; Liu, J.; Zhang, P.; Zhang, D.; Gao, F. Investigation on the simultaneous removal of fluoride, ammonia nitrogen and phosphate from semiconductor wastewater using chemical precipitation. Chem. Eng. J. 2017, 307, 696–706. [Google Scholar] [CrossRef]
- Tolkou, A.K.; Trikalioti, S.; Makrogianni, O.; Trikkaliotis, D.G.; Deliyanni, E.A.; Kyzas, G.Z.; Katsoyiannis, I.A. Magnesium modified activated carbons derived from coconut shells for the removal of fluoride from water. Sustain. Chem. Pharm. 2023, 31, 100898. [Google Scholar] [CrossRef]
- Tang, X.; Xia, W.; Qu, X.; Wang, C.; Wang, W.; Liang, Y.; Zeng, Y.; Xiong, W.; Cheng, M.; Song, B.; et al. Structure–performance correlation guided cerium-based metal–organic frameworks: Superior adsorbents for fluoride removal in water. Chemosphere 2023, 312, 137335. [Google Scholar] [CrossRef]
- Alhassan, S.I.; Huang, L.; He, Y.; Yan, L.; Wu, B.; Wang, H. Fluoride removal from water using alumina and aluminum-based composites: A comprehensive review of progress. Crit. Rev. Environ. Sci. Technol. 2021, 51, 2051–2085. [Google Scholar] [CrossRef]
- Pang, T.; Chan, T.S.A.; Jande, Y.A.C.; Shen, J. Removal of fluoride from water using activated carbon fibres modified with zirconium by a drop-coating method. Chemosphere 2020, 255, 126950. [Google Scholar] [CrossRef]
- Chen, J.; Yang, R.; Zhang, Z.; Wu, D. Removal of fluoride from water using aluminum hydroxide-loaded zeolite synthesized from coal fly ash. J. Hazard. Mater. 2022, 421, 126817. [Google Scholar] [CrossRef]
- Wan, K.; Huang, L.; Yan, J.; Ma, B.; Huang, X.; Luo, Z.; Zhang, H.; Xiao, T. Removal of fluoride from industrial wastewater by using different adsorbents: A review. Sci. Total Environ. 2021, 773, 145535. [Google Scholar] [CrossRef] [PubMed]
- Liang, H.; Wang, W.; Liu, H.; Deng, X.; Zhang, D.; Zou, Y.; Ruan, X. Porous MgO-modified biochar adsorbents fabricated by the activation of Mg(NO3)2 for phosphate removal: Synergistic enhancement of porosity and active sites. Chemosphere 2023, 324, 138320. [Google Scholar] [CrossRef] [PubMed]
- Halder, G.; Khan, A.A.; Dhawane, S. Fluoride Sorption Onto a Steam-Activated Biochar Derived From Cocos nucifera Shell. CLEAN Soil Air Water 2016, 44, 124–133. [Google Scholar] [CrossRef]
- Khan, B.A.; Ahmad, M.; Iqbal, S.; Bolan, N.; Zubair, S.; Shafique, M.A.; Shah, A. Effectiveness of the engineered pinecone-derived biochar for the removal of fluoride from water. Environ. Res. 2022, 212, 113540. [Google Scholar] [CrossRef]
- Saikia, R.; Goswami, R.; Bordoloi, N.; Senapati, K.K.; Pant, K.K.; Kumar, M.; Kataki, R. Removal of arsenic and fluoride from aqueous solution by biomass based activated biochar: Optimization through response surface methodology. J. Environ. Chem. Eng. 2017, 5, 5528–5539. [Google Scholar] [CrossRef]
- Roy, S.; Sengupta, S.; Manna, S.; Das, P. Chemically reduced tea waste biochar and its application in treatment of fluoride containing wastewater: Batch and optimization using response surface methodology. Process. Saf. Environ. Prot. 2018, 116, 553–563. [Google Scholar] [CrossRef]
- Fu, S.-F.; Xu, X.-H.; Dai, M.; Yuan, X.-Z.; Guo, R.-B. Hydrogen and methane production from vinasse using two-stage anaerobic digestion. Process. Saf. Environ. Prot. 2017, 107, 81–86. [Google Scholar] [CrossRef]
- El-Didamony, H.; Gado, H.; Awwad, N.; Fawzy, M.; Attallah, M. Treatment of phosphogypsum waste produced from phosphate ore processing. J. Hazard. Mater. 2013, 244, 596–602. [Google Scholar] [CrossRef]
- Zhao, R.; Wang, B.; Theng, B.K.; Wu, P.; Liu, F.; Lee, X.; Chen, M.; Sun, J. Fabrication and environmental applications of metal-containing solid waste/biochar composites: A review. Sci. Total Environ. 2021, 799, 149295. [Google Scholar] [CrossRef]
- Zhou, L. Preparation of Calcium Fluoride using Phosphogypsum by Orthogonal Experiment. Open Chem. 2018, 16, 864–868. [Google Scholar] [CrossRef]
- Lian, G.; Wang, B.; Lee, X.; Li, L.; Liu, T.; Lyu, W. Enhanced removal of hexavalent chromium by engineered biochar composite fabricated from phosphogypsum and distillers grains. Sci. Total Environ. 2019, 697, 134119. [Google Scholar] [CrossRef] [PubMed]
- Wang, B.; Lian, G.; Lee, X.; Gao, B.; Li, L.; Liu, T.; Zhang, X.; Zheng, Y. Phosphogypsum as a novel modifier for distillers grains biochar removal of phosphate from water. Chemosphere 2020, 238, 124684. [Google Scholar] [CrossRef] [PubMed]
- Jiang, Z.; Chen, M.; Lee, X.; Feng, Q.; Cheng, N.; Zhang, X.; Wang, S.; Wang, B. Enhanced removal of sulfonamide antibiotics from water by phosphogypsum modified biochar composite. J. Environ. Sci. 2023, 130, 174–186. [Google Scholar] [CrossRef] [PubMed]
- Alla, M.; Harrou, A.; Elhafiany, M.L.; Azerkane, D.; El Ouahabi, M.; Gharibi, E.K. Reduction of phosphogypsum to calcium sulfide (CaS) using metallic iron in a hydrochloric acid medium. Phosphoru Sulfur Silicon Relat. Elem. 2022, 197, 1026–1035. [Google Scholar] [CrossRef]
- Li, W.; Huang, H.; Mei, B.; Song, J. Comparison of commercial and synthesized CaF2 powders for preparing transparent ceramics. Ceram. Int. 2017, 43, 10403–10409. [Google Scholar] [CrossRef]
- Van Truong, T.; Kim, Y.-J.; Kim, D.-J. Study of biochar impregnated with Al recovered from water sludge for phosphate adsorption/desorption. J. Clean. Prod. 2023, 383, 135507. [Google Scholar] [CrossRef]
- Ediati, R.; Zulfa, L.L.; Putrilia, R.D.; Hidayat, A.R.P.; Sulistiono, D.O.; Rosyidah, A.; Martak, F.; Hartanto, D. Synthesis of UiO-66 with addition of HKUST-1 for enhanced adsorption of RBBR dye. Arab. J. Chem. 2023, 16, 104637. [Google Scholar] [CrossRef]
- Kazak, O.; Tor, A. Characteristics and mechanisms for highly efficient adsorption of Pb(II) from aqueous solutions by engineered vinasse biochar with cold oxygen plasma process. Chem. Eng. Process.-Process. Intensif. 2022, 171, 108766. [Google Scholar] [CrossRef]
- Li, L.; Liao, L.; Wang, B.; Li, W.; Liu, T.; Wu, P.; Xu, Q.; Liu, S. Effective Sb(V) removal from aqueous solution using phosphogypsum-modified biochar. Environ. Pollut. 2022, 301, 119032. [Google Scholar] [CrossRef]
- Polat, S.; Sayan, P. Effects of tricarballylic acid on phase transformation of calcium sulfate hemihydrate to the dihydrate form. Cryst. Res. Technol. 2017, 52, 1600395. [Google Scholar] [CrossRef]
- Polat, S.; Sayan, P. Characterization and Kinetics of Calcium Sulfate Dihydrate Crystallization in the Presence of Trimesic Acid. Asia-Pacific J. Chem. Eng. 2017, 12, 391–399. [Google Scholar] [CrossRef]
- Wan, D.; Liu, Y.; Xiao, S.; Chen, J.; Zhang, J. Uptake fluoride from water by caclined Mg-Al-CO3 hydrotalcite: Mg/Al ratio effect on its structure, electrical affinity and adsorptive property. Colloids Surf. A Physicochem. Eng. Asp. 2015, 469, 307–314. [Google Scholar] [CrossRef]
- Ma, W.; Chen, Y.; Zhang, W.; Zhao, W. Performance and mechanism of Mg-Ca-Fe hydrotalcite-like compounds for fluoride removal from aqueous solution. J. Fluor. Chem. 2017, 200, 153–161. [Google Scholar] [CrossRef]
- Sundaram, C.S.; Viswanathan, N.; Meenakshi, S. Defluoridation of water using magnesia/chitosan composite. J. Hazard. Mater. 2009, 163, 618–624. [Google Scholar] [CrossRef] [PubMed]
- Kang, J.; Li, B.; Song, J.; Li, D.; Yang, J.; Zhan, W.; Liu, D. Defluoridation of water using calcined magnesia/pullulan composite. Chem. Eng. J. 2011, 166, 765–771. [Google Scholar] [CrossRef]
- Hettithanthri, O.; Rajapaksha, A.U.; Nanayakkara, N.; Vithanage, M. Temperature influence on layered double hydroxide tailored corncob biochar and its application for fluoride removal in aqueous media. Environ. Pollut. 2023, 320, 121054. [Google Scholar] [CrossRef]
- Shao, S.; Ma, B.; Chen, Y.; Zhang, W.; Wang, C. Behavior and mechanism of fluoride removal from aqueous solutions by using synthesized CaSO4·2H2O nanorods. Chem. Eng. J. 2021, 426, 131364. [Google Scholar] [CrossRef]
- Tie, J.; Sang, S.; Shang, Z.; Li, Y.; Xu, Z.; Lian, M.; Du, C. Preparation of Al-loaded magnetic Chinese medicine residue-derived biochar and application of it in fluoride removal. Ind. Crops Prod. 2022, 184, 115037. [Google Scholar] [CrossRef]
- Han, W.; Hao, H.; Zhang, Q.; Shao, Z. Activated biochar loaded CuAl-layered double hydroxide composite for the removal of aniline aerofloat in wastewater: Synthesis, characterization, and adsorption mechanism. J. Environ. Chem. Eng. 2023, 11, 109293. [Google Scholar] [CrossRef]
- Xu, H.; Zhu, S.; Xia, M.; Wang, F.; Ju, X. Three-dimension hierarchical composite via in-situ growth of Zn/Al layered double hydroxide plates onto polyaniline-wrapped carbon sphere for efficient naproxen removal. J. Hazard. Mater. 2022, 423, 127192. [Google Scholar] [CrossRef]
- Cao, Q.; An, T.; Xie, J.; Liu, Y.; Xing, L.; Ling, X.; Chen, C. Insight to the physiochemical properties and DOM of biochar under different pyrolysis temperature and modification conditions. J. Anal. Appl. Pyrolysis 2022, 166, 105590. [Google Scholar] [CrossRef]
- Muhammad, N.; Ge, L.; Chan, W.P.; Khan, A.; Nafees, M.; Lisak, G. Impacts of pyrolysis temperatures on physicochemical and structural properties of green waste derived biochars for adsorption of potentially toxic elements. J. Environ. Manag. 2022, 317, 115385. [Google Scholar] [CrossRef] [PubMed]
- Araga, R.; Soni, S.; Sharma, C.S. Fluoride adsorption from aqueous solution using activated carbon obtained from KOH-treated jamun (Syzygium cumini) seed. J. Environ. Chem. Eng. 2017, 5, 5608–5616. [Google Scholar] [CrossRef]
- Raghav, S.; Kumar, D. Fabrication of aluminium and iron impregnated pectin biopolymeric material for effective utilization of fluoride adsorption studies. Groundw. Sustain. Dev. 2019, 9, 100233. [Google Scholar] [CrossRef]
- Pongener, C.; Bhomick, P.C.; Supong, A.; Baruah, M.; Sinha, U.B.; Sinha, D. Adsorption of fluoride onto activated carbon synthesized from Manihot esculenta biomass—Equilibrium, kinetic and thermodynamic studies. J. Environ. Chem. Eng. 2018, 6, 2382–2389. [Google Scholar] [CrossRef]
- Ren, Y.; Tong, J.; Qu, G.; Ning, P.; Ren, N.; Zhang, C.; Wu, F.; Yang, Y.; Chen, X.; Wang, Z.; et al. Preparation of fluoride adsorbent by resource utilization of carbide slag from industrial waste. J. Environ. Chem. Eng. 2022, 10, 108632. [Google Scholar] [CrossRef]
- Dzieniszewska, A.; Nowicki, J.; Rzepa, G.; Kyziol-Komosinska, J.; Semeniuk, I.; Kiełkiewicz, D.; Czupioł, J. Adsorptive removal of fluoride using ionic liquid-functionalized chitosan–Equilibrium and mechanism studies. Int. J. Biol. Macromol. 2022, 210, 483–493. [Google Scholar] [CrossRef]
- Liu, M.; Zang, Z.; Zhang, S.; Ouyang, G.; Han, R. Enhanced fluoride adsorption from aqueous solution by zirconium (IV)-impregnated magnetic chitosan graphene oxide. Int. J. Biol. Macromol. 2021, 182, 1759–1768. [Google Scholar] [CrossRef]
- Kumar, H.; Patel, M.; Mohan, D. Simplified Batch and Fixed-Bed Design System for Efficient and Sustainable Fluoride Removal from Water Using Slow Pyrolyzed Okra Stem and Black Gram Straw Biochars. ACS Omega 2019, 4, 19513–19525. [Google Scholar] [CrossRef]
- Stumm, W.; Morgan, J.J. Aquatic Chemistry, 3rd ed.; John Wiley & Sons, Inc.: Hoboken, NJ, USA, 1996; pp. 533–549. [Google Scholar]
- Tang, Y.; Guan, X.; Wang, J.; Gao, N.; McPhail, M.R.; Chusuei, C.C. Fluoride adsorption onto granular ferric hydroxide: Effects of ionic strength, pH, surface loading, and major co-existing anions. J. Hazard. Mater. 2009, 171, 774–779. [Google Scholar] [CrossRef]
- Huang, L.; Yang, Z.; He, Y.; Chai, L.; Yang, W.; Deng, H.; Wang, H.; Chen, Y.; Crittenden, J. Adsorption mechanism for removing different species of fluoride by designing of core-shell boehmite. J. Hazard. Mater. 2020, 394, 122555. [Google Scholar] [CrossRef] [PubMed]
- Huang, Y.-H.; Shih, Y.-J.; Chang, C.-C. Adsorption of fluoride by waste iron oxide: The effects of solution pH, major coexisting anions, and adsorbent calcination temperature. J. Hazard. Mater. 2011, 186, 1355–1359. [Google Scholar] [CrossRef] [PubMed]
- Ruíz-Baltazar, D.J.; Reyes-López, S.Y.; Antuñano, M.A.Z.; Pérez, R. Application of modified silicates with gold nanoparticles on environmental remediation: Study of non-linear kinetic adsorption models focused on heavy metals. Inorg. Chem. Commun. 2022, 144, 109899. [Google Scholar] [CrossRef]
- Raghav, S.; Kumar, D. Comparative kinetics and thermodynamic studies of fluoride adsorption by two novel synthesized biopolymer composites. Carbohydr. Polym. 2018, 203, 430–440. [Google Scholar] [CrossRef] [PubMed]
- Ozcelik, G.; Cavusoglu, F.C.; Ozkara-Aydinoglu, S.; Bayazit, S.S. Enhanced & effective phosphate recovery from water by indium fumarate & zirconium fumarate metal-organic frameworks: Synthesis, characterization, adsorption, kinetic and isotherm studies. Surf. Interfaces 2022, 29, 101719. [Google Scholar] [CrossRef]
- Petrović, J.; Ercegović, M.; Simić, M.; Kalderis, D.; Koprivica, M.; Milojković, J.; Radulović, D. Novel Mg-doped pyro-hydrochars as methylene blue adsorbents: Adsorption behavior and mechanism. J. Mol. Liq. 2023, 376, 121424. [Google Scholar] [CrossRef]
- Jeyaseelan, A.; Katubi, K.M.M.; Alsaiari, N.S.; Naushad, M.; Viswanathan, N. Design and fabrication of sulfonic acid functionalized graphene oxide for enriched fluoride adsorption. Diam. Relat. Mater. 2021, 117, 108446. [Google Scholar] [CrossRef]
- Mohanta, D.; Ahmaruzzaman, M. Bio-inspired adsorption of arsenite and fluoride from aqueous solutions using activated carbon@SnO2 nanocomposites: Isotherms, kinetics, thermodynamics, cost estimation and regeneration studies. J. Environ. Chem. Eng. 2018, 6, 356–366. [Google Scholar] [CrossRef]
- Sathish, R.S.; Sairam, S.; Raja, V.G.; Rao, G.N.; Janardhana, C. Defluoridation of Water Using Zirconium Impregnated Coconut Fiber Carbon. Sep. Sci. Technol. 2008, 43, 3676–3694. [Google Scholar] [CrossRef]
- Balarak, D.; Mahdavi, Y.; Bazrafshan, E.; Mahvi, A.H.; Esfandyari, Y. Adsorption of fluoride from aqueous solutions by carbon nanotubes: Determination of equilibrium, kinetic, and thermodynamic parameters. Fluoride 2016, 49, 71–83. [Google Scholar]
- Dehghani, M.H.; Gholami, S.; Karri, R.R.; Lima, E.C.; Mahvi, A.H.; Nazmara, S.; Fazlzadeh, M. Process modeling, characterization, optimization, and mechanisms of fluoride adsorption using magnetic agro-based adsorbent. J. Environ. Manag. 2021, 286, 112173. [Google Scholar] [CrossRef] [PubMed]
- Lee, J.-I.; Kang, J.-K.; Hong, S.-H.; Lee, C.-G.; Jeong, S.; Park, S.-J. Thermally treated Mytilus coruscus shells for fluoride removal and their adsorption mechanism. Chemosphere 2021, 263, 128328. [Google Scholar] [CrossRef]
- Jiang, H.; Li, X.; Tian, L.; Wang, T.; Wang, Q.; Niu, P.; Chen, P.; Luo, X. Defluoridation investigation of Yttrium by laminated Y-Zr-Al tri-metal nanocomposite and analysis of the fluoride sorption mechanism. Sci. Total Environ. 2019, 648, 1342–1353. [Google Scholar] [CrossRef] [PubMed]
- Yang, K.; Li, Y.; Tian, Z.; Peng, K.; Lai, Y. Removal of fluoride ions from ZnSO4 electrolyte by amorphous porous Al2O3 microfiber clusters: Adsorption performance and mechanism. Hydrometallurgy 2020, 197, 105455. [Google Scholar] [CrossRef]
- Zhou, N.; Guo, X.; Ye, C.; Yan, L.; Gu, W.; Wu, X.; Zhou, Q.; Yang, Y.; Wang, X.; Cheng, Q. Enhanced fluoride removal from drinking water in wide pH range using La/Fe/Al oxides loaded rice straw biochar. Water Supply 2022, 22, 779–794. [Google Scholar] [CrossRef]
- Mobarak, M.; Selim, A.Q.; Mohamed, E.A.; Seliem, M.K. Modification of organic matter-rich clay by a solution of cationic surfactant/H2O2: A new product for fluoride adsorption from solutions. J. Clean. Prod. 2018, 192, 712–721. [Google Scholar] [CrossRef]
- Chen, Y.; Chen, Q.; Kasomo, R.M.; Jin, Y.; Yang, P.; Zheng, H.; Weng, X.; Li, H.; Song, S. Adsorption of fluoride from aqueous solutions using graphene oxide composite materials at a neutral pH. J. Mol. Liq. 2023, 377, 121467. [Google Scholar] [CrossRef]
- Taneja, L.; Raghav, S.; Kochar, C.; Yadav, P.K.; Tripathy, S.S. Effective remediation of fluoride from drinking water using cerium-silver oxide composite incorporated with reduced graphene oxide. J. Water Process. Eng. 2021, 44, 102369. [Google Scholar] [CrossRef]
- Wang, X.; Pfeiffer, H.; Wei, J.; Dan, J.; Wang, J.; Zhang, J. 3D porous Ca-modified Mg-Zr mixed metal oxide for fluoride adsorption. Chem. Eng. J. 2022, 428, 131371. [Google Scholar] [CrossRef]
- He, Y.; Zhang, L.; An, X.; Wan, G.; Zhu, W.; Luo, Y. Enhanced fluoride removal from water by rare earth (La and Ce) modified alumina: Adsorption isotherms, kinetics, thermodynamics and mechanism. Sci. Total Environ. 2019, 688, 184–198. [Google Scholar] [CrossRef]
- Maity, J.P.; Hsu, C.-M.; Lin, T.-J.; Lee, W.-C.; Bhattacharya, P.; Bundschuh, J.; Chen, C.-Y. Removal of fluoride from water through bacterial-surfactin mediated novel hydroxyapatite nanoparticle and its efficiency assessment: Adsorption isotherm, adsorption kinetic and adsorption Thermodynamics. Environ. Nanotechnol. Monit. Manag. 2018, 9, 18–28. [Google Scholar] [CrossRef]
- Sahu, S.; Yadav, M.K.; Gupta, A.K.; Uddameri, V.; Toppo, A.N.; Maheedhar, B.; Ghosal, P.S. Modeling defluoridation of real-life groundwater by a green adsorbent aluminum/olivine composite: Isotherm, kinetics, thermodynamics and novel framework based on artificial neural network and support vector machine. J. Environ. Manag. 2022, 302, 113965. [Google Scholar] [CrossRef] [PubMed]
- Ye, X.; Wu, L.; Zhu, M.; Wang, Z.; Huang, Z.-H.; Wang, M.-X. Lotus pollen-derived hierarchically porous carbons with exceptional adsorption performance toward Reactive Black 5: Isotherms, kinetics and thermodynamics investigations. Sep. Purif. Technol. 2022, 300, 121899. [Google Scholar] [CrossRef]
- Barathi, M.; Kumar, A.S.K.; Rajesh, N. A novel ultrasonication method in the preparation of zirconium impregnated cellulose for effective fluoride adsorption. Ultrason. Sonochemistry 2014, 21, 1090–1099. [Google Scholar] [CrossRef] [PubMed]
- Gubbuk, I.H. Isotherms and thermodynamics for the sorption of heavy metal ions onto functionalized sporopollenin. J. Hazard. Mater. 2011, 186, 416–422. [Google Scholar] [CrossRef]
- Zhang, G.; Li, L.; Zhou, G.; Lin, Z.; Wang, J.; Wang, G.; Ling, F.; Liu, T. Recyclable aminophenylboronic acid modified bacterial cellulose microspheres for tetracycline removal: Kinetic, equilibrium and adsorption performance studies for hoggery sewer. Environ. Pollut. 2022, 307, 119544. [Google Scholar] [CrossRef]
- Kumar, A.S.K.; Kalidhasan, S.; Rajesh, V.; Rajesh, N. Application of Cellulose-Clay Composite Biosorbent toward the Effective Adsorption and Removal of Chromium from Industrial Wastewater. Ind. Eng. Chem. Res. 2012, 51, 58–69. [Google Scholar] [CrossRef]


| Samples | BET Surface Area (m2/g) | Total Pore Volume (cm3/g) | Average Pore Diameter (nm) |
|---|---|---|---|
| VS600 | 64.5 | 0.1487 | 9.22 |
| MVS600 | 71.3 | 0.1492 | 8.37 |
| C0 (mg/L) | Pseudo-First Order Model | ||||
|---|---|---|---|---|---|
| qe,exp (mg/g) | qe,cal (mg/g) | k1 (1/min) | R2 | SD | |
| 100 | 100.5 | 46.99 | 0.02154 | 0.9391 | 0.264 |
| 60 | 63.0 | 37.41 | 0.02222 | 0.9583 | 0.223 |
| 20 | 22.5 | 12.38 | 0.02347 | 0.9606 | 0.229 |
| Pseudo-Second Order Model | |||||
| qe,exp (mg/g) | qe,cal (mg/g) | k2 (g/mg·min) | R2 | SD | |
| 100 | 100.5 | 101.3 | 0.001929 | 0.9989 | 0.0192 |
| 60 | 63.0 | 63.86 | 0.002108 | 0.9967 | 0.0526 |
| 20 | 22.5 | 22.84 | 0.006834 | 0.9977 | 0.122 |
| Intraparticle Diffusion Model | |||||
| qe,exp (mg/g) | C (mg/g) | k3 (mg/g·min1/2) | R2 | SD | |
| 100 | 100.5 | 42.84 | 5.17 | 0.8510 | 9.01 |
| 60 | 63.0 | 21.28 | 3.635 | 0.8882 | 5.37 |
| 20 | 22.5 | 8.53 | 1.237 | 0.8643 | 2.04 |
| Elovich Model | |||||
| qe,exp (mg/g) | α (mg/(g·min)) | β (g/mg) | R2 | SD | |
| 100 | 100.5 | 150.9 | 0.07321 | 0.9862 | 2.74 |
| 60 | 63.0 | 44.76 | 0.1058 | 0.9963 | 0.973 |
| 20 | 22.5 | 21.96 | 0.3082 | 0.9867 | 0.638 |
| Isotherm Models | Parameters | Values (25 °C) | Values (35 °C) | Values (45 °C) |
|---|---|---|---|---|
| Langmuir | KL/(L/mg) | 0.01887 | 0.02678 | 0.04010 |
| qm/(mg/g) | 253.8 | 228.8 | 209.2 | |
| R2 | 0.9654 | 0.9419 | 0.9136 | |
| SD | 2.14 | 2.64 | 4.47 | |
| Freundich | KF ((mg/g) × (L/mg)1/n) | 6.482 | 8.276 | 11.79 |
| 1/n | 0.7829 | 0.7493 | 0.6844 | |
| R2 | 0.9988 | 0.9940 | 0.9980 | |
| SD | 1.26 | 3.14 | 2.11 | |
| Temkin | AT/(L/mg) | 39.91 | 40.15 | 38.66 |
| BT | 0.3091 | 0.3792 | 0.5371 | |
| R2 | 0.9598 | 0.9677 | 0.9366 | |
| SD | 6.14 | 5.73 | 8.55 | |
| Sips | qm | 290.9 | 321.9 | 353.5 |
| Ks | 0.015 | 0.014 | 0.016 | |
| ms | 0.9823 | 0.9002 | 0.8836 | |
| R2 | 0.9963 | 0.9937 | 0.9925 | |
| SD | 1.83 | 2.59 | 3.12 |
| Material | Qmax (mg/g) | Conditions | Reference |
|---|---|---|---|
| Zirconium impregnated carbon | 40.02 | W = 10 g/L, 4.0, 25 °C | [71] |
| SWCNTs | 63.2 | W = 0.6 g/L, pH = 6.0, T = 30 °C | [72] |
| GAC-Fe3O4 | 2.74 | W = 1 g/L, pH = 3.0, T = 25 °C | [73] |
| Mytilus coruscus shells | 82.93 | W = 3.33 g/L, pH = 7.0, T = 25 °C | [74] |
| Y-Zr-Al composite | 31.0 | W = 1 g/L, pH = 7.0, T = 25 °C | [75] |
| Al2O3 microfiber clusters | 14.96 | W = not mentioned, pH = 5.0, T = 40 °C | [76] |
| AC-Si-Mg-La | 54.83 | W = 0.2 g/L, pH = 5.0, T = 25 °C | [17] |
| La/Fe/Al loaded rice straw biochar | 111.11 | W = 1 g/L, pH = 7.0, T = 25 °C | [77] |
| DTAB/H2O2–clay | 53.66 | W = 2 g/L, pH = 2.0, T = 25 °C | [78] |
| HAO@GO | 129.23 | W = 0.05 g/L, pH = 7.0, T = 25 °C | [79] |
| rGO-Ce/Ag | 434.78 | W = not mentioned, pH = 7.0, T = 25 °C | [80] |
| Ca modified Mg-Zr MMOs | 370.37 | W = 0.5 g/L, pH = 7.0, T = 25 °C | [81] |
| MVS600 | 290.9 | W = 0.667 g/L, pH = 7.0, T = 25 °C | Present study |
| T (°C) | Kd | ΔG0 (kJ/mol) | ΔH0 (kJ/mol) | ΔS0 (J/(mol∙K)) |
|---|---|---|---|---|
| 25 | 6.482 | −4.633 | 23.53 | 94.29 |
| 35 | 8.276 | −5.414 | 23.53 | 94.29 |
| 45 | 11.79 | −6.526 | 23.53 | 94.29 |
Disclaimer/Publisher’s Note: The statements, opinions and data contained in all publications are solely those of the individual author(s) and contributor(s) and not of MDPI and/or the editor(s). MDPI and/or the editor(s) disclaim responsibility for any injury to people or property resulting from any ideas, methods, instructions or products referred to in the content. |
© 2023 by the authors. Licensee MDPI, Basel, Switzerland. This article is an open access article distributed under the terms and conditions of the Creative Commons Attribution (CC BY) license (https://creativecommons.org/licenses/by/4.0/).
Share and Cite
Liu, Z.; Zhang, J.; Mou, R. Phosphogypsum-Modified Vinasse Shell Biochar as a Novel Low-Cost Material for High-Efficiency Fluoride Removal. Molecules 2023, 28, 7617. https://doi.org/10.3390/molecules28227617
Liu Z, Zhang J, Mou R. Phosphogypsum-Modified Vinasse Shell Biochar as a Novel Low-Cost Material for High-Efficiency Fluoride Removal. Molecules. 2023; 28(22):7617. https://doi.org/10.3390/molecules28227617
Chicago/Turabian StyleLiu, Zheng, Jingmei Zhang, and Rongmei Mou. 2023. "Phosphogypsum-Modified Vinasse Shell Biochar as a Novel Low-Cost Material for High-Efficiency Fluoride Removal" Molecules 28, no. 22: 7617. https://doi.org/10.3390/molecules28227617
APA StyleLiu, Z., Zhang, J., & Mou, R. (2023). Phosphogypsum-Modified Vinasse Shell Biochar as a Novel Low-Cost Material for High-Efficiency Fluoride Removal. Molecules, 28(22), 7617. https://doi.org/10.3390/molecules28227617