Abstract
The weathering of ancient glass relics has long been a concerned. Therefore, a systematic and more comprehensive mathematical model with which to correctly judge the category of ancient glass products whose chemical composition changes due to weathering should be established. This paper systematically analyzes and studies the changes in the composition of ancient glass products as a result of weathering of. We first analyze the surface weathering of glass relics and its correlation with three properties and establish a multivariable time-series model to predict the chemical-composition content before weathering. Next, we use one-way analysis of variance for subclassification and, finally, we use a principal component analysis of the rationality, and change the significance level to determine its sensitivity, for the reasonable prediction of the chemical-composition content and classification to provide a theoretical basis for improving the model. This allows the model to provide reference values, which can be used in the protection of cultural relics, historical research, and other fields.
1. Introduction
Glass is precious material evidence of the trade between the Early Silk Road and the West. Cultural relics are the cultural heritage of a nation and the cultural carriers of civilization and the national spirit. Ancient glass is strongly subject to the influence of buried environments and weathering. Glass weathering is generally related to glass composition, glass surface chemicals, the environmental atmosphere of glass products, and other factors. During the process of weathering, there is a high degree of exchange between the internal elements and the environmental elements. In addition, the composition proportion changes. These changes affect the correct judgment of the category of weathered glass objects; the color and decoration on the surfaces of cultural relics surface cannot be used as the basis for judging their weathering, a large area of weathered cultural relics may still have unweathered areas. After the weathering of glass cultural relics, the differences between the chemical elements in different categories of cultural relics also have a certain relevance. With the development of society and the progress of science and technology, glass weathering, as a traditional topic, also urgently requires more rigorous and accurate methods of study. In this regard, the use of the quantitative analysis and type identification of the chemical composition is a good approach to the study of the weathering of glass cultural relics [1,2,3].
Gan Fuxi et al. combined X-ray fluorescence analysis, X-ray diffraction and laser Raman spectral analysis [4,5]. Li Qing-hui et al. studied the similarities and differences between flux, K2O-CaO-SiO2, PbO-BaO-SiO2 system glass, glass sand, and the Western Zhou, spring, and autumn [6,7]. Liu Song et al. discussed the application of a portable energy-dispersive X-ray fluorescence spectrometer to the analysis of the chemical composition of glass in ancient China [8,9,10].
Based on the related research on the chemical composition of glass, due to the disadvantages of the lack of an authoritative chemical-composition index, the research of domestic and foreign scholars is still limited. Most scholars analyze a small number of elements using qualitative methods or tools, with relatively little substantive research. This paper aims to organize the data of various chemical compositions and predict their content; unlike the work of other scholars, this paper focuses on the chemical composition of glass relics [11,12].
Through mathematical modeling, the classification and quantitative analysis of the known data on ancient glass relics, provide accurate results. Combined with the theoretical speed of chemical substances, this offers a theoretical basis for the reasonable prediction of chemical contents and the classification of cultural relics. In terms of the protection of cultural relics, we enrich the understanding of the preservation status quo and weathering mechanism, which provides a scientific basis for the protection-and-restoration scheme. Thus research expands the study of glass cultural relics and, at the same time, it has special significance in field operation, archaeological sites and cultural protection. (1) In this paper, various elements are incorporated into the same analytical framework and combined with the theoretical speed change of various chemical elements to systematically analyze the change trends of various elements, so as to supplement the domestic theoretical research on the changes in the chemical elements of glass relics and provide theoretical support for the research on the protection and restoration of glass relics. (2) From an empirical perspective, this paper uses the time-series model to predict the composition of various chemical elements, clusters the glass relics based on their characteristics, and provides relevant policy suggestions, so as to provide reference values for archaeological sites in China [13,14,15].
2. Data Sources and Basic Assumptions
The data are all from question C of the 2022 National College Students Mathematical Modeling Competition. To facilitate the research problem, the following assumptions are made [16]:
- (1)
- Environmental assumption: the glass is weathered under natural conditions, without special treatment, such as high temperatures;
- (2)
- Reasonability hypothesis: the changes between each element influence each other;
- (3)
- Unity assumption: overall unweathered, partial unweathered, overall weathered, local unweathered; overall weathering, local weathering, overall weathering, local severe weathering of the four stages of the same time;
- (4)
- Substantial assumptions: even at the beginning of the overall unweathered, local unweathered stage, weathering has begun;
- (5)
- Exclusivity assumption: all cultural relics are unaffected by their ornamentation, type and color, and the content of their chemical composition before weathering is a standard fixed value [17,18].
3. Data Pre-Processing and Visualization
3.1. Missing Data
Based on data, four values are missing from data “color” column: 19, 40, 48, 58. The common characteristic of four cultural relics was that surfaces were weathered. We speculated that the cause of cultural relics’ surface-weathering level is that their color cannot be observed. To support subsequent data processing, we used the four-color missing value as a reasonable supplement [19,20,21]
3.2. Data Preprocessing
According to the requirements, component proportions between 85% and 105% are regarded as effective data; the component proportions of the 15 and 17 sampling sites were 79.47% and 71.89%, respectively. Therefore, we deleted the data of the 15 and 17 sampling sites. Finally, the valid value obtained was 58.
3.3. Data Visualization
According to the existing data, the relevant information about the types, colors, patterns and weathering of different cultural relics was collected, and the types, colors and patterns were labeled as first-level characteristics, so that the data could be clearly displayed.
We used the chi-square test to analyze the correlation between the surface weathering of cultural relics and their characteristics. First, the hypothesis was true, and the value was calculated based on this premise, which represented the degree of deviation between the observed value and the theoretical value. According to the distribution and degree of freedom, the probability P of obtaining the current statistics and more extreme cases can be determined if the assumption holds. If the p-value is small, indicating that the deviation from the observed value is too large, the invalid hypothesis should be rejected to indicate significant differences between the comparative data; otherwise, the invalid hypothesis cannot be rejected, and the actual situation and the theoretical hypothesis represented by the sample cannot be considered.
In Table 1 and Table 2, it is possible to observe the relationship between the surface weathering of cultural relics and their characteristics. With a confidence interval of 95%, the p-value of decoration is 0.08, and the original hypothesis should be rejected; the p-value of type is 0.01, the original hypothesis should be rejected. If the p value of color is 0.42, the original hypothesis cannot be rejected; therefore, the weathering and glass types are significant, and the correlation with the decoration and color is not significant [22].

Table 1.
List of cultural relics.

Table 2.
Chi-square test.
4. Predictions of Unweathered-Glass Chemistry Based on a Multivariate Time Series
4.1. Research Ideas
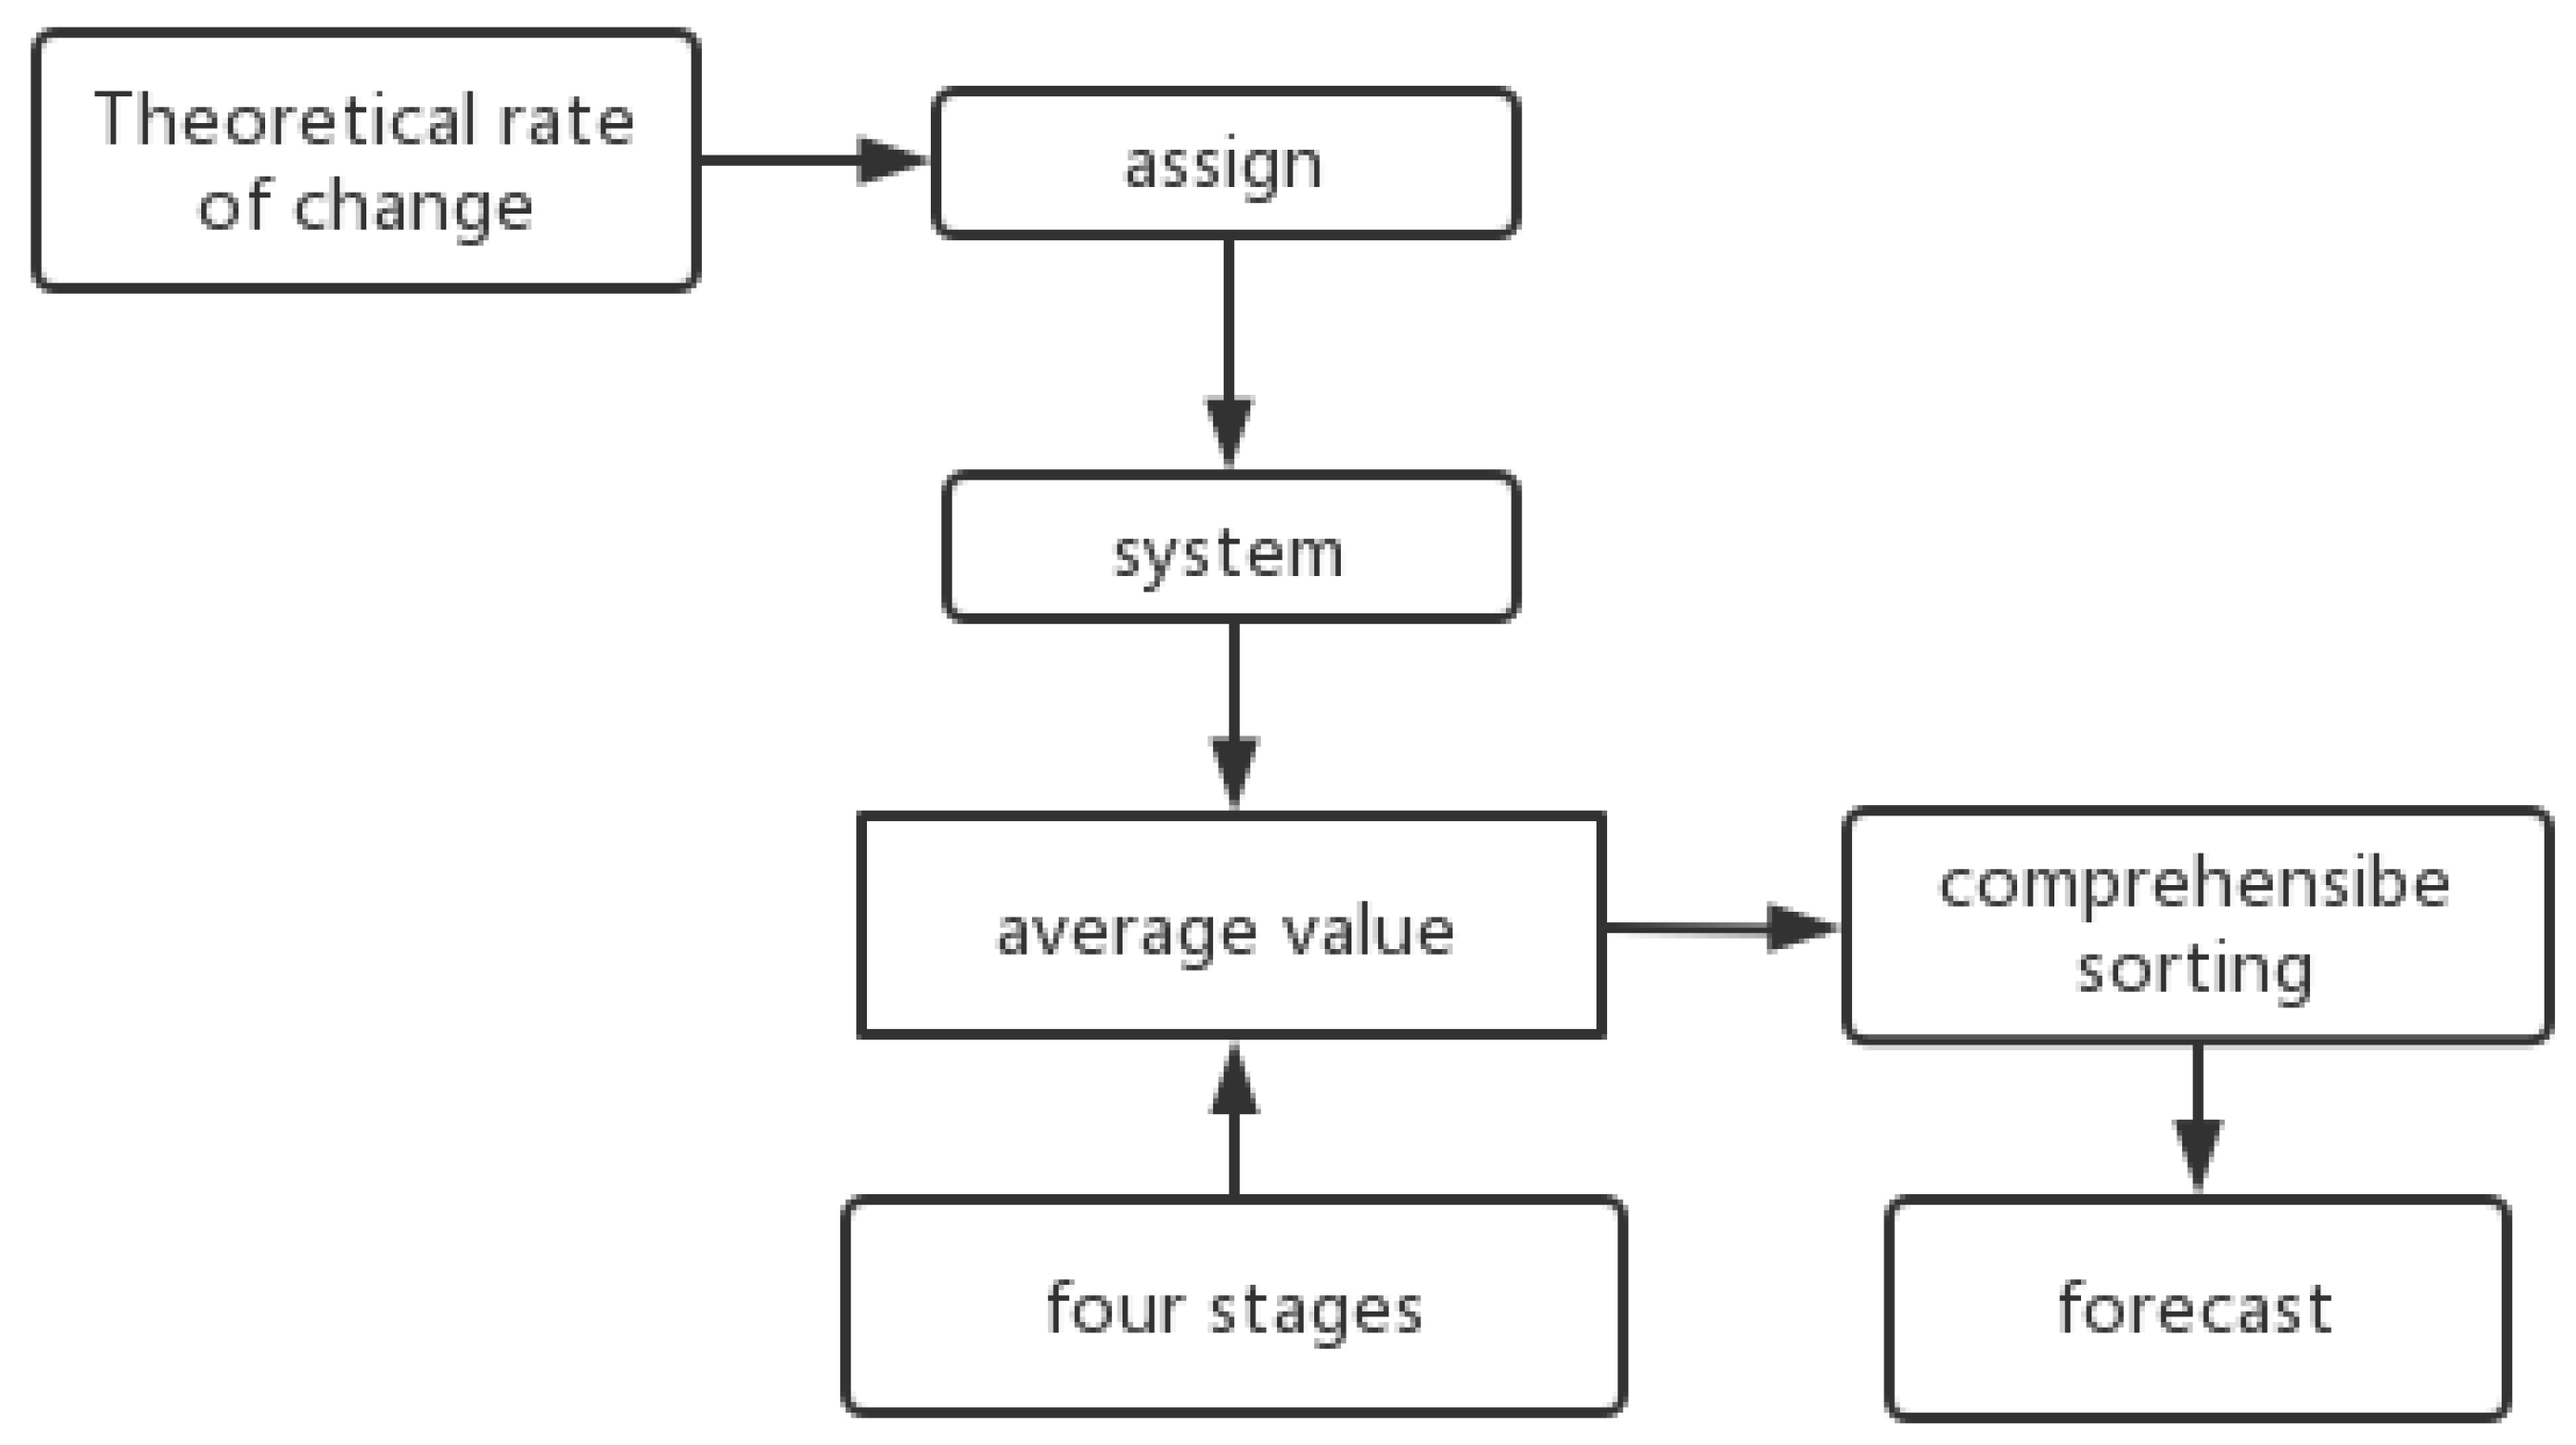
Based on the data presented in this paper, the surface weathering of the ancient glass cultural relics was divided into four stages: no surface weathering, local unweathered; surface weathering, local unweathered; surface weathering, local weathering; and surface weathering, severe local weathering. Secondly, each of the four stages was applied and the mean value was calculated to represent the criteria of each stage. On the premise of searching for relevant information as a theoretical support, combined with the theoretical rate of change of the chemical material, values to were assigned to each element. The composite score was calculated by multiplying the value coefficient of each element (the element-ratio weight of each glass type) by the mean and ranking it. According to the analysis, the lower the score, the greater the weathering degree. A total of 56 samples were processed in turn. The relationship analysis of the four-stage mean gave the initial value. This completed the multivariate time-series prediction. The specific process is shown in Figure 1.
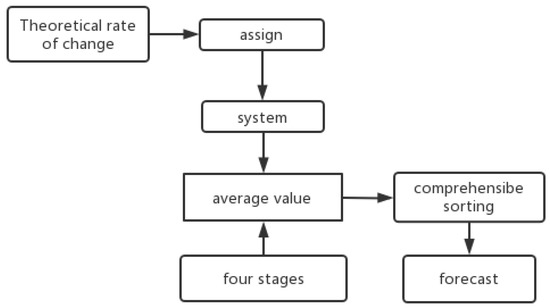
Figure 1.
Process flow chart.
4.2. Research Process
4.2.1. Preparation of the Model
First, based on the characteristics of the data weathering (Supplementary Materials), we divided the types of cultural relics into the following four stages: overall unweathering, local unweathering, overall weathering, local unweathering, overall weathering, local weathering, overall weathering, and local severe weathering.
Next, we performed a further analysis of the four stages. By referring to the literature, we determined that in glass products, after weathering, compounds composed of Si and Na elements can change significantly. For the group of elements comprising K, Ca, Al, and Pb, the content of the resultant compounds changes somewhat after weathering. We assigned the weights according to the proportion of changes in each element’s content after the weathering of glass product, according to the literature. Furthermore, according to the known literature, Si, Na, K, Ca, Pb, and Al are important variables in changes caused by glass weathering, and serve as weights according to the proportional changes before and after weathering in various types of chemical elements. In order to make full use of the form data, we weighted the remaining elements of the 14 chemical components. The final resulting weight ratios of the 14 chemical components are shown in Table 3 [23,24,25].

Table 3.
Weight ratios of 14 chemical components.
4.2.2. Process of the Model
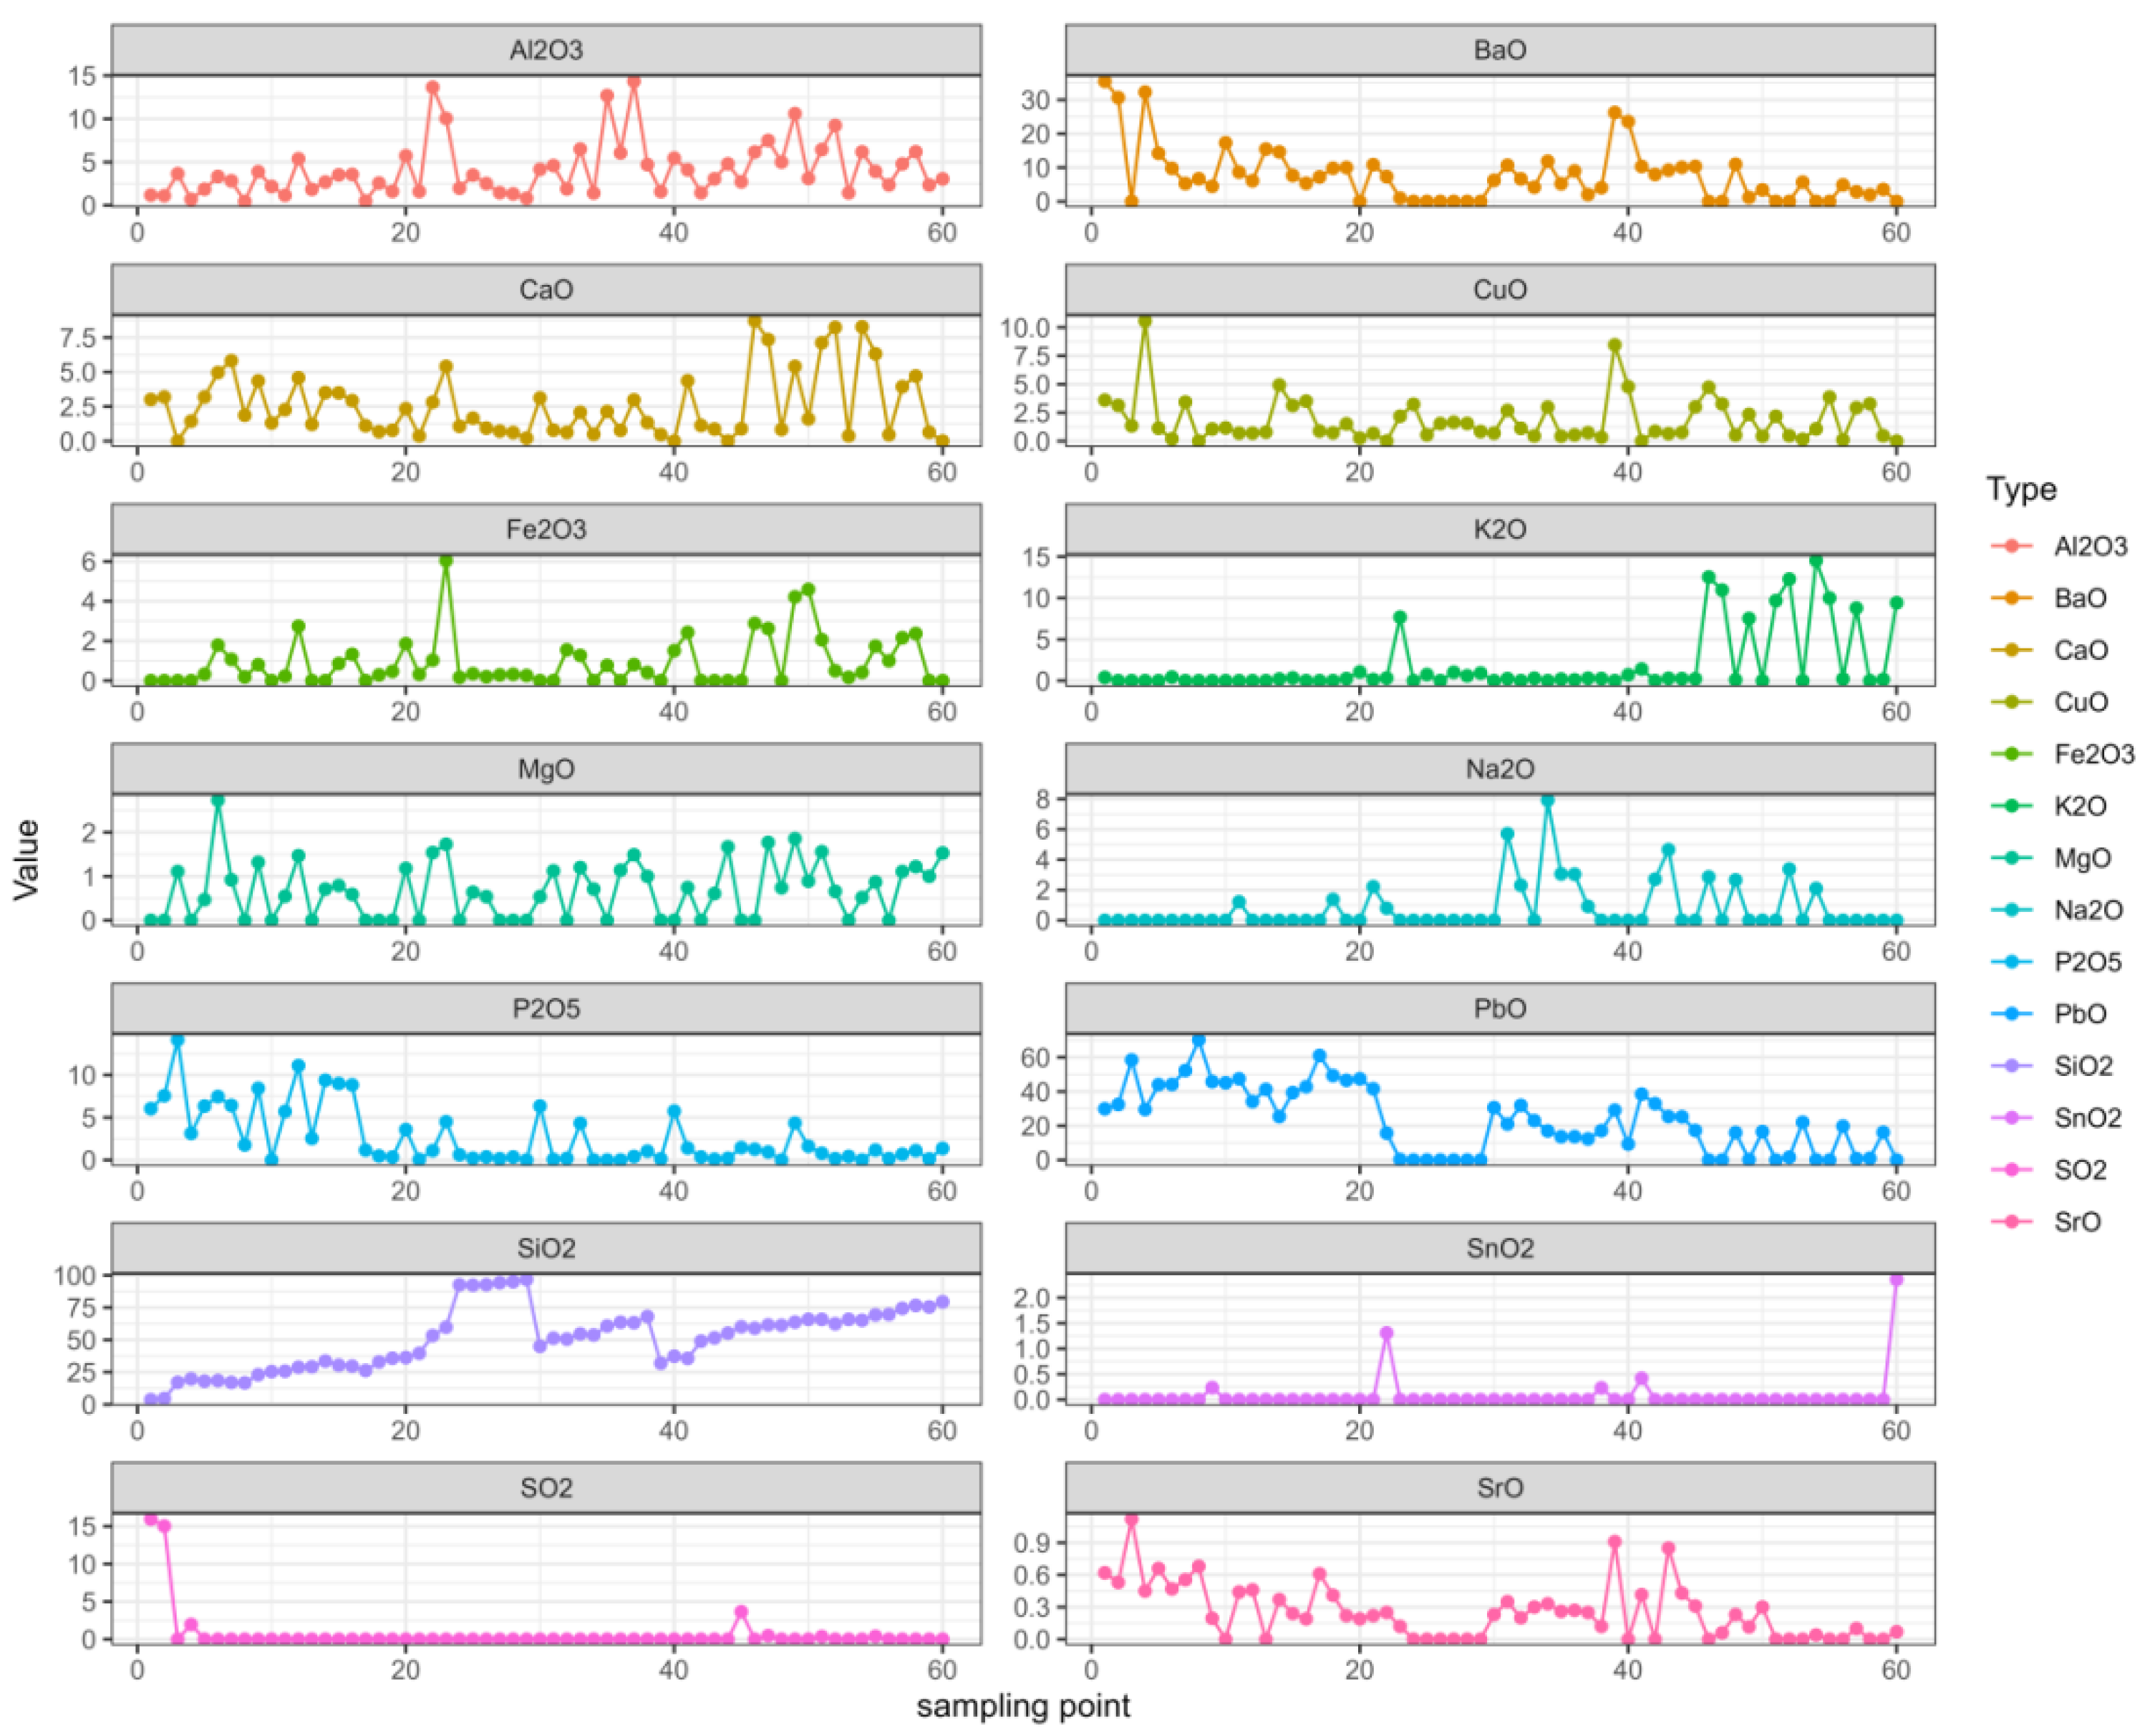
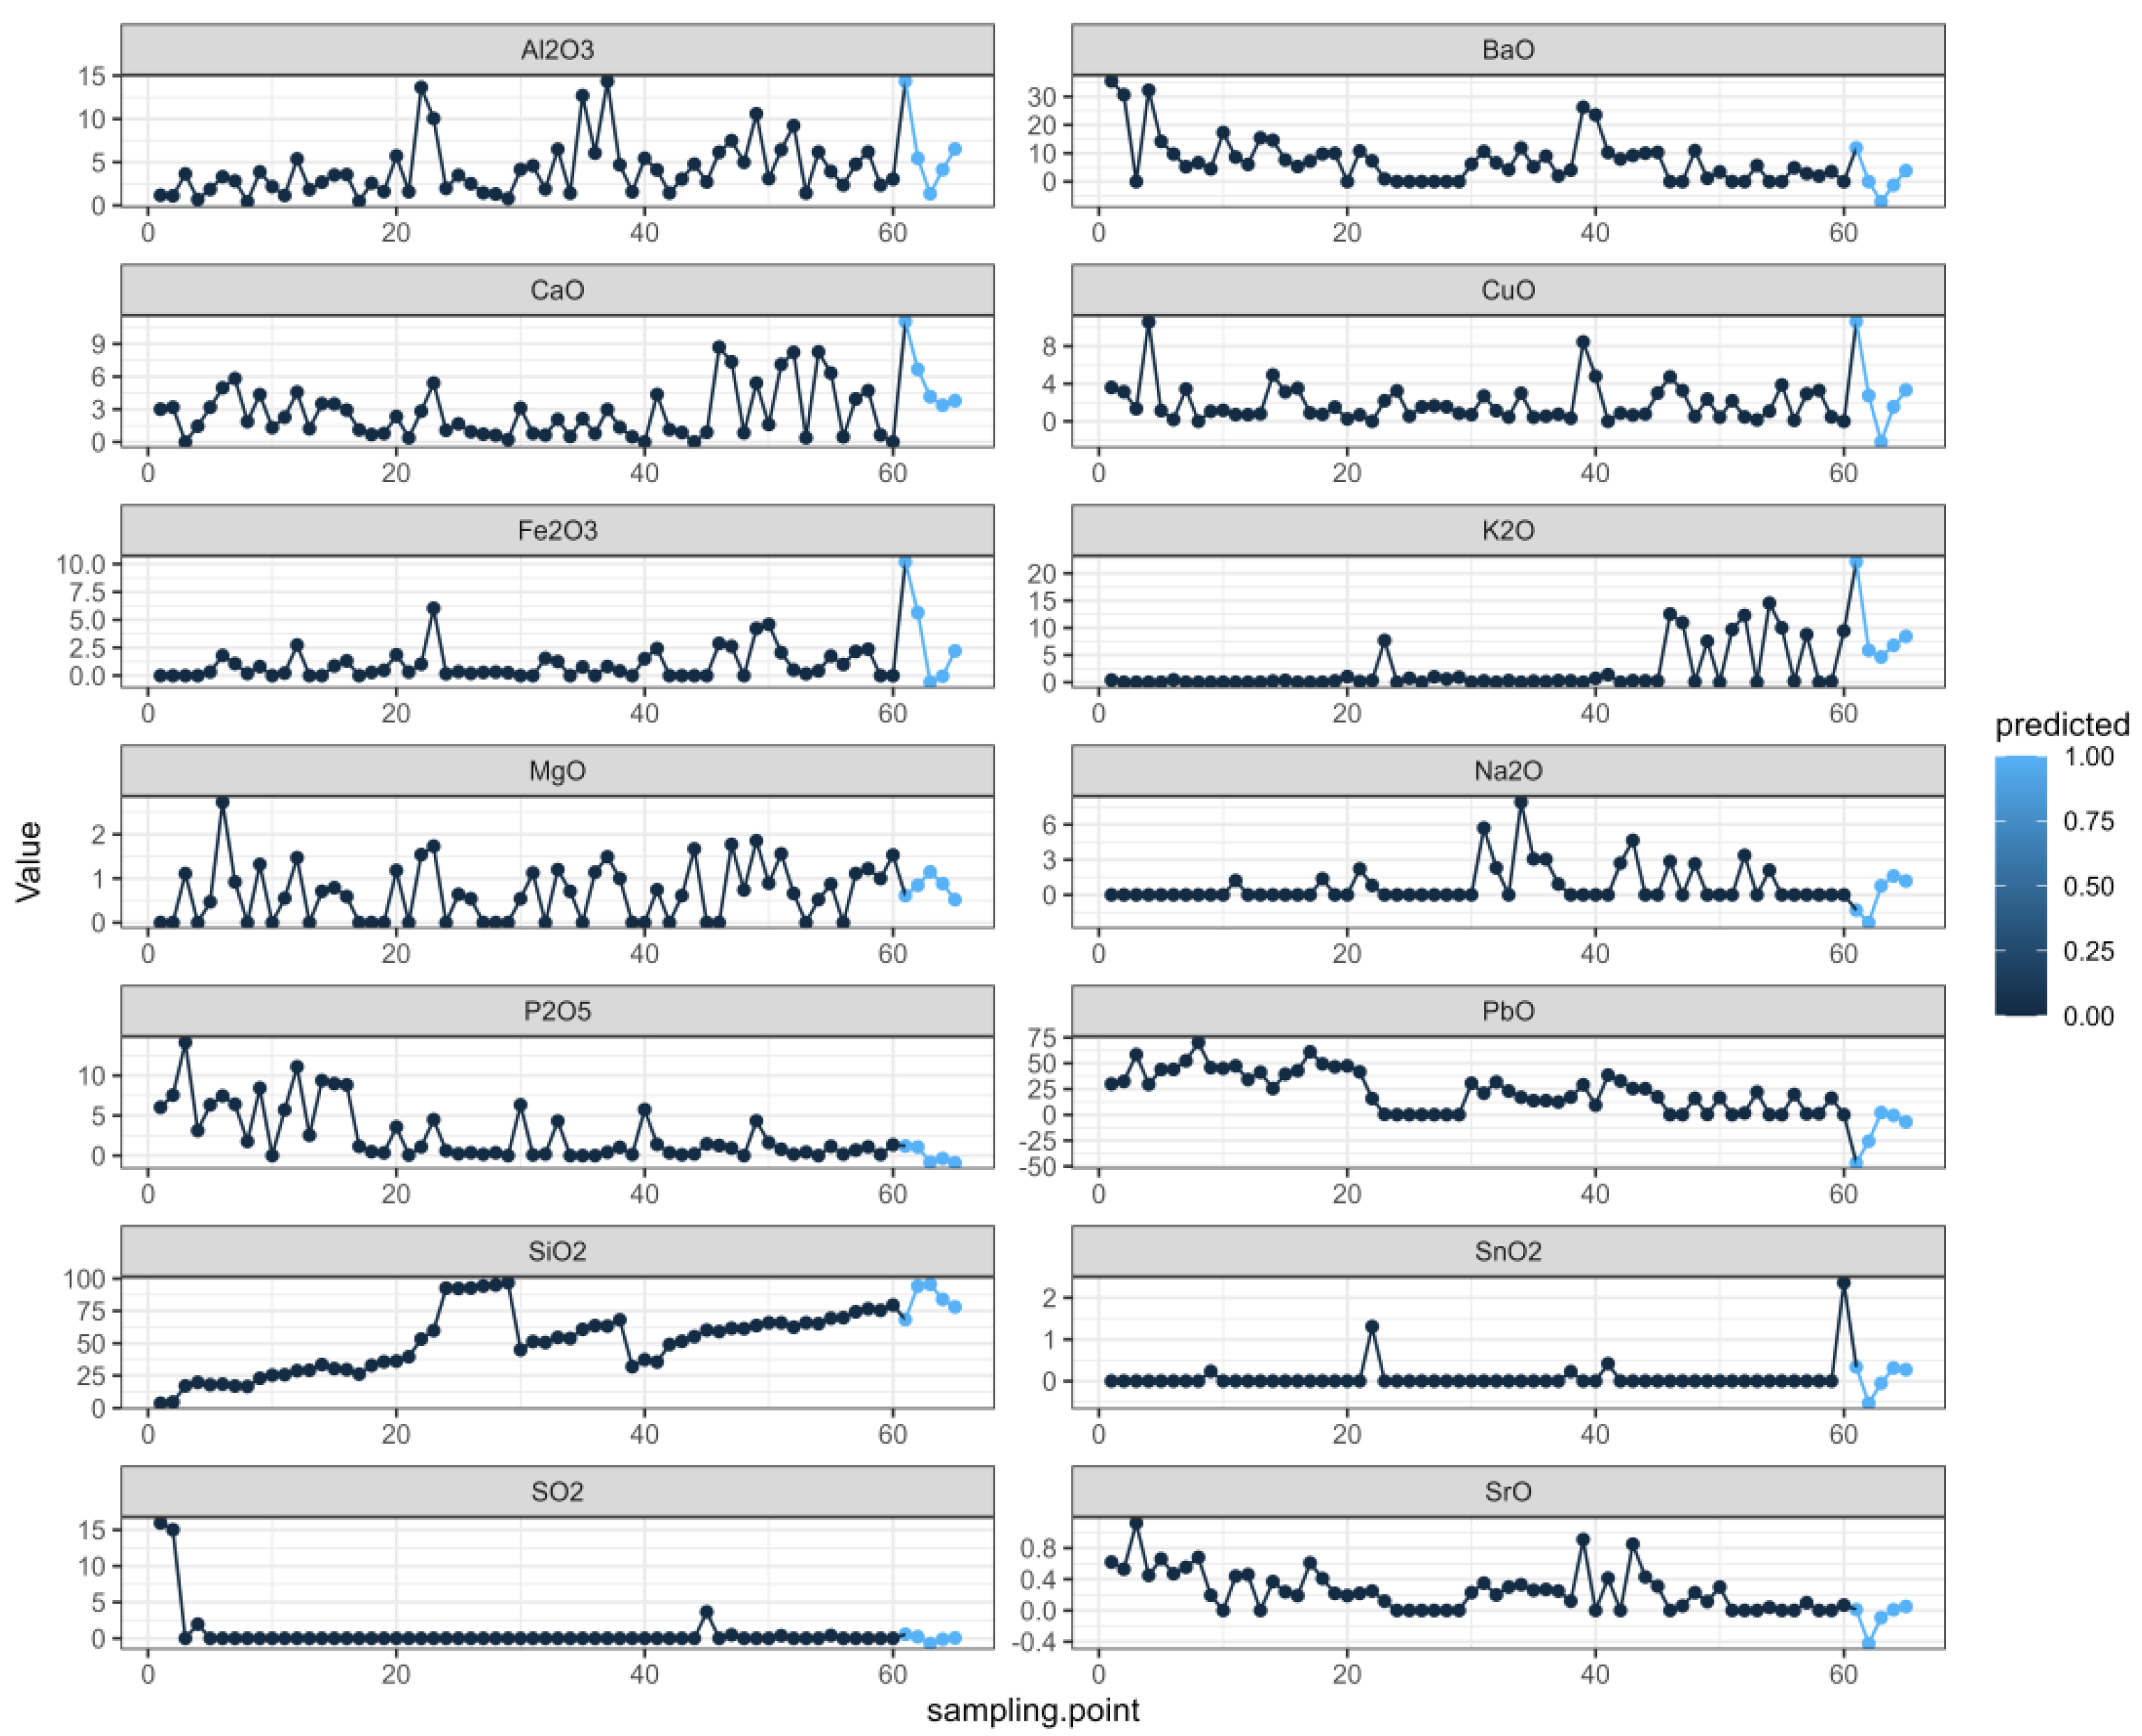
We organized the data and analyzed the data related to the time series with R, which can not only describe patterns in historical data over time, but can also be used for some studies and predictions. A multivariate autoregressive model was fitted using the VAR ( ) function in the multivariate autoregressive library “vars” in the R language. First, the image of each variable changed with the sampling point of the relic, as shown in Figure 2.
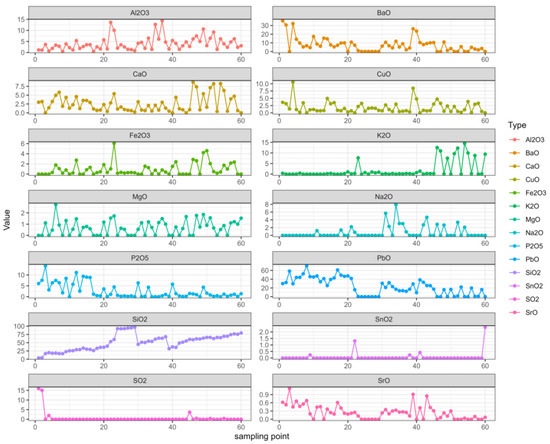
Figure 2.
Changes in each variable.
In the figure, it can be seen that the changes in SiO2 were relatively regular, the SnO2 and SO2 changes were relatively stable, while the K2O and Na2O changes were relatively stable in the early stage but fluctuated greatly in the later stage. The other elements constantly floated.
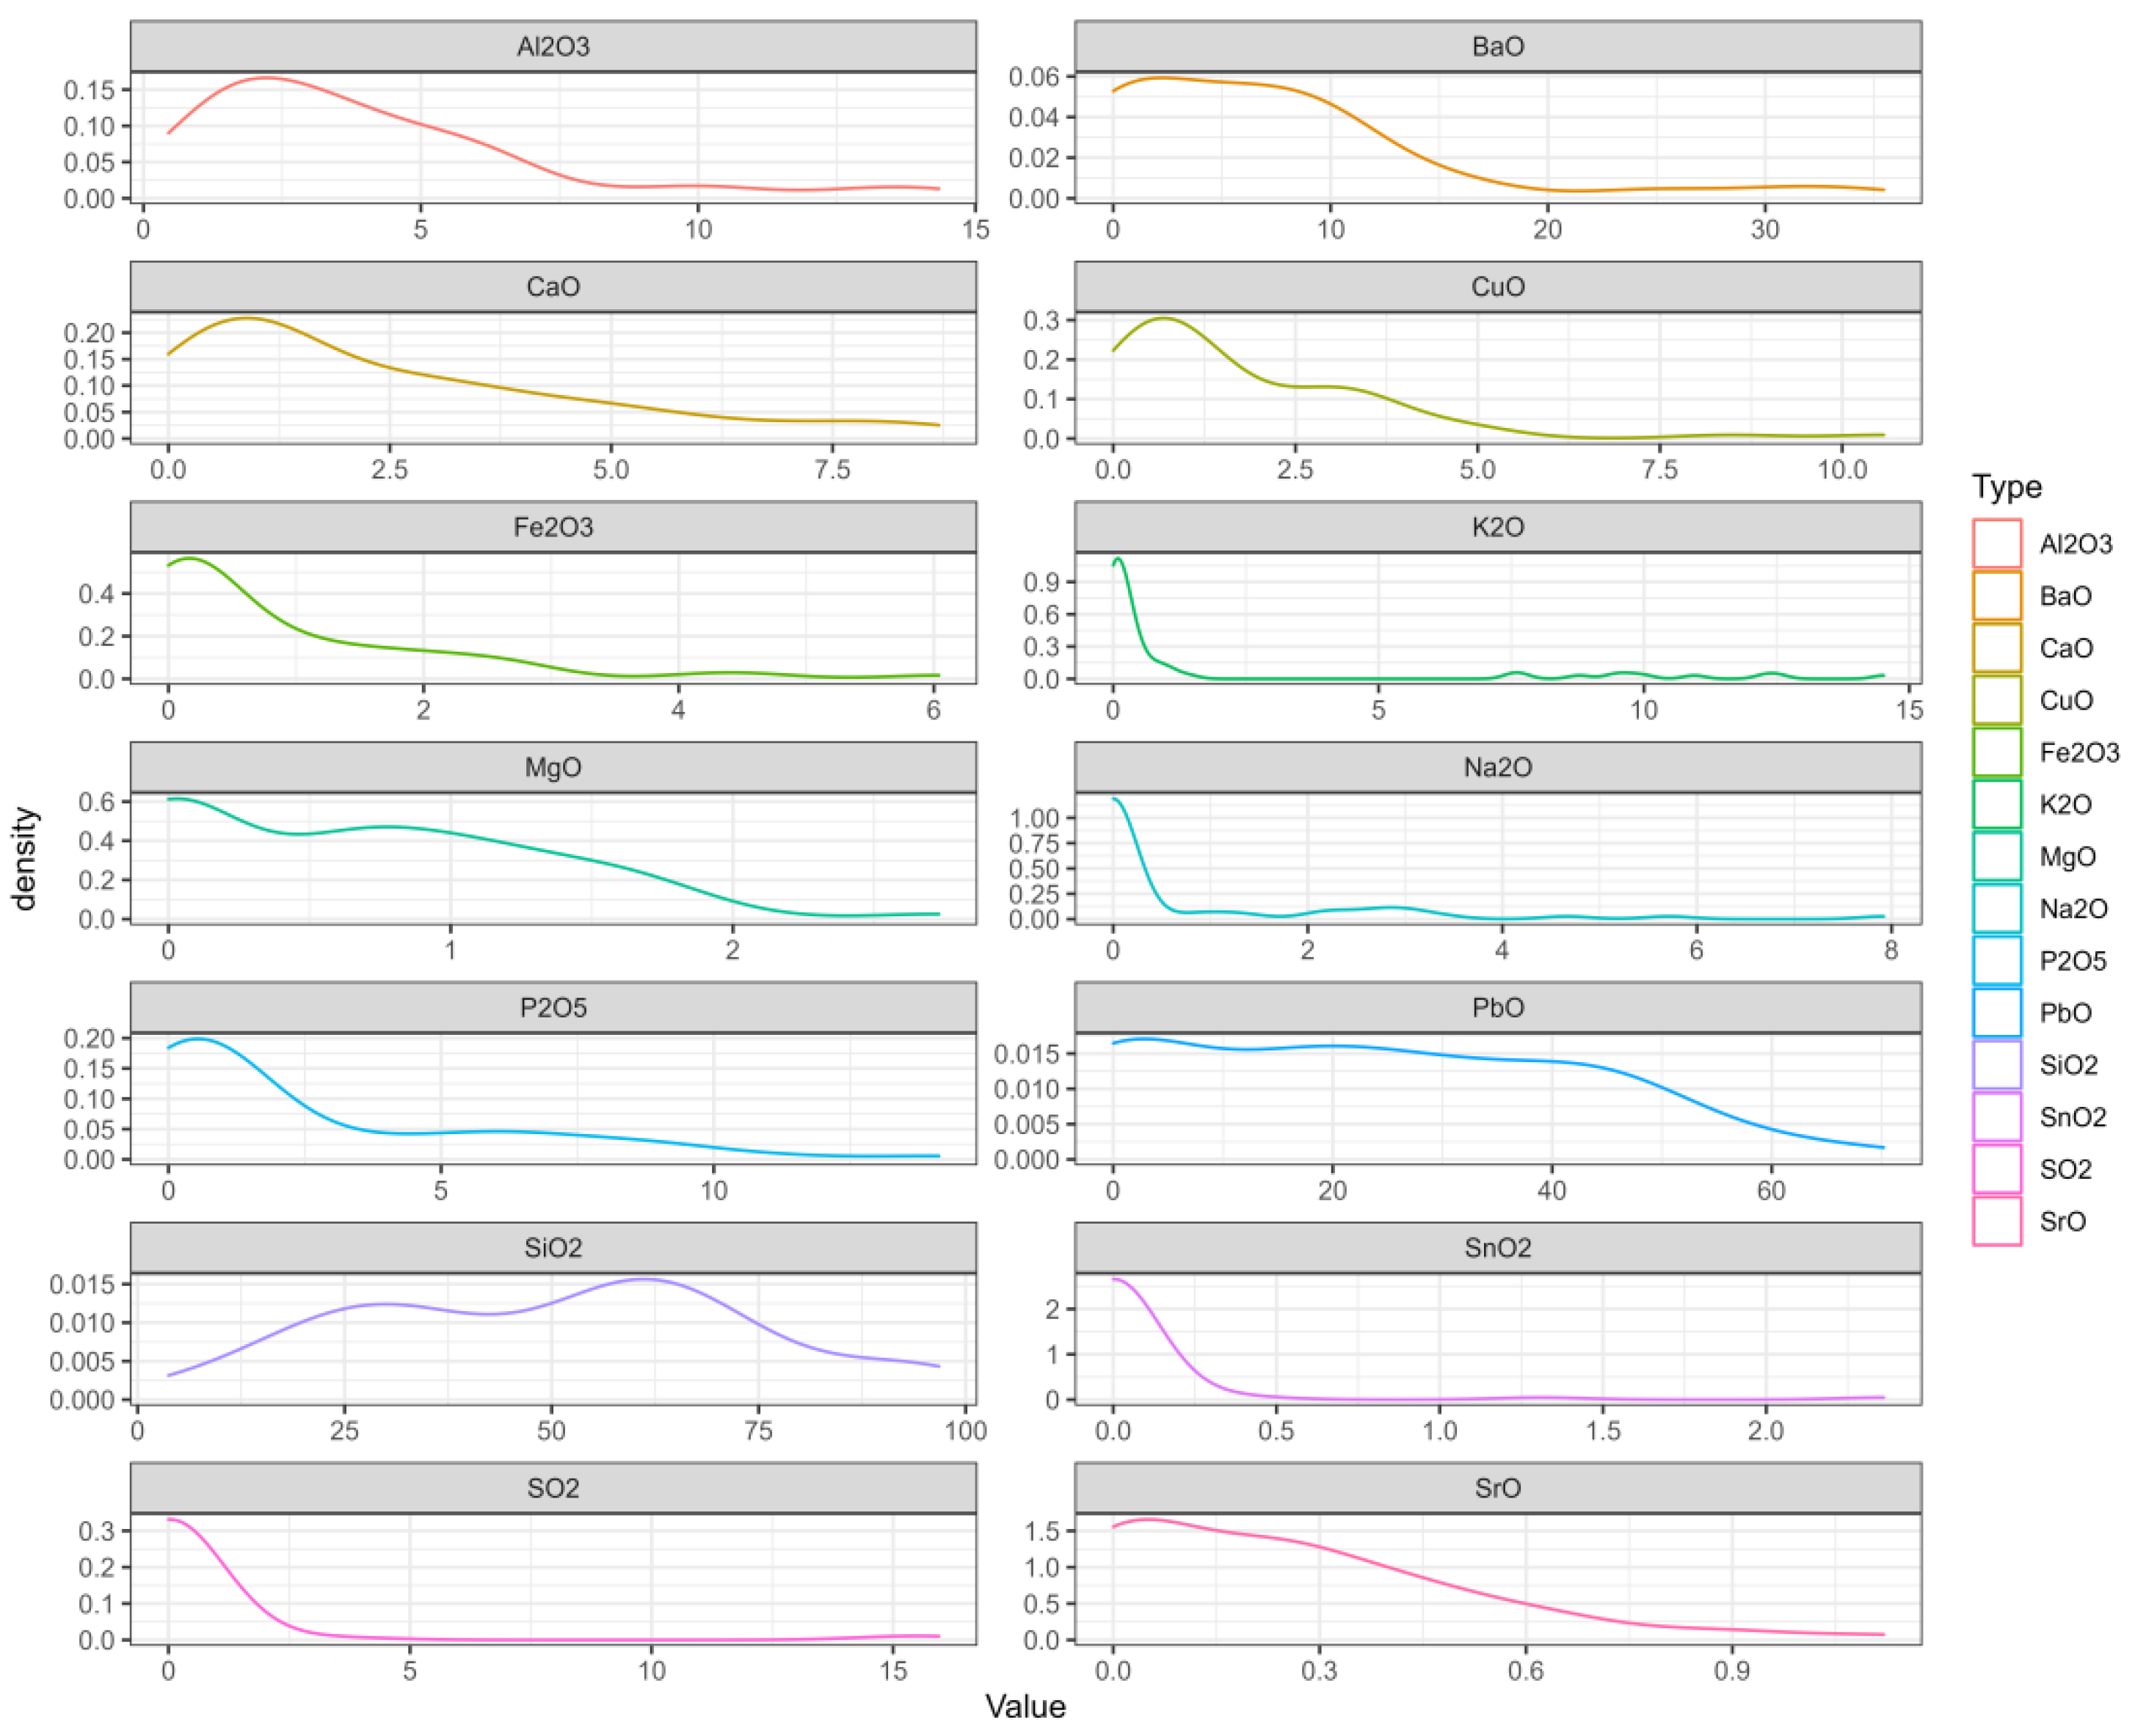
Second, we created a probability-density map, on which the abscissa range represents the value interval of each variable, the ordinate represents the probability of each variable taking the value, and the sum of the area between the curve and the x-axis is 1. In Figure 3, we can see where the values of each variable are mainly concentrated [26,27].
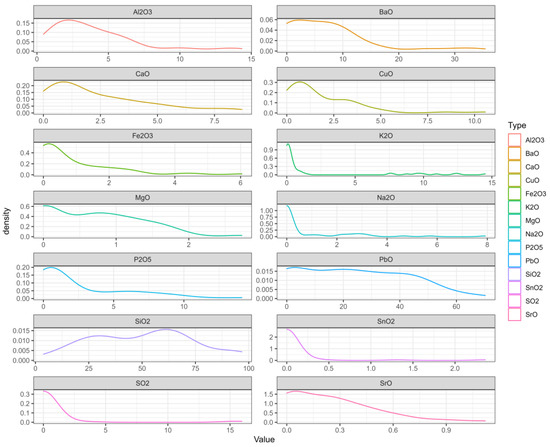
Figure 3.
The probability-density map.
Next, we calculated the correlation between the variables, with the following formula:
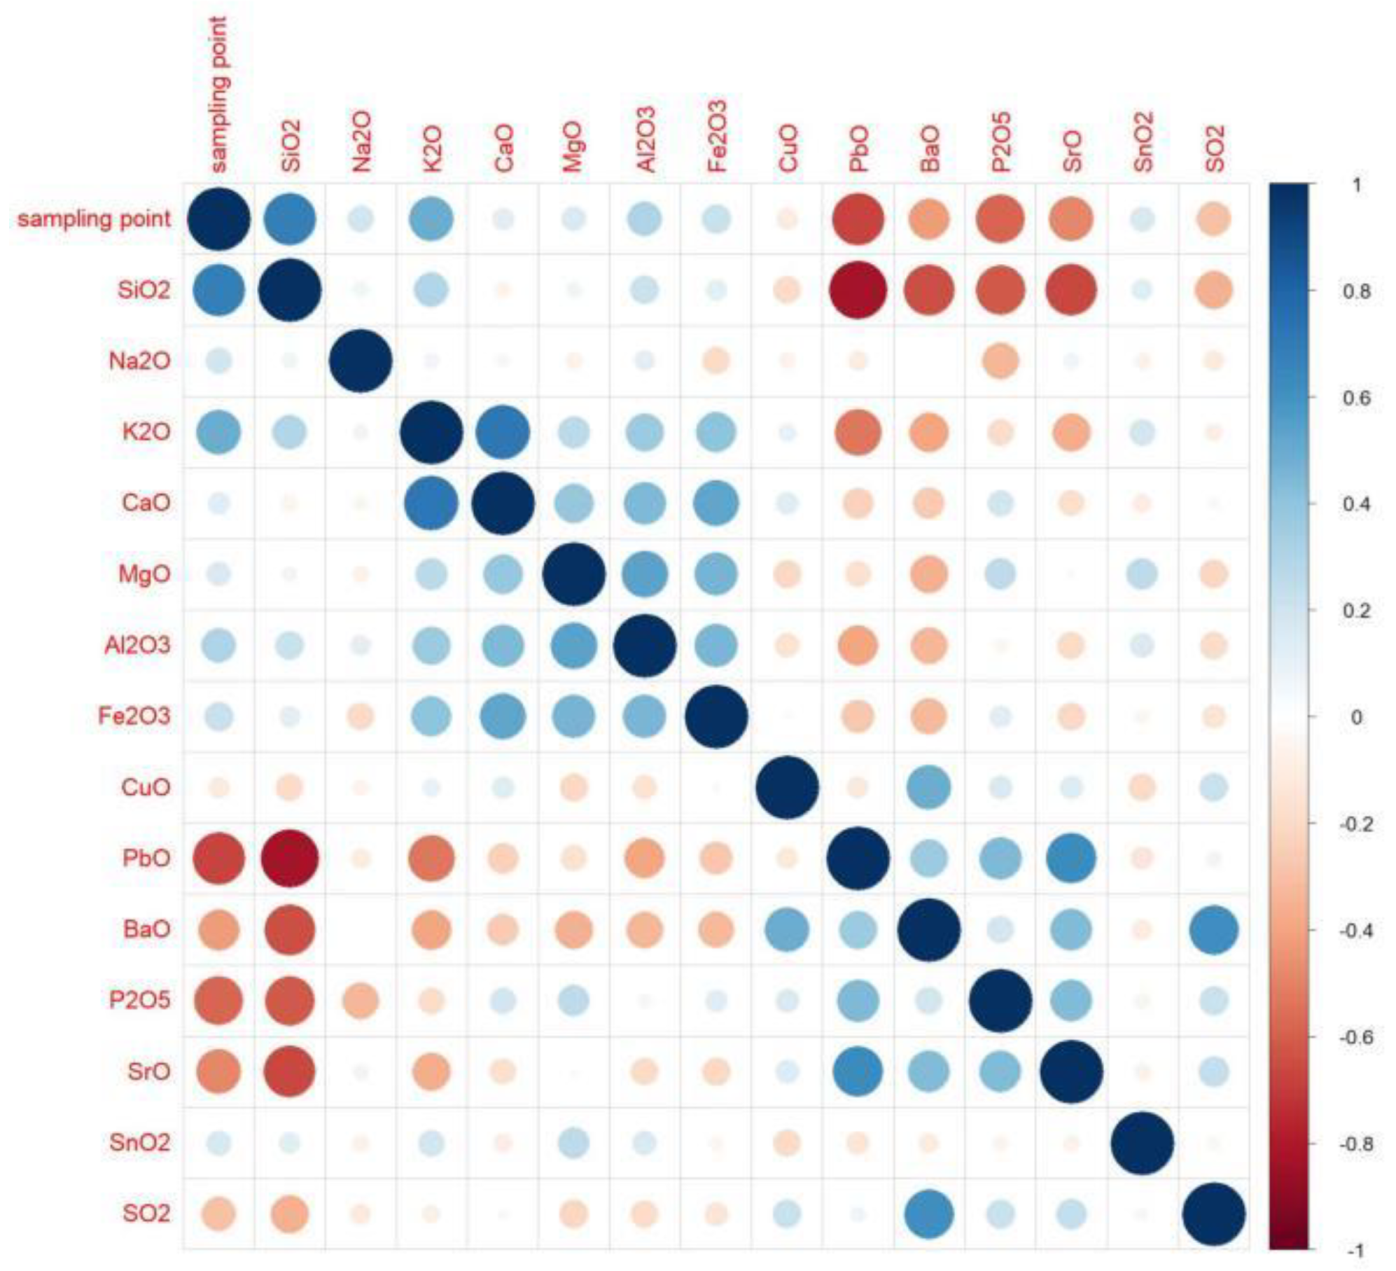
According to the calculation results, when the absolute value is closer to 1, the correlation is stronger. When the result is closer to 1, the positive correlation is stronger, and when the result is closer to −1, the negative correlation is stronger. Based on the results, we created an analysis diagram of the correlation between the variables. In Figure 4, it can be seen that there were many obvious correlations between the variables. The result on the diagonal is the correlation of each element with itself; since the result was 1, we chose to only examine the diagonal results. We found that silica, potassium oxide, lead oxide, barium oxide, phosphorus pentoxide, and strontium oxide had an obvious correlation with the artificial sampling points. The artificial sampling points are the parts of glass relics that are analyzed according to the weathering and the content of each element [28].
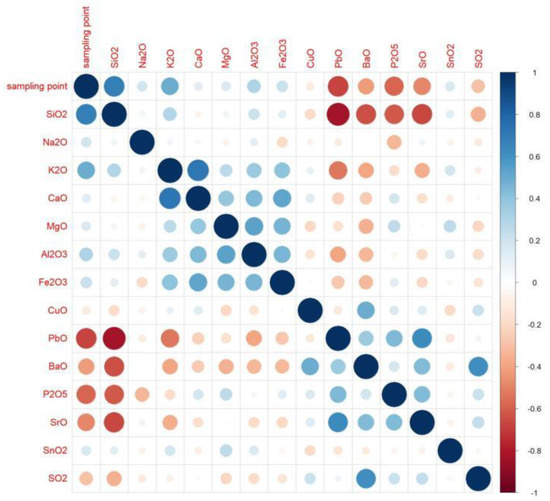
Figure 4.
Correlation-analysis diagram.
Finally, we took various elements of each cultural relic as independent variables, predicted various elements in chronological order, and created the prediction plot. In Figure 5, as in the first figure, the black dots represent the true values, and the last five blue dots represent the predicted values. Based on the change results, we believe that the prediction results can better reflect the sequence-change characteristics [29,30,31].
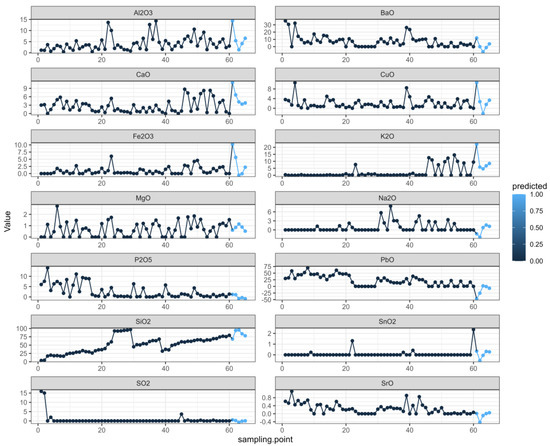
Figure 5.
Prediction diagram.
4.2.3. Solution of the Model
We created a five-step prediction of the time series, and the results are shown in Table 4.

Table 4.
Prediction results.
The relationship-establishment analysis was used to obtain the regular launch initial value and to create the five-step prediction. For elements less than 0, we believe that a chemical reaction did not occur in the initial stage, which can be directly assumed to be 0. We compared the values that were not zero to the initial value derived based on the mean; we considered the values that were close to the initial value reasonable. The specific results are shown in Table 5.

Table 5.
Results of each element component.
5. Sub-Division of the Glass Types Based on the Clustering Algorithm
5.1. Research Ideas
➀ We pre-processed the data from Form 1 and preliminarily classified the categories of the cultural relics;
➁ We used a one-way analysis of variance to select the appropriate chemical composition for the cultural relics with high potassium and lead barium to obtain the first classification results;
➂ We used the K-means algorithm to subclass the glass types, and analyzes the specific division methods and results;
➃ The rationality of the results was supported if the form was classified again and the results were similar to the cluster junction; the sensitivity is judged by adjusting the significance level in the one-way analysis of variance.
5.2. Research Methods
5.2.1. Selection of the Appropriate Chemical Composition
(1) Model Principle
One-way analysis of variance (ANOVA) refers to the method of analyzing the one-way test results and testing whether the factors have a significant impact on the test results.
Assuming that the collected data were derived from the sample values of S different populations (each level corresponds to one population), and counting the mean values of each population in one order, the following assumptions need to be tested:
Null hypothesis: .
Alternative hypothesis: Not all are zero.
To reintroduce the horizontal effect, t .
Thus, when true, the F-distribution-test statistic that needs to be followed by one-way ANOVA is:
Thus, with the significance level a, the rejection domain of the test problem is:
At this point, the null hypothesis was rejected as showing significant differences between the samples.
(2) Model Building
First, we investigated whether the fourteen chemical components would have a significant effect on the glass-classification results of high-potassium types.
Therefore, we established the following assumptions:
Null hypothesis: The fourteen chemical components will not have a significant impact on the glass-classification results of high-potassium types.
Optional hypothesis: The fourteen chemical components will have a significant impact on the glass-classification results of high-potassium types [32,33,34,35,36].
In the ANOVA Table 6, SiO2, K2O, CaO, Al2O3, and Fe2O3 are less than 0.05. The null hypothesis is rejected in the belief that SiO2, K2O, CaO, Al2O3, Fe2O3, and high-potassium-type glass will affect the classification of high potassium type glass; that is, select these five suitable chemical components to subdivide the subclass of high-potassium-type glass.

Table 6.
High-potassium-, lead- and barium-type-glass ANOVA table.
Similarly, we investigated whether the fourteen chemical components would have a significant impact on the lead-barium-type-glass-classification results.
Therefore, we established the following assumptions:
Null hypothesis: The fourteen chemical components will not significantly affect the results of lead-barium-type-glass classification.
Optional hypothesis: The fourteen chemical components will have a significant impact on the results of lead-barium-type-glass classification.
In the ANOVA Table 6, it can be seem that SiO2, Na2O, Al2O3, CuO, PbO, BaO, BaO, P2O5, SrO, and SO2 are less than 0.05, and the null hypothesis that SiO2, Na2O, Al2O3, CuO, PbO, BaO, P2O5, SrO, SO2 and lead-barium-type-glass affect the classification of lead-barium-type glass can be rejected; that is, select the nine appropriate chemical components for lead-barium-type glass.
5.2.2. Subclass Division
(1) Model Preparation
For the problem of using the above chemical components for each category, we use the k-means algorithm.
The K-value setting is the only defect of the algorithm. In order to improve the effectiveness of K value, we used the fast-clustering method to determine the value of K in K-means algorithm and obtained the K value of 3 through systematic clustering in SPSS software [37,38].
(2) Model Building
➀ We randomly selected K samples from the sample set as the initial mean vector;
➁ We calculated the distance of the sample from each mean vector and dividedthe sample into the phase according to the nearest mean vector from the sample cluster;
➂ After the classification, the central point of the category was redetermined and the mean of all samples in the category was made. For features corresponding to the new center point, the centroid of all samples in the class was applied;
➃ Steps 2 and 3 were repeated until the subclass subdivision of high-potassium glass with lead barium glass was completed.
(3) Model Solution
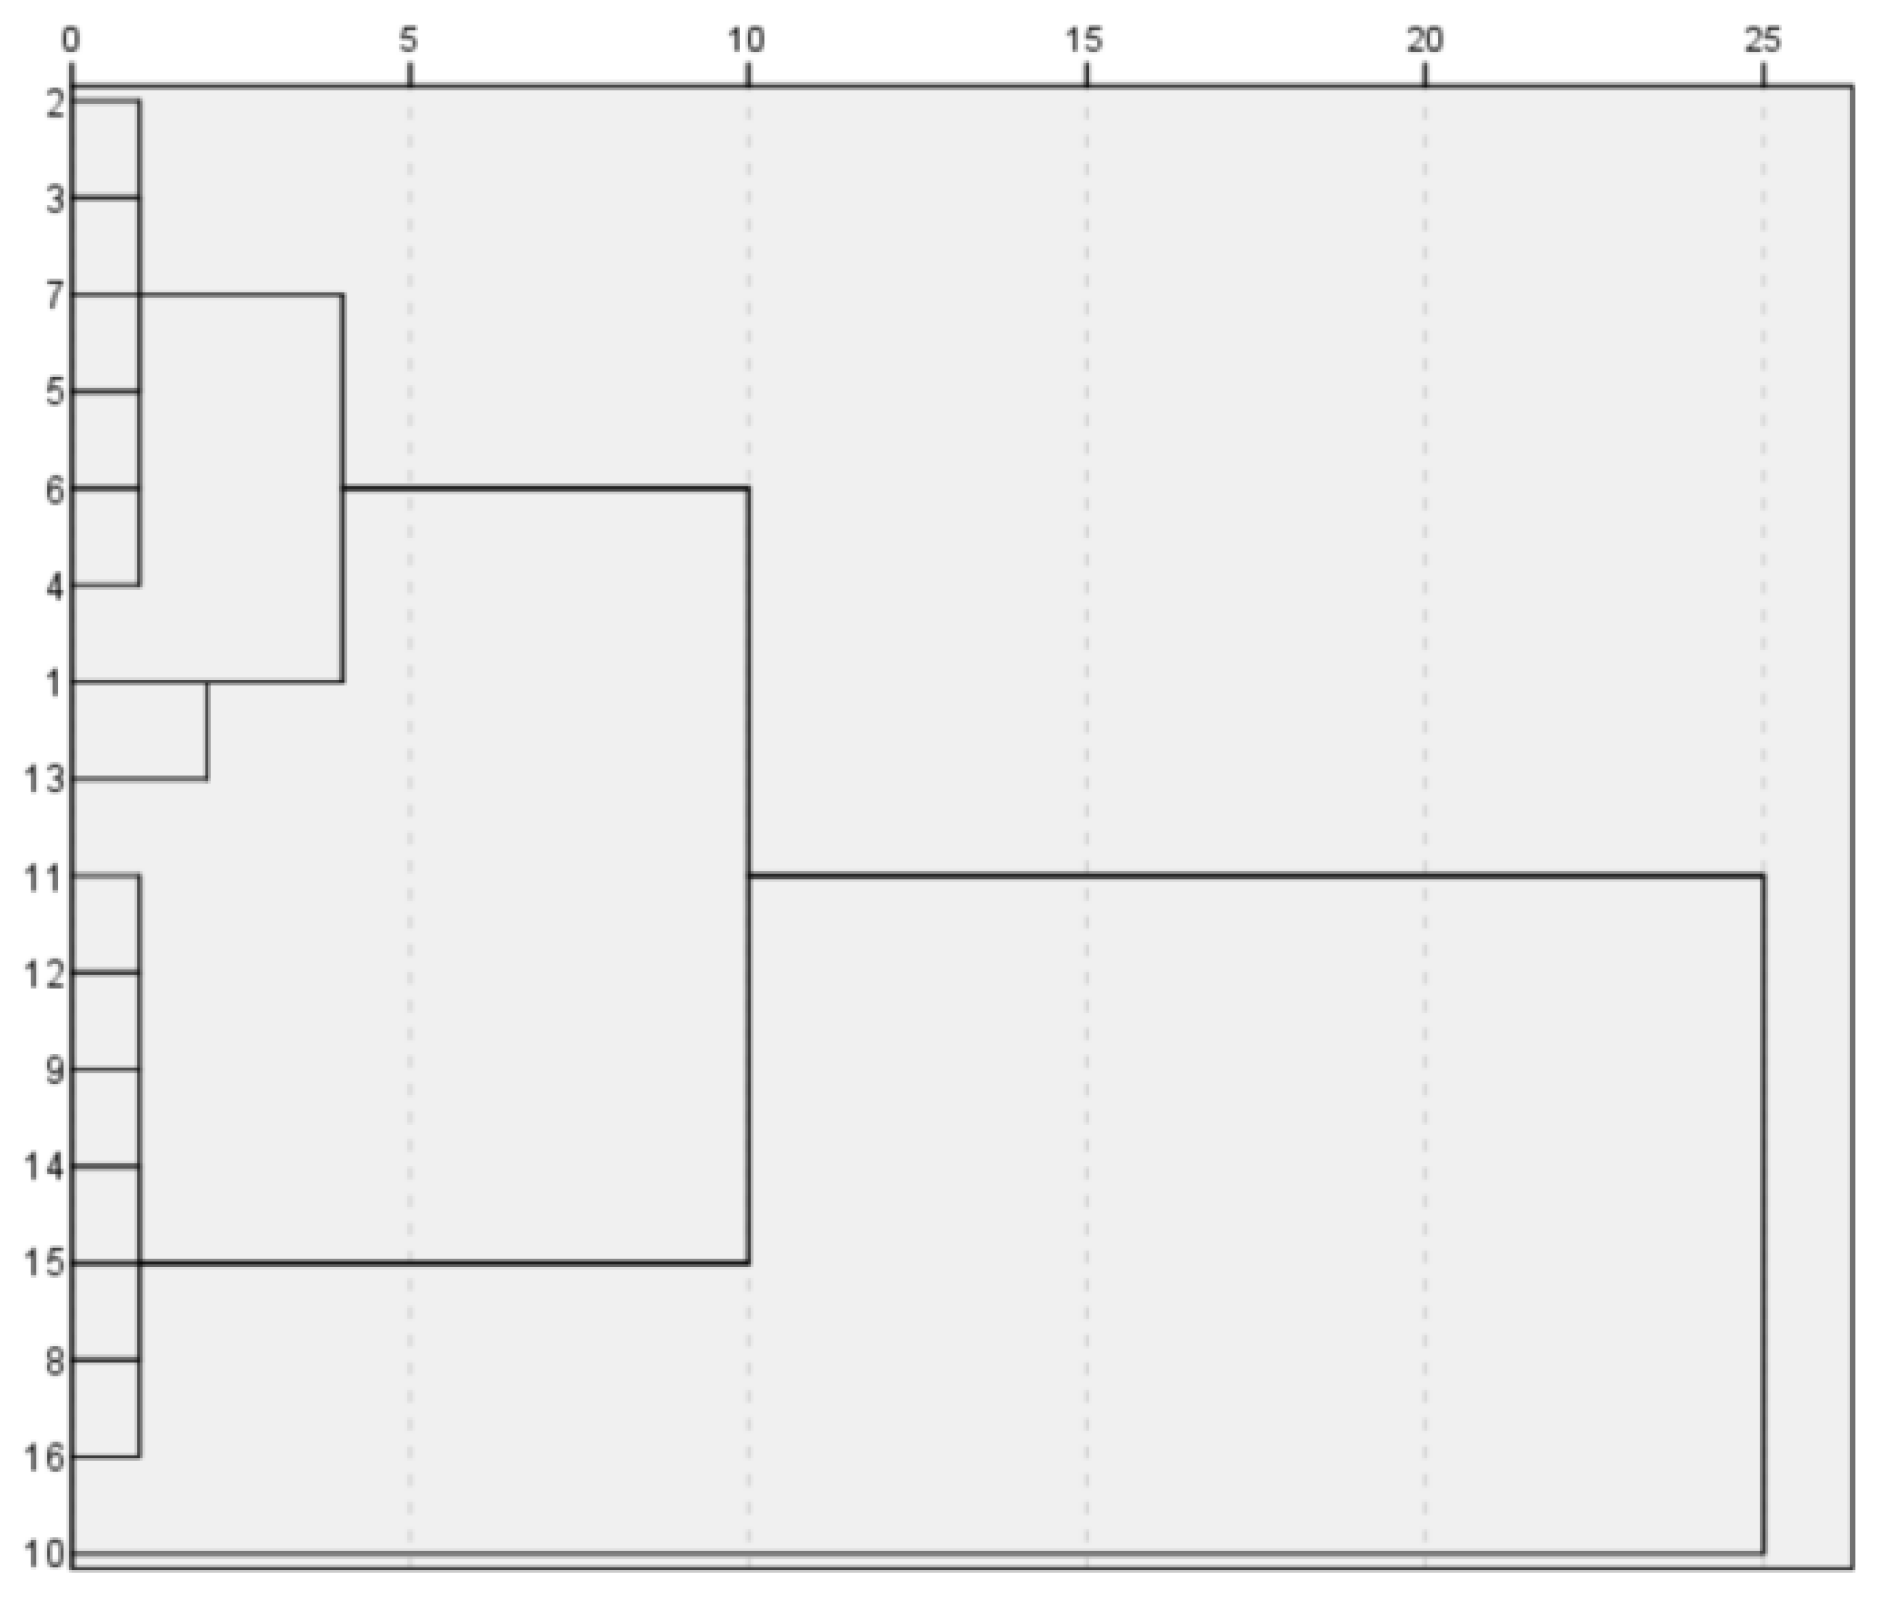
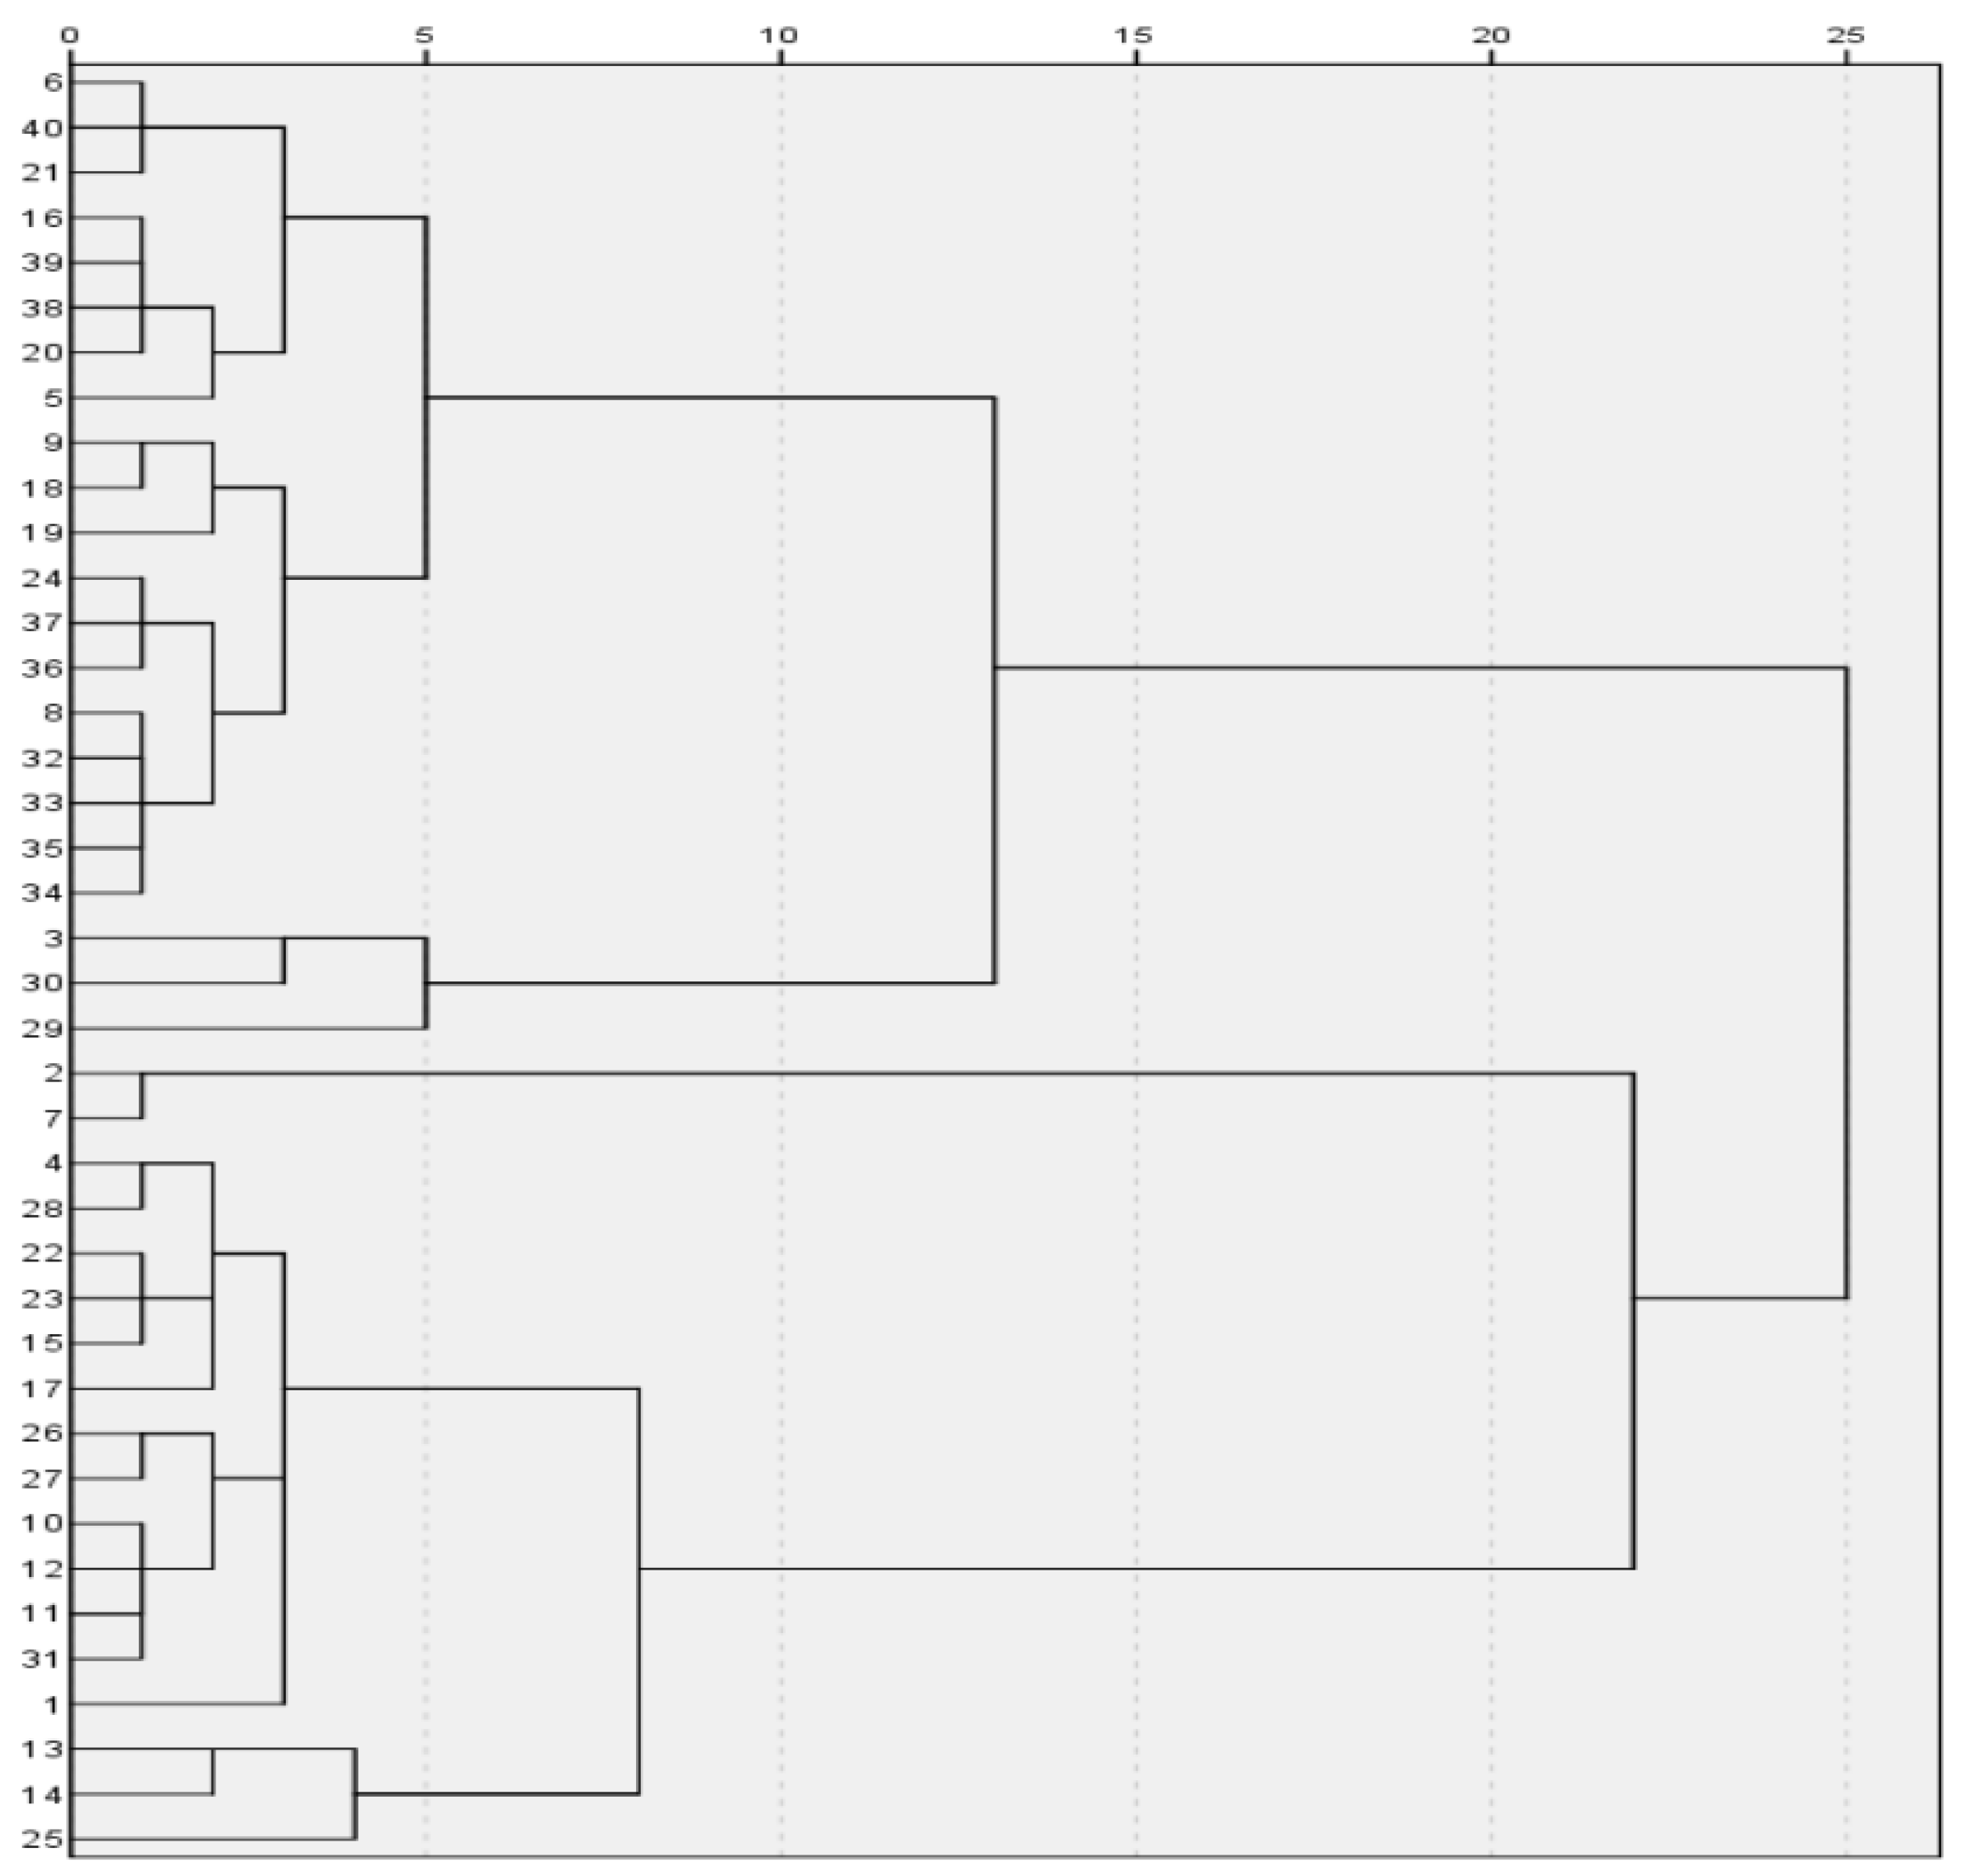
Based on the analyzed data, we solved the model using SPSS software and obtained the following results:
High potassium:
{18,7,27,10,12,9,22,21}, {16,14,3,1,4,5,13,6}.
Lead-barium:
{2,34,36,28,29,40,43,52,54,57}, {8,11,19,26,41,51,56,58,24,30},
{23,25,28,29,42,44,48,49,50,53,20,31,32,33,35,37,45,46,47,55}.
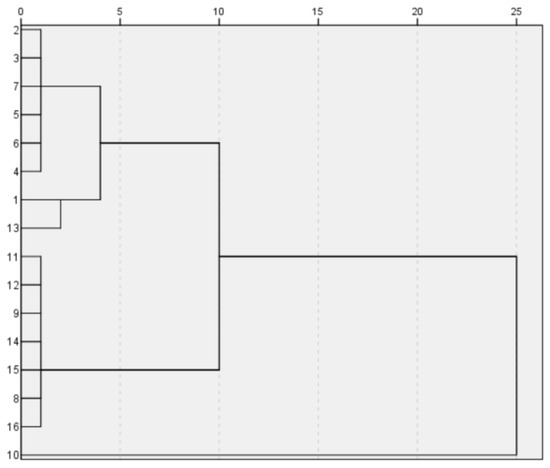
Figure 6.
High-potassium-classification diagram.
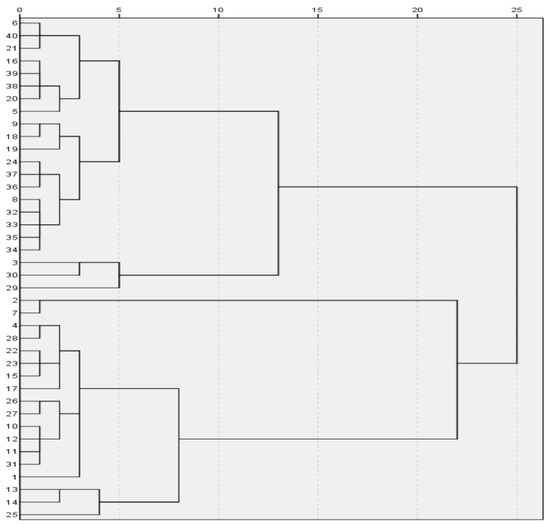
Figure 7.
Lead-barium-classification diagram.
5.3. Model Analysis
(1) Rationality Analysis
In order to verify the rationality of the classification results, we used the principal-component-analysis method to cluster the data and compare the observed classification results with the K-means classification results. If the comparison results were not very different, the classification results were reasonable; otherwise, the classification results were not reasonable. According to the results obtained from the above cluster analysis, the data were divided into two categories; therefore, we also extracted the same two categories using the principal-component-analysis method. The principal-component-analysis steps were as follows:
➀ With n cultural relics and p indicators, the initial sample matrix is:
➁ Calculate eigenvalues of the inter-index correlation coefficient matrix R and eigenvector and obtain the principal component : .
➂ When the cumulative variance contribution of the j-th principal component is above 80%, take the first q principal components ; it is believed that the few q principal components reflect the information of the original p evaluation indicators. Formula for the cumulative-variance-contribution rate:
➃ The formula for studying the composite score is as follows:
Next, classifications were performed according to the coefficient size. Based on the coefficient of the principal components, we extracted the cultural-relic numbers with large coefficients and obtained the results presented in Table 7 [39,40].

Table 7.
Main component analysis of high-potassium and lead-barium glass.
Based on the above results, we found that although the results of K-means cluster analysis were slightly inconsistent, they were generally the same, which shows that the results essentially did not change with different methods, and that their rationality was strong.
(2) Sensitivity Analysis
During the extraction of the significant chemical-component content, the significance level of the one-way ANOVA was determined to be 0.05. To explore the sensitivity of our classification results, we adjusted the significance levels to 0.01 and 0.1, respectively, and the specific experimental procedures and results were as follows.
Significance level of 0.05: SiO2, K2O, CaO, Al2O3, and Fe2O3. Chemical composition in high-potassium-glass classification: SiO2, NaO, K2O, Al2O3, CuO, CaO, PbO, BaO, Fe2O3, P2O5, SrO, and SO2.
The ➀ significance level was 0.01.
For high-potassium glass, the significance level of the original chemical composition selected had less Fe2O3. For lead-barium glass, the extraction of chemical composition as less than the basis of the chemical composition of NaO, Al2O3, and SrO. Specific classification results are shown in Table 8.

Table 8.
Comparison of the various significance levels.
The ➁ significance level was 0.1.
For high-potassium glass, the chemical composition extracted at this point was higher in SO2 than the previously extracted chemical. For lead-barium glass, the extracted chemical composition added CaO to the original significance level. The specific classification results are shown in Table 8.
The table shows that at the significance levels of 0.1 and 0.01, although the classification of the high-potassium and lead-barium glass was perturbed, fewer relics were disturbed; therefore, we believe that the sensitivity of the lead-barium-glass-classification law is low.
In conclusion, although changing the level of significance can affect the change in classification results, the number of changes is small and exerts a weaker impact on the population; therefore, we believe that the results obtained by the K-means classification are less sensitive.
6. Conclusions
By converting the relevant data to a time series, we can derive the initial value of each element variable. Based on the initial data of each element variable, combined with the existing element content, we can perform chemical reactions on the surfaces of glass artifacts. At the same time, based on the classification of glass with high potassium and lead barium, the use of subclass division can help us to obtain a more detailed understanding of glass artifacts. For a reasonable initial prediction of the chemical composition content, and to provide a theoretical basis for the division of cultural-relic categories, such studies ot only enrich the understanding of the preservation status and weathering mechanism of cultural relics but, at the same time, they are also of special significance in field operations, archaeological sites, and cultural-relic protection, among other applications. They also provides a scientific basis for the formulation of protection-and-restoration programs. Based on the research conclusion, the following policy suggestions are suggested:
First, increase the innovative research on glass relics. Most of the existing studies are on the protection and restoration of cultural relics. With the help of instruments and equipment, the research on specific elements should widen the research scope and conduct a more comprehensive study of glass relics.
Second, the richness of extenders combines color, category, decoration, and so on with chemical elements and classifies glass relics. This makes research on glass relics more relevant.
Third, we should attach importance to the coordinated development of the study of environmental systems and technological innovation. In the research on glass cultural relics, we should pay attention to environmental protection and encourage technological innovation through technical exchanges at home and abroad. This would highlight the development of glass technology at various points in time, as well as the integration of Chinese and Western glass technology.
Supplementary Materials
The following supporting information can be downloaded at: https://www.mdpi.com/article/10.3390/molecules28020853/s1, Attachment S1; annex S1; annex S2.
Funding
This work was supported by the major project of the National Social Science Fund, “Statistical Study on the Impact of Digital Economy on Carbon Emission“ (22BTJ048), and its phased research results.
Institutional Review Board Statement
Not applicable.
Informed Consent Statement
Not applicable.
Data Availability Statement
Data are contained within the article.
Conflicts of Interest
The authors declare that there are no conflict of interest regarding the publication of this paper.
Sample Availability
Not applicable.
References
- Wang, C.; Tao, Y. Weathing of the silicate glass. J. Silic. 2003, 31, 78–85. [Google Scholar]
- Qi, J.; Wang, C.; Ning, L. Study on alkali precipitation of silicate glass. Glass Enamel 2006, 34, 9–13. [Google Scholar]
- Chen, Z.-K.; Zhang, L.-Y. Statistical structure simulation of thermal properties and chemical stability of borosilicate glass. J. Silic. 2022, 50, 1301–1309. [Google Scholar]
- Li, Q.; Li, F.; Gan, F. Detection of the chemical composition of a batch of ancient glass samples unearthed in China. Sci. Cult. Relics Prot. Archaeol. 2006, 18, 8–13. [Google Scholar]
- Li, Q.; Dong, J.; Gan, F. Chemical composition and process characteristics of early glazed sand and glass products in China. J. Guangxi Univ. Natl. 2009, 15, 31–41. [Google Scholar]
- Zhang, K.; Cheng, H.; Zhang, G. A study on ancient colored glaze in China. J. Silica 1983, 11, 67–75. [Google Scholar]
- Wen, R.; Zhao, Z.-Q.; Ma, J.; Wang, J.-X. Composition analysis of glass beads unearthed from Renzigou Site group in Balikun, Xinjiang. Spectrosc. Spectr. Anal. 2016, 36, 2961–2965. [Google Scholar]
- Cui, J.-F.; Wu, X.-H.; Tan, Y.-H.; Wang, Y.-B. Composition analysis of ancient glass ware unearthed from chu tombs during the Warring States Period in Yuanshui River Basin, Hunan province. J. Silic. 2009, 37, 1909–1913. [Google Scholar]
- You, Q.; Zhao, X.; Gan, X. Nondestructive analysis of the chemical composition, structure, and phase of natural glass. J. Silic. 2012, 40, 443–449. [Google Scholar]
- Waclawska, I.; Szumera, M.; Sulowska, J. Thermal and structural interactions in transition elements containing silicate-phosphate glasses. Thermochim. Acta 2014, 593, 71–74. [Google Scholar] [CrossRef]
- Xu, Y.-L.; Liao, Q.-L.; Wang, F.; Zhu, H.-Z.; He, Z.-X.; Fu, M.-Y.; Zhu, Y.-C. Impacts of substitution of Fe2O3 for SiO2 on structure and properties of borosilicate glasses containing MoO3. J. Non Cryst. Solids 2022, 599, 121982. [Google Scholar] [CrossRef]
- Souag, R.; Kamel, N.-E.; Moudir, D.; Mouheb, Y.; Aouchiche, F. TiO2 addition into nuclear glass ceramic: Study of the crystalline phases, structure and chemical durability. J. Ceram. Process. Res. 2022, 23, 304–311. [Google Scholar]
- Sawamura, D.; Kato, C.; Matsuzaki, M.; Taniguchi, Y.; Nakai, I. Archaeochemical investigation of ancient glass artifact unearthed from the kanto region by XRF analysis. Bunseki Kagaku 2015, 64, 637–642. [Google Scholar] [CrossRef]
- Chen, Z.-W.; Meng, Z.; Liu, L.-L.; Wang, H.; Sun, Y.-Q.; Wang, X.-D. Structural and viscous insight into impact of MoO3 on molten slags. Metall. Mater. Trans. B Process Metall. Mater. Process. Sci. 2021, 52, 3730–3743. [Google Scholar] [CrossRef]
- Hassaan, M.-Y.; Saudi, H.-A.; El-Bahnasawy, H.-H.; Bendary, A.-A.; Abdel-Moety, A.-S. Preparation and characterization of egyptian granite based glass with different Na+ ions content. Silicon 2021, 14, 4485–4491. [Google Scholar] [CrossRef]
- Cong, Q.-D.; Yuan, G.-F.; Zhang, C.; Guo, B.-C. Experimental study of laser-induced chemical reaction. Laser Infrared 2018, 48, 291–298. [Google Scholar]
- Cong, Q.-D.; Yuan, G.-F.; Zhang, C.; Guo, B.-C. Experimental study on barium compound-assisted laser engraving of quartz glass. Laser Technol. 2018, 42, 351–356. [Google Scholar]
- Wang, J.; Li, M.; Ma, Q.-L.; Zhang, Z.-G.; Zhang, M.-F.; Wang, J.-L. Study on the weathering of an eight-prismatic lead-barium glass ware in the Warring States Period. Glass Enamel 2014, 42, 6–13. [Google Scholar]
- Zhang, X.-Q.; Wang, M. Missing value interpolation method for component data based on principal component analysis. Appl. Probabilistic Stat. 2016, 32, 101–110. [Google Scholar]
- Meng, J.; Li, C.-L. Missing value interpolation of categorical data based on a random forest model. Stat. Inf. Forum 2014, 29, 86–90. [Google Scholar]
- Li, X.-Y. Missing value interpolation method based on a spatial autoregressive model. Math. Stat. Manag. 2005, 24, 45–50. [Google Scholar]
- Zhang, W.; Chen, J.-P.; Liu, C.-H.; Ma, J.-Q.; Zhang, C. Application of chi-square test in statistical division of fractured rock mass. J. Geotech. Eng. 2011, 33, 1440–1446. [Google Scholar]
- Qiu, Z.-J.; Zhou, L.-B.; Pang, F.-Z.; Jiang, T.-H. Chemical and mechanical grinding processing of quartz glass. Opt. Precis. Eng. 2010, 18, 1554–1561. [Google Scholar]
- Ma, Z.; Wei, B.-J.; Li, Z.-C. Study on ceramic coating of 1Cr18Ni9 steel. Therm. Process. Process 2007, 232, 4–6. [Google Scholar]
- He, H.-X.; Yu, J.-X. Wear properties of sodium and calcium glass in different liquid environments. J. Silic. 2018, 46, 45–52. [Google Scholar]
- Wang, R.; Wan, D.-S.; Nie, Q.-Q. Study on hydrologic time series prediction methods based on LSTM and GPR. Comput. Simul. 2022, 39, 497–501. [Google Scholar]
- Cao, C.-F.; Li, L. Multidimensional time-series prediction based on the combined TRMF-LSTM model. Softw. Guide 2022, 21, 45–51. [Google Scholar]
- Zhang, X.; Chen, S.-X.; Ye, J.-Y. Correlation analysis of permanent deformation of glasses product and measurement time point. Glass Enamel Is Made Eyeglasses 2022, 50, 8–12. [Google Scholar]
- Yang, Y.-H.; Zuo, S. The processing of foundation pit monitoring data based on a time-series prediction model. J. Jiangsu Archit. Vocat. Tech. Coll. 2022, 22, 14–18. [Google Scholar]
- Zhang, Y.-M.; He, J. Summary of time-series prediction model studies. Pract. Knowl. Math. 2011, 41, 189–195. [Google Scholar]
- Zhao, X.-Y. Study on the prediction model of daily water yield in large irrigation area based on time series. Anhui Agric. Sci. 2012, 40, 9169–9171. [Google Scholar]
- Dai, L.-C.; Yang, Y.; Yang, M. Role and effect of chemical elements in architectural ceramic billet, gze and microcrystalline glass. Foshan Ceram. 2010, 20, 32–38. [Google Scholar]
- Liu, J.-B.; Muhammad, F.-N.; Mohammad, A. Bounds on the partition dimension of convex polytopes. Comb. Chem. High Throughput Screen. 2022, 25, 547–553. [Google Scholar] [CrossRef] [PubMed]
- Liu, J.-B.; Yan, Y.; Li, B.-S.; Zheng, W.-T. Analyses of some structural properties on a class of hierarchical scale-free networks. Fractals 2022, 30, 1–11. [Google Scholar] [CrossRef]
- Liu, J.-B.; Zhang, T.; Wang, Y.-K.; Lin, W.-S. The kirchhoff index and spanning trees of Möbius/cylinder octagonal chain. Discret. Appl. Math. 2022, 307, 22–31. [Google Scholar] [CrossRef]
- Lan, W.-J.; Wang, X.-T.; Xu, B. Application of one-way ANOVA in the determination of thermal conductivity. Renew. Energy 2017, 35, 1601–1604. [Google Scholar]
- Xiong, Q.-J.; Chai, X.-T.; Wan, X.; Chen, X. Spatial distribution of hydrosediment elements and application of-K-means cluster analysis. Sci. Technol. Innov. 2021, 11, 46–48. [Google Scholar]
- Wang, C.; Dong, Y.-Q. Fusion of chemical reaction optimization with text data clustering of K-means. Comput. Eng. Des. 2021, 42, 2248–2256. [Google Scholar]
- Zhou, W.-X.; Wen, X.-H.; Li, B.-S.; Wang, C.; Tian, M.-Y.; Qiu, M.-K. Geochemical elements of Holocene lake deposition in Sarah and usu River Basin. Chin. Desert 2022, 42, 114–122. [Google Scholar]
- Long, X.-Z. Analysis of the source of atmospheric suspended particulate matter based on principal component analysis method. Environ. Impact Rev. 2018, 40, 61–64. [Google Scholar]
Disclaimer/Publisher’s Note: The statements, opinions and data contained in all publications are solely those of the individual author(s) and contributor(s) and not of MDPI and/or the editor(s). MDPI and/or the editor(s) disclaim responsibility for any injury to people or property resulting from any ideas, methods, instructions or products referred to in the content. |
© 2023 by the author. Licensee MDPI, Basel, Switzerland. This article is an open access article distributed under the terms and conditions of the Creative Commons Attribution (CC BY) license (https://creativecommons.org/licenses/by/4.0/).

