
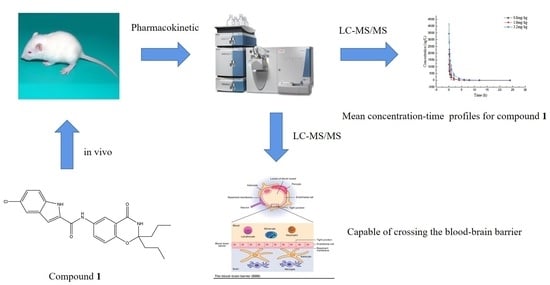
Development and Validation of a UHPLC–MS/MS Method for the Quantification of a Novel PYGB Inhibitor in Plasma: Application to Pharmacokinetic Studies


Abstract
:
1. Introduction
2. Results and Discussion
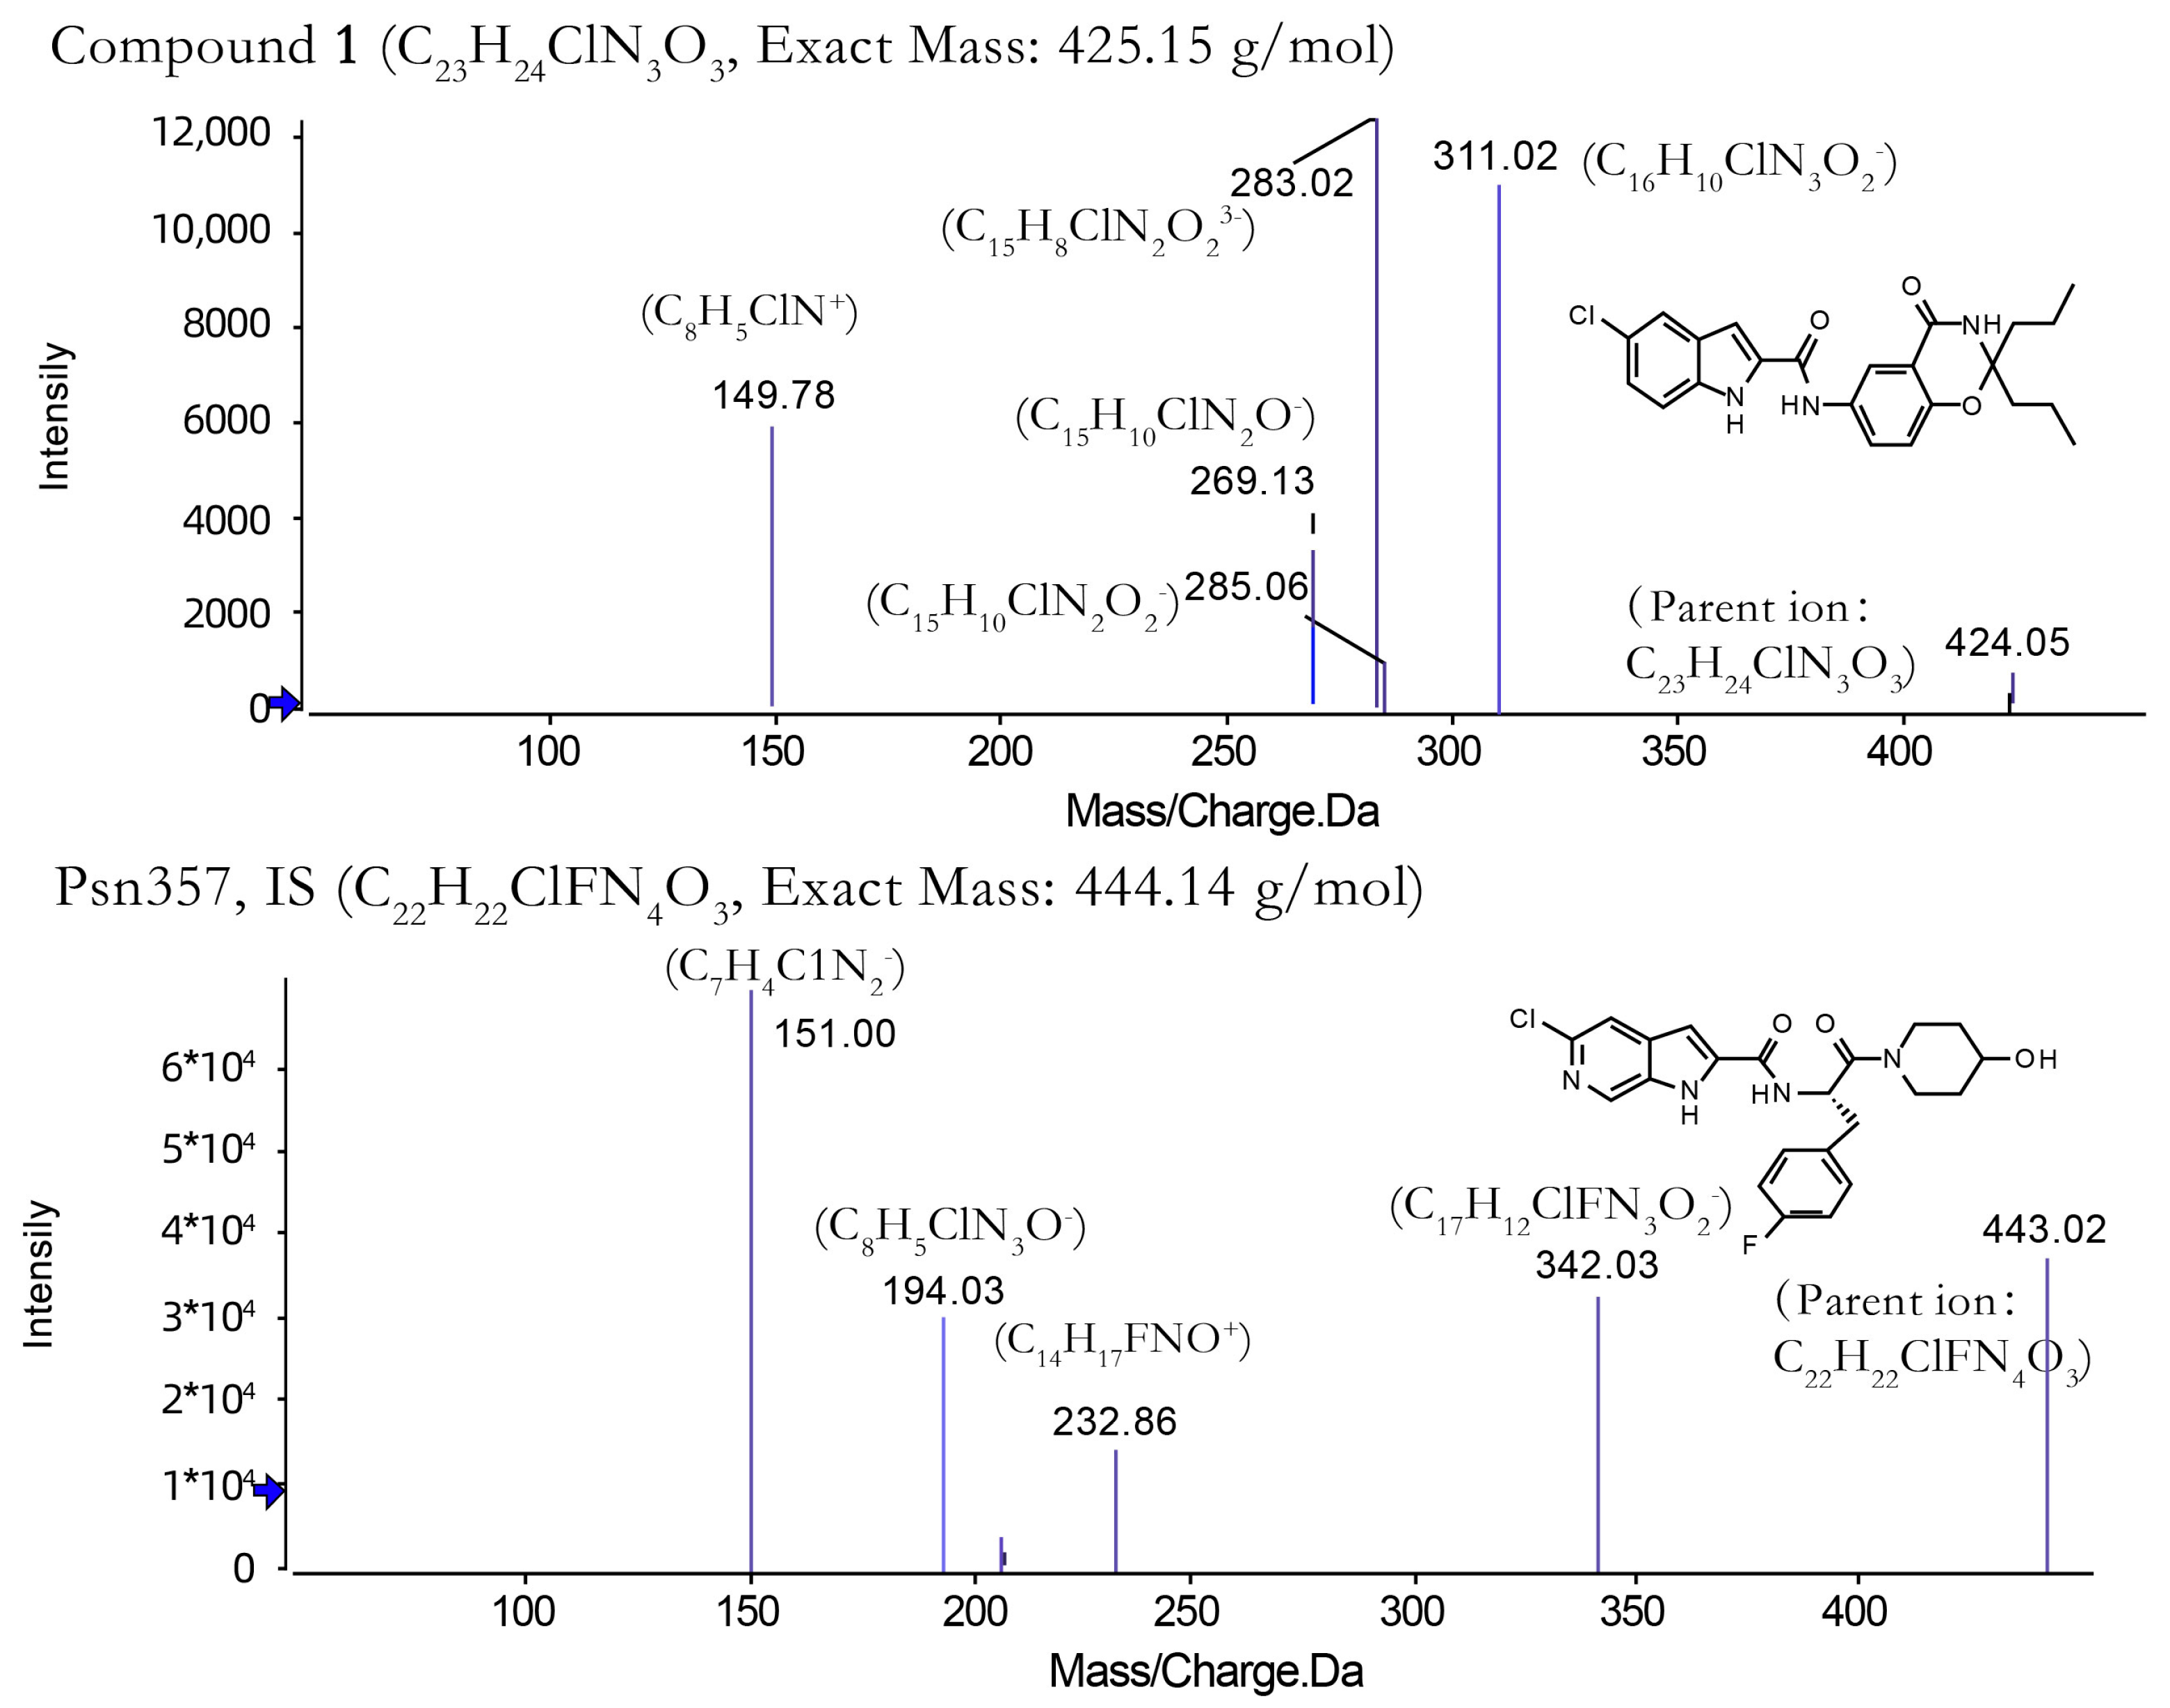
2.1. Method Development
2.2. Method Validation
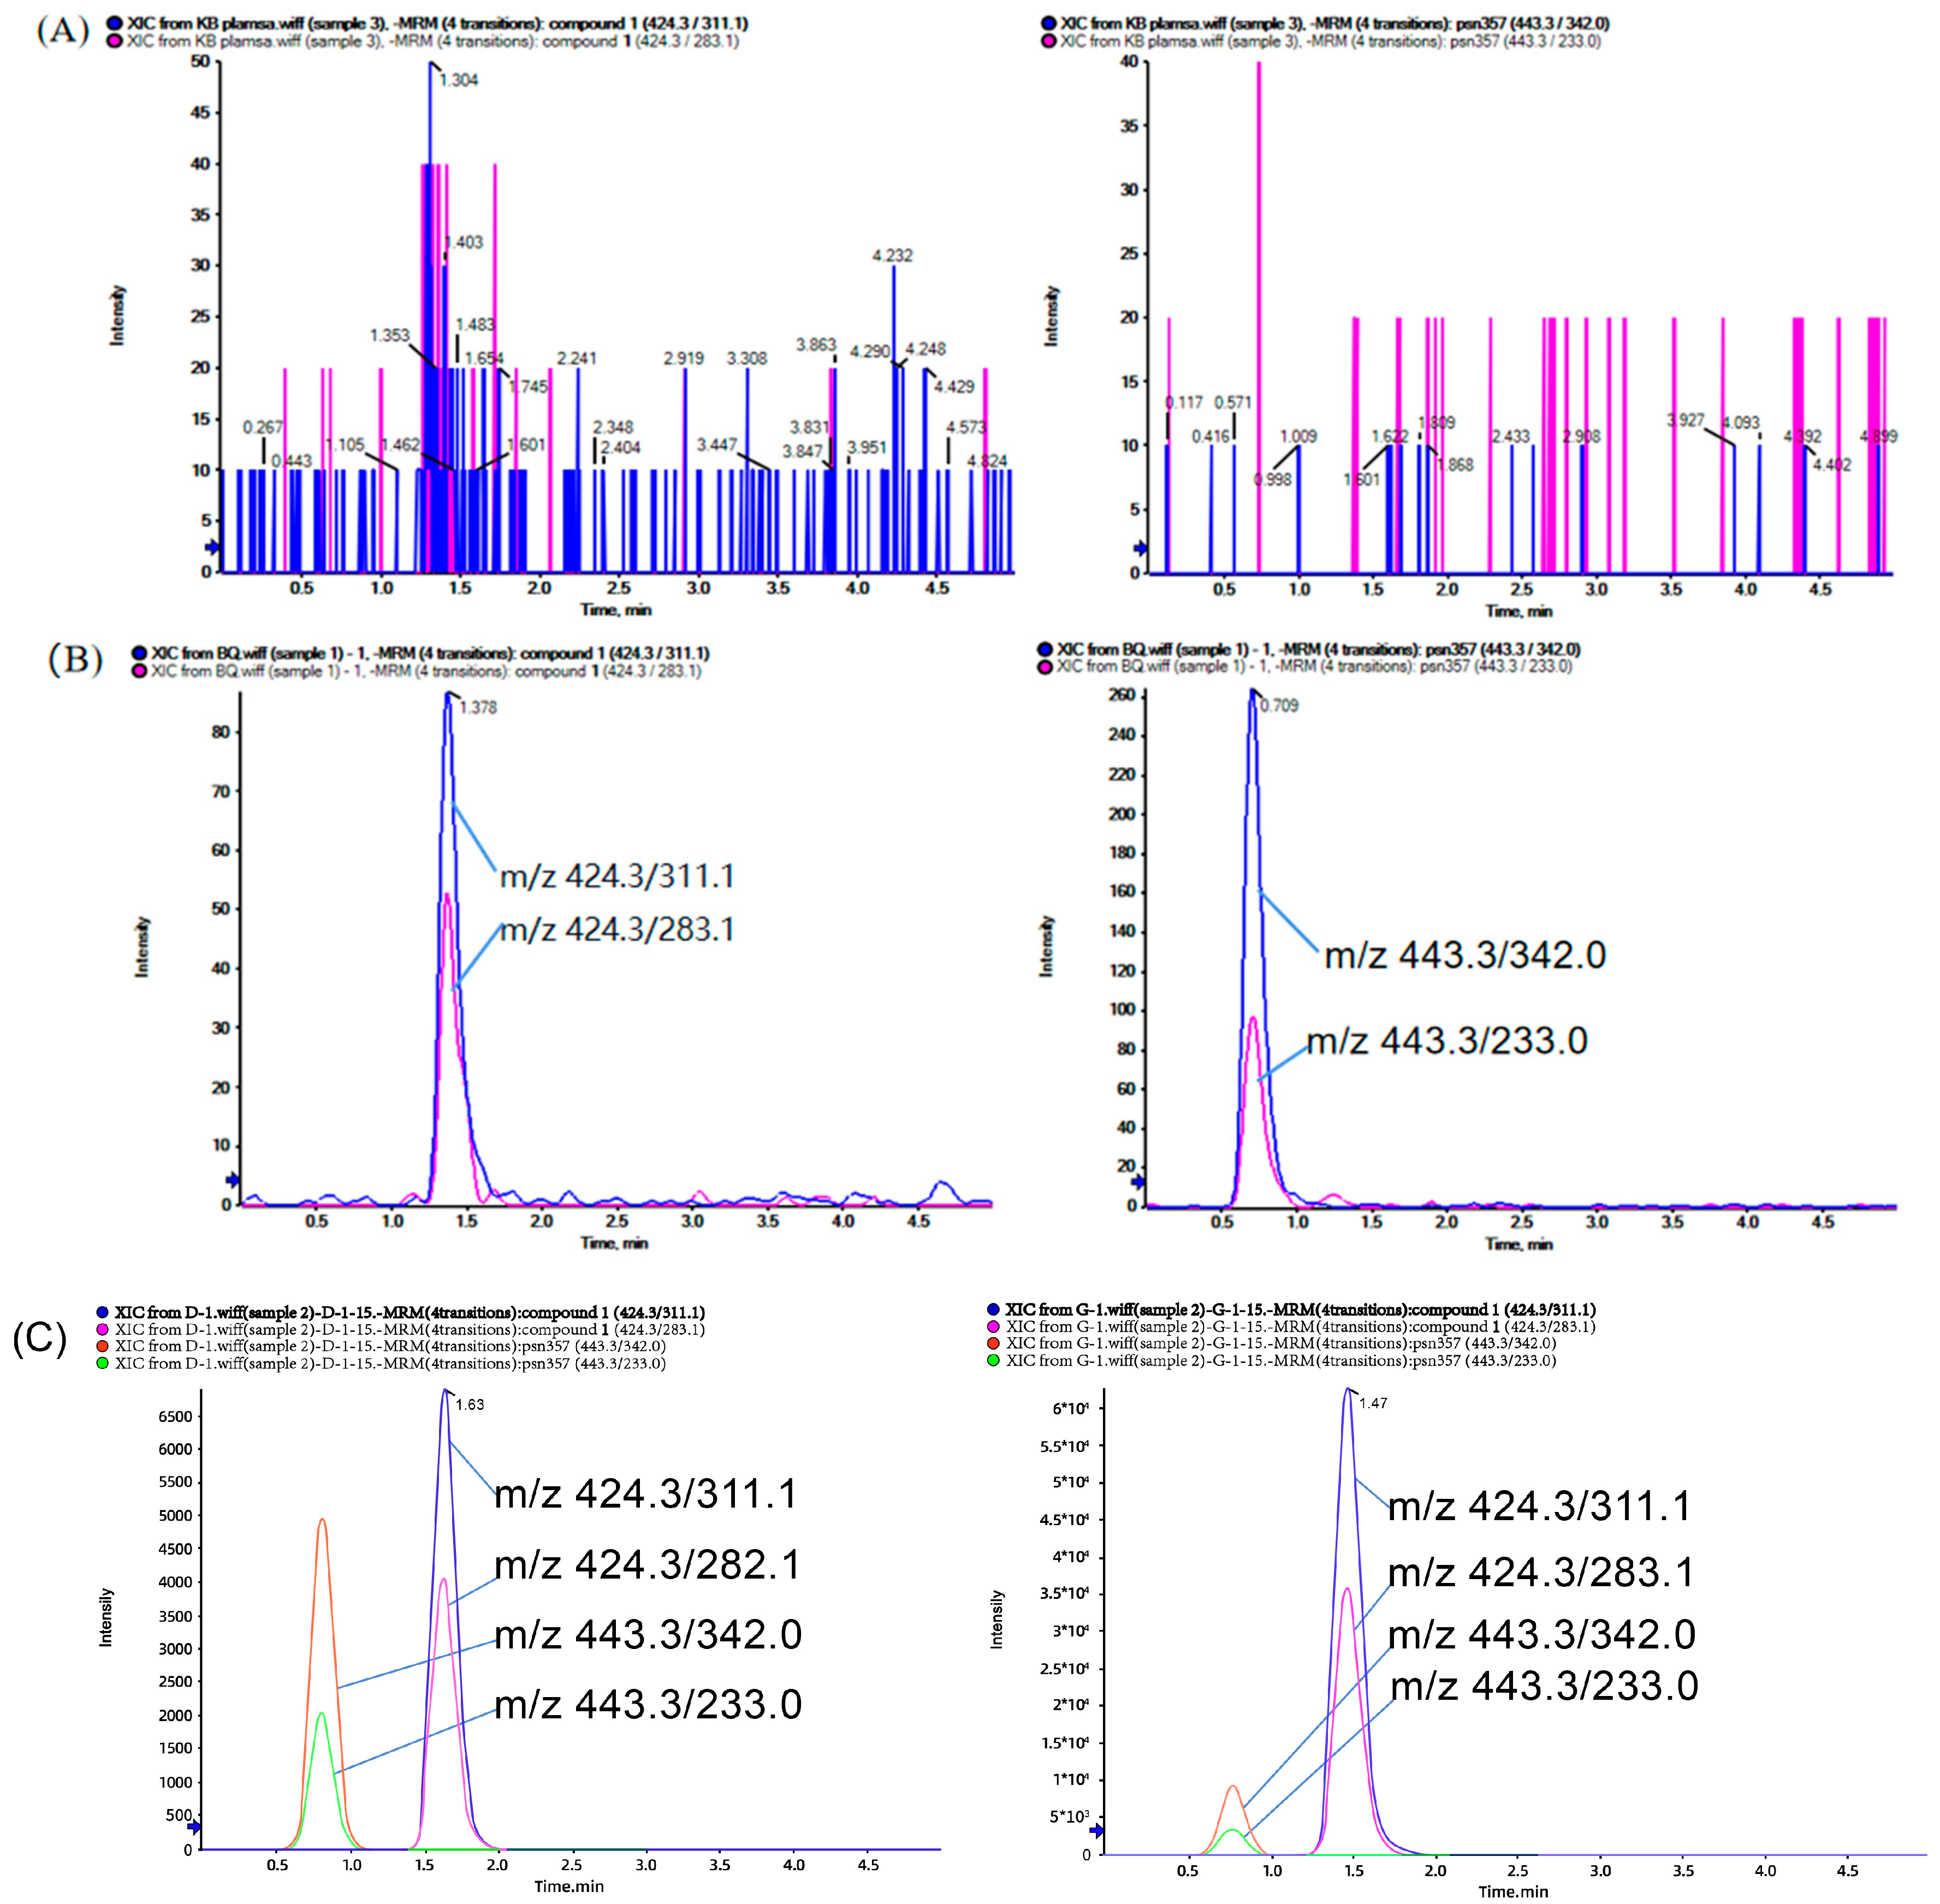
2.2.1. Selectivity
2.2.2. Linearity and the Lower Limits of Quantitation
2.2.3. Accuracy and Precision
2.2.4. Matrix Effect and Extraction Recovery
2.2.5. Stability
2.2.6. Dilution Integrity
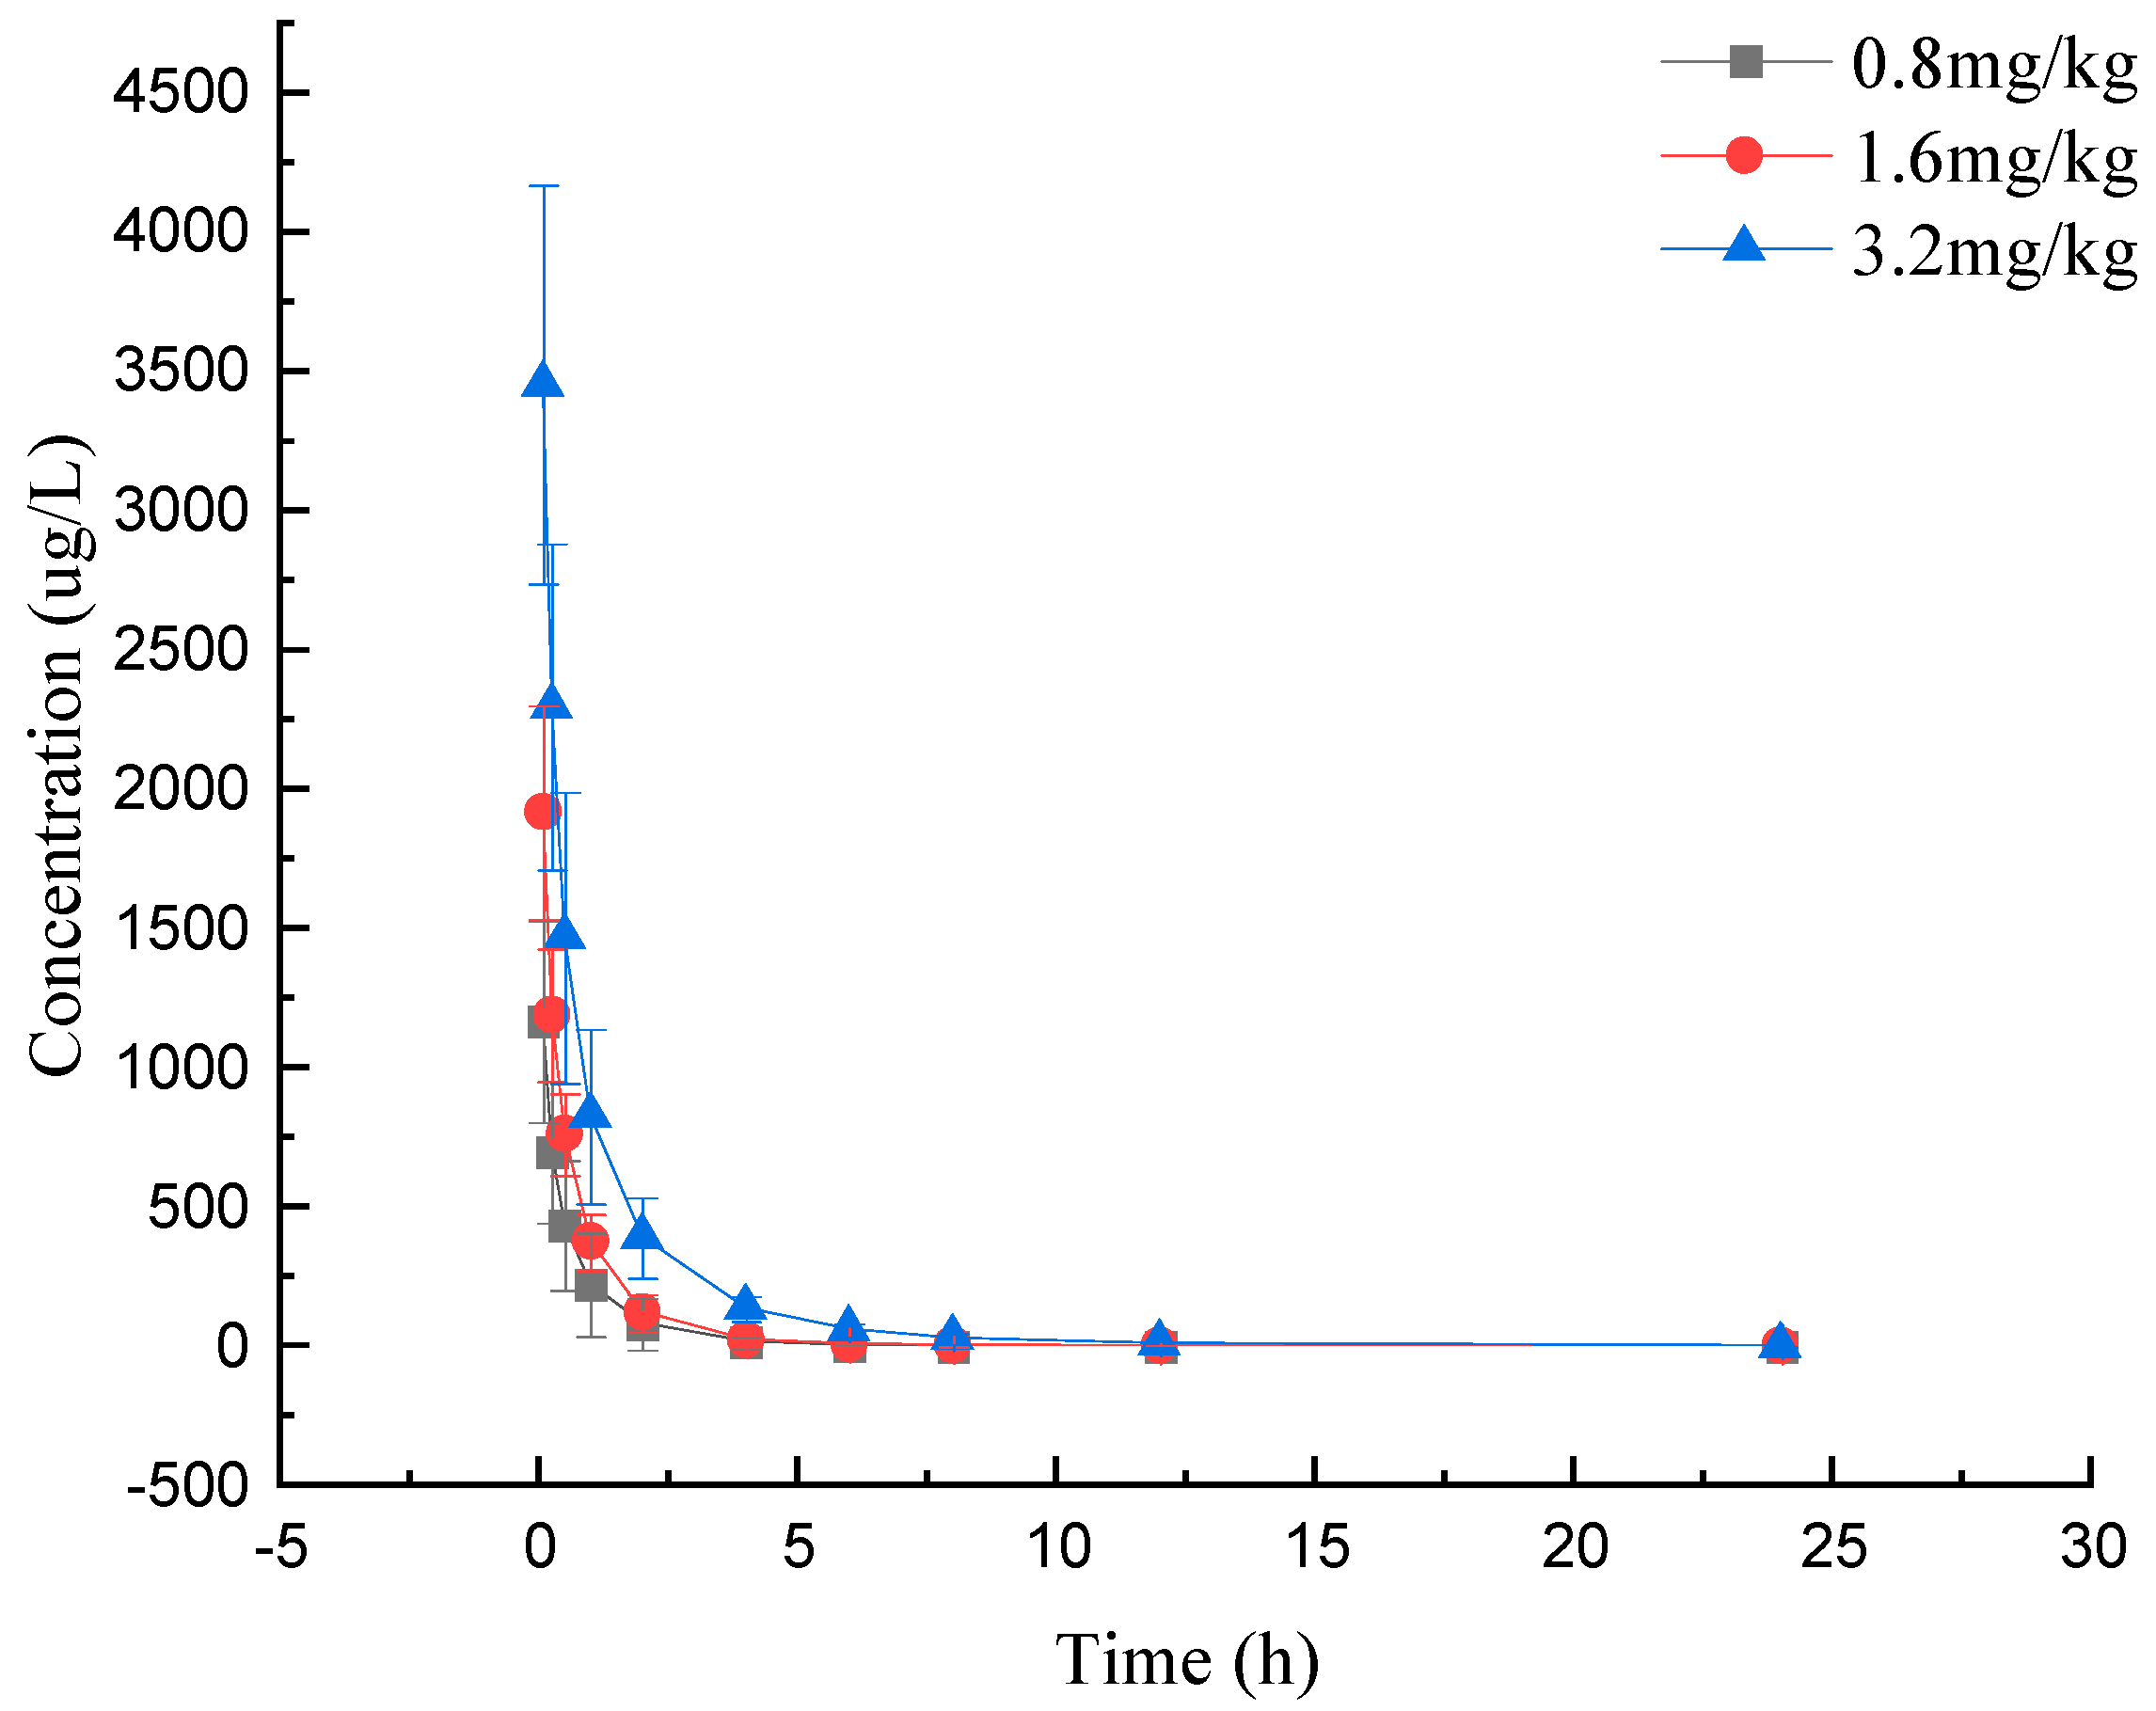
2.3. Pharmacokinetic Studies
2.4. The Distribution of Compound 1 in Brain Tissue
3. Materials and Methods
3.1. Chemicals and Reagents
3.2. Preparation of Stock Solutions
3.3. Plasma Sample Pre-Treatment
3.4. Pre-Treatment of Brain Homogenate Samples
3.5. Chromatographic and Mass Spectrometric Conditions
3.6. Method Validation
3.6.1. Selectivity
3.6.2. Linearity and the Lower Limit of Quantitation
3.6.3. Accuracy and Precision
3.6.4. Matrix Effect and Extraction Recovery
3.6.5. Stability
3.6.6. Dilution Integrity
3.7. Study of the Pharmacokinetics
3.8. Data Processing
4. Conclusions
Author Contributions
Funding
Institutional Review Board Statement
Informed Consent Statement
Data Availability Statement
Conflicts of Interest
Sample Availability
References
- Dietz, R.M.; Dingman, A.L.; Herson, P.S. Cerebral ischemia in the developing brain. J. Cereb. Blood Flow Metab. 2022, 42, 1777–1796. [Google Scholar] [CrossRef] [PubMed]
- Hernández, I.H.; Villa-González, M.; Martín, G.; Soto, M.; Pérez-Álvarez, M.J. Glial Cells as Therapeutic Approaches in Brain Ischemia-Reperfusion Injury. Cells 2021, 10, 1639. [Google Scholar] [CrossRef] [PubMed]
- Li, J.; Chordia, M.D.; Zhang, Y.; Zong, H.; Pan, D.; Zuo, Z. Critical role of FPR1 in splenocyte migration into brain to worsen inflammation and ischemic brain injury in mice. Theranostics 2022, 12, 3024–3044. [Google Scholar] [CrossRef] [PubMed]
- Wu, X.L.; Lu, S.S.; Liu, M.R.; Tang, W.D.; Chen, J.Z.; Zheng, Y.R.; Ahsan, A.; Cao, M.; Jiang, L.; Hu, W.W.; et al. Melatonin receptor agonist ramelteon attenuates mouse acute and chronic ischemic brain injury. Acta Pharmacol. Sin. 2020, 41, 1016–1024. [Google Scholar] [CrossRef]
- Pluta, R.; Ułamek-Kozioł, M.; Januszewski, S.; Czuczwar, S.J. Tau Protein Dysfunction after Brain Ischemia. J. Alzheimer’s Dis. 2018, 66, 429–437. [Google Scholar] [CrossRef]
- Yang, K.; Zeng, L.; Ge, A.; Wang, S.; Zeng, J.; Yuan, X.; Mei, Z.; Wang, G.; Ge, J. A systematic review of the research progress of non-coding RNA in neuroinflammation and immune regulation in cerebral infarction/ischemia-reperfusion injury. Front. Immunol. 2022, 13, 930171. [Google Scholar] [CrossRef]
- Neag, M.A.; Mitre, A.O.; Burlacu, C.C.; Inceu, A.I.; Mihu, C.; Melincovici, C.S.; Bichescu, M.; Buzoianu, A.D. miRNA Involvement in Cerebral Ischemia-Reperfusion Injury. Front. Neurosci. 2022, 16, 901360. [Google Scholar] [CrossRef]
- Yang, C.; Hawkins, K.E.; Doré, S.; Candelario-Jalil, E. Neuroinflammatory mechanisms of blood-brain barrier damage in ischemic stroke. Am. J. Physiol. Cell Physiol. 2019, 316, C135–C153. [Google Scholar] [CrossRef]
- Zhao, Y.; Zhang, X.; Chen, X.; Wei, Y. Neuronal injuries in cerebral infarction and ischemic stroke: From mechanisms to treatment (Review). Int. J. Mol. Med. 2022, 49, 15. [Google Scholar] [CrossRef]
- Rodriguez, C.; Agulla, J.; Delgado-Esteban, M. Refocusing the Brain: New Approaches in Neuroprotection against Ischemic Injury. Neurochem. Res. 2021, 46, 51–63. [Google Scholar] [CrossRef]
- Yang, L.; Zhao, H.; Cui, H. Treatment and new progress of neonatal hypoxic-ischemic brain damage. Histol. Histopathol. 2020, 35, 929–936. [Google Scholar] [PubMed]
- Cai, Y.; Guo, H.; Fan, Z.; Zhang, X.; Wu, D.; Tang, W.; Gu, T.; Wang, S.; Yin, A.; Tao, L.; et al. Glycogenolysis Is Crucial for Astrocytic Glycogen Accumulation and Brain Damage after Reperfusion in Ischemic Stroke. iScience 2020, 23, 101136. [Google Scholar] [CrossRef] [PubMed]
- Alarcon-Martinez, L.; Yilmaz-Ozcan, S.; Yemisci, M.; Schallek, J.; Kılıç, K.; Villafranca-Baughman, D.; Can, A.; Di Polo, A.; Dalkara, T. Retinal ischemia induces α-SMA-mediated capillary pericyte contraction coincident with perivascular glycogen depletion. Acta Neuropathol. Commun. 2019, 7, 134. [Google Scholar] [CrossRef]
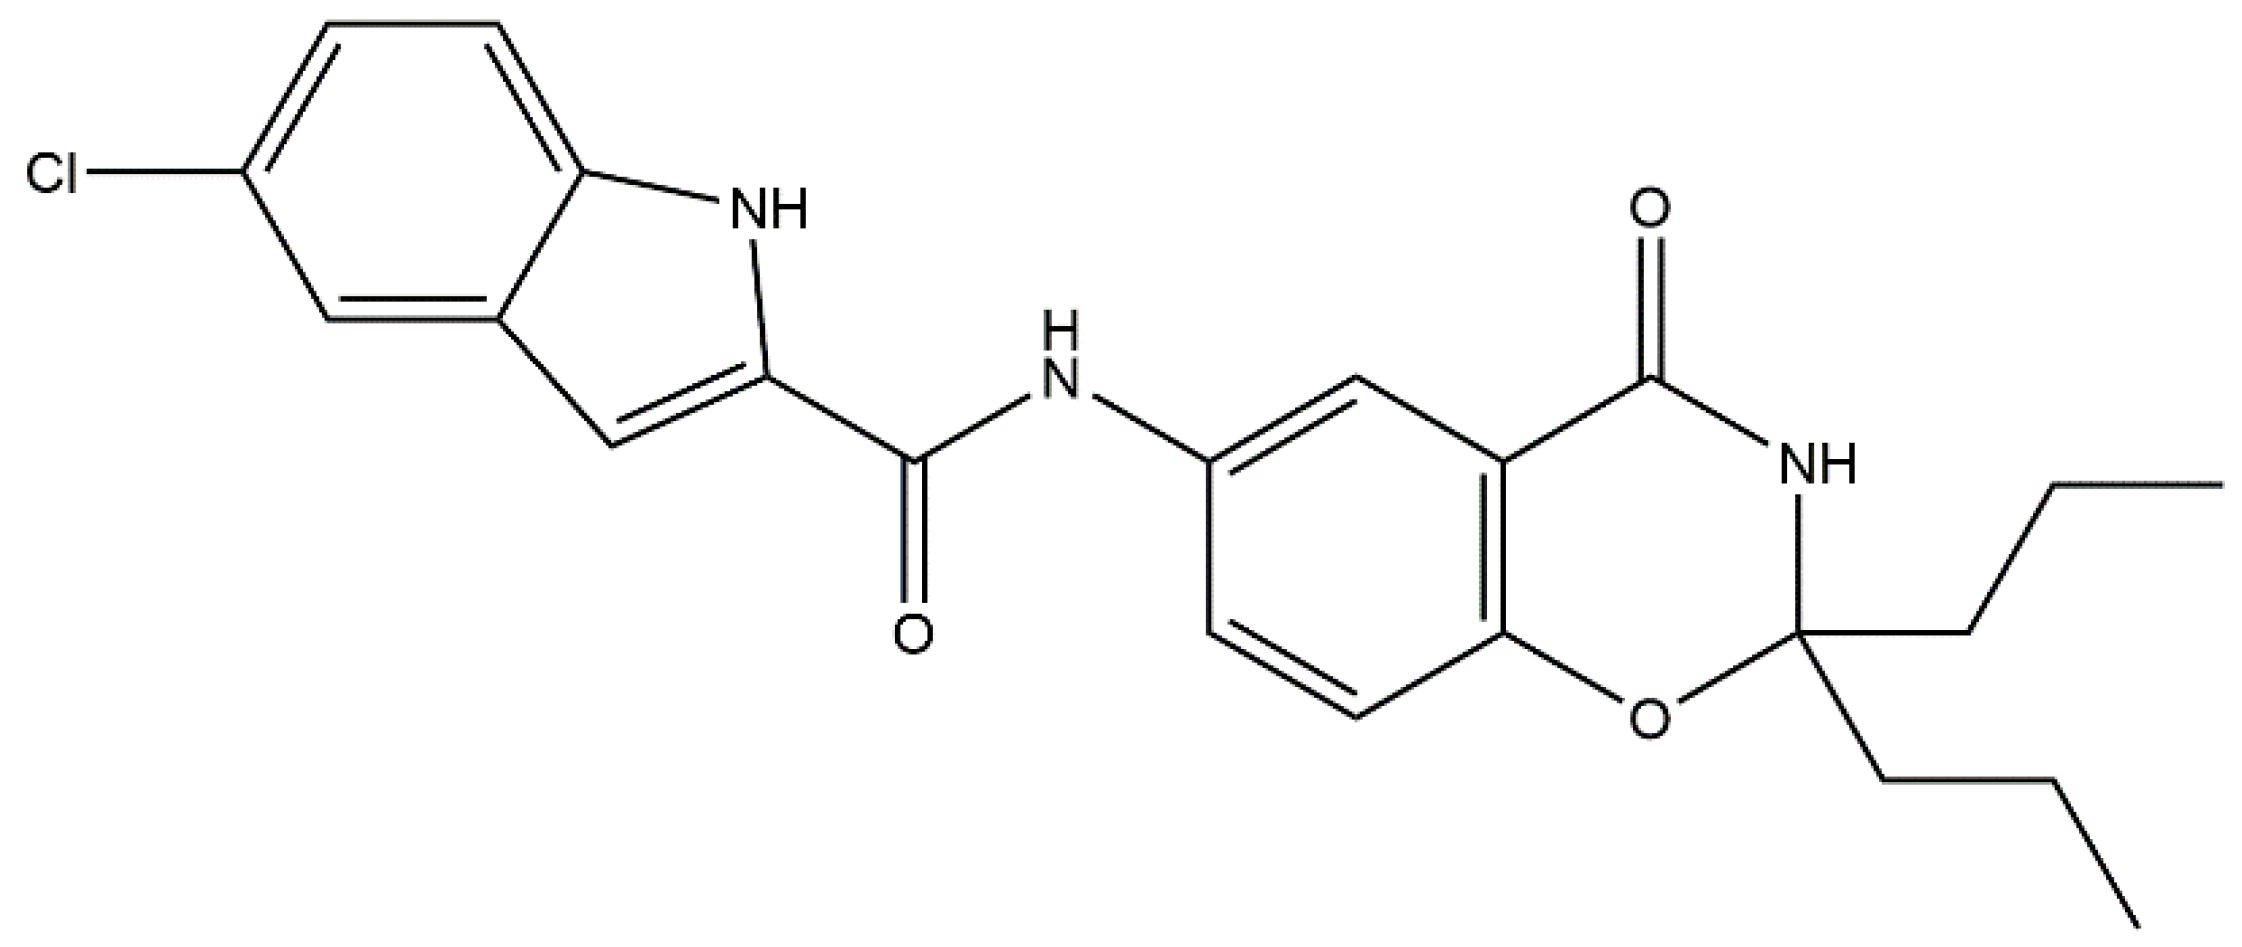
- Huang, Y.; Li, S.; Wang, Y.; Yan, Z.; Guo, Y.; Zhang, L. A Novel 5-Chloro-N-phenyl-1H-indole-2-carboxamide Derivative as Brain-Type Glycogen Phosphorylase Inhibitor: Potential Therapeutic Effect on Cerebral Ischemia. Molecules 2022, 27, 6333. [Google Scholar] [CrossRef] [PubMed]
- Huang, Y.; Li, S.; Wang, Y.; Yan, Z.; Guo, Y.; Zhang, L. A Novel 5-Chloro-N-phenyl-1H-indole-2-carboxamide Derivative as Brain-Type Glycogen Phosphorylase Inhibitor: Validation of Target PYGB. Molecules 2023, 28, 1697. [Google Scholar] [CrossRef] [PubMed]
- Merisaari, J.; Denisova, O.V.; Doroszko, M.; Le Joncour, V.; Johansson, P.; Leenders, W.P.J.; Kastrinsky, D.B.; Zaware, N.; Narla, G.; Laakkonen, P.; et al. Monotherapy efficacy of blood-brain barrier permeable small molecule reactivators of protein phosphatase 2A in glioblastoma. Brain Commun. 2020, 2, fcaa002. [Google Scholar] [CrossRef]
- Salort, G.; Álvaro-Bartolomé, M.; García-Sevilla, J.A. Ketamine-induced hypnosis and neuroplasticity in mice is associated with disrupted p-MEK/p-ERK sequential activation and sustained upregulation of survival p-FADD in brain cortex: Involvement of GABAA receptor. Prog. Neuropsychopharmacol. Biol. Psychiatry 2019, 88, 121–131. [Google Scholar] [CrossRef]
- Sang, Y.; Hou, Y.; Cheng, R.; Zheng, L.; Alvarez, A.A.; Hu, B.; Cheng, S.Y.; Zhang, W.; Li, Y.; Feng, H. Targeting PDGFRα-activated glioblastoma through specific inhibition of SHP-2-mediated signaling. Neuro-Oncology 2019, 21, 1423–1435. [Google Scholar] [CrossRef]
- Li, Y.; Li, X.; Xu, S.; Zhao, Y.; Pang, M.; Zhang, X.; Wang, X.; Wang, Y. 1,25-D3 attenuates cerebral ischemia injury by regulating mitochondrial metabolism via the AMPK/AKT/GSK3β pathway. Front. Aging Neurosci. 2022, 14, 1015453. [Google Scholar] [CrossRef]
- Brown, A.M.; Rich, L.R.; Ransom, B.R. Metabolism of glycogen in brain white matter. Brain Glycogen Metab. 2019, 23, 187–207. [Google Scholar]
- Yan, Z.; Li, S.; Wang, Y.; Li, J.; Ma, C.; Guo, Y.; Zhang, L. Discovery of novel heterocyclic derivatives as potential glycogen phosphorylase inhibitors with a cardioprotective effect. Bioorg. Chem. 2022, 129, 106120. [Google Scholar] [CrossRef] [PubMed]
- Lai, Y.; Chu, X.; Di, L.; Gao, W.; Guo, Y.; Liu, X.; Lu, C.; Mao, J.; Shen, H.; Tang, H.; et al. Recent advances in the translation of drug metabolism and pharmacokinetics science for drug discovery and development. Acta Pharm. Sin. B 2022, 12, 2751–2777. [Google Scholar] [CrossRef] [PubMed]
- Glassman, P.M.; Balthasar, J.P. Physiologically-based modeling of monoclonal antibody pharmacokinetics in drug discovery and development. Drug Metab. Pharm. 2019, 34, 3–13. [Google Scholar] [CrossRef]
- Tsivgoulis, G.; Kargiotis, O.; De Marchis, G.; Kohrmann, M.; Sandset, E.C.; Karapanayiotides, T.; de Sousa, D.A.; Sarraj, A.; Safouris, A.; Psychogios, K.; et al. Off-label use of intravenous thrombolysis for acute ischemic stroke: A critical appraisal of randomized and real-world evidence. Ther. Adv. Neurol. Disord. 2021, 14, 1756286421997368. [Google Scholar] [CrossRef] [PubMed]
- Scheid, S.; Goeller, M.; Baar, W.; Wollborn, J.; Buerkle, H.; Schlunck, G.; Lagrèze, W.; Goebel, U.; Ulbrich, F. Inhalative as well as Intravenous Administration of H2S Provides Neuroprotection after Ischemia and Reperfusion Injury in the Rats’ Retina. Int. J. Mol. Sci. 2022, 23, 5519. [Google Scholar] [CrossRef] [PubMed]
- Salahuddin, H.; Dawod, G.; Zaidi, S.F.; Shawver, J.; Burgess, R.; Jumaa, M.A. Safety of Low Dose Intravenous Cangrelor in Acute Ischemic Stroke: A Case Series. Front. Neurol. 2021, 12, 636682. [Google Scholar] [CrossRef] [PubMed]
- Hou, T.Y.; Chiang-Ni, C.; Teng, S.H. Current status of MALDI-TOF mass spectrometry in clinical microbiology. J. Food Drug Anal. 2019, 27, 404–414. [Google Scholar] [CrossRef]
- Kościelniak, P.; Nowak, P.M.; Kozak, J.; Wieczorek, M. Comprehensive Assessment of Flow and Other Analytical Methods Dedicated to the Determination of Zinc in Water. Molecules 2021, 26, 3914. [Google Scholar] [CrossRef]
- Jaekel, A.; Wirtz, M.; Lamotte, S.; Legelli, M. Performance in (Ultra-)high-performance liquid chromatography—How to qualify and optimize instruments in practice. J. Sep. Sci. 2023, 46, e2200894. [Google Scholar] [CrossRef]
- Mi, J.; Moreno, J.C.; Alagoz, Y.; Liew, K.X.; Balakrishna, A.; Zheng, X.; Al-Babili, S. Ultra-high performance liquid chromatography-mass spectrometry analysis of plant apocarotenoids. Methods Enzymol. 2022, 670, 285–309. [Google Scholar]
- Fares, M.Y.; Hegazy, M.A.; El-Sayed, G.M.; Abdelrahman, M.M.; Abdelwahab, N.S. Quality by design approach for green HPLC method development for simultaneous analysis of two thalassemia drugs in biological fluid with pharmacokinetic study. RSC Adv. 2022, 12, 13896–13916. [Google Scholar] [CrossRef] [PubMed]
- Karaer, Ö.; Dinç-Zor, Ş.; Aşçı, B. Development of a Validated Stability-Indicating HPLC Method for Vinpocetine in the Presence of Potential Impurities in Tablet Dosage Form by Multiresponse Optimization. J. AOAC Int. 2022, 105, 688–695. [Google Scholar] [CrossRef] [PubMed]
- Food and Drug Administration (FDA). Bioanalytical Method Validation: Guidance for Industry; Food and Drug Administration (FDA): Silver Spring, MD, USA, 2018. [Google Scholar]

| Conc. (ng/mL) | Intra-Day | Inter-Day | ||
|---|---|---|---|---|
| Mean ± SD | RSD (%) | RE (%) | RSD (%) | |
| 1.00 | 1.02 ± 0.26 | 11.32 | 2.41 | 11.04 |
| 2.50 | 2.67 ± 0.33 | 12.2 | 6.79 | 12.54 |
| 100.00 | 103.87 ± 5.77 | 6.23 | 3.32 | 9.35 |
| 800.00 | 809.29 ± 41.07 | 4.63 | 3.16 | 8.90 |
| Drugs | Conc. (ng/mL) | Matrix Effect | Extraction Recovery | ||
|---|---|---|---|---|---|
| Mean ± SD (%) | RSD (%) | Mean ± SD (%) | RSD (%) | ||
| Compound 1 | 2.50 | 97.69 ± 9.36 | 9.58 | 91.55± 9.73 | 10.62 |
| 100 | 96.52 ± 3.04 | 3.10 | 98.35 ± 6.42 | 6.36 | |
| 800 | 91.07± 6.05 | 7.12 | 97.54 ± 6.36 | 6.54 | |
| Psn357 | 100 | 91.09 ± 7.41 | 7.21 | 94.31 ± 6.29 | 6.15 |
| Drug | Conc. (ng/mL) | Room Temperature (12 h) | Auto-Sampler (24 h) | Storage at −20 °C (10 days) | Thaw and Freeze (from −80 °C to 25 °C) | ||||
|---|---|---|---|---|---|---|---|---|---|
| RE (%) | RSD (%) | RE (%) | RSD (%) | RE (%) | RSD (%) | RE (%) | RSD (%) | ||
| Compound 1 | 2.5 | 0.50 | 8.37 | 13.81 | 12.24 | 12.30 | 13.74 | 12.40 | 13.60 |
| 800 | 1.03 | 5.56 | −3.20 | 7.71 | −0.65 | 4.27 | −3.64 | 7.31 | |
| Working Concentration (ng/mL) | Dilution Factor | Concentration Measured (ng/mL) | Accuracy (%) | RSD (%) |
|---|---|---|---|---|
| 1000 | 10 | 1051.9 ± 112.5 | 105.2 | 10.6 |
| 500 | 20 | 512.4 ± 33.6 | 102.5 | 6.6 |
| 100 | 100 | 99.5 ± 3.4 | 99.5 | 3.5 |
| Dosage (mg/kg) | AUC0–t (h·μg/L) | AUC0–∞ (h·μg/L) | Cmax (μg/L) | CL (L/h/kg) | T1/2 (h) | Vd (L/kg) |
|---|---|---|---|---|---|---|
| 0.8 (iv) | 894.91 ± 440.19 | 899.91 ± 441.17 | 1176.62 ± 361.31 | 1.00 ± 0.29 | 4.56 ± 2.17 | 6.43 ± 3.48 |
| 1.6 (iv) | 1601.27 ± 372.00 | 1612.30 ± 371.05 | 2034.41 ± 289.32 | 1.04 ± 0.25 | 4.80 ± 3.22 | 7.51 ± 6.15 |
| 3.2 (iv) | 3625.09 ± 969.80 | 3631.04 ± 972.98 | 3710.23 ± 682.91 | 0.94 ± 0.27 | 3.08 ± 0.58 | 4.14 ± 1.23 |
| Conc. (ng/g) | 0.25 (h) | 2 (h) | 8 (h) |
|---|---|---|---|
| CBrain | 440.0 ± 19.1 | 111.0 ± 23.9 | 4.2 ± 7.2 |
| CPlasma | 4019.0 ± 677.0 | 1019.0 ± 275.0 | 32.9 ± 14.5 |
| Ratio | 0.25 (h) | 2 (h) | 8 (h) |
|---|---|---|---|
| CBrain/CPlasma | 0.11 ± 0.019 | 0.11 ± 0.029 | 0.09 ± 0.148 |
| Substrates | AUC0–∞ (h·ng/g) | Cmax (ng/g) | Tmax (h) | T1/2 (h) | MRT (h) |
|---|---|---|---|---|---|
| Plasma | 6659 | 4889 | 0 | 1.14 | 1.47 |
| Brain tissue | 668 | 440 | 0.25 | 1.18 | 1.65 |
Disclaimer/Publisher’s Note: The statements, opinions and data contained in all publications are solely those of the individual author(s) and contributor(s) and not of MDPI and/or the editor(s). MDPI and/or the editor(s) disclaim responsibility for any injury to people or property resulting from any ideas, methods, instructions or products referred to in the content. |
© 2023 by the authors. Licensee MDPI, Basel, Switzerland. This article is an open access article distributed under the terms and conditions of the Creative Commons Attribution (CC BY) license (https://creativecommons.org/licenses/by/4.0/).
Share and Cite
Xu, S.; Li, S.; Yan, Z.; Wang, Y.; Zhang, L. Development and Validation of a UHPLC–MS/MS Method for the Quantification of a Novel PYGB Inhibitor in Plasma: Application to Pharmacokinetic Studies. Molecules 2023, 28, 6995. https://doi.org/10.3390/molecules28196995
Xu S, Li S, Yan Z, Wang Y, Zhang L. Development and Validation of a UHPLC–MS/MS Method for the Quantification of a Novel PYGB Inhibitor in Plasma: Application to Pharmacokinetic Studies. Molecules. 2023; 28(19):6995. https://doi.org/10.3390/molecules28196995
Chicago/Turabian StyleXu, Sumei, Shuai Li, Zhiwei Yan, Youde Wang, and Liying Zhang. 2023. "Development and Validation of a UHPLC–MS/MS Method for the Quantification of a Novel PYGB Inhibitor in Plasma: Application to Pharmacokinetic Studies" Molecules 28, no. 19: 6995. https://doi.org/10.3390/molecules28196995
APA StyleXu, S., Li, S., Yan, Z., Wang, Y., & Zhang, L. (2023). Development and Validation of a UHPLC–MS/MS Method for the Quantification of a Novel PYGB Inhibitor in Plasma: Application to Pharmacokinetic Studies. Molecules, 28(19), 6995. https://doi.org/10.3390/molecules28196995