


Preventing Adipogenesis and Preserving Mitochondria and GLUT-4 Functions by Extracts and Isolated Compounds of Australian Acacia saligna


Abstract
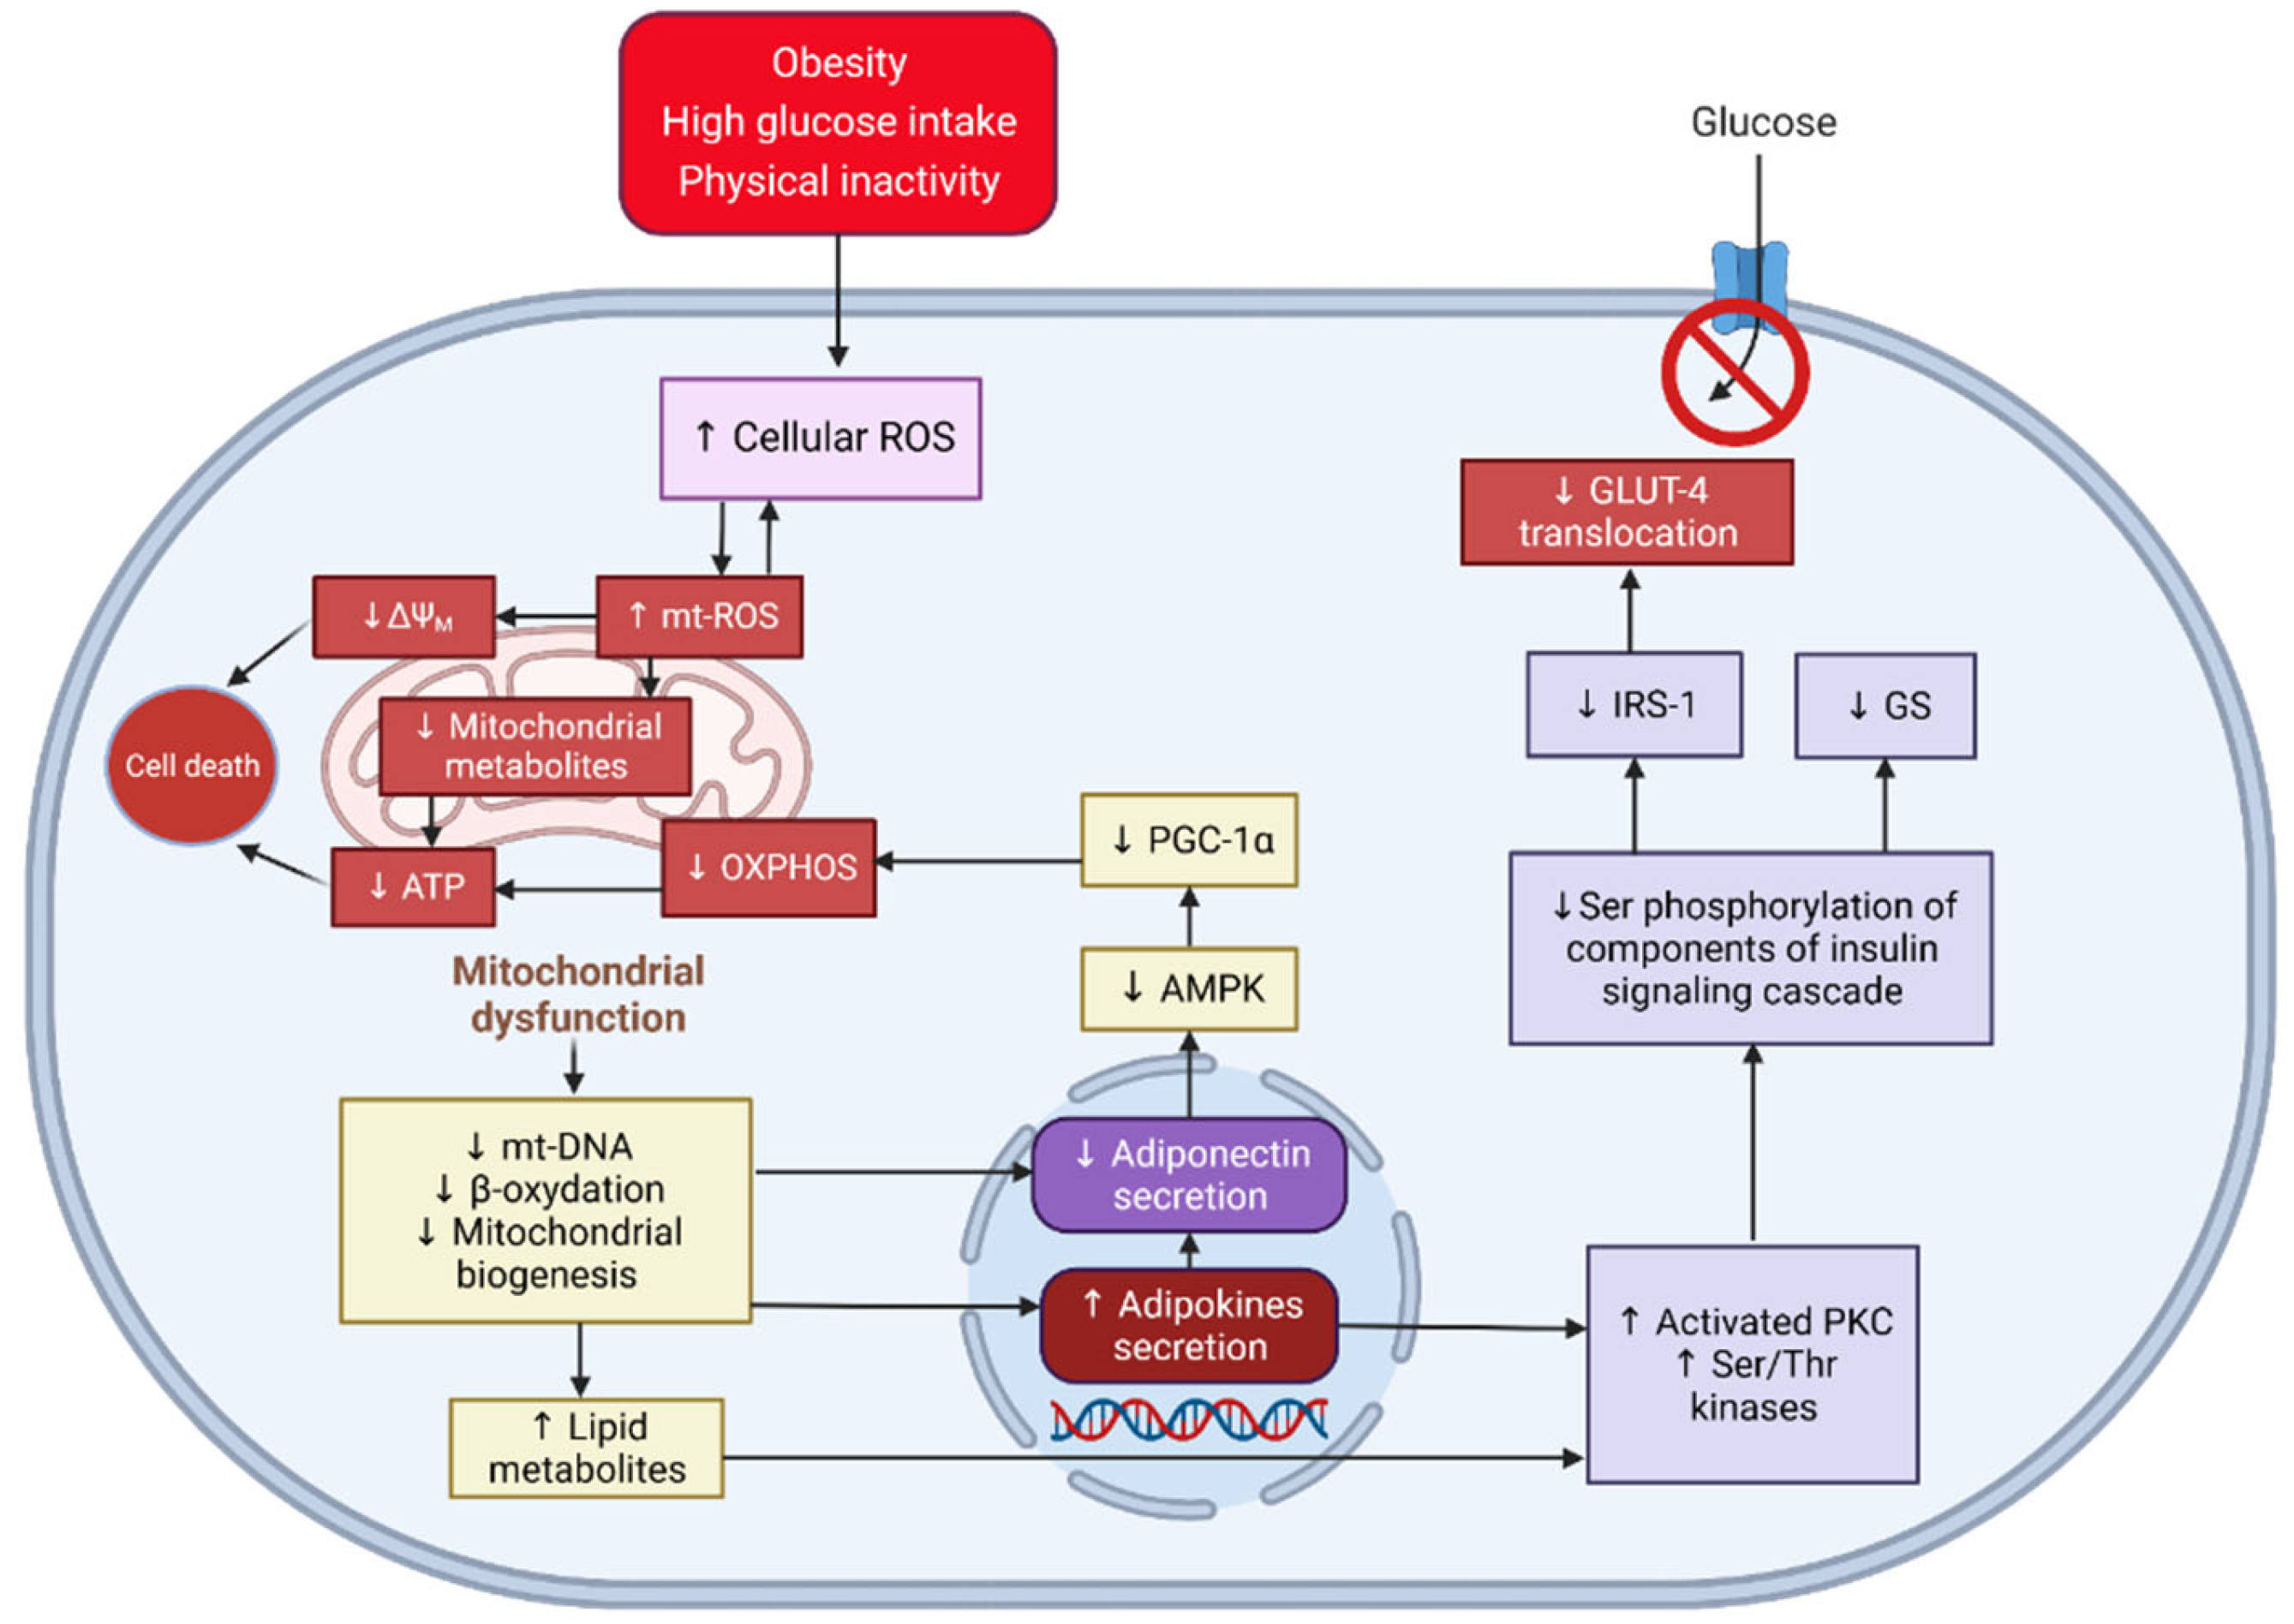
:1. Introduction

| Compounds | Extract/Amount (%w/w Extract) | Compound | Extract/Amount (%w/w Extract) |
|---|---|---|---|
 | FL-MeOH/1.75 |  | LF-MeOH/8 |
 | FL-MeOH/2.58 |  | LF-MeOH and BK-MeOH/0.9 b, 2.53 c |
 | FL/MeOH/1.52 |  | LF-MeOH/1 |
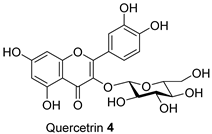 | FL-MeOH and LF-MeOH/4.13 a, 2.68 b |  | LF-MeOH/5 |
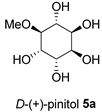 | FL-MeOH and BK-MeOH/2.5 a, 17.83 c | 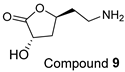 | LF-MeOH/5 |
2. Results and Discussion
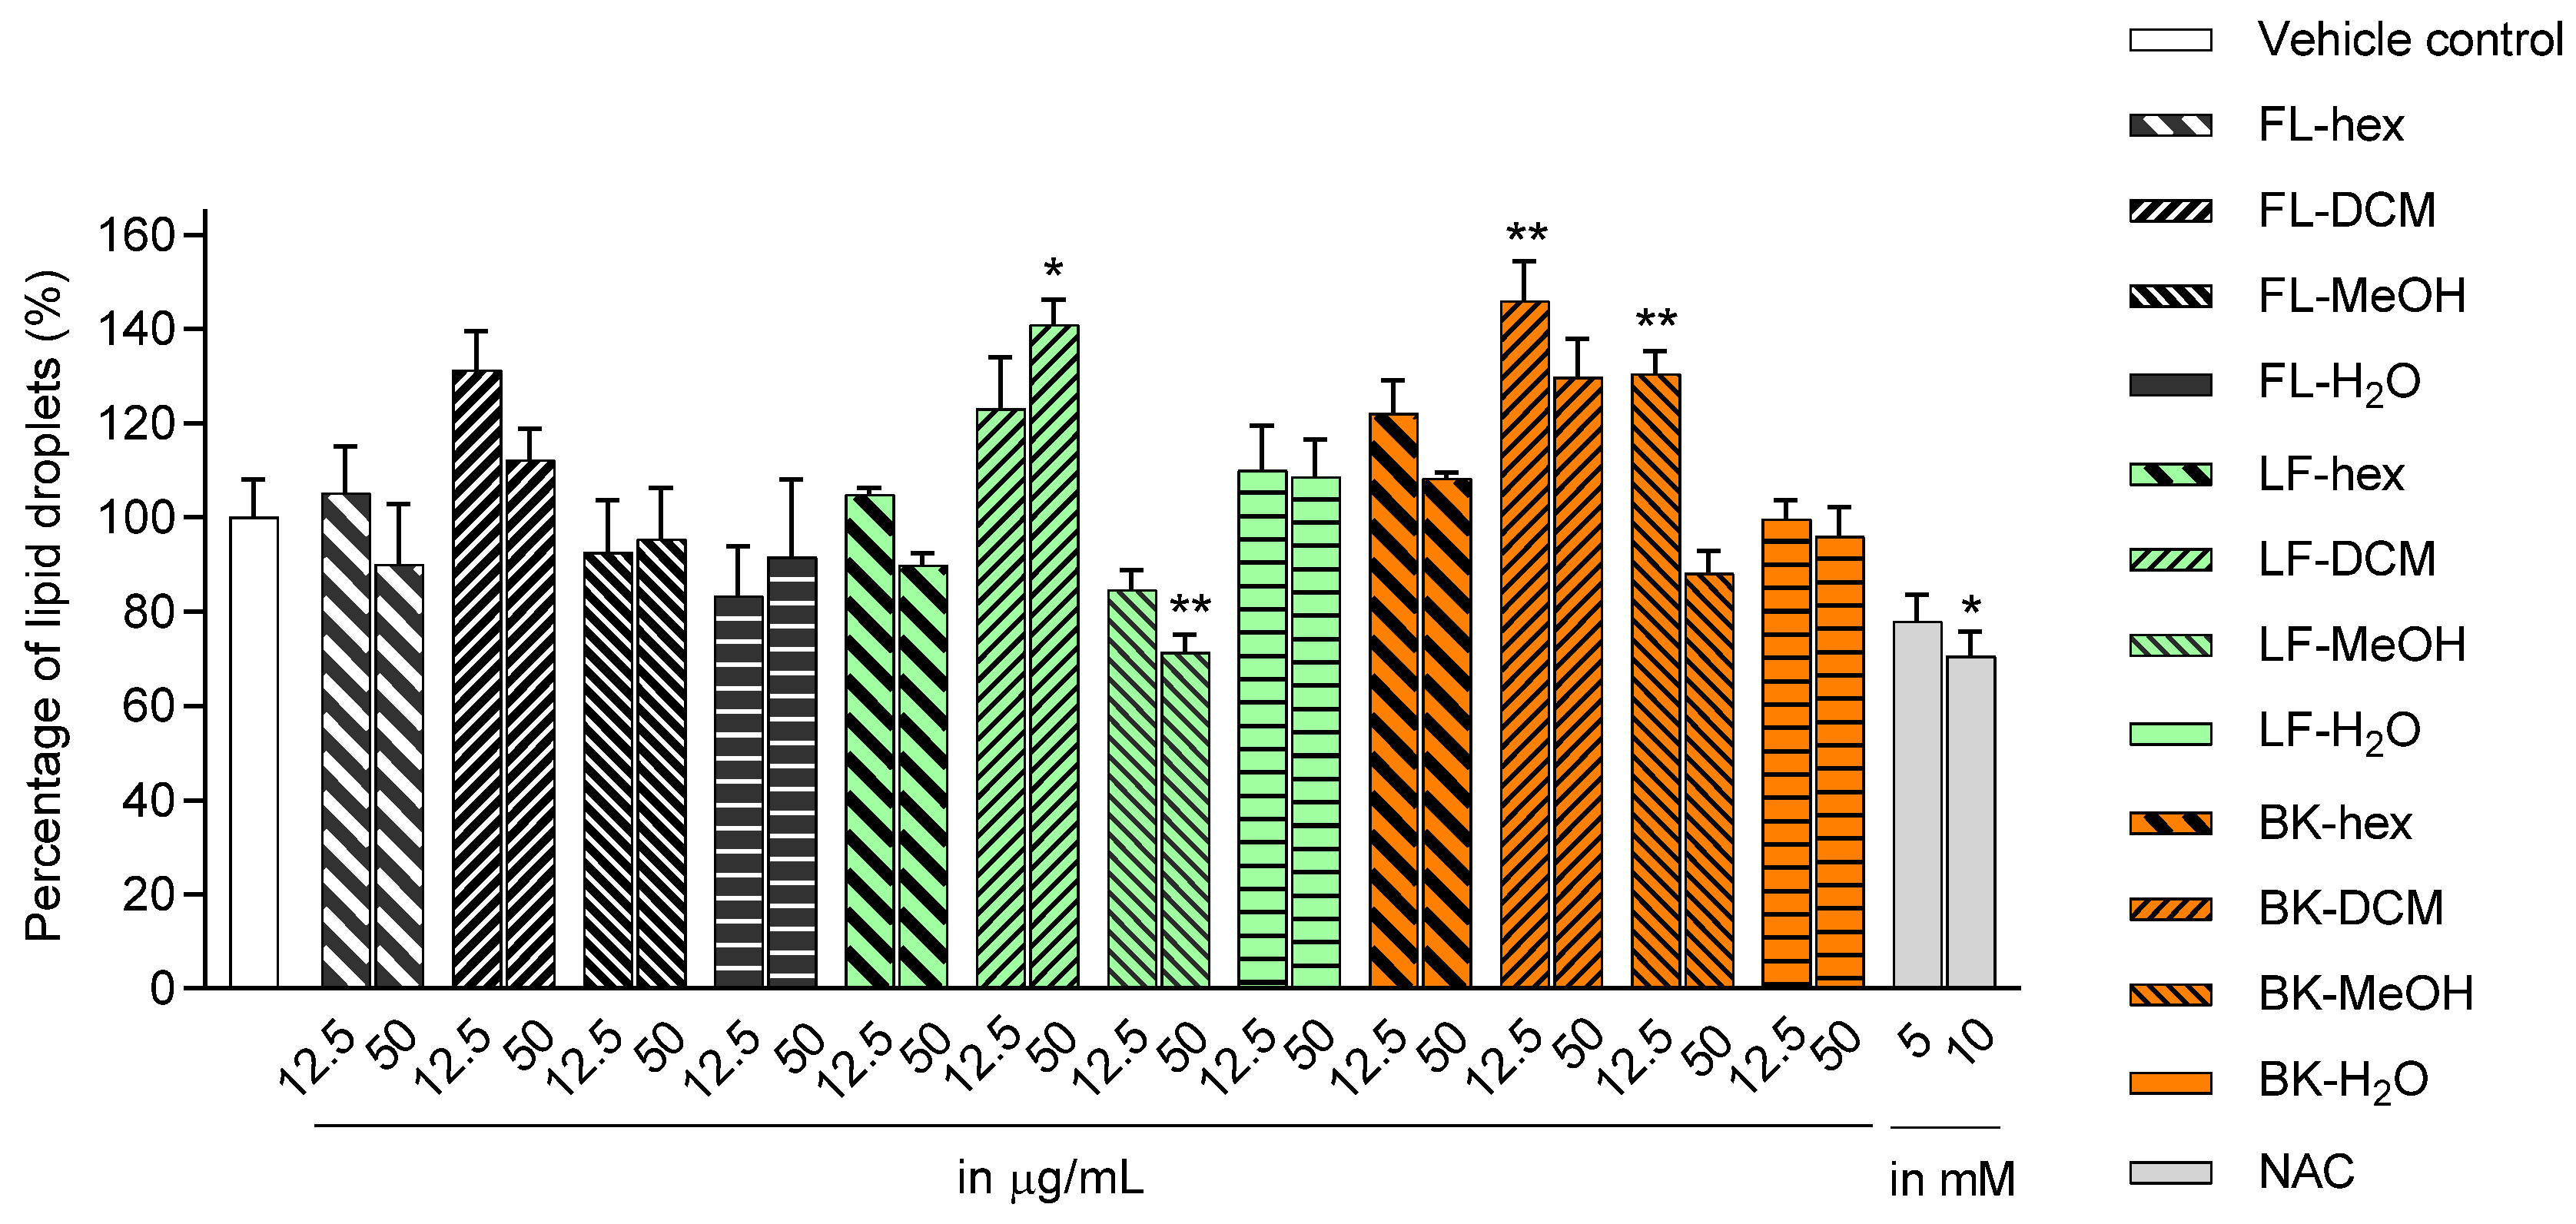
2.1. Lipid Accumulation in 3T3-L1 Adipocytes Treated with Extracts and Isolated Compounds
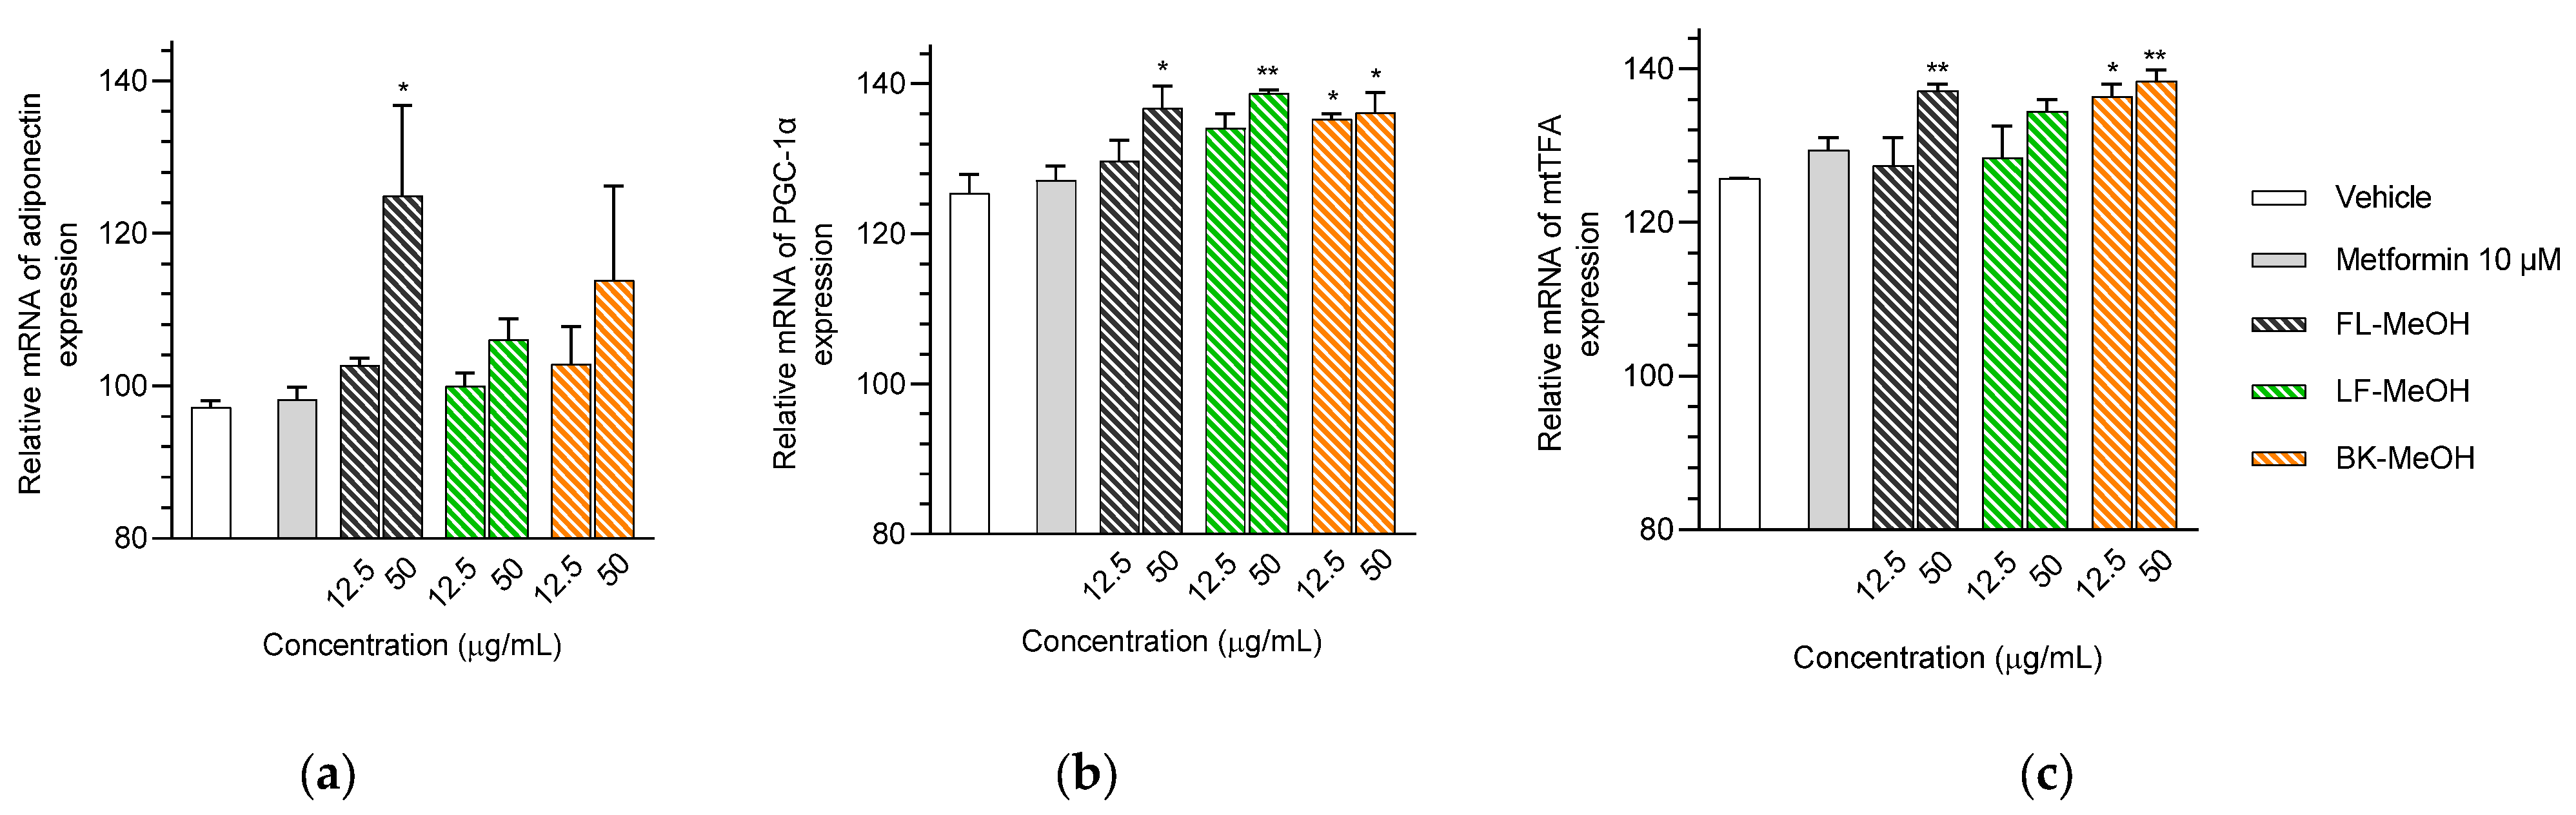
2.2. Expression of mRNAs Related to the Mitochondrial Biogenesis of Adipocytes
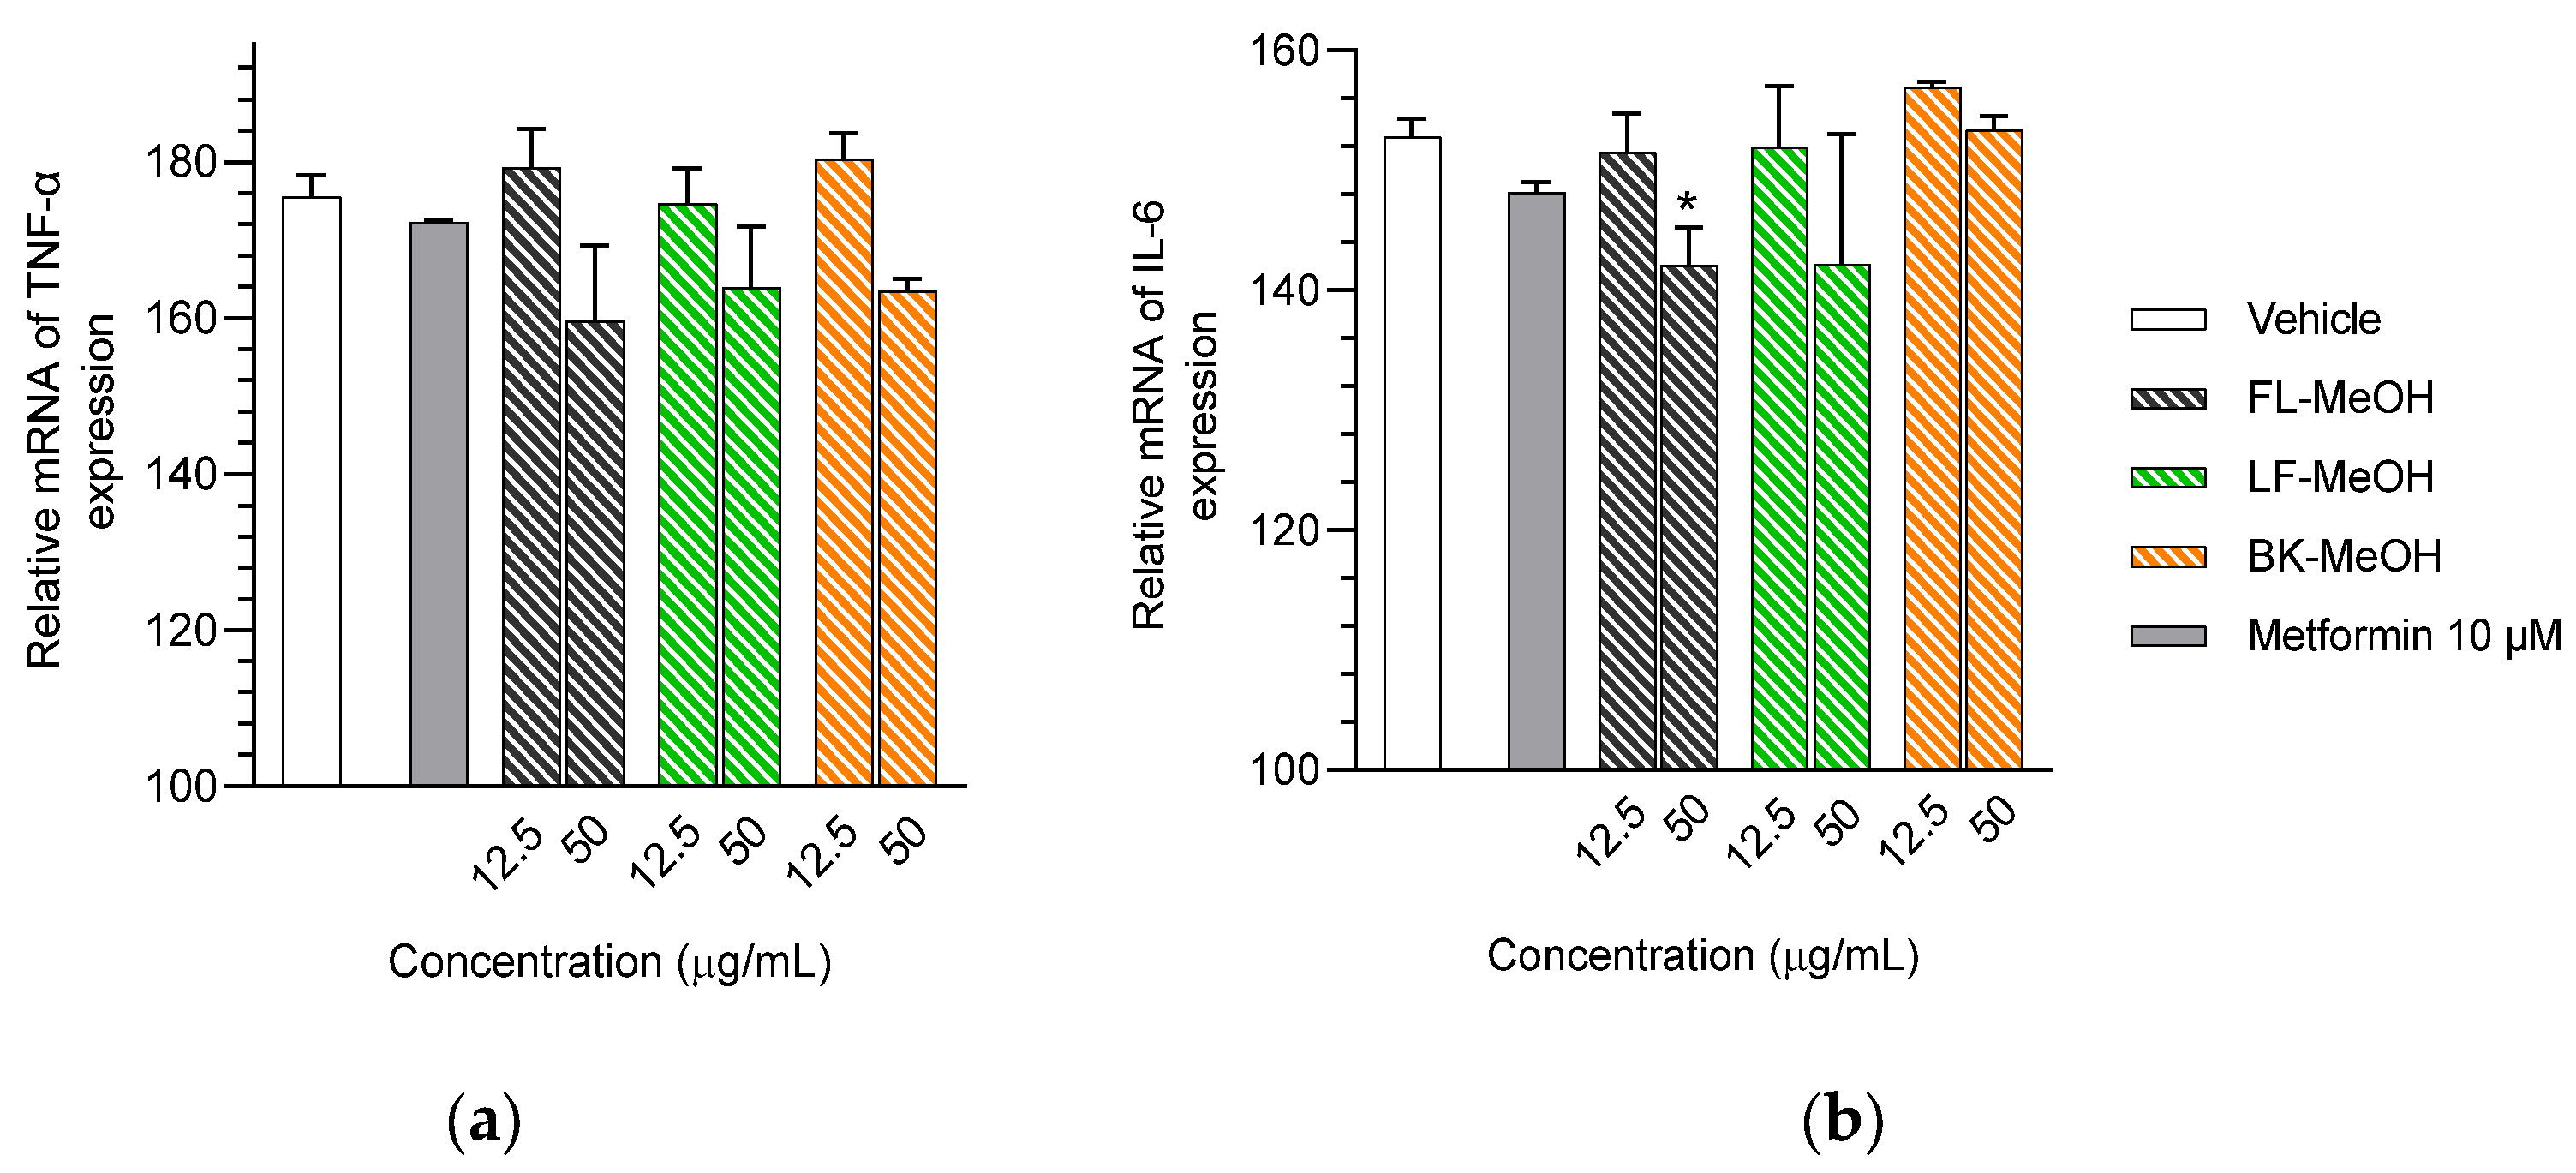
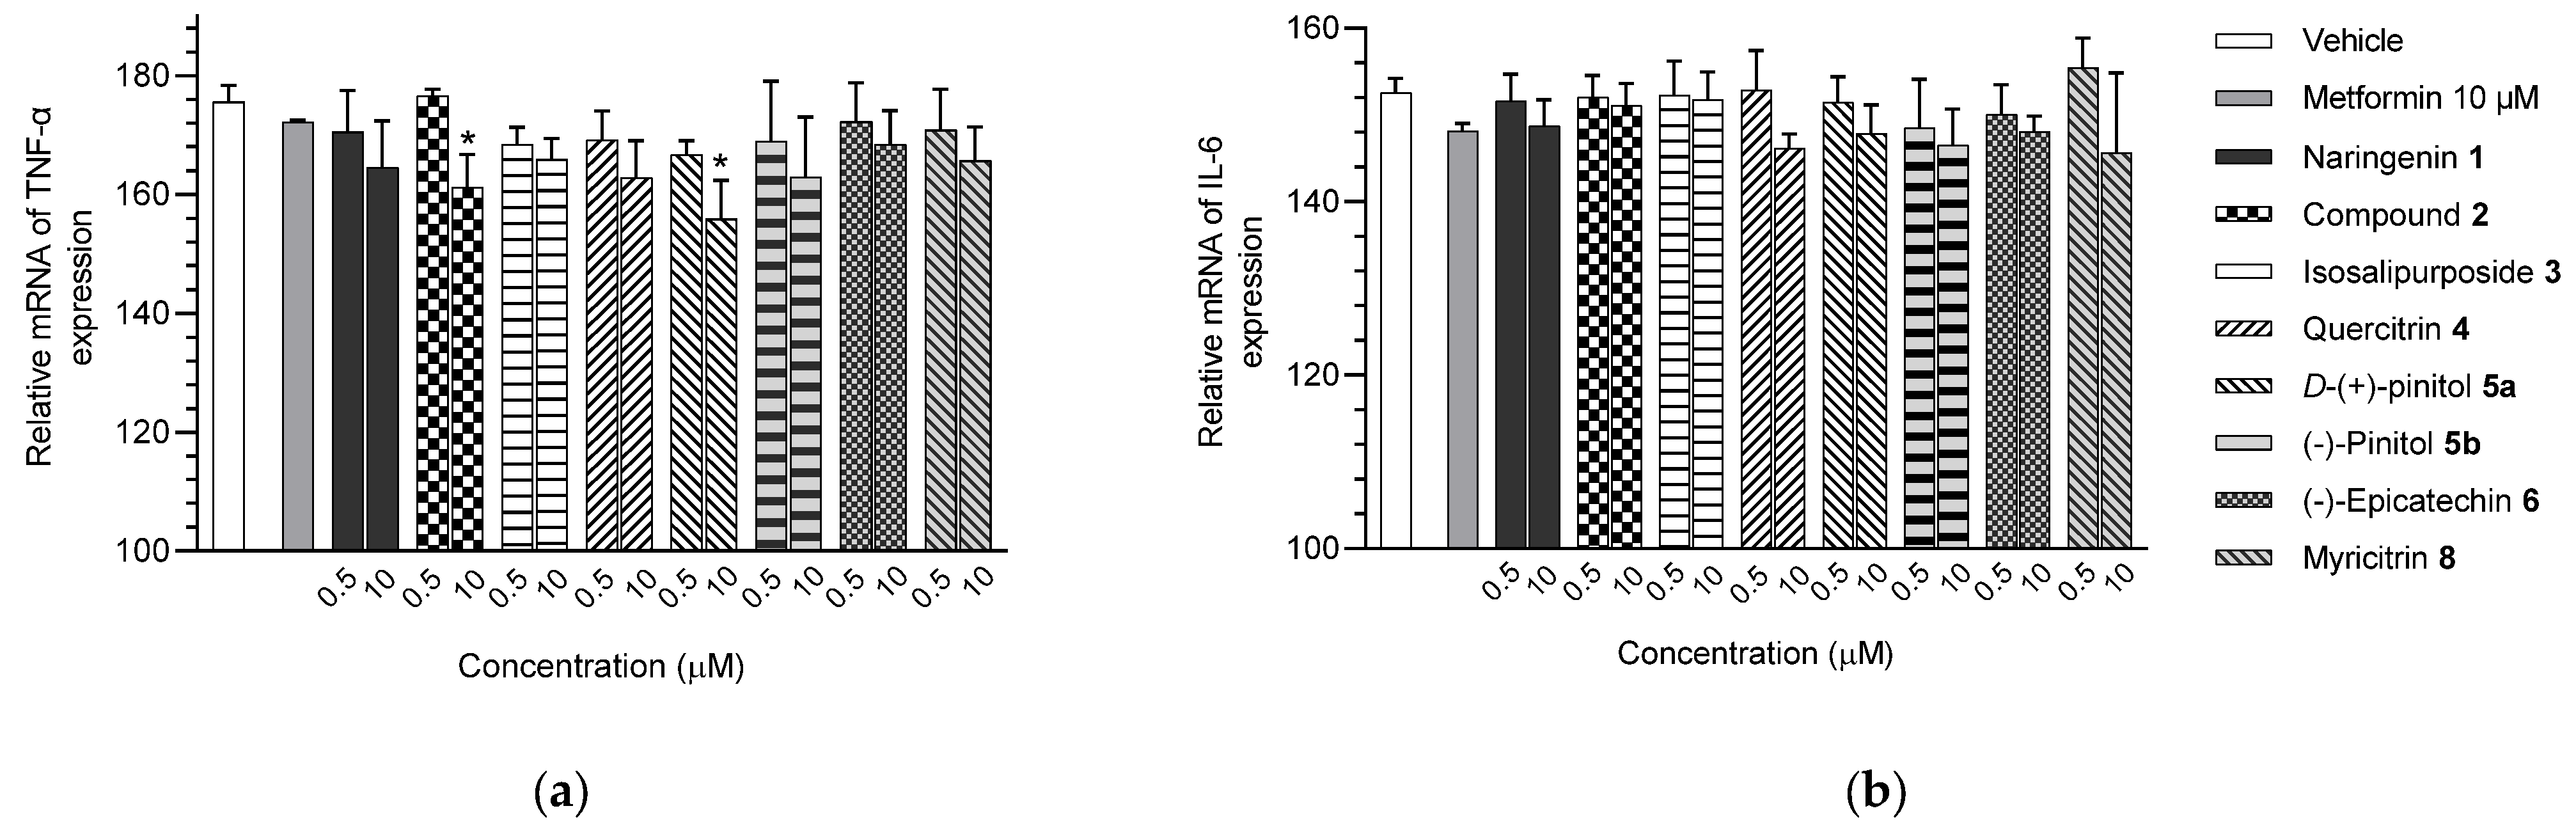
2.3. Expression of mRNAs of Inflammatory Markers of Adipocytes
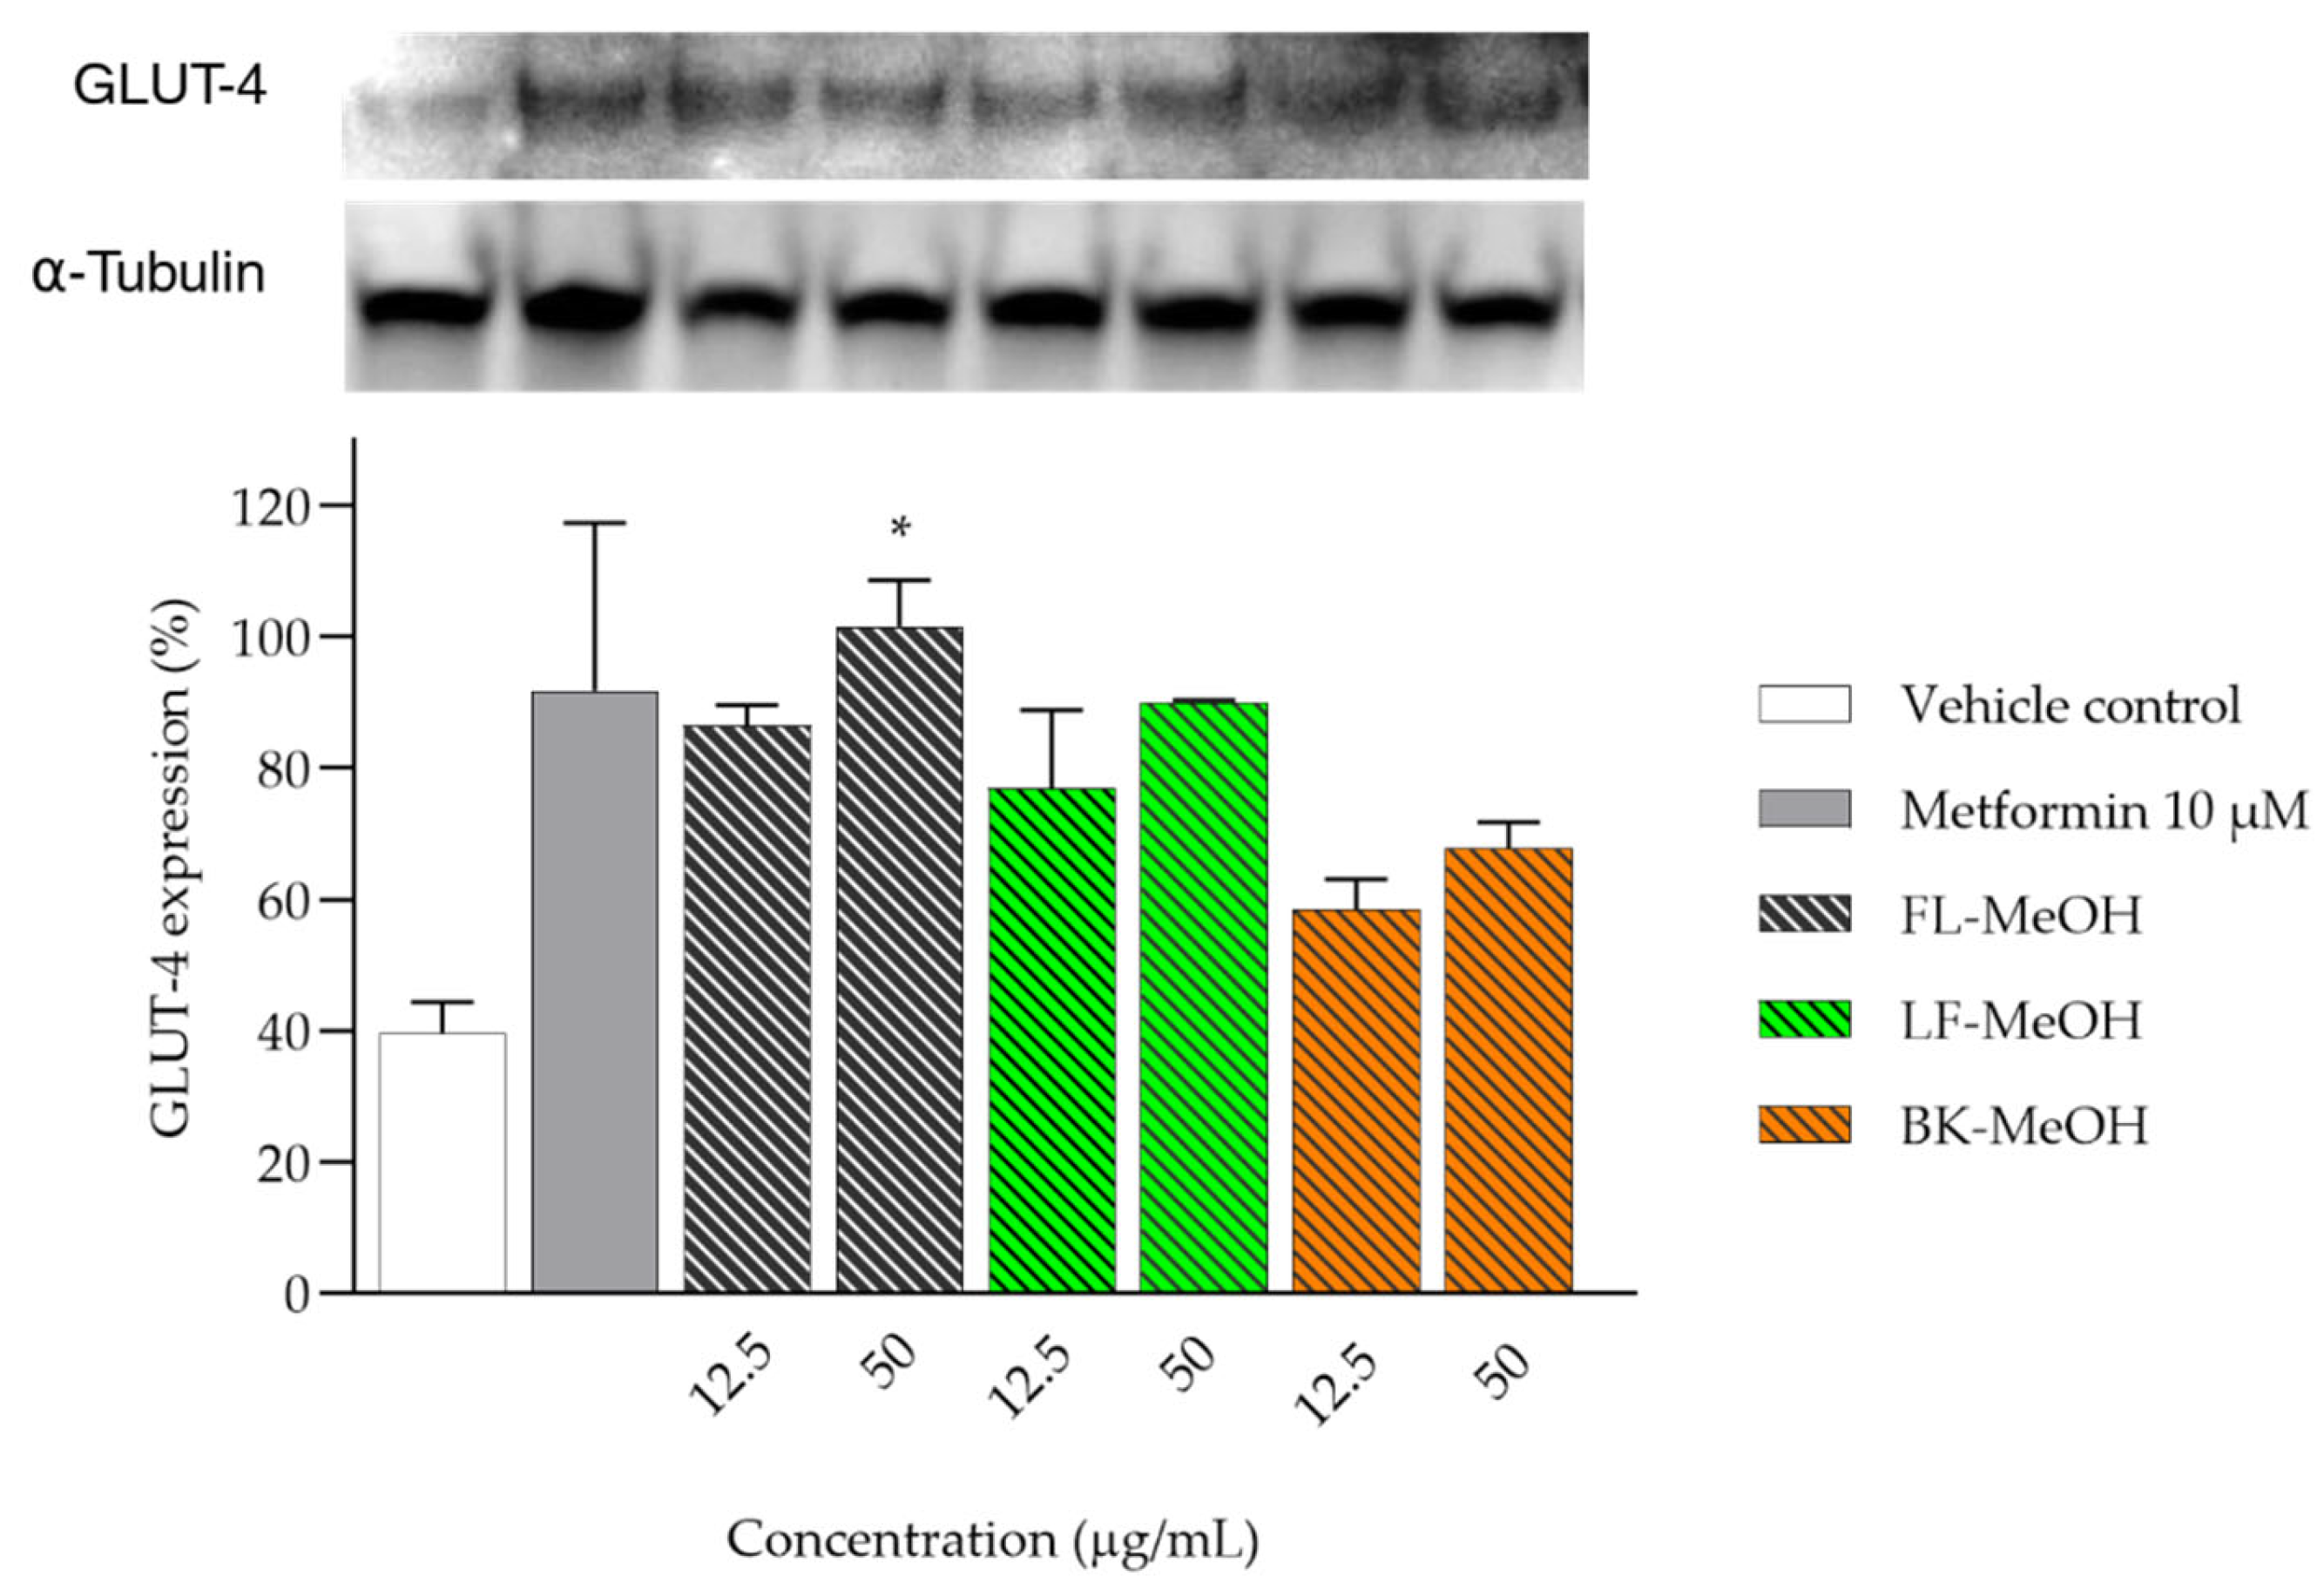
2.4. Expression of GLUT-4 of 3T3-L1 Adipocytes Treated with MeOH Extracts
3. Materials and Methods
3.1. Materials
3.2. Differentiation of 3T3-L1 Cells
3.3. Estimation of Lipid Accumulation Using Oil Red O (ORO) Assay
3.4. Quantitative Reverse Transcription–Polymerase Chain Reaction (RT-qPCR)
3.5. Western Blot Analysis
3.6. Statistical Analysis
4. Conclusions
Supplementary Materials
Author Contributions
Funding
Institutional Review Board Statement
Informed Consent Statement
Data Availability Statement
Acknowledgments
Conflicts of Interest
Sample Availability
References
- Al-Goblan, A.S.; Al-Alfi, M.A.; Khan, M.Z. Mechanism linking diabetes mellitus and obesity. Diabetes Metab. Syndr. Obes. Targets Ther. 2014, 7, 587. [Google Scholar] [CrossRef] [PubMed]
- Ford, E.S.; Williamson, D.F.; Liu, S. Weight change and diabetes incidence: Findings from a national cohort of US adults. Am. J. Epidemiol. 1997, 146, 214–222. [Google Scholar] [CrossRef] [PubMed]
- Golay, A.; Ybarra, J. Link between obesity and type 2 diabetes. Best Pract. Res. Clin. Endocrinol. Metab. 2005, 19, 649–663. [Google Scholar] [CrossRef] [PubMed]
- Pi, J.; Collins, S. Reactive oxygen species and uncoupling protein 2 in pancreatic β-cell function. Diabetes Obes. Metab. 2010, 12, 141–148. [Google Scholar] [CrossRef] [PubMed]
- Gao, C.L.; Zhu, C.; Zhao, Y.P.; Chen, X.H.; Ji, C.B.; Zhang, C.M.; Zhu, J.G.; Xia, Z.K.; Tong, M.L.; Guo, X.R. Mitochondrial dysfunction is induced by high levels of glucose and free fatty acids in 3T3-L1 adipocytes. Mol. Cell. Endocrinol. 2010, 320, 25–33. [Google Scholar] [CrossRef]
- Asmara, A.P.; Prasansuklab, A.; Tencomnao, T.; Ung, A.T. Identification of Phytochemicals in Bioactive Extracts of Acacia saligna Growing in Australia. Molecules 2023, 28, 1028. [Google Scholar] [CrossRef]
- Hunter, C.A.; Kartal, F.; Koc, Z.C.; Murphy, T.; Kim, J.H.; Denvir, J.; Koc, E.C. Mitochondrial oxidative phosphorylation is impaired in TALLYHO mice, a new obesity and type 2 diabetes animal model. Int. J. Biochem. Cell Biol. 2019, 116, 105616. [Google Scholar] [CrossRef] [PubMed]
- Wu, Z.; Puigserver, P.; Andersson, U.; Zhang, C.; Adelmant, G.; Mootha, V.; Troy, A.; Cinti, S.; Lowell, B.; Scarpulla, R.C. Mechanisms controlling mitochondrial biogenesis and respiration through the thermogenic coactivator PGC-1. Cell 1999, 98, 115–124. [Google Scholar] [CrossRef] [PubMed]
- Skov, V.; Glintborg, D.; Knudsen, S.; Jensen, T.; Kruse, T.A.; Tan, Q.; Brusgaard, K.; Beck-Nielsen, H.; Højlund, K. Reduced expression of nuclear-encoded genes involved in mitochondrial oxidative metabolism in skeletal muscle of insulin-resistant women with polycystic ovary syndrome. Diabetes 2007, 56, 2349–2355. [Google Scholar] [CrossRef] [PubMed]
- Heinonen, S.; Buzkova, J.; Muniandy, M.; Kaksonen, R.; Ollikainen, M.; Ismail, K.; Hakkarainen, A.; Lundbom, J.; Lundbom, N.; Vuolteenaho, K. Impaired mitochondrial biogenesis in adipose tissue in acquired obesity. Diabetes 2015, 64, 3135–3145. [Google Scholar] [CrossRef]
- Jäger, S.; Handschin, C.; St.-Pierre, J.; Spiegelman, B.M. AMP-activated protein kinase (AMPK) action in skeletal muscle via direct phosphorylation of PGC-1α. Proc. Natl. Acad. Sci. USA 2007, 104, 12017–12022. [Google Scholar] [CrossRef] [PubMed]
- Iwabu, M.; Yamauchi, T.; Okada-Iwabu, M.; Sato, K.; Nakagawa, T.; Funata, M.; Yamaguchi, M.; Namiki, S.; Nakayama, R.; Tabata, M. Adiponectin and AdipoR1 regulate PGC-1α and mitochondria by Ca2+ and AMPK/SIRT1. Nature 2010, 464, 1313–1319. [Google Scholar] [CrossRef] [PubMed]
- Choi, Y.M.; Kim, H.K.; Shim, W.; Anwar, M.A.; Kwon, J.W.; Kwon, H.K.; Kim, H.J.; Jeong, H.; Kim, H.M.; Hwang, D. Mechanism of cisplatin-induced cytotoxicity is correlated to impaired metabolism due to mitochondrial ROS generation. PLoS ONE 2015, 10, e0135083. [Google Scholar] [CrossRef] [PubMed]
- Kusminski, C.M.; Scherer, P.E. Mitochondrial dysfunction in white adipose tissue. Trends Endocrinol. Metab. 2012, 23, 435–443. [Google Scholar] [CrossRef] [PubMed]
- Wang, C.H.; Wang, C.C.; Huang, H.C.; Wei, Y.H. Mitochondrial dysfunction leads to impairment of insulin sensitivity and adiponectin secretion in adipocytes. FEBS J. 2013, 280, 1039–1050. [Google Scholar] [CrossRef]
- Højlund, K.; Mogensen, M.; Sahlin, K.; Beck-Nielsen, H. Mitochondrial dysfunction in type 2 diabetes and obesity. Endocrinol. Metab. Clin. N. Am. 2008, 37, 713–731. [Google Scholar] [CrossRef] [PubMed]
- Hammarstedt, A.; Jansson, P.-A.; Wesslau, C.; Yang, X.; Smith, U. Reduced expression of PGC-1 and insulin-signaling molecules in adipose tissue is associated with insulin resistance. Biochem. Biophys. Res. Commun. 2003, 301, 578–582. [Google Scholar] [CrossRef]
- Serra, D.; Mera, P.; Malandrino, M.I.; Mir, J.F.; Herrero, L. Mitochondrial fatty acid oxidation in obesity. Antioxid. Redox Signal. 2013, 19, 269–284. [Google Scholar] [CrossRef]
- Jayarathne, S.; Stull, A.J.; Miranda, A.; Scoggin, S.; Claycombe-Larson, K.; Kim, J.H.; Moustaid-Moussa, N. Tart cherry reduces inflammation in adipose tissue of zucker fatty rats and cultured 3T3-L1 adipocytes. Nutrients 2018, 10, 1576. [Google Scholar] [CrossRef]
- Asmara, A.P.; Prasansuklab, A.; Chiabchalard, A.; Chen, H.; Ung, A.T. Antihyperglycemic Properties of Extracts and Isolated Compounds from Australian Acacia saligna on 3T3-L1 Adipocytes. Molecules 2023, 28, 4054. [Google Scholar] [CrossRef]
- Rebello, C.J.; Greenway, F.L.; Lau, F.H.; Lin, Y.; Stephens, J.M.; Johnson, W.D.; Coulter, A.A. Naringenin promotes thermogenic gene expression in human white adipose tissue. Obesity 2019, 27, 103–111. [Google Scholar] [CrossRef] [PubMed]
- L’Abbate, S.; Nicolini, G.; Forini, F.; Marchetti, S.; Di Lascio, N.; Faita, F.; Kusmic, C. Myo–inositol and D-Chiro–inositol oral supplementation ameliorate cardiac dysfunction and remodeling in a mouse model of diet-induced obesity. Pharmacol. Res. 2020, 159, 105047. [Google Scholar] [CrossRef] [PubMed]
- Sente, T.; Van Berendoncks, A.M.; Fransen, E.; Vrints, C.J.; Hoymans, V.Y. Tumor necrosis factor-α impairs adiponectin signalling, mitochondrial biogenesis, and myogenesis in primary human myotubes cultures. Am. J. Physiol.-Heart Circ. Physiol. 2016, 310, H1164–H1175. [Google Scholar] [CrossRef] [PubMed]
- Yi, Z.; Wu, Y.; Zhang, W.; Wang, T.; Gong, J.; Cheng, Y.; Miao, C. Activator-mediated pyruvate kinase M2 activation contributes to endotoxin tolerance by promoting mitochondrial biogenesis. Front. Immunol. 2021, 11, 595316. [Google Scholar] [CrossRef]
- Davargaon, R.S.; Sambe, A.D.; Muthangi VV, S. Trolox prevents high glucose-induced apoptosis in rat myocardial H9c2 cells by regulating GLUT-4 and antioxidant defense mechanism. IUBMB Life 2019, 71, 1876–1895. [Google Scholar] [CrossRef]
- Miao, L.; Zhang, H.; Cheong, M.S.; Zhong, R.; Garcia-Oliveira, P.; Prieto, M.A.; Cheng, K.-W.; Wang, M.; Cao, H.; Nie, S. Anti-diabetic potential of apigenin, luteolin, and baicalein via partially activating PI3K/Akt/Glut-4 signaling pathways in insulin-resistant HepG2 cells. Food Sci. Hum. Wellness 2023, 12, 1991–2000. [Google Scholar] [CrossRef]
- De Oliveira, G.P.; Cortez, E.; Araujo, G.J.; de Carvalho Sabino, K.C.; Neves, F.A.; Bernardo, A.F.; de Carvalho, S.N.; Moura, A.S.; Carvalho, L.; Thole, A.A. Impaired mitochondrial function and reduced viability in bone marrow cells of obese mice. Cell Tissue Res. 2014, 357, 185–194. [Google Scholar] [CrossRef]
- Mattei, L.; Francisqueti-Ferron, F.V.; Garcia, J.L.; Ferron, A.J.T.; de Almeida Silva, C.C.V.; Gregolin, C.S.; Nakandakare-Maia, E.T.; Silva, J.d.C.P.; Moreto, F.; Minatel, I.O. Antioxidant and anti-inflammatory properties of gamma-oryzanol attenuates insulin resistance by increasing GLUT-4 expression in skeletal muscle of obese animals. Mol. Cell. Endocrinol. 2021, 537, 111423. [Google Scholar] [CrossRef] [PubMed]
- Henriksen, E.J.; Diamond-Stanic, M.K.; Marchionne, E.M. Oxidative stress and the etiology of insulin resistance and type 2 diabetes. Free Radic. Biol. Med. 2011, 51, 993–999. [Google Scholar] [CrossRef]
- Kraus, N.A.; Ehebauer, F.; Zapp, B.; Rudolphi, B.; Kraus, B.J.; Kraus, D. Quantitative assessment of adipocyte differentiation in cell culture. Adipocyte 2016, 5, 351–358. [Google Scholar] [CrossRef] [PubMed]
- Montt-Guevara, M.M.; Finiguerra, M.; Marzi, I.; Fidecicchi, T.; Ferrari, A.; Genazzani, A.D.; Simoncini, T. D-chiro-inositol regulates insulin signaling in human adipocytes. Front. Endocrinol. 2021, 12, 660815. [Google Scholar] [CrossRef] [PubMed]


| No | Primers | Catalogue No. |
|---|---|---|
| 1 | Adiponectin | 4331182/assay ID: Mm04933656_m1 |
| 2 | PGC-1α | 4331182/assay ID: Mm01208835_m1 |
| 3 | mtTFA | 4331182/assay ID: Mm00447485_m1 |
| 4 | TNF-α | 4331182/assay ID: Mm00443258_m1 |
| 5 | IL-6 | 4331182/assay ID: Mm00446190_m1 |
| 6 | β-Actin | 4331182/assay ID: Mm02619580_g1 |
Disclaimer/Publisher’s Note: The statements, opinions and data contained in all publications are solely those of the individual author(s) and contributor(s) and not of MDPI and/or the editor(s). MDPI and/or the editor(s) disclaim responsibility for any injury to people or property resulting from any ideas, methods, instructions or products referred to in the content. |
© 2023 by the authors. Licensee MDPI, Basel, Switzerland. This article is an open access article distributed under the terms and conditions of the Creative Commons Attribution (CC BY) license (https://creativecommons.org/licenses/by/4.0/).
Share and Cite
Asmara, A.P.; Chen, H.; Ung, A.T. Preventing Adipogenesis and Preserving Mitochondria and GLUT-4 Functions by Extracts and Isolated Compounds of Australian Acacia saligna. Molecules 2023, 28, 6677. https://doi.org/10.3390/molecules28186677
Asmara AP, Chen H, Ung AT. Preventing Adipogenesis and Preserving Mitochondria and GLUT-4 Functions by Extracts and Isolated Compounds of Australian Acacia saligna. Molecules. 2023; 28(18):6677. https://doi.org/10.3390/molecules28186677
Chicago/Turabian StyleAsmara, Anjar P., Hui Chen, and Alison T. Ung. 2023. "Preventing Adipogenesis and Preserving Mitochondria and GLUT-4 Functions by Extracts and Isolated Compounds of Australian Acacia saligna" Molecules 28, no. 18: 6677. https://doi.org/10.3390/molecules28186677
APA StyleAsmara, A. P., Chen, H., & Ung, A. T. (2023). Preventing Adipogenesis and Preserving Mitochondria and GLUT-4 Functions by Extracts and Isolated Compounds of Australian Acacia saligna. Molecules, 28(18), 6677. https://doi.org/10.3390/molecules28186677