
Adsorption of Methyl Orange from Water Using Chitosan Bead-like Materials


Abstract
:1. Introduction
2. Results and Discussion
2.1. Characterization of the Adsorbent Material
2.1.1. Physical Properties
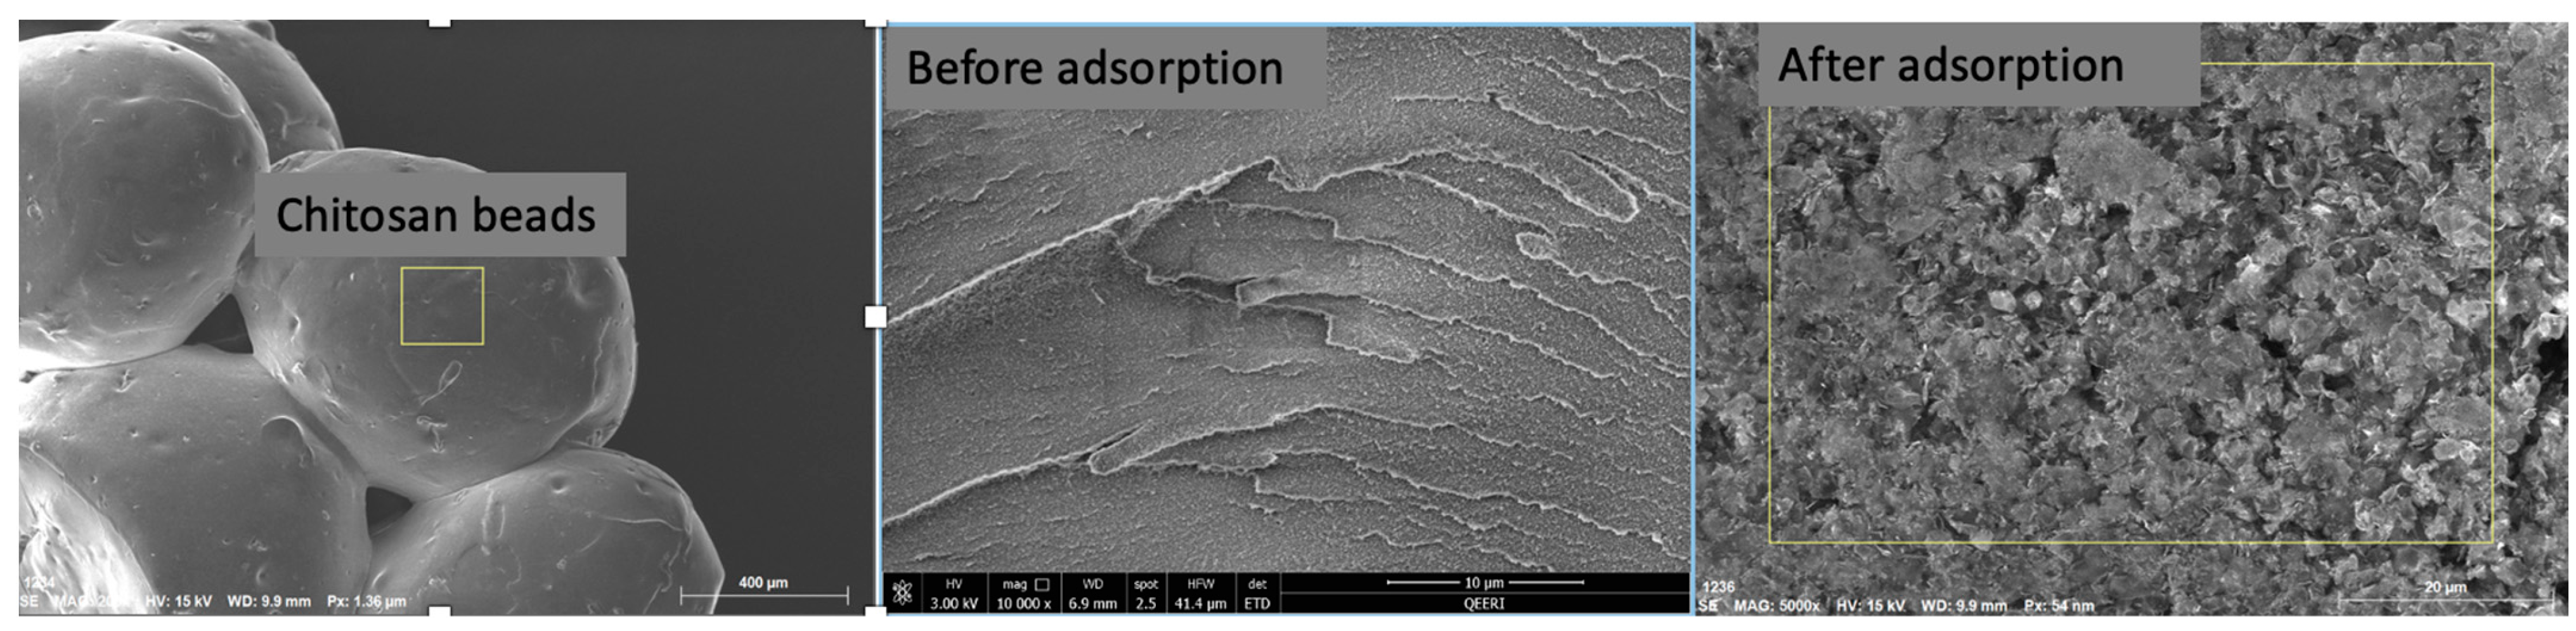
2.1.2. SEM
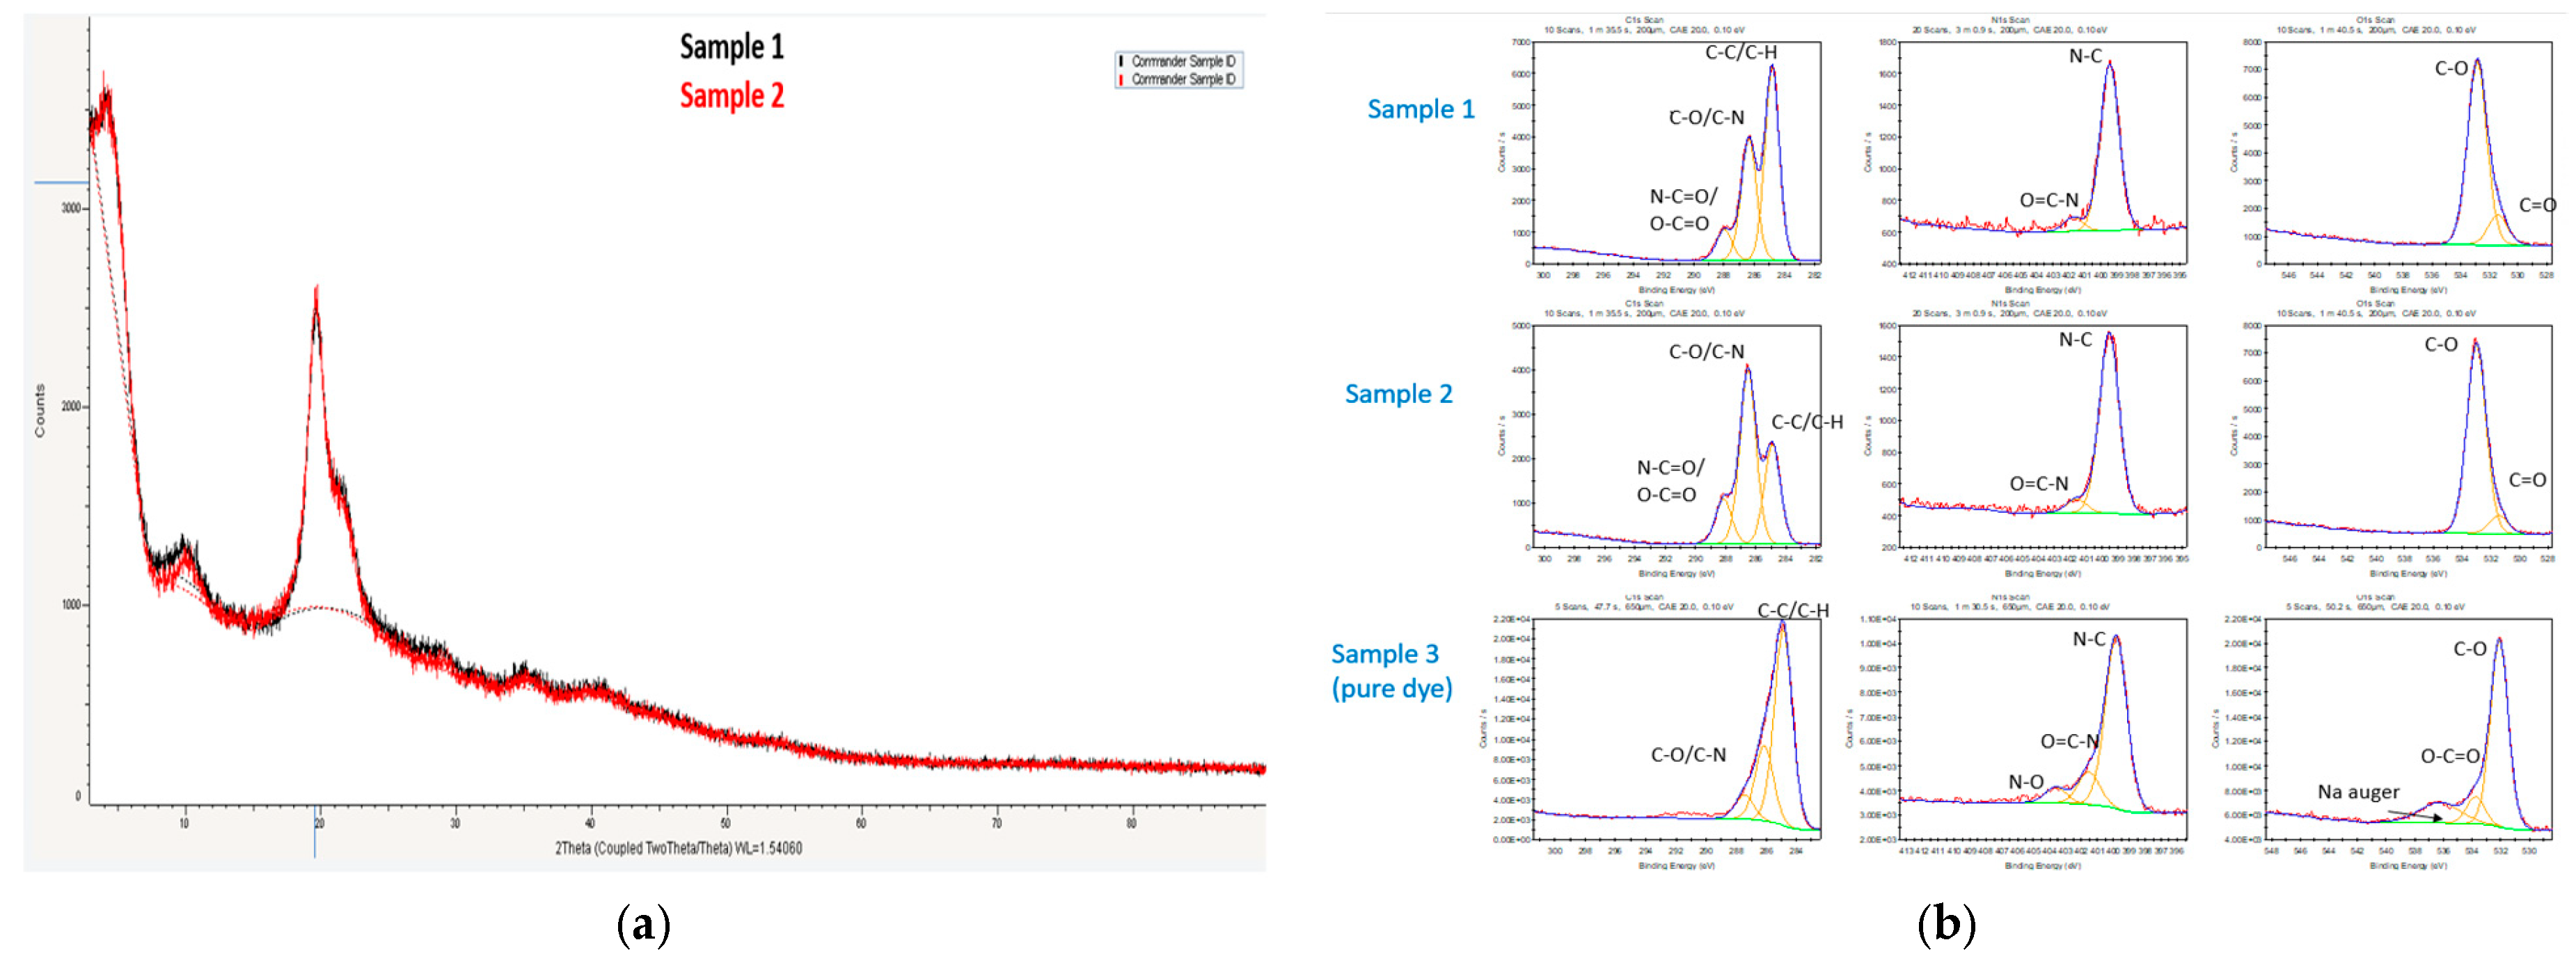
2.1.3. FTIR
2.1.4. XRD
2.2. Batch Adsorption Experiments
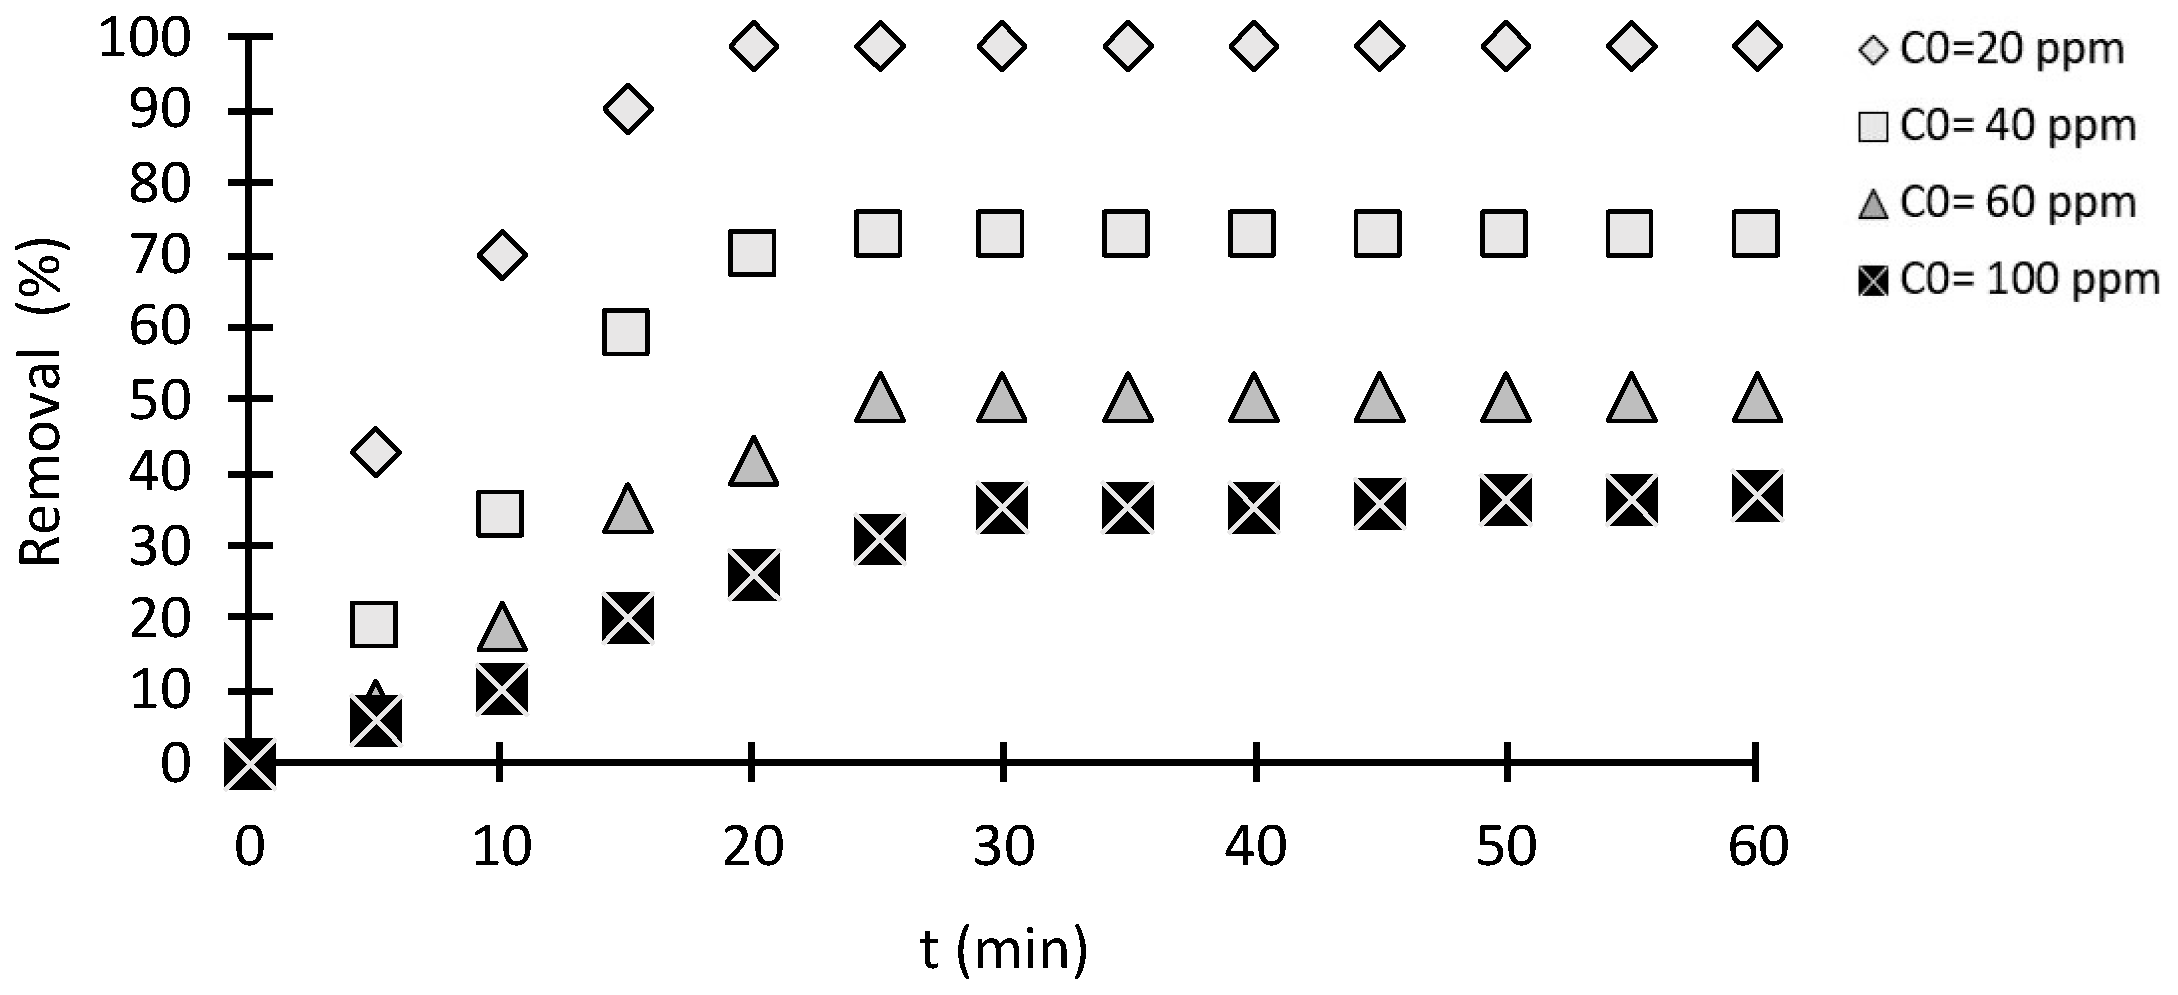
2.2.1. Effect of Initial Concentration
2.2.2. Effect of Contact Time
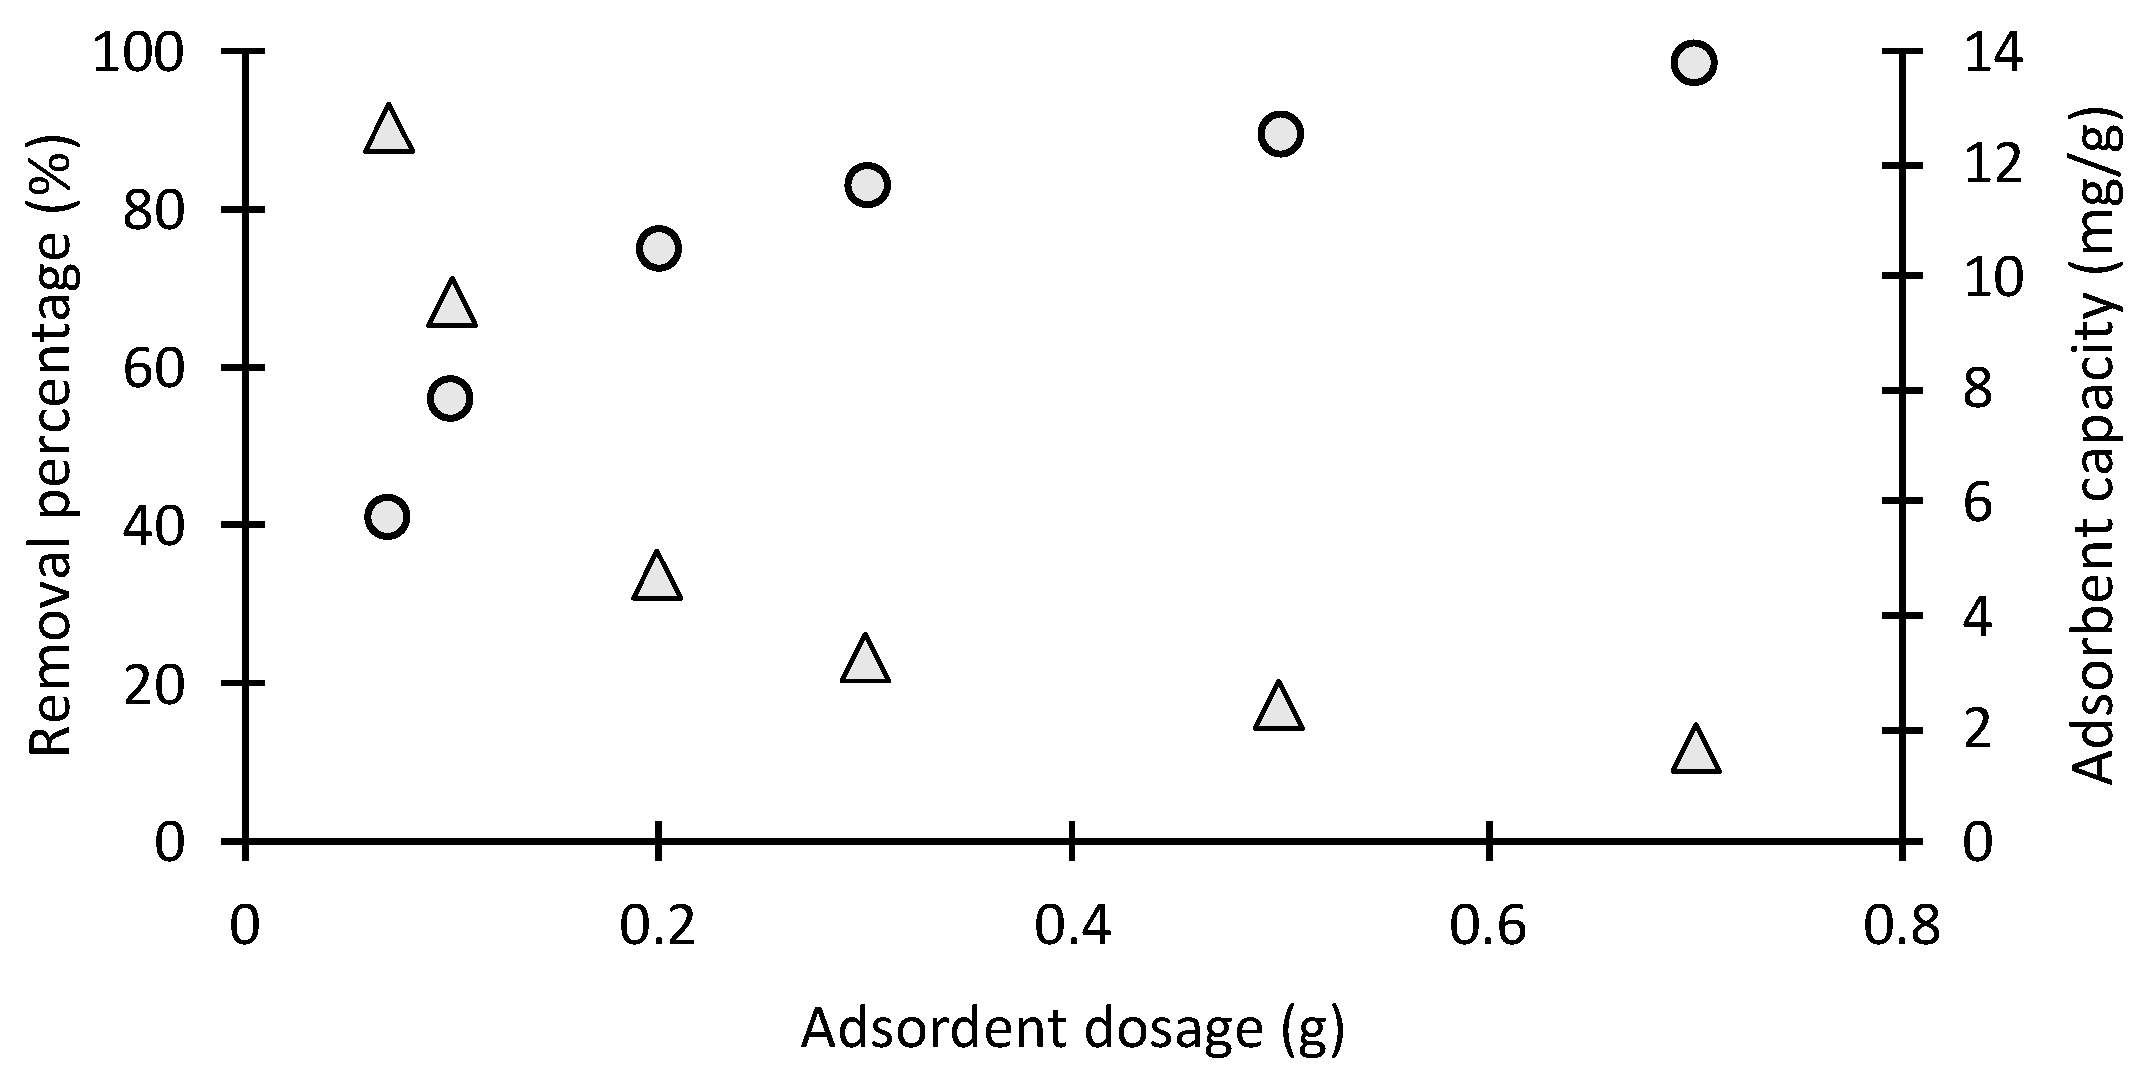
2.2.3. Effect of Adsorbent Mass
2.2.4. Effect of Agitation
2.2.5. Effect of the Solution pH on MO Dye Sorption
2.2.6. Effect of Temperature
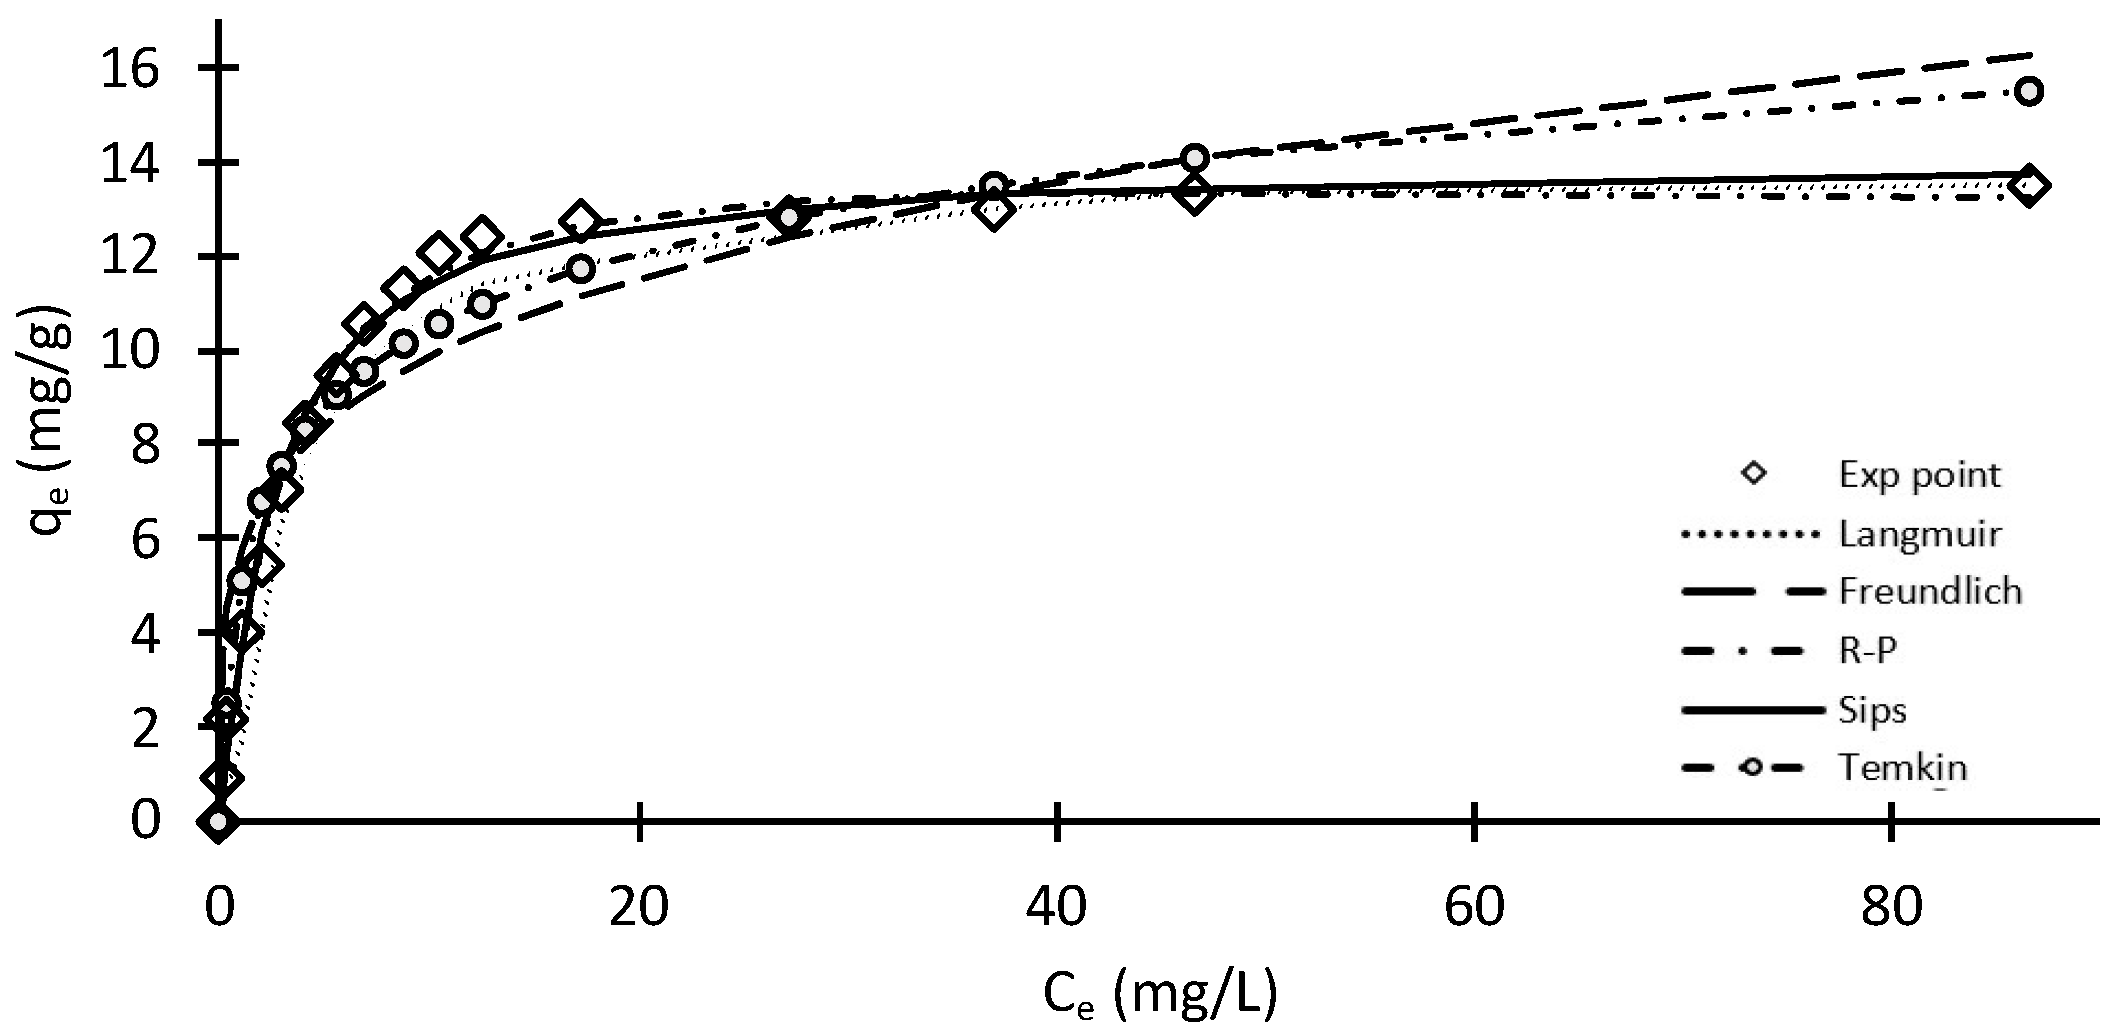
2.3. Adsorption Isotherms
2.4. Kinetic Studies at Variable Initial Concentrations
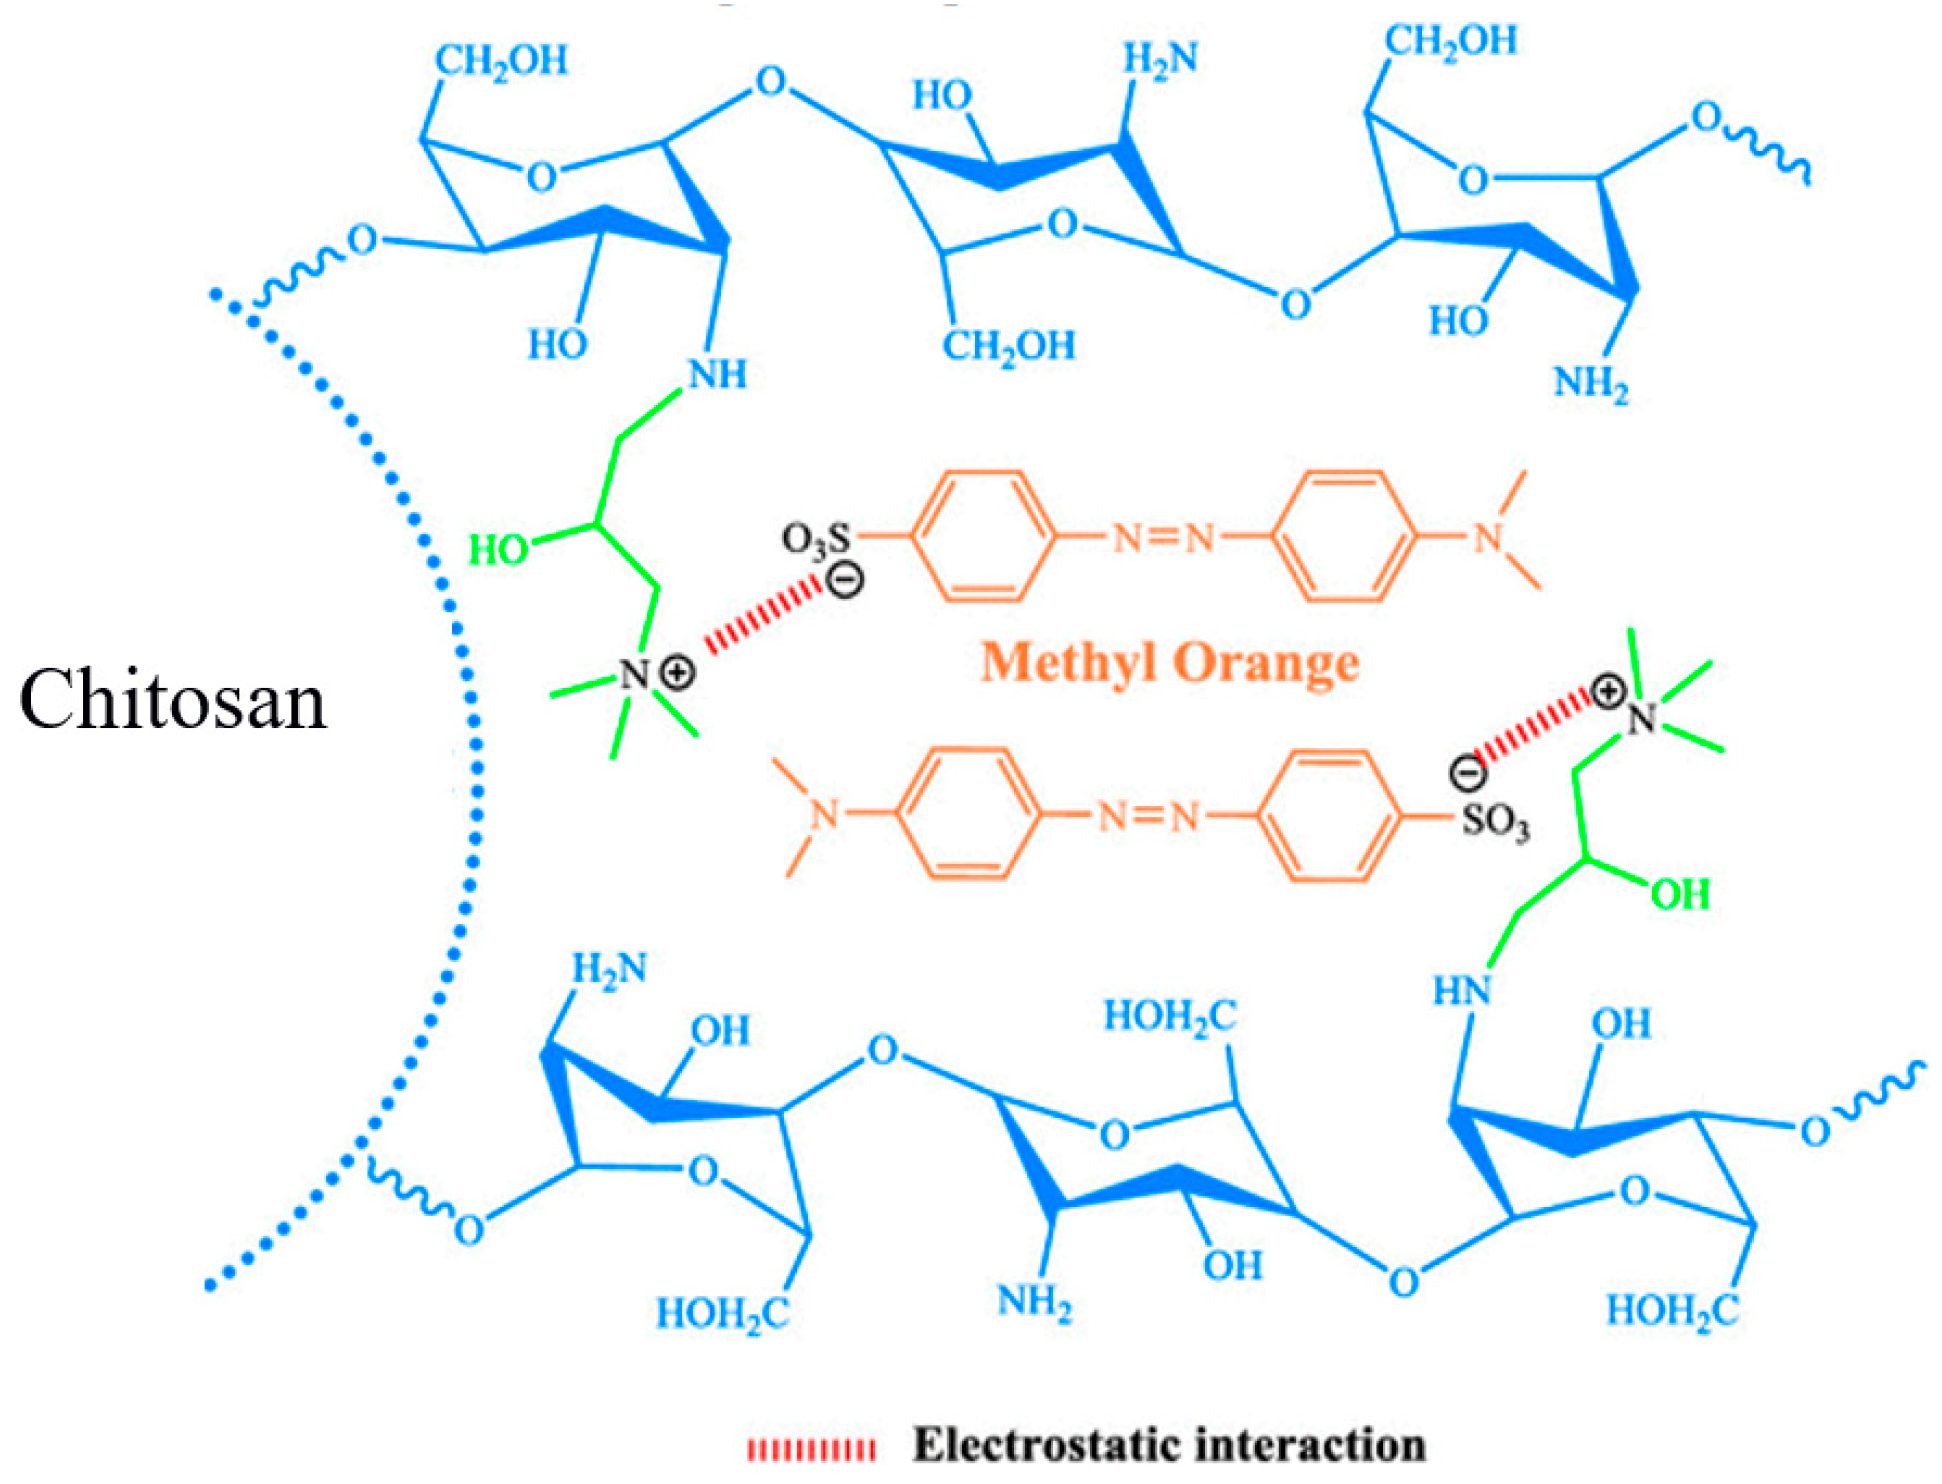
2.5. Proposed Mechanism
2.6. Regeneration Study
3. Experimental Procedures
3.1. Materials and Preliminary Characteristics of Adsorbents
3.2. Synthesis of Chitosan Bead-like Materials
3.3. Material Characterization
3.4. Adsorption Isotherm
3.5. Batch Adsorption Experiments
3.5.1. Effect of MO Initial Concentration
3.5.2. Effect of Adsorbents Dosage
3.5.3. Effect of Agitation Speed
3.5.4. Effect of MO Solution pH
3.5.5. Effect of Temperature
4. Conclusions
Author Contributions
Funding
Institutional Review Board Statement
Informed Consent Statement
Data Availability Statement
Conflicts of Interest
Sample Availability
References
- Yuan, L.; Huang, D.; Guo, W.; Yang, Q.; Yu, J. TiO2/montmorillonite nanocomposite for removal of organic pollutant. Appl. Clay Sci. 2011, 53, 272–278. [Google Scholar] [CrossRef]
- Lucaci, D.; Duta, A. Adsorption of methyl orange from wastewater using sawdust and sawdust fly ash substrates. Environ. Eng. Manag. J. 2011, 10, 1255–1262. [Google Scholar]
- Singh, T.P.; Majumder, C.B. Removal of fluoride using treated banana peel in batch reactor: Kinetics and equilibrium study. World J. Pharm. Pharm. Sci. 2015, 4, 693–704. [Google Scholar]
- Suciu, N.A.; Ferrari, T.; Trevisan, F.; Capri, M. Pesticide removal from waste spray-tank water by organoclay adsorption after field application: An approach for a formulation of cyprodinil containing antifoaming/defoaming agents. Environ. Sci. Pollut. Res. 2012, 19, 1229–1236. [Google Scholar] [CrossRef]
- Cao, X.; Oda, Y.; Shiraishi, F. Photocatalytic and adsorptive treatment of 2,4-dinitrophenol using a TiO2 film covering activated carbon surface. Chem. Eng. J. 2010, 156, 98–105. [Google Scholar] [CrossRef]
- Zheng, X.; Li, X.; Li, J.; Wang, L.; Jin, W.; Liu, J.; Pei, Y.; Tang, K. Efficient removal of anionic dye (Congo red) by dialdehyde microfibrillated cellulose/chitosan composite film with significantly improved stability in dye solution. Int. J. Biol. Macromol. 2018, 107, 283–289. [Google Scholar] [CrossRef]
- Sejie, F.P.; Nadiye-Tabbiruka, M.S. Removal of Methyl Orange (MO) from Water by adsorption onto Modified Local Clay (Kaolinite). Phys. Chem. 2016, 6, 39–48. [Google Scholar]
- Allouche, F.-N.; Yassaa, N.; Lounici, H. Sorption of methyl orange from aqueous solution on chitosan biomass. Procedia Earth Planet. Sci. 2015, 15, 596–601. [Google Scholar] [CrossRef]
- Neethu, N.; Choudhury, T. Treatment of Methylene Blue and Methyl Orange Dyes in Wastewater by Grafted Titania Pillared Clay Membranes. Recent Pat. Nanotechnol. 2018, 12, 200–207. [Google Scholar] [CrossRef] [PubMed]
- Cheung, W.H.; Szeto, Y.S.; McKay, G. Enhancing the adsorption capacities of acid dyes by chitosan nano particles. Biores. Technol. 2009, 100, 1143–1148. [Google Scholar] [CrossRef]
- Teng, D.; Jin, P.; Guo, W.; Liu, J.; Wang, W.; Li, P.; Cao, Y.; Zhang, L.; Zhang, Y. Recyclable magnetic iron immobilized onto chitosan with bridging Cu ion for the enhanced adsorption of methyl orange. Molecules 2023, 28, 2307. [Google Scholar] [CrossRef]
- Kwok, K.C.M.; Koong, L.F.; Chen, G.H.; McKay, G. Mechanism of arsenic removal using chitosan and nanochitosan. J. Coll. Interf. Sci. 2014, 416, 1–10. [Google Scholar] [CrossRef]
- Cho, C.-W.; Lim, C.-R.; Cho, B.-G.; Mun, S.-B.; Choi, J.-W.; Zhao, Y.; Kim, S.; Yun, Y.-S. Development of prediction models for adsorption properties of chitin and chitosan for micropollutants. Chem. Eng. J. 2021, 426, 131341. [Google Scholar] [CrossRef]
- Li, Z.; Li, H.; Zeng, X.; Liu, S.; Yang, Y. Adsorption and photodegradation of tetracycline by mannose-grafted chitosan composite films: Performance, mechanism and availability. Chem. Eng. J. 2023, 458, 141455. [Google Scholar] [CrossRef]
- Dehghani, M.H.; Ghadermazi, M.; Bhatnagar, A.; Sadighara, P.; Jahed-Khaniki, G.; Heibati, H.; McKay, G. Adsorptive removal of endocrine disrupting bisphenol A from aqueous solution using chitosan. J. Environ. Chem. Eng. 2016, 4, 2647–2655. [Google Scholar] [CrossRef]
- Dehghani, M.H.; Zarei, A.; Mesdaghinia, A.; Nabizadeh, R.; Alimohammadi, M.; Afsharnia, M.; McKay, G. Production and application of a treated bentonite–chitosan composite for the efficient removal of humic acid from aqueous solution. Chem. Eng. Res. Des. 2018, 140, 102–105. [Google Scholar] [CrossRef]
- Guibal, E.; Vincent, T.; Navarro, R. Metal ion biosorption on chitosan for the synthesis of advanced materials. J. Mater. Sci. 2014, 49, 5505–5518. [Google Scholar] [CrossRef]
- He, Y.; Zhang, P.; Wang, L. Adsorption and removal of Cr6+, Cu2+, Pb2+, and Zn2+ from aqueous solution by magnetic nano-chitosan. Molecules 2023, 28, 2607. [Google Scholar] [CrossRef]
- Alyasi, H.; Mackey, H.R.; McKay, G. Removal of cadmium from waters by adsorption using nanochitosan. Energy Environ. 2020, 31, 517–534. [Google Scholar] [CrossRef]
- Khanniri, E.; Yousefi, M.; Mortazavian, A.M.; Khorshidian, N.; Sohrabvandi, S.; Arab, M.; Koushki, M.R. Effective removal of lead (II) using chitosan and microbial adsorbents: Response surface methodology (RSM). Int. J. Biol. Macromol. 2021, 178, 53–62. [Google Scholar] [CrossRef]
- Bulin, C.; Zheng, R.; Song, J.; Bao, J.; Xin, G.; Zhang, B. Magnetic graphene oxide-chitosan nanohybrid for efficient removal of aqueous Hg(Π) and the interaction mechanism. J. Mol. Liq. 2023, 370, 121050. [Google Scholar] [CrossRef]
- Milot, C.; Guibal, E.; Roussy, J.; Le Cloirec, P. Chitosan gel beads as a new biosorbent for molybdate removal. Miner. Proc. Extr. Metall. Rev. 1998, 19, 293–308. [Google Scholar] [CrossRef]
- Wang, H.; Chu, Y.; Fang, C.; Huang, F.; Song, Y.; Xue, X. Sorption of tetracycline on biochar derived from rice straw under different temperatures. PLoS ONE 2017, 12, e0182776. [Google Scholar] [CrossRef]
- Al-Senani, G.; Al-Fawzan, F. Adsorption study of heavy metal ions from aqueous solution by nanoparticle of wild herbs. Egypt. J. Aquat. Res. 2018, 44, 187–194. [Google Scholar] [CrossRef]
- Iqbal, J.; Wattoo, F.H.; Wattoo, M.H.S.; Malik, R.; Tirmizi, S.A.; Imran, M.; Ghangro, A.B. Adsorption of acid yellow dye on flakes of chitosan prepared from fishery wastes. Arab. J. Chem. 2011, 4, 389–395. [Google Scholar] [CrossRef]
- Saha, T.K.; Bhoumik, N.C.; Karmaker, S.; Ahmed, M.G.; Ichikawa, H.; Fukumori, Y. Adsorption of Methyl Orange onto Chitosan from Aqueous Solution. J. Water Resour. Prot. 2010, 2, 898–906. [Google Scholar] [CrossRef]
- Morais, W.A.; de Almeida, A.L.P.; Pereira, M.R.; Fonseca, J.L.C. Equilibrium and kinetic analysis of methyl orange sorption on chitosan spheres. Carbohydr. Res. 2008, 343, 2489–2493. [Google Scholar] [CrossRef]
- Haldorai, Y.; Shim, J.J. An efficient removal of methyl orange dye from aqueous solution by adsorption onto chitosan/MgO composite: A novel reusable adsorbent. Appl. Surf. Sci. 2014, 292, 447–453. [Google Scholar] [CrossRef]
- Chiou, M.S.; Ho, P.Y.; Li, H.Y. Adsorption of anionic dyes in acid solutions using chemically cross-linked chitosan beads. Dye. Pigment. 2004, 60, 69–84. [Google Scholar] [CrossRef]
- Ruthven, D.M. Dynamics of adsorption columns: Single-transition systems. In Principles of Adsorption and Adsorption Processes; John Wiley & Sons, Inc.: New York, NY, USA, 1984; pp. 220–273. [Google Scholar]
- Crini, G.; Badot, P.M. Application of chitosan, a natural minopolysaccharide, for dye removal from aqueous solutions by adsorption processes using batch studies: A review of recent literature. Prog. Polym. Sci. 2008, 33, 399–447. [Google Scholar] [CrossRef]
- Kumar, D.; Gihar, S.; Shrivash, M.K.; Kumar, P.; Kundu, P.P. A review on the synthesis of graft copolymers of chitosan and their potential applications. Int. J. Biol. Macroml. 2020, 163, 2097–2112. [Google Scholar] [CrossRef]
- McKay, G.; Porter, J.F. Equilibrium parameters for the sorption of copper, cadmium and zinc ions onto peat. J. Chem. Technol. Biotechnol. 1997, 69, 309–320. [Google Scholar] [CrossRef]
- Foo, K.Y.; Hameed, B.H. Insights into the modeling of adsorption isotherm systems. J. Chem. Eng. 2010, 156, 2–10. [Google Scholar] [CrossRef]
- Ho, Y.S.; McKay, G. A comparison of chemisorption kinetic models applied to pollutant removal on various sorbents. Proc. Saf. Environ. Prot. 1998, 76, 332–340. [Google Scholar] [CrossRef]
- Largitte, L.; Pasquier, R. A review of the kinetics adsorption models and their application to the adsorption of lead by an activated carbon. Chem. Eng. Res. Des. 2016, 109, 495–504. [Google Scholar] [CrossRef]
- Iida, Y.; Kozuka, T.; Tuziuti, T.; Yasui, K. Sonochemically enhanced adsorption and degradation of methyl orange with activated aluminas. Ultrasonics 2004, 42, 635–639. [Google Scholar] [CrossRef]
- Annadurai, G.; Juang, R.S.; Lee, D.J. Use of cellulose-based wastes for adsorption of dyes from aqueous solutions. J. Hazard. Mater. 2002, 92, 263–274. [Google Scholar] [CrossRef]
- Samal, A. Design a Setup for Preparation of Chitosan Microbeads Based on Economic and Size Consideration. Bachelor’s Thesis, National Institute of Technology, Rourkela, India, 2015. [Google Scholar]


| Chitosan Adsorbents | Particle Size Diameter (µm) | Surface Aea (m2 g−1) | Total Pore Volume (cc g−1) |
|---|---|---|---|
| Powder | 335–500 | 0.762 | 2.96 × 10⁻² |
| Beads | 0.001 | 0.296 | 1.86 × 10⁻² |
| Isotherm Models | Constants | Error Analysis | ||||
|---|---|---|---|---|---|---|
| R2 | SSE | HYBRID | MPSD | ARE | ||
| Langmuir | qm = 14.29 mg/g aL = 0.371 L/mg | 0.999 | 1.864 | 4.439 | 12.978 | 7.138 |
| Freundlich | kf = 5.772 L/g 1/n = 0.232 | 0.878 | 43.586 | 29.404 | 84.161 | 37.343 |
| R–P | qm = 18.117 mg/g kR–P = 0.240 L/mg β = 1.0621 | 0.999 | 2.369 | 6.167 | 16.982 | 7.767 |
| Sips | qm = 20.426 mg/g kS = 0.0742 L/mg 1/n = 0.0501 | 0.987 | 2.838 | 12.200 | 18.140 | 95.028 |
| Temkin | B = 2.358 mg/g C = 5.005 mg/g | 0.893 | 16.386 | 3.608 | 38.439 | 10.609 |
| Kinetic Model | Constants | Error Analysis | |||
|---|---|---|---|---|---|
| SSE | HYBRID | MPSD | ARE | ||
| PFO | qm = 19.602 mg/g k1 = 0.0928 L/mg | 5.260 | 0.646 | 4.378 | 2.799 |
| PSO | qm = 22.130 mg/g k2 = 0.00588 L/mg | 2.545 | 0.318 | 3.159 | 1.178 |
| Elovich | β = 0.263 g/mg α = 12.577 mg/g | 13.117 | 2.306 | 5.587 | 3.070 |
| Intra particle diffusion | KID = 1.272 L/mg C = 9.448 mg/g | 27.770 | 7.054 | 8.743 | 5.819 |
Disclaimer/Publisher’s Note: The statements, opinions and data contained in all publications are solely those of the individual author(s) and contributor(s) and not of MDPI and/or the editor(s). MDPI and/or the editor(s) disclaim responsibility for any injury to people or property resulting from any ideas, methods, instructions or products referred to in the content. |
© 2023 by the authors. Licensee MDPI, Basel, Switzerland. This article is an open access article distributed under the terms and conditions of the Creative Commons Attribution (CC BY) license (https://creativecommons.org/licenses/by/4.0/).
Share and Cite
Alyasi, H.; Mackey, H.; McKay, G. Adsorption of Methyl Orange from Water Using Chitosan Bead-like Materials. Molecules 2023, 28, 6561. https://doi.org/10.3390/molecules28186561
Alyasi H, Mackey H, McKay G. Adsorption of Methyl Orange from Water Using Chitosan Bead-like Materials. Molecules. 2023; 28(18):6561. https://doi.org/10.3390/molecules28186561
Chicago/Turabian StyleAlyasi, Haya, Hamish Mackey, and Gordon McKay. 2023. "Adsorption of Methyl Orange from Water Using Chitosan Bead-like Materials" Molecules 28, no. 18: 6561. https://doi.org/10.3390/molecules28186561
APA StyleAlyasi, H., Mackey, H., & McKay, G. (2023). Adsorption of Methyl Orange from Water Using Chitosan Bead-like Materials. Molecules, 28(18), 6561. https://doi.org/10.3390/molecules28186561