Article

Plant-Waste-Derived Sorbents for Nitazoxanide Adsorption

1
Department of Radiochemistry and Environmental Chemistry, Faculty of Chemistry, Maria Curie-Sklodowska University in Lublin, 20-031 Lublin, Poland
2
Department of Advanced Energy Technologies, Częstochowa University of Technology, Dąbrowskiego 73, 42-201 Częstochowa, Poland
3
Department of Herbology and Plant Cultivation Techniques, University of Life Sciences in Lublin, 20-033 Lublin, Poland
4
Tianjin Key Laboratory of Environmental Technology for Complex Trans-Media Pollution, Key Laboratory of Pollution Processes and Environmental Criteria (Ministry of Education), College of Environmental Science and Engineering, Nankai University, Tianjin 300350, China
*
Author to whom correspondence should be addressed.
Molecules 2023, 28(15), 5919; https://doi.org/10.3390/molecules28155919
Submission received: 7 July 2023 / Revised: 31 July 2023 / Accepted: 2 August 2023 / Published: 7 August 2023
(This article belongs to the Special Issue Research on Green Adsorbents)

Abstract

:
The increased application of drugs during the COVID-19 pandemic has resulted in their increased concentration in wastewater. Conventional wastewater treatment plants do not remove such pollutants effectively. Adsorption is a cheap, effective, and environmentally friendly method that can accomplish this. On the other hand, maintaining organic waste is required. Thus, in this study, plant waste-derived pelletized biochar obtained from different feedstock and pyrolyzed at 600 °C was applied for the adsorption of nitazoxanide, an antiparasitic drug used for the treatment of SARS-CoV-2. The adsorption was fast and enables one to remove the drug in one hour. The highest adsorption capacity was noted for biochar obtained from biogas production (14 mg/g). The process of NTZ adsorption was governed by chemisorption (k2 = 0.2371 g/mg min). The presence of inorganic ions had a detrimental effect on adsorption (Cl, NO3 in 20–30%) and carbonates were the most effective in hindering the process (60%). The environmentally relevant concentration of DOM (10 mg/L) did not affect the process. The model studies were supported by the results with a real wastewater effluent (15% reduction). Depending on the applied feedstock, various models described nitazoxanide adsorption onto tested biochars. In summary, the application of carbonaceous adsorbents in the pelletized form is effective in nitazoxanide adsorption.

Graphical Abstract

1. Introduction

Nitazoxanide (2-acetyloxy-N-5-nitro-2-thiazolyl benzamide, NTZ) is an antiparasitic drug that also shows a broad spectrum of antiviral activity [1]. In the early 2000s, nitazoxanide was approved for the therapy of diarrhea caused by Cryptosporidium species and G. intestinalis in children and adults. [2]. Among the other tested antiparasitic drugs thiabendazole, albendazole, and ivermectin are listed [3,4]. Nitazoxanide is also effective against anaerobic bacteria, protozoa, trematodes, cestodes, nematodes, and even viruses [5,6]. Due to the antiviral properties of nitazoxanide, in 2020 when the COVID-19 pandemic started, NTZ was used to treat patients infected with SARS-CoV-2 [2,7]. In a patient’s body, nitazoxanide is hydrolyzed into tizoxanide (desacetyl-nitazoxanide) (half-life 7.3 h) and one-third of the oral dose of nitazoxanide is excreted with urine and the rest with feces [8] resulting in the presence in wastewater [9]. Although the concentrations of antiparasitic drugs in wastewater or the environment are relatively low (Table 1), their poor removal in wastewater treatment plants has been observed. This is evidence that novel effective methods for its removal are required.
Among others, adsorption seems to be a promising removal method [11,12,13] due to its low cost, short time, and the possibility of using different wastes for different products in order to meet the requirements of the circular economy. Additionally, the transformation of waste towards precious products satisfies Sustainable Development Goals. The solution for problematic organic wastes is their transformation towards biochar [14]. The unquestionable advantage of biochar is the possibility of application of various feedstocks (straw [15], wood [16], food wastes [14], sewage sludge [17], animal manures [18], etc.). Additionally, a wide range of applied temperatures (350–750 °C) or gases (steam, CO2, N2, etc.) [19] during pyrolysis or per-and post-modification of biochar [20] makes it the best solution for environmental application. Final product properties such as surface area, pore size, hydrophobicity, and pH are dependent on feedstock and conditions of the pyrolysis process [20,21,22].
The use of waste materials as feedstock for the synthesis of biochar has many benefits. One of them is the low price of biochar. Another advantage is that the waste materials are processed safely. It makes less waste go to landfills, which reduces methane emission and reduces the microbiological risk [22,23,24]. Biochar may have a big specific surface area and high adsorption capacity. Additionally, they have less negative impact on the environment compared to other adsorbents. All of this makes them great adsorbents which may be successfully used in wastewater treatment [20]. Biochar is used for the removal of various substances such as phenols, polynuclear aromatics, pesticides, pharmaceuticals, dyes, and inorganics from water [10,20]. The problem in studies with biochar is its powdered form that requires additional separation after the process [25]. The solution will be pelletized feedstock [26], thus wheat straw pellets, sunflower husk pellets, and pelletized residues from biogas production were used for the preparation of the biochar. The dense structure of the adsorbent is superior in practical application and enabled easier removal after the process.
The aim of the presented studies was the comparison of the effectiveness of various waste-derived pelletized biochar in the adsorption of NTZ from water. The capacity of NTZ removal was established for all adsorbents, using both kinetic studies and isotherm modeling. Testing kinetics enables to establish the rate-limiting step and the sorption mechanism starting from the mass transfer of adsorbate, its diffusion, and finally the surface reaction on the adsorbent [27]. Kinetics was tested using four well-known models: pseudo-first-order (PFO), pseudo-second-order (PSO), Elovich model, and Intraparticle Diffusion model (IPD). In the Lagergren PFO model, the adsorption rate with time is directly proportional to the difference in saturation concentration thus adsorption occurs through diffusion through the interface. In PSO the rate-limiting step is chemical sorption or chemisorption. In this condition, the adsorption rate is dependent on adsorption capacity not on the concentration of adsorbate [27]. Elovich’s model describes the activated chemical adsorption onto heterogeneous surfaces [28]. The intraparticle Diffusion model assumes the adsorbate diffusion in the pores inside as the mass transfer step [29]. The sorption capacity can be estimated using isotherm modeling [30] and four well-known models: Langmuir (L), Freundlich (F), Temkin (T), and Dubinin-Radushkevich (DR) were examined. L model describes a monolayer filling of non-interacting molecules to homogeneous binding sites with equivalent sorption energies [31], whereas the F model describes the process onto heterogeneous surfaces [32]. In the T model a uniform distribution of bounding energy up to some maximum bonding energy is assumed, whereas DR describes the impact of adsorbent porosity as well as defines the character of sorption (physical or chemical) depending on the value of adsorption energy [33].
The objectives of the presented studies were: (i) the determination of the applicability of waste-derived pelletized adsorbents in the pollutants removal from water matrix; (ii) the estimation of the effect of the parameters governing the adsorption process onto biochar surface (organic and inorganic substances); (iii) efficiency of the NTZ removal from different water and wastewater matrix. All tested conditions were used to estimate the possibility of the practical application of waste-derived biochar.

2. Results and Discussion

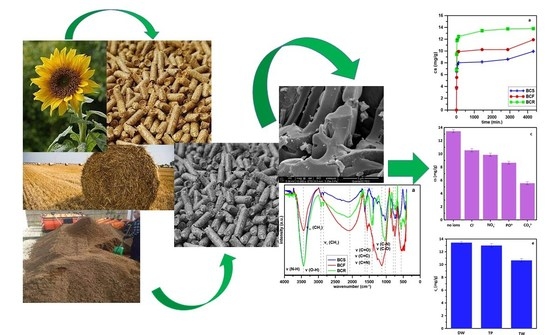
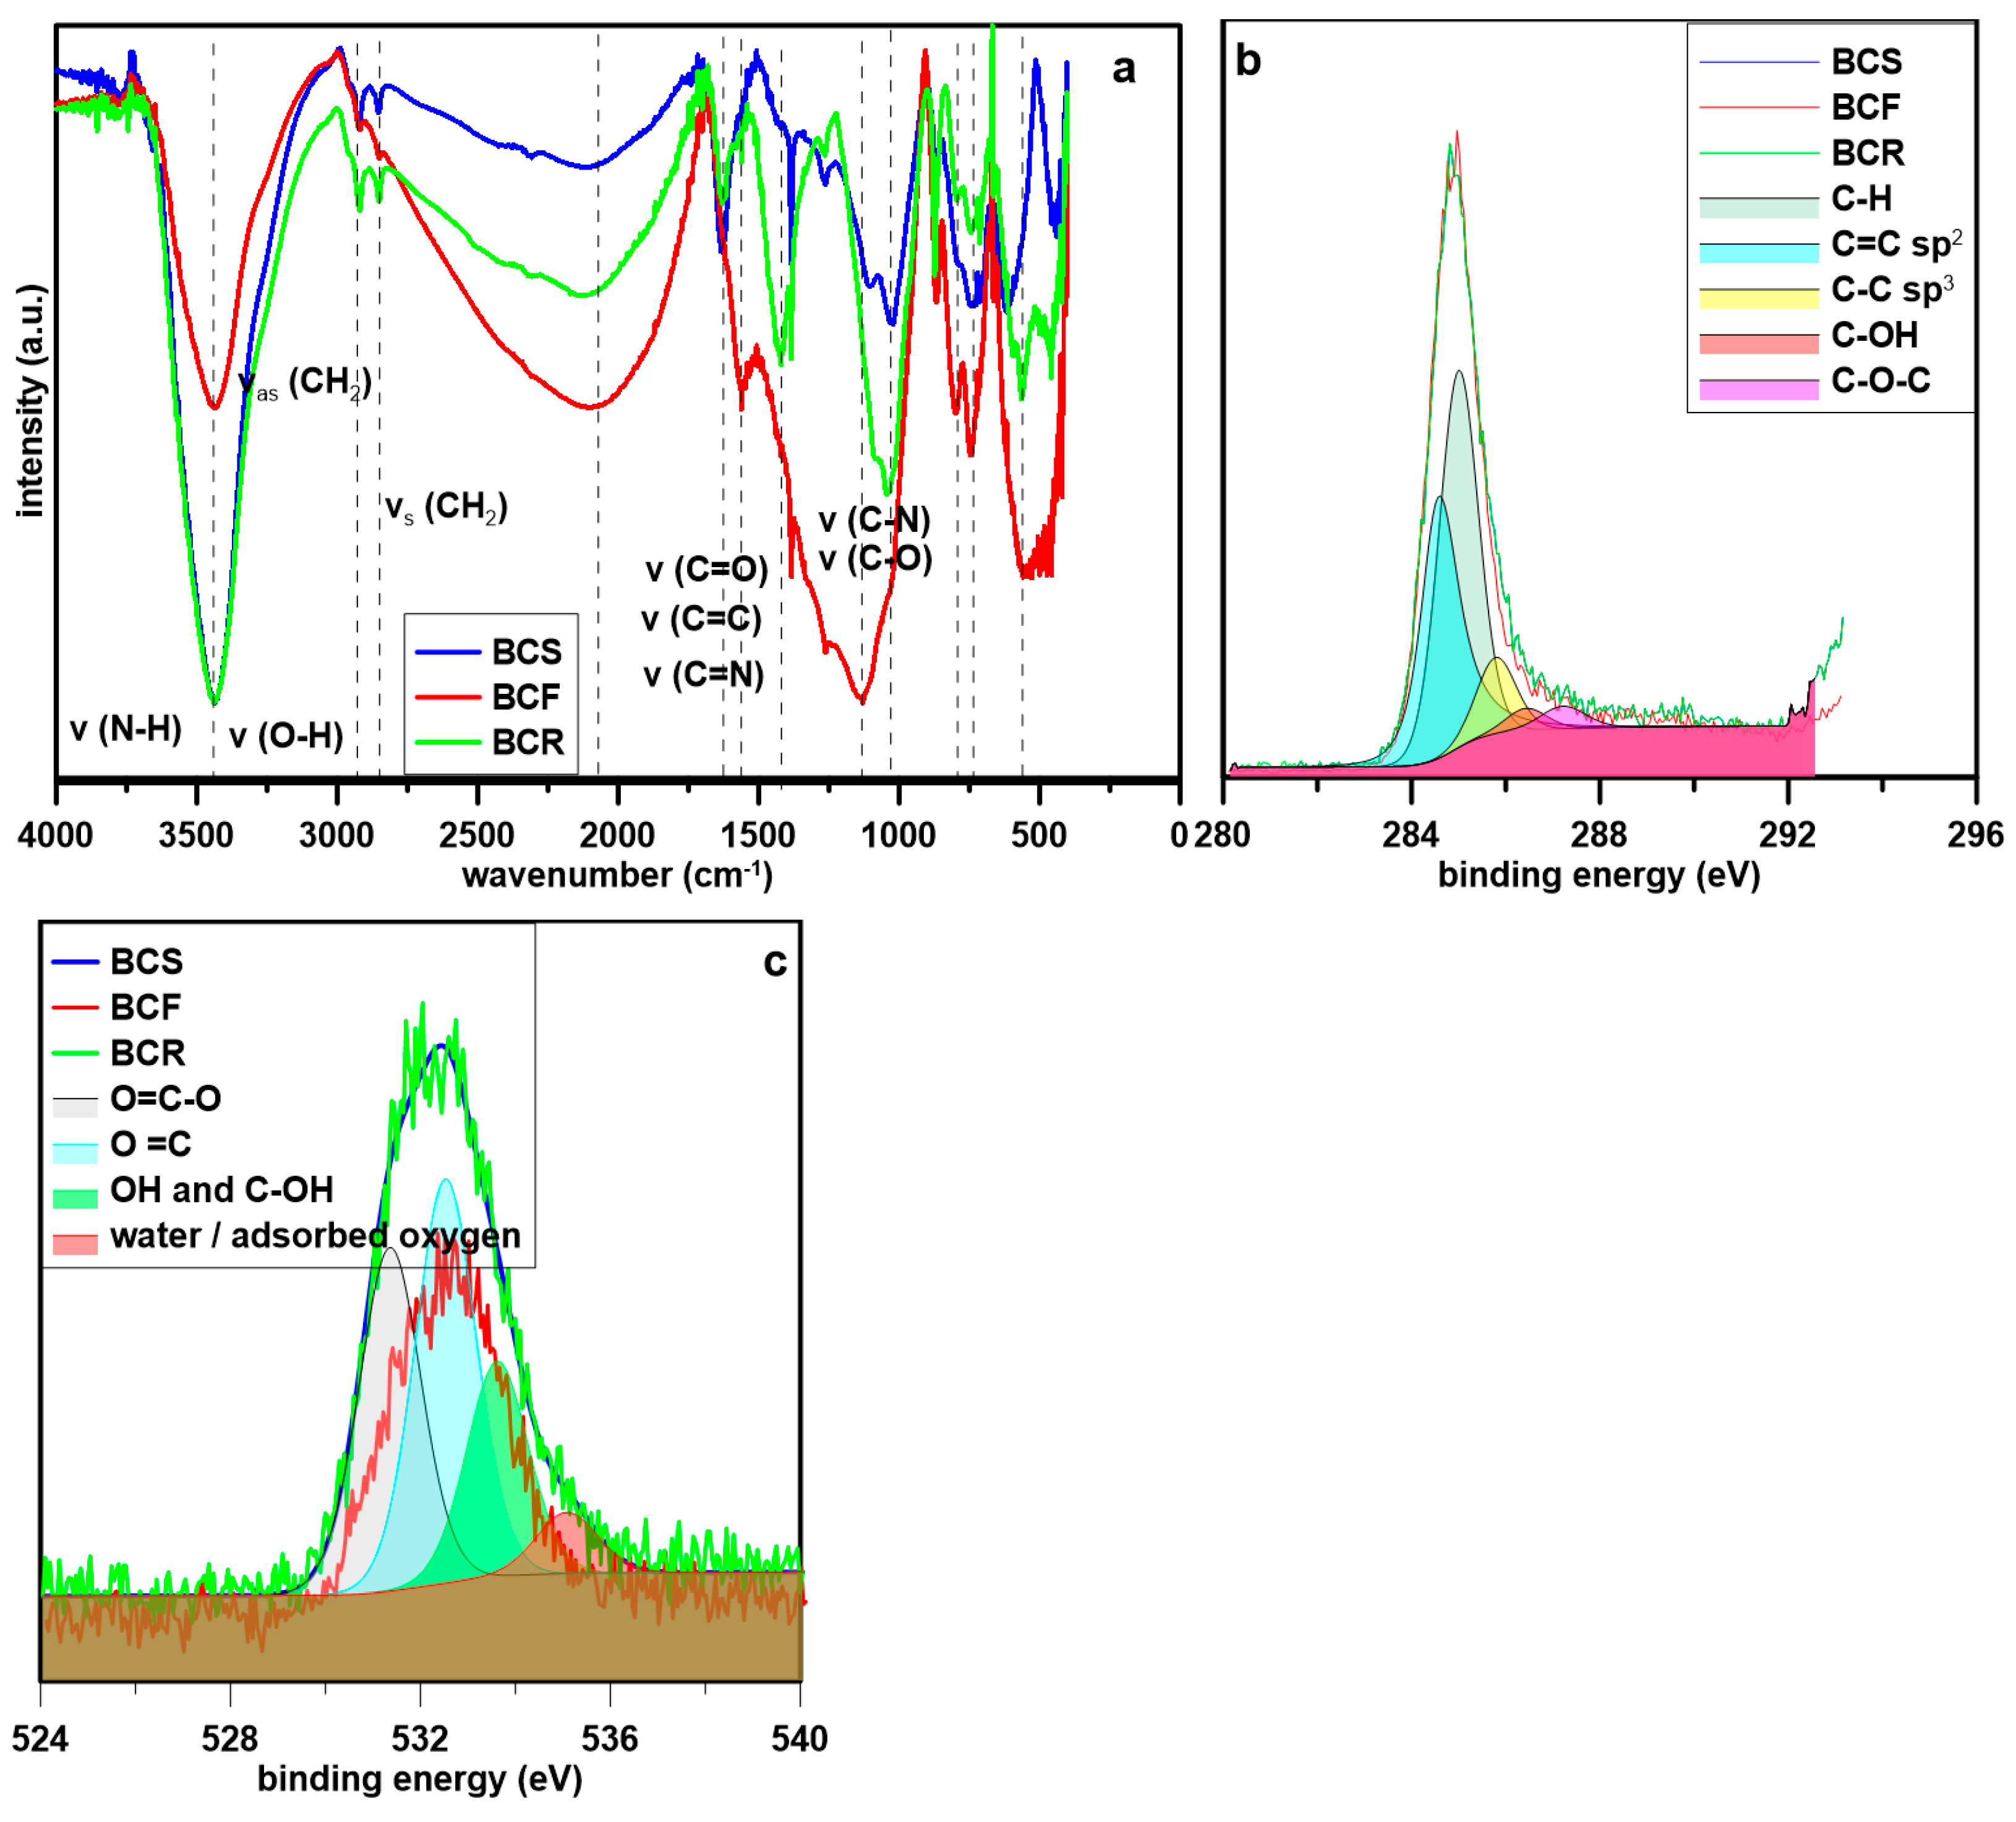
2.1. Biochar Physicochemical Properties

The obtained material differed in physicochemical properties (Table 2, Figure 1a–c). In general, BC was characterized by low surface area but the application of residues from biogas production for BC was efficient and enabled to obtain material with the highest surface area (26.05 m2/g). BCR possessed also the highest micropore volume with simultaneously the lowest pore diameter (10.68 nm). The mostly broad pores were noted in BCS (95.41 nm). Porosity is a key parameter in adsorption where pore-filling or sieving effects are considered [12]. The highest ash content e.g., presence of inorganics was noted in BCR, which contained also K (4.05 wt%), Ca (1.35 wt%), Mg (0.76 wt%), Fe (0.38 wt%), S (0.24 wt%), Si (0.14 wt%), Cl (0.14 wt%), and P (0.09 wt%) that was evidenced from SED-EDS mapping.
The highest amount of carbon (C%) was noted in BCF (Table 2), the material with the lowest hydrophilicity (O/C ratio) and polarity ((O + N/C) ratio). On the other hand, the mostly hydrophilic/polar surface was noted in BCR, which contained the highest amount of O%. These results may indicate that BCS and BCF may be recommended for the adsorption of rather hydrophobic pollutants, whereas BCR is for hydrophobic compounds [34].
The FT-IR studies revealed that the surface of BC was characterized by the presence of various surface functional groups (Figure 1a). At all curves, the presence of peaks confirming the presence of O-H and/or N-H stretching vibrations (about 3445 cm−1) was noted. The double peaks at 2940 cm−1 and 2840 cm−1 corresponded to the asymmetric and symmetric stretching of the aliphatic CH2 group. The other peaks implied that lignin (peak at about 1620 cm−1—aromatic C=C or C=O stretching vibration or 1430 cm−1 C–H deformation) was present in all BC but with different intensities. The presence of a band at 1620 cm−1 may be connected with the presence of amino groups (C=N stretching) and/or amides (N-H bending) [35]. Peak noted at 2090 cm−1 indicated the presence of conjugated C=C and C≡C bonds with the highest content in BCF and the lowest in BCS was noted indicating higher graphitization of BCF in comparison to BCR and BCS. Amides were also present that confirmed the peaks at 1620 cm−1 (C=O) and 1550 cm−1 (C–N) [36]. BC contained also inorganic carbonates (stretching of –C=O at 1430 cm−1 and bending –C=O inorganic carbonates at 870 cm−1 in BCR [37], which was consistent with data presented in Table 2. The peak at 1020 cm−1 was indicating for SiO2 presence in BCS and BCR. Additionally, polycyclic aromatic hydrocarbons (PAHs) were noted in BC which was implied by the presence of the three-peak group at 874 to 750 cm−1 (aromatic C-H bands) [38].
The carbon peaks of all BC looked similar in the XPS spectrum (Figure 1b) and the presence of different carbon structures was confirmed. In General, XPS analysis revealed that carbon is present mostly in the form of C-H bonds (peak at 285 eV, 45.5 at% for BCS, 50.7 at% for BCF), and interestingly in minority in BCR (38.7 at%). The other form of carbon, C=C sp2 (peak at 284.57 eV) [39], constituted a slightly lower percentage (35.5% and 37.6%, for BCS and BCF respectively), whereas in BCR was predominant (41.8%). The presence of other peaks for C–C sp3 [40] (peak at 285.79 eV), C–OH (286.43 eV), C–O–C (peak at 287.22 eV), C=O [40] (288.10 eV), –COO-289.06 eV) and –COOR (290.18 eV) [41] indicated lower impact of these functionalities (below 10 at%). Oxygen in all BC was present, whereas the intensity of the O peaks in the XPS spectrum (Figure 1c) was not similar, with the lowest revealed by BCF. Oxygen was present in the form of carboxyl (peak at 531.3 eV) (25.9 at% in BCS, 27.3 at% in BCF, 33.8 at% in BCR) [40], carbonyl (peak at 532.6 eV) (34.5 at% in BCS, 38.9 at% in BCF, 39 at% in BCR), and hydroxyl groups (peak at 533.6 eV) (21.2 at% in BCR, 28.4 at% in BCF, 32.5% in BCS) [42]. Also, adsorbed water or oxygen was determined (peak at 534.9 eV) (below 10 at% in all BC) [40].
The morphology of the tested materials was examined with SEM (Figure 2). The structure of BC is generally densely “packed” (Figure 2a,b) but some pores were observed. However, SEM images clearly confirmed the presence of voids and channels in the structure of BC [43]. The diameter of the pores was not uniform and dependent on the applied feedstock. In BCR the diameter of pores was lower than 1 µm (BCR Figure 2c). In turn, it can be seen that the morphology of BCS was slightly different from the other materials, and the layered structure was observed. Whereas the morphology of BCF was rather showing plane/non-porous surface. The surface of BCS and BCR seems to be rougher. These observations are consistent with data obtained from porosity (Table 2). Small bright fragments noted in the BCF SEM image are confirming the presence of inorganic constituents [35].

2.2. Adsorption Studies

The highest amount of adsorbed NTZ was observed on BCR (Figure 3a) almost 14 mg/g. In general, the process of sorption was rather fast and the sorption equilibrium was maintained for one hour indicating potential practical application. In general, the maximum adsorption capacity of all samples increased in the following order BCS < BCF < BCR.
The adsorption of ionic compounds is affected by their ionization state. Generally, the value of pKa of NTZ was 10.62 (chemdrug.com) indicating low acidic properties of the drug and that in the water environment (neutral pH) NTZ will be not ionized. The surface of the BC is negatively charged (ζ potential about −40 mV: BCS—−43.93 mV, BCF—−42.58 mV, and BCR—−35.7 mV). Thus the electrostatic interactions are not the main driving force for interactions of BC and NTZ [44].
The process of NTZ adsorption followed mainly PSO kinetics (Table 3, R2 > 0.99) indicating that the adsorption rate was combined with the number of binding sites and governed by chemisorption. The low fitting to the other kinetic models excludes physisorption and intraparticle diffusion as rate-limiting processes in tested adsorption. PSO was also noted for adsorption onto different carbon-based materials such as GAC [45] and biochar [46]. To establish the mechanism of adsorption, isotherm modeling was employed (Figure 3b, Table 4). What is interesting, the process followed different regimes depending on the applied feedstock. For BCS, the Temkin model revealed the highest fitting, whereas Dubinin-Radushkevich for BCF and Langmuir for BCR. Temkin model is describing the heterogeneity of the energy of the active sites on the adsorbent. Temkin’s equation assumes that the adsorption heat of molecules in the layer decreases linearly, which may be due to adsorbent-adsorbate interactions, and adsorption is characterized by an even distribution of binding energy [47], which was the highest in the case of BCS, 144.53 kJ/mol. In the Dubinin-Radushkevich model, the distribution of pores in adsorbents to follow Gaussian energy distribution is assumed [48], and the highest energy was noted for BCF, 253.27 kJ/mol. In the Langmuir model, a monolayer coverage is assumed [49] and the highest sorption capacity was noted for BCR, 418.55 mg/g.
The process of sorption is dependent on the presence of co-solutes that may compete with adsorbate with active sites. In the presence of inorganic ions (Figure 3c), the efficiency of the process was lower. Common inorganic ions such as chlorides and nitrates revealed the lowest detrimental effect and about 20–30% lowered adsorption was noted. The highest reduction in NTZ adsorption (almost 60%) was noted in the presence of carbonates.
The presence of DOM in the natural environment may impact the adsorption [18]. At environmentally relevant concentrations (up to 10 mg/L) DOM acts as the factor increasing the adsorption of NTZ (Figure 3d). DOM may chelate the substances in the environment thus preventing the adsorption or may be sorbed onto an adsorbent surface introducing new sites and increasing the adsorption [50]. At lower concentrations, the adsorption was increased, whereas at higher concentrations the competition with active sites on the adsorbent surface. The results from the studies on the effect of inorganic ions and dissolved organic matter were used for predicting the efficiency of NTZ removal from the water matrix. Tap water did not affect NTZ adsorption significantly (Figure 3e), whereas in treated wastewater the adsorption was at about 20% lower, suggesting that dissolved organic matter had higher impact on NTZ adsorption onto tested biochar.
Generally, adsorption results from the interaction between different pores: both micropores and mesopores [44]. The process of the adsorption of NTZ onto tested samples was governed by different interactions. For the description of adsorption onto carbonaceous materials, several mechanisms are described including electrostatic, hydrophobic interactions, and hydrogen bond (including charge-assisted hydrogen bond) formation [46,51]. Hydrogen bonding between carbonyl groups (COO) and hydroxyl oxygen or protonated amine could also be responsible for NTZ adsorption. In summary, the application of carbonaceous adsorbents is effective and carbonaceous adsorbents can be easily modified to improve antiparasitic drug adsorption.
It is difficult to compare the obtained sorption results with literature data as nitazoxanide is not tested sorbate. Thus, the comparison may be performed only considering the antiparasitic activity of drugs and carbonaceous materials (Table 5). Interestingly, not the extent of surface area was the key parameter governing the adsorption, as materials with the highest surface area were not revealing the highest sorption capacity. The results obtained by us fit into this where the Langmuir sorption capacity of BCR was very high (almost 420 mg/g), but the surface area was low, 26 m2/g.

3. Materials and Methods

3.1. Biochar Production and Characterization

Biochar (BC) was produced by pyrolysis of pelletized biomass feedstock in a pilot reactor at 600 °C in the N2 atmosphere for 3 h. Due to the applied material, wheat straw-derived biochar was labeled as BCS, sunflower husk-derived BC- as BCF, and biochar obtained from residues from biogas production was labeled BCR. The obtained BC was milled and sieved and a fraction < 2.0 mm was used for adsorption studies. The porosity of the tested biochar (SBET surface area, micropore volume, and pore diameter) was analyzed in ASAP 2420 Analyzer (Micromeritics, Norcross, GA, USA), and the elemental analysis (content of C, H, N) was performed in CHN/CHNS EuroEA3000 Elemental Analyzer (EuroVector, Pavia, Italy). Surface characteristics, e.g., the presence of the surface functional groups was analyzed by spectroscopic methods. FTIR spectra were collected in Bio-Rad Excalibur 3000 MX spectrometer equipped with photoacoustic detector MTEC300, and XPS (survey, O, C, N peaks) were examined in UHV (Prevac, Rogów, Poland). Ash content was calculated after the exposure of 1 g of biochar to 760 °C for 6 h in the muffle furnace (MagmaTherm, Kraków, Poland). Total carbon (TC), inorganic carbon (IC), and total organic carbon (TOC) of biochar were estimated in the Shimadzu TOC/N analyzer. The zeta potential measurements were carried out in the pH value range of 3–10 (Zetasizer 3000, Malvern Instruments with 0.1 M HCl or 0.1 M NaOH used for pH correction. The surface morphology was examined by Scanning Electron Microscopy equipped with EDS (Quanta 3D FEG, FEI).

3.2. Adsorption Studies

Nitazoxanide and tannic acid were obtained from Sigma-Aldrich (Poznań, Poland), whereas NaCl, NaNO3, Na2CO3, and Na3PO4 were purchased in POCH (Poland). The ultrapure water was produced by a Millipore Direct Q 3UV water purification system (Millipore, Livingston, UK). Adsorption was performed using the batch technique in 50 mL Falcon tubes, where 100 mg of biochar was contacted with 50 mL of a solution containing 20 mg/L NTZ in distilled water without modification of pH (pH of the solution was 6.4). For isotherm modeling concentrations 10–100 mg/L were applied. The effect of inorganic ions: Cl, PO43−, NO3, CO32− was tested using respective sodium salts at the concentration of 0.005 M. As the representative of the dissolved organic matter (DOM), a tannic acid solution was chosen. The effect of the water matrix was established using distilled water (DW), tap water (TP), and wastewater effluent (TW). Tap water was collected from the municipal system in Lublin, Poland, and the water was characterized by low NO3 content (<2 mg/L), presence of chlorides (37 mg/L), Fe (52 mg/L), and pH = 7.2. The TWW was collected from the mechanical-biological municipal wastewater treatment plant in Lublin “Hajdów”. The TWW was characterized by low biological (5.7 mg/L) and chemical (35.1 mg/L) oxygen demand, total suspended solids (up to 6.4 mg/L), and total nitrogen (10.72 mg/L) and phosphorous (0.27 mg/L) contents. In TW the presence of chlorides (35 mg/L), nitrates (<2 µg/L), and sulfates (41 mg/L) was determined. Kinetics was optimized in 5, 10, 30, 60, and 120 min and 24, 48 and 72 h. For the isotherm modeling, the time was set at six days. All of the samples were mixed (120 rpm) in the dark at room temperature. Then, the obtained solution was filtered (0.45 µm) and analyzed. The collected aliquots were analyzed by using an Agilent LC-DAD chromatograph (1260 Infinity II) equipped with an InfinityLab Poroshell 120 EC-C18 column (3.0 × 150 mm, 2.7 µm), using the mixture H2O + CH3COONH4 (pH = 6): ACN (v/v = 60:40) as mobile phase (flow 0.5 mL/min, temperature 30 °C), and analyzed at λNTZ = 240 nm, RT = 3.99 min (the fitting of the calibration curve R2 = 0.9998).
The amount of adsorbed NTZ (cs, mg/g) was calculated considering the difference between the initial concentration of NTZ and equilibrium concentration (ce, mg/L) and volume of the solution (50 mL) and adsorbent mass (100 ± 2 mg). For kinetic and isotherm modeling the well-known models: pseudo-first-order (PFO), pseudo-second-order (PSO), Elovich (E), Intraparticle Diffusion (IPD), and Langmuir (L), Freundlich (F), Temkin (T), and Dubinin-Radushkevich (DR), respectively, were applied [52,53], and the respective constants and parameters were calculated from the linear forms of the equations. All experiments were run in duplicate and the mean values were presented. In the figures displayed, the error bars were added.

4. Conclusions

The application of pelletized biochar may be an effective solution for the pollution of water by different drugs. The process of sorption is efficient and enables one to remove NTZ in one hour. Although the obtained material differed in physicochemical properties, biochar was characterized by low surface area (with the highest value obtained for BCR—26.05 m2/g). Biochar obtained from residues from biogas production possessed also the mostly hydrophilic/polar surface (connected with the highest amount of O%). The surface of biochar was rich in functional groups (–OH, C=C, C=O, C–N, C=N, N–H) whereas the surface of BCR was graphitized. The presence of voids and channels in the structure of BC was evidenced in SEM images. The highest amount of adsorbed NTZ (almost 14 mg/g) was observed on BCR. In general, the process of sorption was rather fast and the sorption equilibrium was maintained for one hour indicating potential practical application. In general, the maximum adsorption capacity of all samples increased in the following order BCS < BCF < BCR. The process of NTZ adsorption followed mainly PSO kinetics indicating that the adsorption rate was combined with the number of binding sites and governed by chemisorption. The presence of inorganic ions had a detrimental effect on sorption and carbonates were the most effective in hindering the process. The environmentally relevant concentration of DOM (10 mg/L) did not affect the process (whereas, in excess of DOM, adsorption was significantly lower). The model studies were supported by the results with a real water matrix, in which only a 15% reduction of adsorption efficiency was noted in wastewater effluent. Depending on the applied feedstock, various models described NTZ adsorption onto tested biochars. For BCS, the Temkin model revealed the highest fitting, whereas Dubinin-Radushkevich for BCF and Langmuir for BCR. The process of the adsorption of NTZ onto tested samples was governed by different interactions including electrostatic, hydrophobic interactions, and hydrogen bonding between carbonyl groups (COO) and hydroxyl oxygen or protonated amine. In summary, the application of carbonaceous adsorbents in pelletized form is effective and carbonaceous adsorbents can be easily modified to improve antiparasitic drug adsorption.

Author Contributions

Conceptualization, B.C.; methodology, B.C., R.K. and R.Z.; validation, B.C.; formal analysis, A.S. and B.C.; investigation, A.S., K.J., R.K., R.Z. and K.R.; writing—original draft preparation, A.S. and B.C.; writing—review and editing, B.C.; visualization, A.S. and B.C.; supervision, H.W. and B.C. All authors have read and agreed to the published version of the manuscript.

Funding

This research received no external funding.

Institutional Review Board Statement

Not applicable.

Informed Consent Statement

Not applicable.

Data Availability Statement

Data will be shared on the request.

Acknowledgments

Igor Różyło is truly acknowledged for his help during the experiments.

Conflicts of Interest

The authors declare no conflict of interest.

Sample Availability

Samples of the compounds are available from the authors.

References

  1. Xu, S.; Yamamoto, N. Anti-Infective Nitazoxanide Disrupts Transcription of Ribosome Biogenesis-Related Genes in Yeast. Genes Genom. 2020, 42, 915–926. [Google Scholar] [CrossRef]
  2. Al-Kuraishy, H.M.; Al-Gareeb, A.I.; Elekhnawy, E.; Batiha, G.E.-S. Nitazoxanide and COVID-19: A Review. Mol. Biol. Rep. 2022, 49, 11169–11176. [Google Scholar] [CrossRef]
  3. Liu, L.X.; Weller, P.F. Antiparasitic Drugs. N. Engl. J. Med. 1996, 334, 1178–1184. [Google Scholar] [CrossRef]
  4. Musher, D.M.; Logan, N.; Hamill, R.J.; DuPont, H.L.; Lentnek, A.; Gupta, A.; Rossignol, J.-F. Nitazoxanide for the Treatment of Clostridium difficile Colitis. Clin. Infect. Dis. 2006, 43, 421–427. [Google Scholar] [CrossRef]
  5. Arnold, M.; Lang, E.; Modicano, P.; Bissinger, R.; Faggio, C.; Abed, M.; Lang, F. Effect of Nitazoxanide on Erythrocytes. Basic Clin. Pharmacol. Toxicol. 2014, 114, 421–426. [Google Scholar] [CrossRef]
  6. Sukanya, R.; Mohandoss, S.; Lee, Y.R. Synthesis of Active-Site Rich Molybdenum-Doped Manganese Tungstate Nanocubes for Effective Electrochemical Sensing of the Antiviral Drug (COVID-19) Nitazoxanide. Chemosphere 2023, 311, 137005. [Google Scholar] [CrossRef]
  7. Blum, V.F.; Cimerman, S.; Hunter, J.R.; Tierno, P.; Lacerda, A.; Soeiro, A.; Cardoso, F.; Bellei, N.C.; Maricato, J.; Mantovani, N.; et al. Nitazoxanide Superiority to Placebo to Treat Moderate COVID-19—A Pilot Prove of Concept Randomized Double-Blind Clinical Trial. eClinicalMedicine 2021, 37, 100981. [Google Scholar] [CrossRef]
  8. Fox, L.M.; Saravolatz, L.D. Nitazoxanide: A New Thiazolide Antiparasitic Agent. Clin. Infect. Dis. 2005, 40, 1173–1180. [Google Scholar] [CrossRef]
  9. AlGabbani, Q. Nanotechnology: A Promising Strategy for the Control of Parasitic Infections. Exp. Parasitol. 2023, 250, 108548. [Google Scholar] [CrossRef]
  10. Patel, M.; Kumar, R.; Kishor, K.; Mlsna, T.; Pittman, C.U.; Mohan, D. Pharmaceuticals of Emerging Concern in Aquatic Systems: Chemistry, Occurrence, Effects, and Removal Methods. Chem. Rev. 2019, 119, 3510–3673. [Google Scholar] [CrossRef] [Green Version]
  11. Pan, B.; Xing, B. Adsorption Mechanisms of Organic Chemicals on Carbon Nanotubes. Environ. Sci. Technol. 2008, 42, 9005–9013. [Google Scholar] [CrossRef]
  12. Xiong, C.; Liu, F.; Gao, J.; Jiang, X. A N-Doped Porous Carbon Derived from Deep Eutectic Solvent for Adsorption of Organic Contaminants from Aqueous or Oil Solution. RSC Adv. 2020, 10, 34953–34958. [Google Scholar] [CrossRef]
  13. Adeola, A.O.; de Lange, J.; Forbes, P.B.C. Adsorption of Antiretroviral Drugs, Efavirenz and Nevirapine from Aqueous Solution by Graphene Wool: Kinetic, Equilibrium, Thermodynamic and Computational Studies. Appl. Surf. Sci. Adv. 2021, 6, 100157. [Google Scholar] [CrossRef]
  14. Leininger, A.; Ren, Z.J. Circular Utilization of Food Waste to Biochar Enhances Thermophilic Co-Digestion Performance. Bioresour. Technol. 2021, 332, 125130. [Google Scholar] [CrossRef]
  15. Zhang, X.; Gang, D.D.; Sun, P.; Lian, Q.; Yao, H. Goethite Dispersed Corn Straw-Derived Biochar for Phosphate Recovery from Synthetic Urine and Its Potential as a Slow-Release Fertilizer. Chemosphere 2021, 262, 127861. [Google Scholar] [CrossRef]
  16. Jeong, N.; Han, S.O.; Kim, H.; Kim, C.; Hong, S.; Park, S.; Jang, M. Synthesis of Calcium Aluminate Nanoflakes and Nanochains from Woody Biomass. Mater. Charact. 2015, 110, 68–76. [Google Scholar] [CrossRef]
  17. Alves, B.S.Q.; Zelaya, K.P.S.; Colen, F.; Frazão, L.A.; Napoli, A.; Parikh, S.J.; Fernandes, L.A. Effect of Sewage Sludge and Sugarcane Bagasse Biochar on Soil Properties and Sugar Beet Production. Pedosphere 2021, 31, 572–582. [Google Scholar] [CrossRef]
  18. Gui, X.; Liu, C.; Li, F.; Wang, J. Effect of Pyrolysis Temperature on the Composition of DOM in Manure-Derived Biochar. Ecotoxicol. Environ. Saf. 2020, 197, 110597. [Google Scholar] [CrossRef]
  19. Kończak, M.; Oleszczuk, P.; Różyło, K. Application of Different Carrying Gases and Ratio between Sewage Sludge and Willow for Engineered (Smart) Biochar Production. J. CO2 Util. 2019, 29, 20–28. [Google Scholar] [CrossRef]
  20. Monisha, R.S.; Mani, R.L.; Sivaprakash, B.; Rajamohan, N.; Vo, D.-V.N. Green Remediation of Pharmaceutical Wastes Using Biochar: A Review. Environ. Chem. Lett. 2022, 20, 681–704. [Google Scholar] [CrossRef]
  21. Joseph, S.; Cowie, A.L.; Van Zwieten, L.; Bolan, N.; Budai, A.; Buss, W.; Cayuela, M.L.; Graber, E.R.; Ippolito, J.A.; Kuzyakov, Y.; et al. How Biochar Works, and When It Doesn’t: A Review of Mechanisms Controlling Soil and Plant Responses to Biochar. GCB Bioenergy 2021, 13, 1731–1764. [Google Scholar] [CrossRef]
  22. Wang, D.; Jiang, P.; Zhang, H.; Yuan, W. Biochar Production and Applications in Agro and Forestry Systems: A Review. Sci. Total Environ. 2020, 723, 137775. [Google Scholar] [CrossRef] [PubMed]
  23. Glaser, B.; Wiedner, K.; Seelig, S.; Schmidt, H.-P.; Gerber, H. Biochar Organic Fertilizers from Natural Resources as Substitute for Mineral Fertilizers. Agron. Sustain. Dev. 2015, 35, 667–678. [Google Scholar] [CrossRef] [Green Version]
  24. Agrafioti, E.; Bouras, G.; Kalderis, D.; Diamadopoulos, E. Biochar Production by Sewage Sludge Pyrolysis. J. Anal. Appl. Pyrolysis 2013, 101, 72–78. [Google Scholar] [CrossRef]
  25. Islam, M.A.; Morton, D.W.; Johnson, B.B.; Angove, M.J. Adsorption of Humic and Fulvic Acids onto a Range of Adsorbents in Aqueous Systems, and Their Effect on the Adsorption of Other Species: A Review. Sep. Purif. Technol. 2020, 247, 116949. [Google Scholar] [CrossRef]
  26. Sadowska, U.; Zaleski, T.; Kuboń, M.; Latawiec, A.; Klimek-Kopyra, A.; Sikora, J.; Gliniak, M.; Kobyłecki, R.; Zarzycki, R. Effect of the Application of Sunflower Biochar and Leafy Trees Biochar on Soil Hydrological Properties of Fallow Soils and under Soybean Cultivation. Materials 2023, 16, 1737. [Google Scholar] [CrossRef]
  27. Bhanvase, B.; Sonawane, S.; Pawade, V.; Pandit, A. (Eds.) Handbook of Nanomaterials for Wastewater Treatment; Elsevier: Amsterdam, The Netherlands, 2021; ISBN 978-0-12-821496-1. [Google Scholar]
  28. Wu, F.-C.; Tseng, R.-L.; Juang, R.-S. Characteristics of Elovich Equation Used for the Analysis of Adsorption Kinetics in Dye-Chitosan Systems. Chem. Eng. J. 2009, 150, 366–373. [Google Scholar] [CrossRef]
  29. Wang, J.; Guo, X. Rethinking of the Intraparticle Diffusion Adsorption Kinetics Model: Interpretation, Solving Methods and Applications. Chemosphere 2022, 309, 136732. [Google Scholar] [CrossRef]
  30. Matsui, Y.; Ando, N.; Yoshida, T.; Kurotobi, R.; Matsushita, T.; Ohno, K. Modeling High Adsorption Capacity and Kinetics of Organic Macromolecules on Super-Powdered Activated Carbon. Water Res. 2011, 45, 1720–1728. [Google Scholar] [CrossRef]
  31. Bénard, P.; Chahine, R. Carbon Nanostructures for Hydrogen Storage. In Solid-State Hydrogen Storage; Elsevier: Amsterdam, The Netherlands, 2008; pp. 261–287. ISBN 978-1-84569-270-4. [Google Scholar]
  32. Singh, A.K. Engineered Nanoparticles; Elsevier: Amsterdam, The Netherlands, 2016; ISBN 978-0-12-801406-6. [Google Scholar]
  33. Inyinbor, A.A.; Adekola, F.A.; Olatunji, G.A. Kinetics, Isotherms and Thermodynamic Modeling of Liquid Phase Adsorption of Rhodamine B Dye onto Raphia Hookerie Fruit Epicarp. Water Resour. Ind. 2016, 15, 14–27. [Google Scholar] [CrossRef] [Green Version]
  34. Nam, S.-W.; Choi, D.-J.; Kim, S.-K.; Her, N.; Zoh, K.-D. Adsorption Characteristics of Selected Hydrophilic and Hydrophobic Micropollutants in Water Using Activated Carbon. J. Hazard. Mater. 2014, 270, 144–152. [Google Scholar] [CrossRef] [PubMed]
  35. Różyło, K.; Jędruchniewicz, K.; Krasucka, P.; Biszczak, W.; Oleszczuk, P. Physicochemical Characteristics of Biochar from Waste Cricket Chitin (Acheta Domesticus). Molecules 2022, 27, 8071. [Google Scholar] [CrossRef] [PubMed]
  36. Lazar, G.; Ureche, D.; Ifrim, I.L.; Stamate, M.; Ureche, C.; Nedeff, V.; Nistor, I.D.; Finaru, A.L.; Lazar, I.M. Effects of the Environmental Stress on Two Fish Populations Revealed by Statistical and Spectral Analysis. Environ. Eng. Manag. J. 2012, 11, 109–124. [Google Scholar] [CrossRef]
  37. Mecozzi, M.; Pietroletti, M.; Scarpiniti, M.; Acquistucci, R.; Conti, M.E. Monitoring of Marine Mucilage Formation in Italian Seas Investigated by Infrared Spectroscopy and Independent Component Analysis. Environ. Monit. Assess. 2012, 184, 6025–6036. [Google Scholar] [CrossRef]
  38. Tomczyk, B.; Siatecka, A.; Jędruchniewicz, K.; Sochacka, A.; Bogusz, A.; Oleszczuk, P. Polycyclic Aromatic Hydrocarbons (PAHs) Persistence, Bioavailability and Toxicity in Sewage Sludge- or Sewage Sludge-Derived Biochar-Amended Soil. Sci. Total Environ. 2020, 747, 141123. [Google Scholar] [CrossRef] [PubMed]
  39. Koinuma, M.; Tateishi, H.; Hatakeyama, K.; Miyamoto, S.; Ogata, C.; Funatsu, A.; Taniguchi, T.; Matsumoto, Y. Analysis of Reduced Graphene Oxides by X-Ray Photoelectron Spectroscopy and Electrochemical Capacitance. Chem. Lett. 2013, 42, 924–926. [Google Scholar] [CrossRef] [Green Version]
  40. Rabchinskii, M.K.; Dideikin, A.T.; Kirilenko, D.A.; Baidakova, M.V.; Shnitov, V.V.; Roth, F.; Konyakhin, S.V.; Besedina, N.A.; Pavlov, S.I.; Kuricyn, R.A.; et al. Facile Reduction of Graphene Oxide Suspensions and Films Using Glass Wafers. Sci. Rep. 2018, 8, 14154. [Google Scholar] [CrossRef] [PubMed] [Green Version]
  41. Radaelli, G.; Heredia-Guerrero, J.A.; Masood, M.T.; Ceseracciu, L.; Davis, A.; Carzino, R.; Prato, M.; Bayer, I.S.; Athanassiou, A. Highly Effective Antiadhesive Coatings from PH-Modified Water-Dispersed Perfluorinated Acrylic Copolymers: The Case of Vulcanizing Rubber. Adv. Mater. Interfaces 2016, 3, 1600069. [Google Scholar] [CrossRef]
  42. Oh, Y.J.; Yoo, J.J.; Kim, Y.I.; Yoon, J.K.; Yoon, H.N.; Kim, J.-H.; Park, S.B. Oxygen Functional Groups and Electrochemical Capacitive Behavior of Incompletely Reduced Graphene Oxides as a Thin-Film Electrode of Supercapacitor. Electrochim. Acta 2014, 116, 118–128. [Google Scholar] [CrossRef] [Green Version]
  43. Shirvanimoghaddam, K.; Czech, B.; Wiącek, A.E.; Ćwikła-Bundyra, W.; Naebe, M. Sustainable Carbon Microtube Derived from Cotton Waste for Environmental Applications. Chem. Eng. J. 2018, 361, 1605–1616. [Google Scholar] [CrossRef]
  44. Wang, M.; Cai, Y.; Zhou, B.; Yuan, R.; Chen, Z.; Chen, H. Removal of PFASs from Water by Carbon-Based Composite Photocatalysis with Adsorption and Catalytic Properties: A Review. Sci. Total Environ. 2022, 836, 155652. [Google Scholar] [CrossRef]
  45. Diniz, V.; Gasparini Fernandes Cunha, D.; Rath, S. Adsorption of Recalcitrant Contaminants of Emerging Concern onto Activated Carbon: A Laboratory and Pilot-Scale Study. J. Environ. Manag. 2023, 325, 116489. [Google Scholar] [CrossRef]
  46. Ambaye, T.G.; Vaccari, M.; van Hullebusch, E.D.; Amrane, A.; Rtimi, S. Mechanisms and Adsorption Capacities of Biochar for the Removal of Organic and Inorganic Pollutants from Industrial Wastewater. Int. J. Environ. Sci. Technol. 2021, 18, 3273–3294. [Google Scholar] [CrossRef]
  47. Dada, A.O.; Olalekan, A.P.; Olatunya, A.M.; Dada, O. Langmuir, Freundlich, Temkin and Dubinin–Radushkevich Isotherms Studies of Equilibrium Sorption of Zn2+ unto Phosphoric Acid Modified Rice Husk. IOSR J. Appl. Chem. 2012, 3, 38–45. [Google Scholar]
  48. Saleh, T.A. Isotherm Models of Adsorption Processes on Adsorbents and Nanoadsorbents. In Interface Science and Technology; Elsevier: Amsterdam, The Netherlands, 2022; Volume 34, pp. 99–126. ISBN 978-0-12-849876-7. [Google Scholar]
  49. Desta, M.B. Batch Sorption Experiments: Langmuir and Freundlich Isotherm Studies for the Adsorption of Textile Metal Ions onto Teff Straw (Eragrostis Tef) Agricultural Waste. J. Thermodyn. 2013, 2013, 375830. [Google Scholar] [CrossRef] [Green Version]
  50. Qi, Y.; Cao, H.; Pan, W.; Wang, C.; Liang, Y. The Role of Dissolved Organic Matter during Per- and Polyfluorinated Substance (PFAS) Adsorption, Degradation, and Plant Uptake: A Review. J. Hazard. Mater. 2022, 436, 129139. [Google Scholar] [CrossRef]
  51. Keerthanan, S.; Bhatnagar, A.; Mahatantila, K.; Jayasinghe, C.; Ok, Y.S.; Vithanage, M. Engineered Tea-Waste Biochar for the Removal of Caffeine, a Model Compound in Pharmaceuticals and Personal Care Products (PPCPs), from Aqueous Media. Environ. Technol. Innov. 2020, 19, 100847. [Google Scholar] [CrossRef]
  52. Hu, Q.; Zhang, Z. Application of Dubinin–Radushkevich Isotherm Model at the Solid/Solution Interface: A Theoretical Analysis. J. Mol. Liq. 2019, 277, 646–648. [Google Scholar] [CrossRef]
  53. Largitte, L.; Pasquier, R. A Review of the Kinetics Adsorption Models and Their Application to the Adsorption of Lead by an Activated Carbon. Chem. Eng. Res. Des. 2016, 109, 495–504. [Google Scholar] [CrossRef]
Figure 1. The spectroscopic analysis of tested materials: (a) FTIR spectra, (b) XPS C peak, and (c) XPS O peak.
Molecules 28 05919 g001
Figure 2. SEM images of tested materials: (a) BCS, (b) BCF, and (c) BCR.
Molecules 28 05919 g002
Figure 3. Adsorption studies of NTZ onto tested BC: (a) kinetics cNTZ = 20 mg/L mBC = 100 mg; (b) CNTZ = 10–100 mg/L, mBC = 100 mg; (c) effect of inorganic ions cion = 0.005 M; (d) effect of dissolved organic matter, cTA = 10–100 mg/L; (e) effect of water matrix: DW—distilled water, TP—tap water, TW—treated wastewater.
Molecules 28 05919 g003
Table 1. Antiparasitic drugs concentration [ng/L] in waters [10].
CompoundGroundwaterRiver WaterWWTP on River Doubs (Eastern France)WWTP Effluents (Greece Volos)WWTP Influents (Portugal Coimbra)WWTP Effluents (Portugal Coimbra)Hospital Effluents (Portugal Coimbra)
Metronidazole4.9–35.6 Taiwan0.05–13.51 Bangladesh35.835.20–11319.4–83.51559–12,315
Thiabendazole (detection limit −1.6 China Jiulong River) 0–15.30.493–12.19.17–1746
Albendazole1.9 Serbia 0–1.79 28.3
Table 2. The physicochemical properties of obtained BC.
SBET 1 (m2/g)Vp 2 (cm3/g)D 3 (nm)Ash 4 (%)N 5
(%)
C 5
(%)
H 5 (%)O 6 (%)H/C
(-)
(O + N)/C
(-)
O/C
(-)
TC 7 (mg/g)IC 8 (mg/g)TOC 9 (mg/g)
BCS0.0930.00142495.41 14.991.0377.841.484.650.0190.0730.060768.020.55767.46
BCF0.9410.00079814.046.700.9686.711.673.960.0190.0570.046878.520878.52
BCR26.050.00470610.6325.933.6623.490.5746.350.0242.1291.973633.001.97631.00
1 SBET—surface area (m2/g), 2 Vp—pore volume (cm3/g), 3 D—pore diameter (nm), 4 ash content after burning at 600 °C, 5 N, C, H content from CHN analysis (%), 6 O—content calculated considering ash and CHN content, 7 TC—total carbon, 8 IC—inorganic carbon, 9 TOC—total organic carbon.
Table 3. Kinetic parameters of adsorption of NTZ onto tested BC from the solutions 20 mg/L.
PFOPSOElovichIPD
qmaxk1q1R2k2q2R2αβR2KIPDβR2
BCS9.943.8520.9740.52690.01569.530.99141055.21.6670.76650.056.210.5876
BCF10.253.8281.0520.30220.032311.410.9922147.01.1390.68890.077.170.4461
BCR13.4413.9961.0660.96010.237113.800.99991720.60.9850.78710.0710.050.5205
qexp (mg/L); k1 (min−1); q1, q2 (mg/L); R2 (-); k2 (g/mg min); α (mg/g min); β (g/mg); KIPD (mg/g min1/2).
Table 4. Isotherm modeling of the obtained results.
LFTDR
QLKL
×10−3
R2RLKFnR2QTBR2QDEBR2
BCS133.623.730.97620.670.6530.9610.95760.1272144.530.996135.485118.11220.030.9461
BCF34.9312.170.86520.700.5941.0530.84320.1405126.320.983843.898110.08253.270.9925
BCR418.551.180.99960.670.4641.0330.99750.1152143.770.952430.480125.09196.150.8294
QF, QL, QD—(mg/g), KL—(L/g), B—(kJ/mol), E—(kJ/mol).
Table 5. Langmuir sorption capacities of various types of adsorbents for removal of metronidazole [10].
MaterialpHTemp. [°C]Surface Area [m2/g]Langmuir Sorption Capacity [mg/g]Recovery/
Regeneration
Carbon materials F400725919248.6Yes
Carbon materials ACF7251441249.2Yes
Carbon materials MWCNT72514449.8Yes
Carbon materials CMK-3725917219.3Yes
Carbon materials MWCNT-HNO37253154.4Yes
Carbon materials F400-HNO3725823234.4Yes
Commercial activated carbon (S)6–7251225328.61No
Commercial activated carbon (M)6–7251301213.94No
Petroleum coke activated carbon ©6–725848287.53No
Siris Seedpod activated carbon7301676.61180.77No
Siris Seedpod KOH activated carbon7301824.88191.68No
BCR—this study6–72526.05418.55-
Disclaimer/Publisher’s Note: The statements, opinions and data contained in all publications are solely those of the individual author(s) and contributor(s) and not of MDPI and/or the editor(s). MDPI and/or the editor(s) disclaim responsibility for any injury to people or property resulting from any ideas, methods, instructions or products referred to in the content.

