Abstract
ReS2, as a new member of transition metal dichalcogenides (TMDCs), has emerged as a promising substrate for semiconductor surface-enhanced Raman spectroscopy (SERS) due to its unique optoelectronic properties. Nevertheless, the sensitivity of the ReS2 SERS substrate poses a significant challenge to its widespread application in trace detection. In this work, we present a reliable approach for constructing a novel ReS2/AuNPs SERS composite substrate, enabling ultrasensitive detection of trace amounts of organic pesticides. We demonstrate that the porous structures of ReS2 nanoflowers can effectively confine the growth of AuNPs. By precisely controlling the size and distribution of AuNPs, numerous efficient and densely packed “hot spots” were created on the surface of ReS2 nanoflowers. As a result of the synergistic enhancement of the chemical and electromagnetic mechanisms, the ReS2/AuNPs SERS substrate demonstrates high sensitivity, good reproducibility, and superior stability in detecting typical organic dyes such as rhodamine 6G and crystalline violet. The ReS2/AuNPs SERS substrate shows an ultralow detection limit of 10−10 M and a linear detection of organic pesticide molecules within 10−6–10−10 M, which is significantly lower than the EU Environmental Protection Agency regulation standards. The strategy of constructing ReS2/AuNPs composites would contribute to the development of highly sensitive and reliable SERS sensing platforms for food safety monitoring.
1. Introduction
As an ultra-sensitive, non-damaging, and rapid vibrational spectroscopy technology, surface-enhanced Raman spectroscopy (SERS) has a wide variety of applications in food safety, environmental monitoring, and biomedicine [1,2,3,4,5]. Since the initial confirmation by Fleischmann et al. in 1974 that pyridine molecules adsorb onto rough silver surfaces under electrode action [6], SERS technology has undergone extensive research and can now detect a wide range of small-molecule analytes [7,8,9], including proteins, nucleic acids, antibiotics, pesticide residues, and organic pollutants. In comparison to detection methods such as high-performance fluorescence analysis [10], gas chromatography-mass spectrometry (GC-MS) [11], and liquid chromatography (HPLC) [12], SERS exhibits remarkable advantages in terms of rapid and straightforward molecular-specific detection.
Generally, the Raman signal amplification of the target analyte depends on the material properties of SERS substrates. For example, noble metal SERS substrates based on an electromagnetic mechanism (EM) amplify the Raman signal via a unique localized surface plasmon resonance (LSPR) [13,14]. Fu et al. utilized an ultrathin alumina membrane surface patterning technique to fabricate arrays of Ag nanoparticles, achieving an EM-based SERS enhancement factor of up to 109 [15]. Alternately, semiconductor SERS substrates based on a chemical mechanism (CM) amplify Raman signals through charge or energy transfer between the substrate and target molecules [16,17,18]. Muehlethaler et al. demonstrated that the monolayer MoS2 exhibits a SERS enhancement factor of 105 through the CM [19]. Therefore, the enhancement of LSPR is typically higher than that of charge transfer by several orders of magnitude [20]; however, the disadvantages of easy agglomeration, instability, and poor biocompatibility have seriously hampered the development of noble metal colloidal SERS substrates.
Recently, 2D semiconductor SERS substrates such as transition metal dichalcogenides (TMDCs) have been extensively studied and developed [21,22,23,24,25,26,27,28]. Thanks to their large surface area, tunable band gap, good biocompatibility, and easy preparation, TMDCs have emerged as ideal SERS substrates for supporting CM. Lv et al. successfully synthesized the monolayer NbS2 using the chemical vapor deposition method, demonstrating a superior sensitivity for trace detection compared to graphene [29]. ReS2, the new member of the TMDCs, possesses excellent properties that are different from the members of TMDCs such as MoS2 owing to its unique 1T’ crystal structure [30,31]. More importantly, ReS2 nanosheets maintain direct bandgap semiconductor properties due to the electronic and vibrational decoupling, exhibiting an anisotropic SERS response, and thick-related SERS has been reported in pioneering studies [32,33,34]. Miao et al. proved that the ReS2 nanosheets SERS effect is derived from a charge transfer process between ReS2 and target molecules. In addition, the SERS sensitivity of ReS2 nanosheets decreases with the increase in thickness [32]. Lin et al. confirmed that the angle-dependent Raman enhancement of ReS2 with CuPc molecules arises from the anisotropic charge carrier mobility [33]. Meanwhile, Wang et al. reported that the different substrates of ReS2 nanosheets can efficiently suppress the fluorescent background of SERS and enable steady detection of the dye molecules at 10−7 M [35]. However, although the SERS substrates of ReS2 nanosheets exhibit higher homogeneity, better chemical stability, and better biological properties, the Raman enhancement is far less than that of noble metal nanostructures, thus limiting its trace detection capability for target molecules, such as aromatic or toxic compounds.
The construction of novel hybrid or heterostructure SERS platforms combining EM and CM has emerged as an ideal method to obtain higher Raman enhancement [36,37,38,39,40]. For example, Shao et al. fabricated the first ReS2 nanocavity-based SERS substrate on gold-modified silicon pyramids by employing a thermal evaporation technique and a hydrothermal method, which showed efficient and stable detection performance in the low-concentration detection of real samples [41]. Furthermore, Liu et al. proved that the 3D nanoflowers structure has a bigger surface area and richer reactive edge sites compared to the nanosheet structure of ReS2 [42], rendering it an excellent photocatalyst.
Inspired by the above study, a synergistic enhanced SERS substrate of ReS2/AuNPs was developed, as shown in Figure 1. ReS2 nanoflowers are prepared by hydrothermal synthesis and possess abundant multi-active sites, which exhibit powerful catalytic functions and provide more adsorption sites for the target molecules. In addition, AuNPs can grow uniformly on the surface of ReS2 nanoflowers without reducing agents and bind to them through Au–S covalent bonds. The high sensitivity of SERS detection was achieved by controlling the size and gap of the AuNPs and then determining the specific enhancement mechanism of the SERS effect. The two representative organic dye molecules of crystalline violet (CV) and rhodamine 6G (R6G) were selected for evaluation of the analytical ability and SERS performance on the ReS2/AuNPs substrate, and applied to organic pesticide detection. The results showed that the detection limits of the ReS2/AuNPs composites for R6G, CV, and tetramethylthiuram disulfide (TTD) were as low as 10−10 M, with detection deviations ranging from 14.7% to 15.3%. This demonstrates that the ReS2/AuNPs complexes have excellent sensitivity, reproducibility, and stability, making it feasible for trace determination of organic pollutants with high sensitivity and stability.
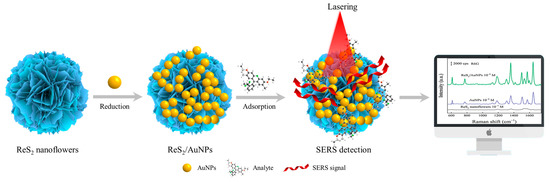
Figure 1.
Schematic of preparation and SERS detection of ReS2/AuNPs.
2. Results and Discussion
2.1. Preparation Process and Characterization Analysis of ReS2/AuNPs Complexes
Figure 2a shows the preparation process for the ReS2/AuNPs complexes. In order to uniformly attach the appropriate amount of AuNPs to the ReS2 nanoflowers without using a reducing agent, a large specific surface area and strongly catalytic properties of ReS2 nanoflowers were prepared via a hydrothermal synthesis at a temperature of 180 °C for 16 h. Then, under constant temperature at 80 °C, upon the addition of a certain concentration of HAuCl4 solutions, the color of the mixed solution gradually changed from pale yellow to deep purple (as illustrated in Figure 2d), indicating the successful reduction of AuNPs and synthesis of the ReS2/AuNPs complexes. Figure 2b,c display the transmission electron microscopy (TEM) images of the ReS2 nanoflowers and ReS2/AuNPs composites at appropriate magnification voltages ranging from 40 to 120 kV. The results show that the flower-like ReS2 has an average particle size of 49.5 nm, which uniformly adhered in parallel without stacking and dispersed homogeneously, as shown in Figure S1. The three-dimensional surface area of the ReS2 nanoflowers provides a number of adsorption sites for AuNPs, resulting in the reduced AuNPs being grown uniformly on its surface (shown in Figure 2c).
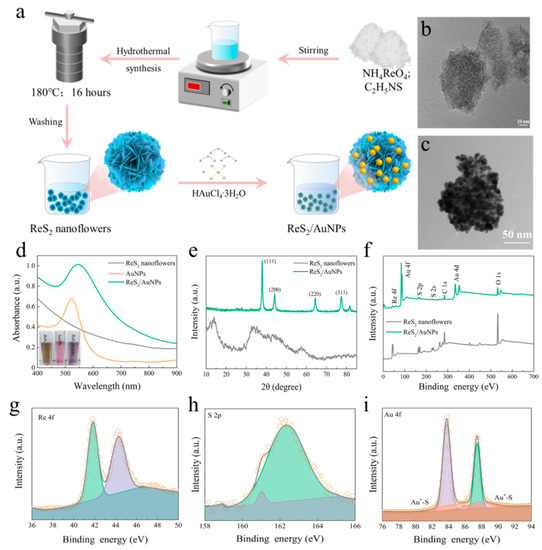
Figure 2.
(a) Preparation process of ReS2/AuNPs composite substrate. TEM images of (b) ReS2 nanoflowers, and (c) ReS2/AuNPs reduced at 0.08 mM HAuCl4. (d) Absorption spectra of ReS2 nanoflowers, AuNPs, and ReS2/AuNPs, reduced at 0.28 mM HAuCl4. (e) XRD spectra of ReS2 nanoflowers and ReS2/AuNPs. (f) XPS survey spectra for ReS2 nanoflowers and ReS2/AuNPs, (g) Re 4f, (h) S 2p, and (i) Au 4f in ReS2/AuNPs.
In addition, Figure 2d shows the UV–Vis absorption images of the ReS2 nanoflowers, AuNPs, and ReS2/AuNPs complexes at 400–900 nm. The results indicate that no distinctive characteristic peaks were found in the absorption spectra of ReS2 nanoflowers; however, a weak small shoulder peak appeared at 738 nm (Figure 2d). Compared to the ReS2 nanoflowers and AuNPs, the overall absorption intensity of the ReS2/AuNPs increased with a red-shift of the longitudinal LSPR peak to 545 nm with lateral broadening, indicating that the AuNPs of ReS2/AuNPs clustered on the surface of ReS2 nanoflowers. The small shoulder peak at 738 nm disappeared, indicating the successful complexation of the ReS2 nanoflowers with AuNPs. Figure 2e presents the X-ray diffraction (XRD) spectra of the ReS2 nanoflowers and the ReS2/AuNPs powder. Four diffraction peaks at 2θ = 13.9°, 34.9°, 44.5°, and 57.5° correspond to the (100), (002), (300), and (−122) crystallographic planes of ReS2, respectively, indicating the successful synthesis of ReS2 nanoflowers [43]. Following the involvement of AuNPs, four peaks were observed at 38°, 44.2°, 64.4°, and 77.6°, which are located in the (111), (200), (220), and (311) crystal planes of planar cubic Au [44].
Moreover, XPS spectra showed typical Re 4f, Au 4f, and S 2p characteristic diffraction peaks derived from the ReS2/AuNPs, as shown in Figure 2f,i. In contrast to the S 2p of ReS2 nanoflowers (Figure S2), the S 2p3/2 and S 2p1/2 peaks of ReS2/AuNPs were blue-shifted to 161 and 162.3 eV, respectively, which indicates the important synergistic role of the ReS2 nanoflowers in Au reduction. Furthermore, Figure 2i shows the bond energy peaks of Au 4f located at 83.7 and 87.4 eV with a binding energy difference of 3.7 eV, suggesting the successful Au reduction, whereas the symmetric peaks at 84.4 and 87.8 eV indicate the AuNPs adsorption with the ReS2 nanoflowers via Au–S bonds. As the most direct evidence, EDS images of Re, S, and Au elements confirm the formation of the ReS2/AuNPs complexes (Figure S1), and the elemental ratio values for Re, S, and Au were 1.5, 2.5, and 96%, respectively.
2.2. The Controlled Growth of AuNPs Assisted by ReS2 Nanoflowers
Figure 3b and Figure S3 display the TEM images of ReS2/AuNPs with different sizes of AuNPs. Under continuous stirring at a constant temperature of 80 °C, controlled ReS2/AuNPs composites with average sizes of 6.4 nm, 12.2 nm, and 22 nm were obtained by adding HAuCl4 solutions with concentrations of 0.08 mM, 0.28 mM, and 0.52 mM, respectively, to a 5 mL ReS2 nanoflowers solutions. In addition, the UV–Vis absorption spectra of ReS2/AuNPs with different sizes of AuNPs indicated that as the AuNPs’ size enlarges, the LSPR peak is red-shifted from 524 nm to 563 nm. In addition, various particle sizes of AuNPs show the different particle gaps on the surface of ReS2 nanoflowers, which is essential for the generation of “hot spots” with different intensities. Typically, the higher the concentration of HAuCl4, the larger the size of AuNPs aggregated on ReS2 nanoflowers. However, with the increasing HAuCl4 concentrations, the limited surface area of the ReS2 nanoflowers was unable to adsorb numerous large-sized AuNPs, resulting in the aggregation and overlapping of AuNPs, which may cause the intensity of the “hot spot” to decrease.
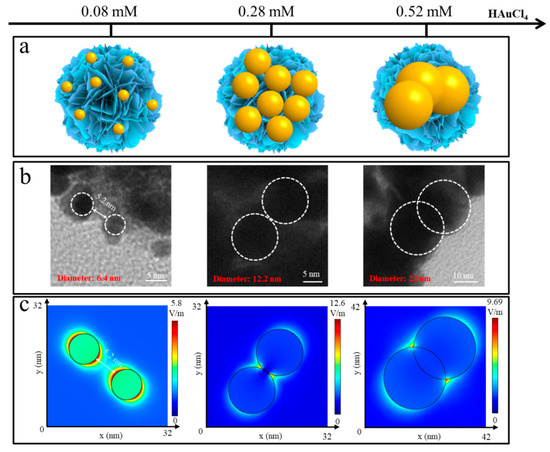
Figure 3.
(a) Diagram of ReS2/AuNPs with different AuNPs sizes. (b) TEM images of AuNPs with varying sizes and gaps. (c) Electric field intensity distribution corresponding to (b). Gradient color bar indicates the electric field intensity of E/E0.
Subsequently, the plasma oscillation process of the 514 nm laser excitation was simulated using finite elements to analyze the electromagnetic field intensity (E) distribution for different AuNPs sizes and gaps. The simulation conditions were as follows: three-dimensional frequency-domain modeling was utilized with the incident light vertically propagating along the Z-axis, initially polarized along the X-axis, and the light intensity set to 1 V/m. The solution domain was a cube with dimensions of 800 nm × 800 nm × 800 nm. Perfectly conducting boundaries were employed to eliminate scattering waves in all boundary directions. Figure 3c shows that, when the AuNP’s particle gap was larger than 5.2 nm, the E value was lower than 5.8 V/m, which is possibly related to weak LSPR. Moreover, the highest E value was 12.6 V/m, with gaps close to zero, which is attributed to the strong Au–S bonding interactions that formed tight and high-efficient “hot spots” for the 12.2 nm AuNPs on the surface of the ReS2 nanoflowers. Following the overlap of AuNPs, the E value gradually decreased and did not enhance the E value further, presumably owing to the dipole oscillations preventing the formation of a highly effective “hot spot” between the two contacting AuNPs [45].
2.3. Feasibility and Sensitivity Analysis of the ReS2/AuNPs SERS Substrate
Under optimized conditions, the enhanced sensing performance of ReS2/AuNPs as a SERS substrate was verified by detecting R6G and CV dye molecules. First, 10−5, 10−6, and 10−6 M concentrations of R6G solutions were soaked with ReS2 nanoflowers, AuNPs, and ReS2/AuNPs, respectively, for 1 h. After natural drying, SERS measurements were performed under the 514 nm excitation light. Figure 4a shows that the R6G Raman characteristic peaks at 611, 773, 1360, 1510, and 1645 cm−1 were detected for the ReS2 nanoflowers, AuNPs, and ReS2/AuNPs SERS substrates [46]. Notably, the ReS2 nanoflowers as a semiconductor SERS substrate could detect capable 10−5 M R6G, which is attributed to the CM of the ReS2 nanoflowers and the abundance of active sites. According to a previous study, the conduction band minimum (CBM) and valence band maximum (VBM) of the bilayer ReS2 were −4.46 and −5.86 eV, respectively [47]. The highest occupied molecular orbital (HOMO) energy levels and the lowest unoccupied molecular orbital (LUMO) energy levels of R6G were −5.7 and −3.4 eV, respectively [48]. When the excitation light irradiated the ReS2 nanoflowers surface, the electrons of VBM jumped to the CBM [49] and were rapidly transferred to the LUMO of the R6G dye molecules (Figure 4b), which makes the R6G dye molecules obtain a CM order-of-magnitude SERS enhancement.
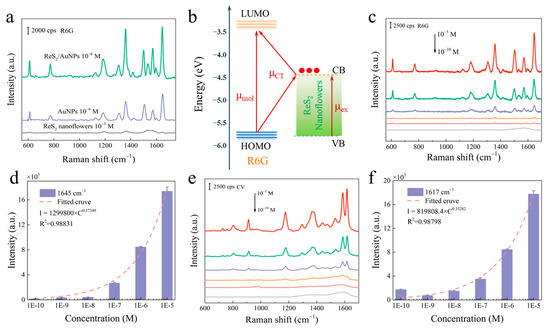
Figure 4.
(a) The R6G SERS spectra of the ReS2 nanoflowers, AuNPs, and ReS2/AuNPs substrate detection. (b) Schematic of charge transfer from the ReS2 nanoflowers to R6G. Concentration-dependent SERS spectra based on (c,d) R6G and (e,f) CV Raman characteristic peaks and their intensity-concentration relationships.
When the EM of AuNPs participated, the ReS2/AuNPs substrate formed an effective “hot spot,” which enhanced the Raman signal by two times compared to that of AuNPs (Figure S4). In addition, the Raman signal of 10−10 M R6G was detected by ReS2/AuNPs (Figure 4c) with the synergistic interaction of the local EM field generated by AuNPs and rapid charge transfer of ReS2/AuNPs complexes. Figure 4c,e show the variation in the SERS sensing ability of ReS2/AuNPs substrate with different R6G and CV concentrations (10−6–10−10 M). The SERS intensities of R6G and CV were reduced with reducing concentration, and the SERS signals from the strongest characteristic peaks of R6G and CV could still be measured at concentrations lower than 10−10 M. In addition, the Raman characteristic peaks of R6G at 1645 cm−1 and CV at 1617 cm−1 were selected for fitting the Lorentz function to investigate the dependence between SERS intensity and concentration. Figure 4d,f show that the SERS intensity obeyed a power law relationship with fitted correlation coefficient (R2) values greater than 0.9; the fitting formulas were IR6G = 1299800 × C0.37349, ICV = 819808.4 × C0.33282. These results indicate that the ReS2/AuNPs substrate has ultrahigh detection sensitivity for target molecules in the 10−6–10−10 M range.
2.4. Stability Analysis of the ReS2/AuNPs SERS Substrate
An ideal SERS sensor requires high sensitivity, as well as great repeatability and stability of the substrate. Therefore, to evaluate the repeatability of ReS2/AuNPs complexes, 14 detection sites were randomly selected from the substrate with adsorbed 10−6 M R6G and CV, as shown in Figure 5a,c. The results show that the SERS spectra of both R6G and CV exhibit consistent Raman characteristic peaks similar to those shown in Figure 4. In addition, the Raman signal intensities were relatively consistent. Figure 5b,d present the relative standard deviation (RSD) of the Raman peaks at 1360 cm−1 and 1617 cm−1 for R6G and CV in Figure 5a,c, respectively. The results demonstrated that the RSD of R6G and CV was 14.7% and 15.3%, respectively, suggesting great repeatability on the ReS2/AuNPs substrate. In addition, Figure 5e displays the SERS spectra obtained by testing the ReS2/AuNPs substrate adsorbed with R6G dye molecules, which was stored in the dark at room temperature, with measurements taken at seven-day intervals. The results show that the Raman signal intensity of RG6 did not significantly change even after the substrate was stored for more than a month, and the position of the peaks is not shifted in any way. Figure 5f demonstrates that the peak intensities of 6RG at 611 cm−1, 1360 cm−1, and 1645 cm−1 did not show any significant decrease after 14 days. Even after 42 days, only a minimal decline was observed. This indicates the high stability of the ReS2/AuNPs SERS substrate.
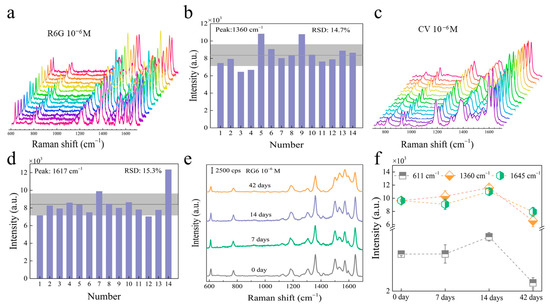
Figure 5.
SERS spectra of (a) R6G and (c) CV from ReS2/AuNPs substrate, and corresponding histograms for the characteristic peak intensity at (b) R6G and (d) CV. Note that in (a,c), the different colored curves represent the SERS spectra obtained from different sites tested. (e) SERS spectra of R6G at different storage times, and (f) characteristic peak intensities at different storage times.
2.5. The Detector Range and Practical Applications of ReS2/AuNPs SERS Substrate
First, anions and cationic dyes were utilized to study and analyze the suitability of the ReS2/AuNPs substrate for different kinds of surface charge target molecules. Figure 6a shows the SERS spectra of the ReS2/AuNPs solution immersed in a mixture of 10−6 M R6G, CV, ponceau S (PS), and trypan blue (TB) dye molecules after one hour. Figure 6b represents the SERS intensities of TB, PS, CV, and R6G at characteristic peaks located at 1460 cm−1, 1565 cm−1, 1617 cm−1, and 1360 cm−1, respectively. The results indicate that, although the ReS2/AuNPs SERS sensor was reduced in sensitivity to anions (PS, TB) compared to cationic dyes (R6G, CV), very complete SERS spectra of anionic dyes were still detected. In addition, the well-known Raman characteristic peaks of PS and TB appear at 1565 cm−1 and 1460 cm−1, respectively. This result indicates that the ReS2/AuNPs complexes are suitable for SERS detection of analytes with different surface charges, without the assistance of ligands.
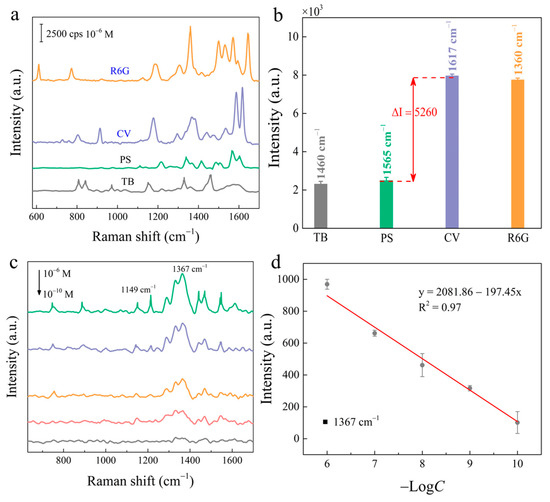
Figure 6.
(a) SERS spectra of ReS2/AuNPs substrate detecting 10−6 M cationic dyes (R6G, CV) and anionic dyes (PS, TB). (b) The intensity histograms of the Raman characteristic peaks for cations and anions. (c) SERS spectra of different concentrations of TTD solutions from the ReS2/AuNPs substrate detection. (d) Relationship between concentrations of TTD solutions and SERS signal intensity.
The feasibility of the ReS2/AuNPs SERS sensor for food safety applications was further investigated using TTD, a common organic pesticide. TTD is frequently used as a protective agent against normal crop growth; however, excessive residues in crops cause neurological damage in humans. The TTD molecules were immersed within the ReS2/AuNPs substrate for 1 h, dried naturally, and subjected to SERS detection. Figure 6c shows the SERS spectra of various concentrations of TTD (10−6–10−10 M), which exhibited two distinctive Raman characteristic peaks. The peak located at 1367 cm–1 is associated with C–N stretching and CH3 symmetric deformation vibration modes [50]. The intensity of the SERS signal decreased with decreasing concentrations of TTD, and the characteristic Raman peak at 1367 cm−1 was still observed at 10−10 M. For further quantitative analysis, Figure 6d shows the dependence of the SERS intensity at 1367 cm−1 on the TTD concentrations. The SERS intensity is linearly related to the negative logarithm of concentration with R2 of 0.97, and the fitted equation is I = 2081.86 + 197.45 Log C. The detection limit of 10−10 M is significantly lower than the residue limit of 3 ppm for fruits and vegetables set by the EU Environmental Protection Agency [51].
3. Materials and Methods
3.1. Materials
Thioacetamide (CH3CSNH2, 99.09%), CV, and R6G were bought from Aladdin Bio-Chem Technology Co., Ltd. (Shanghai, China). Ammonium perrhenate (NH4ReO4, 99.99%) was obtained from Weng Jiang Reagent Company (Shaoguan, China). HAuCl4·3H2O and TTD (97.5%) were purchased from Macklin (Shanghai, China). The carboxymethylcellulose sodium (CMC-Na, 99.5%), PS, and trypan blue TB were obtained from Dow Corporation (Midland, MI, USA), Shanghai Yuanye Bio-Technology Co., Ltd. (Shanghai, China), and Beyotime Biotechnology (Shanghai, China), respectively. Aqueous solutions of 15 nm gold nanoparticles were purchased from Hangzhou Xinqiao Biotechnology Co., Ltd. (Hangzhou, China).
3.2. Synthesis of Three-Dimensional ReS2 Nanoflowers
ReS2 nanoflowers were prepared using a hydrothermal synthesis method [43]. Briefly, 134.12 mg of NH4ReO4 powder was mixed with 35 mL of deionized water (18.2 MΩ) and stirred continuously at room temperature. For 10 min, 150.26 mg of CH3CSNH2 was added to the above solution. After continuous stirring for 15 min, the mixed solution was poured into a polytetrafluoroethylene liner contained in a stainless steel autoclave and the reaction was continued for 16 h at 180 °C. With the temperature of the reaction chamber dropped to 25 °C, the reactants were washed by centrifugation with anhydrous ethanol and deionized water at 11,000 rpm 4 times. The collected sediment was dried in a thermostatic drying oven at 60 °C for 24 h to obtain ReS2 nanoflowers in powder form. Subsequently, 2.5 mg of the ReS2 nanoflowers powder was dispersed in 100 mL of deionized water, resulting in a ReS2 nanoflowers solution with a concentration of 0.025 mg/mL.
3.3. Synthesis of the ReS2/AuNPs Complexes
First, 500 μL of 50 mM CMC-Na was added into 5 mL of 0.025 mg/mL ReS2 nanoflowers solution and continuously stirred at room temperature for 5 min. Subsequently, 40, 140, and 260 μL (0.08, 0.28, 0.52 mM) of HAuCl4 were placed into the solution and continuously stirred for 10 min at 80 °C. When the solution undergoes a color change (light red, deep purple, or dark blue), it indicates the successful reduction of AuNPs. Then, the excess CMC-Na was removed by centrifugal washing with deionized water at 13,000 rpm three times. Finally, the ReS2/AuNPs complexes were dried at 60 °C for 12 h.
3.4. Materials Characterization
The scanning electron microscope (SEM), energy spectrum (EDS), and TEM images of ReS2/AuNPs were examined using scanning electron microscopy (SEM, Supra 55 Sapphire, Oberkochen, Germany) operated at 15 kV, and transmission electron microscopy (TEM, HITECH HT7700, Tokyo, Japan) operated at 40 kV. The elemental composition and crystal phase of ReS2/AuNPs were obtained from X-ray photoelectron spectroscopy (XPS, Thermo Scientific NEXSA, Waltham, MA, USA) and high-resolution X-ray diffractometer (XRD, X′pertpro, Amsterdam, The Netherlands). The absorption spectra of ReS2/AuNPs were measured with a UV-1780 spectrometer.
3.5. SERS Experiments
First, 100 μL of solutions with different concentrations of R6G, CV, TB, and PS were mixed with 0.25 mg of ReS2/AuNPs powder. After sufficient adsorption for 1 h, ReS2/AuNPs powder was cleaned twice with deionized water for the removal of unabsorbed dye molecules. Subsequently, the solutions were placed on a slide and allowed to dry. A Renishaw inVia confocal Raman spectrometer was employed for SERS detection. Finally, the conditions for Raman testing were as follows: operating wavelength 514 nm; laser power 10%; 50× objective lens; integration time 20 s; an acquisition range of 500–2000 cm−1. Furthermore, taking TTD as an example, the practical application performance of ReS2/AuNPs in SERS was evaluated. The ReS2/AuNPs substrate was immersed in TTD solutions with varying concentrations for one hour at room temperature, followed by cleaning and air drying before testing. The electric field distribution of ReS2/AuNPs was simulated by the finite-element method.
4. Conclusions
In conclusion, a three-dimensional flower-like ReS2 nanostructure with an abundance of active sites was successfully synthesized on a large scale using a hydrothermal method. Assisted and controlled by the ReS2 nanoflowers, AuNPs were uniformly, densely, and zero-spaced anchored on the surface of the ReS2 nanoflowers; therefore, a ReS2/AuNPs SERS platform with a considerable number of “hot spots” was formed. The results show that the SERS enhancement of the ReS2/AuNPs substrate originated from the synergistic enhancement of EM and CM, which indicated excellent sensitivity, good reproducibility, and excellent storage stability for the representative organic dyes R6G and CV. In practical applications, the ReS2/AuNPs substrate can linearly detect organic pesticide molecules, (such as TTD) at concentrations as low as 10−10 M, exhibiting promising applications in food safety and environmental detection.
Supplementary Materials
The following supporting information can be downloaded at: https://www.mdpi.com/article/10.3390/molecules28114288/s1, Figure S1: (a–b) TEM and (c) SEM images of ReS2 nanoflowers. (d) SEM images and (e–f) EDS images of ReS2/AuNPs complexes; Figure S2: XPS spectra for ReS2 nanoflowers—(a) Re 4f, (b) S 2p; Figure S3: TEM images, average particle size, and absorption spectra of ReS2/AuNPs complexes with different concentrations of HAuCl4; Figure S4: (a–b) Histogram of the intensity of the R6G characteristic peak corresponding to Figure 4a.
Author Contributions
Y.L.: Sample preparation and data processing analysis. H.L.: Material preparation and electromagnetic simulation. S.W. provided the Raman instrument. X.W.: Validation. L.L.: Software, Formal analysis. Y.W.: Investigation. J.Q.: Supervision funding acquisition. S.Y. Supervision. X.Y.: Validation, Supervision. J.S. involved in the review and supervision. Y.C. participated in the literature research and writing. All authors have read and agreed to the published version of the manuscript.
Funding
This work has been partially supported by the National Key R&D Program of China (2021YFF0502900); the National Natural Science Foundation of China (62275166/62175161/61835009/62127819/62022059); China’s Postdoctoral Science Foundation (2022M712164); the Guangdong Basic and Applied Research Foundation (2023A1515011499/2023A1515011114); the Shenzhen Science and Technology Program (JCYJ20190808160207366/JCYJ20210324095810028/JCYJ20210324095613036/JCYJ20190808151215399); and the Shenzhen Key Laboratory of Photonics and Biophotonics (ZDSYS20210623092006020).
Institutional Review Board Statement
Not applicable.
Informed Consent Statement
Not applicable.
Data Availability Statement
Not applicable.
Conflicts of Interest
The authors declare no conflict of interest.
Sample Availability
Samples of the ReS2 nanoflowers and ReS2/AuNPs complexes are available from the authors.
References
- Fan, M.; Andrade, G.F.S.; Brolo, A.G. A review on recent advances in the applications of surface-enhanced Raman scattering in analytical chemistry. Anal. Chim. Acta 2020, 1097, 1–29. [Google Scholar] [CrossRef]
- Xu, K.; Zhou, R.; Takei, K.; Hong, M. Toward flexible surface-enhanced Raman scattering (SERS) sensors for point-of-care diagnostics. Adv. Sci. 2019, 6, 1900925. [Google Scholar] [CrossRef] [PubMed]
- Jiang, L.; Hassan, M.M.; Ali, S.; Li, H.; Sheng, R.; Chen, Q. Evolving trends in SERS-based techniques for food quality and safety: A review. Trends Food Sci. Technol. 2021, 112, 225–240. [Google Scholar] [CrossRef]
- Liu, H.; Gao, X.; Xu, C.; Liu, D. SERS tags for biomedical detection and bioimaging. Theranostics 2022, 12, 1870. [Google Scholar] [CrossRef] [PubMed]
- Wang, B.X.; Duan, G.; Xu, W.; Xu, C.; Jiang, J.; Yang, Z.; Pi, F. Flexible surface-enhanced Raman scatting substrates: Recent advances in their principles, design strategies, diversified material selections and applications. Crit. Rev. Food Sci. Nutri. 2022. [Google Scholar] [CrossRef]
- Fleischmann, M.; Hendra, P.J.; McQuillan, A.J. Raman spectra of pyridine adsorbed at a silver electrode. Chem. Phys. Lett. 1974, 26, 163–166. [Google Scholar] [CrossRef]
- Wang, K.; Sun, D.-W.; Pu, H.; Wei, Q. Surface-enhanced Raman scattering of core-shell Au@Ag nanoparticles aggregates for rapid detection of difenoconazole in grapes. Talanta 2019, 191, 449–456. [Google Scholar] [CrossRef]
- Almehmadi, L.M.; Curley, S.M.; Tokranova, N.A.; Tenenbaum, S.A.; Lednev, I.K. Surface enhanced Raman spectroscopy for single molecule protein detection. Sci. Rep. 2019, 9, 12356. [Google Scholar] [CrossRef]
- Zhang, J.; Yang, Y.; Jiang, X.; Dong, C.; Song, C.; Han, C.; Wang, L. Ultrasensitive SERS detection of nucleic acids via simultaneous amplification of target-triggered enzyme-free recycling and multiple-reporter. Biosens. Bioelectron. 2019, 141, 111402. [Google Scholar] [CrossRef]
- Xu, Z.; Chen, J.; Hu, L.; Tan, Y.; Liu, S.; Yin, J. Recent advances in formaldehyde-responsive fluorescent probes. Chin. Chem. Lett. 2017, 28, 1935–1942. [Google Scholar] [CrossRef]
- Yeh, T.; Lin, T.; Chen, C.; Wen, H. Analysis of free and bound formaldehyde in squid and squid products by gas chromatography–mass spectrometry. J. Food Drug Anal. 2013, 21, 190–197. [Google Scholar] [CrossRef]
- Zhang, K.; Liu, C.; Li, S.; Fan, J. A hydrophobic deep eutectic solvent based vortex-assisted liquid-liquid microextraction for the determination of formaldehyde from biological and indoor air samples by high performance liquid chromatography. J. Chromatogr. A 2019, 1589, 39–46. [Google Scholar] [CrossRef] [PubMed]
- Wang, Y.; Yan, B.; Chen, L. SERS tags: Novel optical nanoprobes for bioanalysis. Chem. Rev. 2013, 113, 1391–1428. [Google Scholar] [CrossRef] [PubMed]
- Yao, L.; Hao, Q.; Li, M.; Fan, X.; Li, G.; Tang, X.; Qiu, T. Flexible plasmonic nanocavity: A universal platform for the identification of molecular orientations. Nanoscale 2023, 15, 6588–6595. [Google Scholar] [CrossRef]
- Fu, Q.; Zhan, Z.; Dou, J.; Zheng, X.; Xu, R.; Wu, M. Highly reproducible and sensitive SERS substrates with Ag inter-nanoparticle gaps of 5 nm fabricated by ultrathin aluminum mask technique. ACS Appl. Mater. Interfaces 2015, 7, 13322–13328. [Google Scholar] [CrossRef]
- Jin, J.; Guo, Z.; Fan, D.; Zhao, B. Spotting the driving forces for SERS of two-dimensional nanomaterials. Mater. Horiz. 2023, 10, 1087–1104. [Google Scholar] [CrossRef]
- Yin, Z.; Xu, K.; Jiang, S.; Luo, D.; Chen, R.; Xu, C.; Liu, Y. Recent progress on two-dimensional layered materials for surface-enhanced Raman spectroscopy and their applications. Mater. Today Phys. 2021, 18, 100378. [Google Scholar] [CrossRef]
- Wang, X.; Zhang, E.; Shi, H.; Tao, Y.; Ren, X. Semiconductor-based surface-enhanced Raman scattering (SERS): From active materials to performance improvement. Analyst 2022, 147, 1257–1272. [Google Scholar] [CrossRef]
- Muehlethaler, C.; Considine, C.R.; Menon, V.; Lin, W.-C.; Lee, Y.-H.; Lombardi, J.R. Ultrahigh Raman enhancement on monolayer MoS2. ACS Photonics 2016, 3, 1164–1169. [Google Scholar] [CrossRef]
- Yang, B.; Jin, S.; Guo, S.; Park, Y.; Chen, L.; Zhao, B.; Jung, Y.M. Recent development of SERS technology: Semiconductor-based study. Acs Omega 2019, 4, 20101–20108. [Google Scholar] [CrossRef]
- Yu, L.; Lv, R. Two–dimensional layer materials for highly efficient molecular sensing based on surface–enhanced Raman scattering. New Carbon Mater. 2021, 36, 995–1012. [Google Scholar] [CrossRef]
- Lv, Q.; Wu, X.; Tan, J.; Liu, B.; Gan, L.; Li, J.; Lv, R. Ultrasensitive molecular sensing of few-layer niobium diselenide. J. Mater. Chem. A 2021, 9, 2725–2733. [Google Scholar] [CrossRef]
- Singh, J.; Kumar, S.; Soni, R.K. Synthesis of 3D-MoS2 nanoflowers with tunable surface area for the application in photocatalysis and SERS based sensing. J. Alloys Compd. 2020, 849, 156502. [Google Scholar] [CrossRef]
- Singha, S.S.; Mondal, S.; Bhattacharya, T.S.; Das, L.; Sen, K.; Satpati, B.; Singha, A. Au nanoparticles functionalized 3D-MoS2 nanoflower: An efficient SERS matrix for biomolecule sensing. Biosens.Bioelectron. 2018, 119, 10–17. [Google Scholar] [CrossRef] [PubMed]
- Lv, K.; Si, H.; Liu, J.; Zhu, T.; Xia, Y.; Chen, S.; Yang, C. Plasmonic filters based on MoS2@Au/Ag hybrids: Controllable separation, preconcentration, and sensitive SERS detection. J. Alloys Compd. 2020, 846, 156438. [Google Scholar] [CrossRef]
- Yu, X.; Sun, Y.; Hu, J.; Wang, J.; Zhuang, X.; Zhang, S.; Hu, Y. MoS2/Au/Ag Nanostructures for ratiometric surface–enhanced Raman scattering determination of pesticide residues. ACS Appl. Nano Mater. 2023, 6, 685–694. [Google Scholar] [CrossRef]
- Liu, Y.; Gao, Z.; Chen, M.; Tan, Y.; Chen, F. Enhanced Raman scattering of CuPc films on imperfect WSe2 monolayer correlated to exciton and charge-transfer resonances. Adv. Funct. Mater. 2018, 28, 1805710. [Google Scholar] [CrossRef]
- Gong, C.; Zhang, Y.; Chen, W.; Chu, J.; Lei, T.; Pu, J.; Xiong, J. Electronic and optoelectronic applications based on 2D novel anisotropic transition metal dichalcogenides. Adv. Sci. 2017, 4, 1700231. [Google Scholar] [CrossRef]
- Lv, Q.; Qin, X.; Lv, R. Controllable growth of few-layer niobium disulfide by atmospheric pressure chemical vapor deposition for molecular sensing. Front. Mater. 2019, 6, 279. [Google Scholar] [CrossRef]
- Rahman, M.; Davey, K.; Qiao, S.Z. Advent of 2D rhenium disulfide (ReS2): Fundamentals to applications. Adv. Funct. Mater. 2017, 27, 1606129. [Google Scholar] [CrossRef]
- Zhang, Q.; Fu, L. Novel insights and perspectives into weakly coupled ReS2 toward emerging applications. Chem 2019, 5, 505–525. [Google Scholar] [CrossRef]
- Miao, P.; Qin, J.K.; Shen, Y.; Su, H.; Dai, J.; Song, B.; Xu, P. Unraveling the Raman enhancement mechanism on 1T′–phase ReS2 nanosheets. Small 2018, 14, 1704079. [Google Scholar] [CrossRef] [PubMed]
- Lin, J.; Liang, L.; Ling, X.; Zhang, S.; Mao, N.; Zhang, N.; Zhang, J. Enhanced Raman scattering on in–plane anisotropic layered materials. J. Am. Chem. Soc. 2015, 137, 15511–15517. [Google Scholar] [CrossRef] [PubMed]
- Li, M.; Wei, Y.; Fan, X.; Li, G.; Hao, Q.; Qiu, T. Mixed-dimensional van der Waals heterojunction-enhanced Raman scattering. Nano Res. 2022, 15, 637–643. [Google Scholar] [CrossRef]
- Wang, L.; Yu, D.; Huang, B.; Ou, Z.; Tao, L.; Tao, L.; Zhao, Y. Large-area ReS2 monolayer films on flexible substrates for SERS based molecular sensing with strong fluorescence quenching. Appl. Surf. Sci. 2021, 542, 148757. [Google Scholar] [CrossRef]
- Liu, R.; Jiang, L.; Yu, Z.; Jing, X.; Liang, X.; Wang, D.; Jin, S. MXene (Ti3C2Tx)-Ag nanocomplex as efficient and quantitative SERS biosensor platform by in-situ PDDA electrostatic self-assembly synthesis strategy. Sens. Actuators B Chem. 2021, 333, 129581. [Google Scholar] [CrossRef]
- Liu, L.; Shangguan, C.; Guo, J.; Ma, K.; Jiao, S.; Yao, Y.; Wang, J. Ultrasensitive SERS detection of cancer-related miRNA-182 by MXene/MoS2@AuNPs with controllable morphology and optimized self-internal standards. Adv. Opt. Mater. 2020, 8, 2001214. [Google Scholar] [CrossRef]
- Wang, H.; Liu, Y.; Rao, G.; Wang, Y.; Du, X.; Hu, A.; Xiong, J. Coupling enhancement mechanisms, materials, and strategies for surface-enhanced Raman scattering devices. Analyst 2021, 146, 5008–5032. [Google Scholar] [CrossRef]
- Lin, S.; Mandavkar, R.; Burse, S.; Habib, M.A.; Khalid, T.; Joni, M.H.; Lee, J. MoS2 nanoplatelets on hybrid core-shell (HyCoS) AuPd NPs for hybrid SERS platform for detection of R6G. Nanomaterials 2023, 13, 769. [Google Scholar] [CrossRef]
- Liu, X.; Dang, A.; Li, T.; Sun, Y.; Lee, T.C.; Deng, W.; Li, H. Plasmonic coupling of Au nanoclusters on a flexible MXene/Graphene oxide fiber for ultrasensitive SERS sensing. ACS Sens. 2023, 8, 1287–1298. [Google Scholar] [CrossRef]
- Shao, M.; Zhang, C.; Yu, J.; Jiang, S.; Zhao, X.; Li, Z.; Li, Z. Noble metal modified ReS2 nanocavity for surface-enhanced Raman spectroscopy (SERS) analysis. Opt. Express 2021, 29, 28664–28679. [Google Scholar] [CrossRef] [PubMed]
- Liu, J.; Chen, K.; Pan, G.M.; Luo, Z.J.; Xie, Y.; Li, Y.Y.; Wang, Q.Q. Largely enhanced photocatalytic hydrogen production rate of CdS/(Au-ReS2) nanospheres by the dielectric–plasmon hybrid antenna effect. Nanoscale 2018, 10, 19586–19594. [Google Scholar] [CrossRef] [PubMed]
- Xu, J.; Fang, C.; Zhu, Z.; Wang, J.; Yu, B.; Zhang, J. Nanoscale engineering and Mo-doping of 2D ultrathin ReS2 nanosheets for remarkable electrocatalytic hydrogen generation. Nanoscale 2020, 12, 17045–17052. [Google Scholar] [CrossRef]
- Mubeen, B.; Rasool, M.G.; Ullah, I.; Rasool, R.; Imam, S.S.; Alshehri, S.; Kazmi, I. Phytochemicals mediated synthesis of AuNPs from citrullus colocynthis and their characterization. Molecules 2022, 27, 1300. [Google Scholar] [CrossRef]
- Nam, N.N.; Bui, T.L.; Son, S.J.; Joo, S.W. Ultrasonication-induced self-Assembled fixed nanogap arrays of monomeric plasmonic nanoparticles inside nanopores. Adv. Funct. Mater. 2019, 29, 1809146. [Google Scholar] [CrossRef]
- Chen, H.Y.; Xin, P.L.; Xu, H.B.; Lv, J.; Qian, R.C.; Li, D. W Self-Assembled plasmonic nanojunctions mediated by host-guest interaction for ultrasensitive dual-mode detection of cholesterol. ACS Sens. 2023, 8, 388–396. [Google Scholar] [CrossRef]
- Li, M.; Gao, Y.; Fan, X.; Wei, Y.; Hao, Q.; Qiu, T. Origin of layer-dependent SERS tunability in 2D transition metal dichalcogenides. Nanoscale Horiz. 2021, 6, 186–191. [Google Scholar] [CrossRef] [PubMed]
- Chen, M.; Ji, B.; Dai, Z.; Du, X.; He, B.; Chen, G.; Pan, H. Vertically-aligned 1T/2H-MS2 (M=Mo, W) nanosheets for surface-enhanced Raman scattering with long-term stability and large-scale uniformity. Appl. Surf. Sci. 2020, 527, 146769. [Google Scholar] [CrossRef]
- Yang, B.; Wang, Y.; Guo, S.; Jin, S.; Park, E.; Chen, L.; Jung, Y.M. Charge transfer study for semiconductor and semiconductor/metal composites based on surface-enhanced Raman scattering. Bull Korean Chem Soc. 2021, 42, 1411–1418. [Google Scholar] [CrossRef]
- Dai, X.; Xue, D.; Liu, X.; Gu, C.; Jiang, T. An adhesive SERS substrates based on a stretched silver nanowire-tape for the in situ multicomponent analysis of pesticide residues. Anal. Methods 2023, 15, 1261–1273. [Google Scholar] [CrossRef]
- Wu, M.T.; Wu, C.F.; Wu, J.R.; Chen, B.H.; Chen, E.K.; Chao, M.C.; Ho, C.K. The public health threat of phthalate-tainted foodstuffs in Taiwan: The policies the government implemented and the lessons we learned. Environ. Int. 2012, 44, 75–79. [Google Scholar] [CrossRef] [PubMed]
Disclaimer/Publisher’s Note: The statements, opinions and data contained in all publications are solely those of the individual author(s) and contributor(s) and not of MDPI and/or the editor(s). MDPI and/or the editor(s) disclaim responsibility for any injury to people or property resulting from any ideas, methods, instructions or products referred to in the content. |
© 2023 by the authors. Licensee MDPI, Basel, Switzerland. This article is an open access article distributed under the terms and conditions of the Creative Commons Attribution (CC BY) license (https://creativecommons.org/licenses/by/4.0/).