Article

Optimizing Procedures of Ultrasound-Assisted Extraction of Waste Orange Peels by Response Surface Methodology

1
School of Regional Innovation and Social Design Engineering, Faculty of Engineering, Kitami Institute of Technology, 165 Koen-cho, Kitami 090-8507, Hokkaido, Japan
2
RIKEN Centre for Advanced Photonics, RIKEN, 519-1399 Aramaki-Aoba, Aoba-ku, Sendai 980-0845, Miyagi, Japan
Molecules 2022, 27(7), 2268; https://doi.org/10.3390/molecules27072268
Submission received: 27 February 2022 / Revised: 20 March 2022 / Accepted: 30 March 2022 / Published: 31 March 2022

Abstract

:
The simultaneous effects of three continuous factors: solvent concentration (50–100%), treated times (25–85 min), treated temperatures (25–55 °C), and two categorical factors: type of solvents (methanol or ethanol) and ultrasonic frequency (28 kHz or 40 kHz) on ultrasonic-assisted extraction yield from waste orange peels were evaluated and optimized by response surface methodology. Fourier Transform Infrared (FTIR) spectroscopy with a wavelength of 500 cm−1 to 4000 cm−1 was employed to rapidly identify the orange extracts. The significant polynomial regression models on crude extraction, sediments after evaporation, and precipitation yield were established (p < 0.05). Results revealed that solvent concentration affected crude extraction and precipitation yield linearly (p < 0.01). The optimal and practical ultrasound-assisted extraction conditions for increasing the precipitation yield were using 61.42% methanol with 85 min at 55 °C under 40 kHz ultrasonic frequency. The spectra of extracts showed a similar fingerprint of hesperidin.

1. Introduction

The peels from citrus fruit possess a large number of bioactive compounds, such as flavonoids and phenolic acids. As one of the most important groups of dietary phenolics, a variety of flavonoids cannot be synthesized biologically [1]. However, as the secondary metabolism compounds, they widely exist in the plant kingdom such as vegetables, fruits, grains, green leaves, and so on [2]. Besides antioxidant, antiviral, and antimicrobic properties, flavonoids have been discovered to potentially inhibit coronaviruses [3]. It was reported that flavonoids such as hesperidin and rutin had a better binding affinity to the main protease of COVID-19 than nelfinavir [3]. Wu et al. (2020) stated that hesperidin possessed the most suitable substance to bind to the “spike” of SARS-CoV-2 after testing 1066 natural substances with potential antiviral effects and 78 antiviral drugs [4]. Other authors stated that it was easy to bind hesperidin with SARS-CoV-2 due to lower energy being required [3,5]. In this way, hesperidin prevents the virus to bind with the host cell. Approximately 400 thousand tons of fruits juice is consumed in Japan per year and approximately 1000 tons of orange waste is produced in Shizuoka prefecture in Japan [6]. Currently, the prices for hesperidin, naringin, and neohesperidin are sold approximately as USD 192, USD 487, and USD 142,599 per 100 g in Japan, respectively. It is, thus, useful to extract flavonoids from waste orange peels, which can not only maximize the reuse and reduce environmental problems [7], but also exploit the value-added by-products and cut down industrial economical costs [8].
Like supercritical extraction [9], microwave-assisted extraction [10], and pressurized liquid extraction [11], ultrasound-assisted extraction (UAE) is also regarded as the eco-friendly green extraction technology [12]. It has been widely utilized to extract bioactive compounds from citrus waste due to its much shorter extraction time, lower energy consumption, and safe thermolabile constituents [13,14].
Response surface methodology (RSM), which estimates the effects of many factors and their interactions on response variables, has been comprehensively utilized to model and optimize food processes [15,16,17,18,19]. The extraction conditions of phenolic compounds from orange peels using RSM were investigated and the optimal ultrasound extraction time, temperature, and ethanol concentration were reported to be 44 min, 50 °C, and 57.7%, respectively [13]. The total phenolic content was reported to be 292.158 µg catechol/g and the total flavonoid content was 191.144 µg catechol/g under those optimal conditions [13]. The extraction of polysaccharides from Momordica charabtia L. was developed by enzymolysis-ultrasonic-assisted extraction and optimized using Box-Behnken design [19]. Pectin from sour orange peel was done by using UAE and the maximum extraction yield (28.07 ± 0.67%) can be achieved when the ultrasound power of 150 W with 10 min was employed under the pH of 1.5. RSM can interpret the relationship between the responses [20] and variables and greatly decreases the number of experiments in comparison with the full factorial experimental design [13,18].
Fourier Transform Infrared (FTIR) spectroscopy, like hyperspectral imaging [21,22,23,24], Raman spectroscopy [25], terahertz spectroscopy [6,26], and NIR images [27], plays an important role in detecting foodstuffs [28]. As variations in the permanent dipoles will lead to a specific vibrational mode occurring, two vibrations related to molecular bonds will stretch and bend [28]. The absorption in the IR range will occur at the feather frequencies, which can be used for identifying the presence of numerous chemical groups [28]. The interactions of hesperidin and naringin with dimyristoylphosphatidylcholine (DMPC) were studied using attenuated total reflection Fourier transform infrared (ATR-FTIR) spectroscopy, differential scanning calorimetry (DSC), atomic force microscopy (AFM), and field emission scanning electron microscopy (FE-SEM) [29]. Results reveal that hesperidin showed a weakly disordering effect in the hydrophobic region, while naringin possesses an ordering effect in this region [29].
All those studies indicate an unyielding interest in extracting bioactivities more efficiently. Although previous studies have studied the effects of different ultrasound-assisted extraction conditions (different ethanol concentrations, temperatures) on total phenolic content, total flavonoid content, and antioxidant activities by RSM [13], the simultaneous effects of two different types of solvents and ultrasonic frequency as two categorical factors, three continuous factors like solvent concentration, treated times, and treated temperatures on precipitation yield have not been exploited. This information could be used for improving the precipitation yield and maximizing the profit for the reuse of the waste orange peels.
The objective of this study is thus to evaluate the effects of different solvents, ultrasonic powers, temperatures, times, and solvent concentrations on precipitation yield from the waste orange peels. Following this, extracts will be detected by FTIR. The most optimal extraction processing will be established by using RSM.

2. Results and Discussion

2.1. Crude Extraction

Nowadays, the safe extraction of natural bioactive from industrial waste has drawn great attention, as those byproducts can be applied to functional foods and nutraceutical applications [8,30,31]. The regression model developed for crude extraction was statistically significant with an R2 value of 80.49% (p < 0.05). The lack of fit for this regression model was not significant (p > 0.05), and thus, it was highly adequate (Table 1). An R2 value between 66% and 81% is regarded as an acceptable level, while an R2 value over 91% is believed to be an excellent prediction for quantitative prediction [32,33]. According to the current experimental design, the predicted polynomial regression equations for crude extraction (Y1) as a function of solvent concentration (X1), treated times (X2), and treated temperatures (X3) for ethanol with the ultrasonic frequency of 28 kHz in the uncoded units are as follows:
Y1 = 63.6 − 0.789X1 + 0.394 X2 + 0.304X3 + 0.00074 X1 X2 + 0.00568 X1 X3 − 0.00778 X2 X3
The equations for methanol with an ultrasonic frequency of 28 kHz in the uncoded units are as follows:
Y1 = 82.7 − 0.925X1 + 0.469 X2 + 0.089X3 + 0.00074 X1 X2 + 0.00568 X1 X3 − 0.00778 X2 X3
The equations for ethanol with an ultrasonic frequency of 40 kHz in the uncoded units are as follows:
Y1 = 109.6 − 0.972X1 + 0.085 X2 + 0.061X3 + 0.00074 X1 X2 + 0.00568 X1 X3 − 0.00778 X2 X3
The equations for methanol with an ultrasonic frequency of 40 kHz in the uncoded units are as follows:
Y1 = 127.0 − 1.108X1 + 0.159 X2 − 0.154X3 + 0.00074 X1 X2 + 0.00568 X1 X3 − 0.00778 X2 X3
Solvent concentration affected the crude extraction linearly (p < 0.01) (Table 1). Based on the corresponding coefficient, it can be observed that the effects of solvent concentration were augmented with an increase of the ultrasonic frequency. The effects of solvent concentration on methanol were greater than that on ethanol. It was reported that the highest extraction yield from the sweet orange peel was obtained using methanol extract (15.56 ± 0.60 g/100 g) [31]. Methanol was concluded as more efficient in extracting phytochemicals from citrus peels than other organic solvents, such as hexane, petroleum ether, and acetone [31]. The polarity of the extraction solvents may attribute to this phenomenon. A higher extraction yield was occurred in methanolic extract, implying that a highly polar solvent facilitates the extraction efficiency [34]. The relative polarities of methanol and ethanol are 0.762 and 0.654, respectively. Truong et al. (2019) also observed a higher extraction yield achieved in methanolic extraction and attributes this observation to the higher solubility of phenolics, flavonoids, alkaloids, and terpenoids in methanol than the other solvents, such as ethanol [34]. The negative sign implies that an increase in solvent concentration will decrease the crude extraction. The hesperidin extraction yield from honeybush (Cyclopia maculata) tea by using different concentrations of ethanol from 0% to 100% (v/v) was studied by Du preez et al. (2016) [35]. The highest hesperidin content was achieved by using 58% ethanol [35]. Feng et al. (2020) also found that 0.060 ± 0.070 mg/40 g dried orange hesperidin and 0.015 ± 0.018 mg/40 g dried orange naringin could be obtained using 80% ethanol, while no flavonoids could be obtained using 100% ethanol [8]. Barrales et al. (2018) found that there was no considerable difference between the samples extracted by 75% and by 50% ethanol concerning the yield of hesperidin extraction [36]. Regarding the current study, the highest crude extraction (77.6 g per 10 g) was obtained when 50% ethanol along with 40 kHz of ultrasonic frequency at 25 °C were applied for 55 min (Table 2). The increased extraction yield in a lower concentration may be due to the enhancement of solubility of chemicals in the combination of water and organic solvent. Do et al. (2014) studied the effects of different concentrations (50%, 75%, and 100%) of methanol, ethanol, and acetone on extracting bioactive compounds of Limnophila aromatica and observed that the extraction yield increased with the increasing of water concentration in the solvent (i.e., lower concentration) [37]. It was concluded that the combined utilization of organic solvent and water was able to enhance the exactions of chemicals that are soluble in water and/or organic solvent [37]. The higher crude extraction weight obtained from the lower solvent concentration than the weight of initial orange peels is probably due to the weight of the water left in the extracts.
The interactive effect of solvent concentration and treated temperature (p < 0.05) was observed in Figure 1. Higher crude extraction can be achieved when a lower concentration with a higher temperature were applied (Figure 1a). According to the 2D contour plot (Figure 1b), the crude extraction can reach over 60 g if the solvent concentration was lower than 70%. A higher ethanol concentration was able to facilitate hesperidin extraction because of the higher solubility in the solvent. However, it may not occur when extracting a very polar solute [35]. If water mixes with ethanol or methanol, water can bind the cell wall, leading to swollen plant matrix. Nevertheless, ethanol can disrupt the bonding of solutes of plant matrices [38]. The addition of water to ethanol could increase the recovery of glycosylated flavonoids [36]. The ultrasound-assisted extraction of flavonoids from grapefruit (Citrus paradisi L.) solid wastes was optimized by RSM [39]. Results show that an increase in temperature improved the extraction of flavonoids, but a high ethanol concentration did not improve the extraction. It was explained that the presence of ethanol in the solvent has a positive effect on the polyphenol extraction when a maximum ethanol concentration is reached, from which the polyphenol extraction decreases. Ethanol affects the reduction of the dielectric constant of the solvent, leading to the increased solubility and diffusion of polyphenols [39]. However, a highly pure organic solvent may result in the dehydration and collapse of the vegetable cells and cause the denaturation of cell wall proteins, restraining the polyphenols diffusion to the extracting liquid [39]. Temperatures can improve mass transfer during extraction [39,40]. As a result, a lower concentration associated with a higher temperature in the current study can achieve a higher crude extraction.

2.2. Sediments after Evaporation and Left Overnight

The regression model developed for sediments after evaporation and left overnight (Y2) was significant (p < 0.05) with an R2 value of 77.01%. The polynomial regression models for ethanol with ultrasonic frequency of 28 kHz in the uncoded units are as follows:
Y2 = 30.8 − 0.490 X1 + 0.508 X2 + 0.859 X3 − 0.00034 X1X2 − 0.00440 X1X3 − 0.00842 X2X3
The polynomial regression models for methanol with ultrasonic frequency of 28 kHz in the uncoded units are as follows:
Y2 = 22.3 − 0.434 X1 + 0.489 X2 + 0.962 X3 − 0.00034 X1X2 − 0.00440 X1X3 − 0.00842 X2X3
The polynomial regression models for ethanol with ultrasonic frequency of 40 kHz in the uncoded units are as follows:
Y2 = 64.1 − 0.521 X1 + 0.232 X2 + 0.637 X3 − 0.00034 X1X2 − 0.00440 X1X3 − 0.00842 X2X3
The polynomial regression models for methanol with ultrasonic frequency of 40 kHz in the uncoded units are as follows:
Y2 = 51.2 − 0.464 X1 + 0.214 X2 + 0.740 X3 − 0.00034 X1X2 − 0.00440 X1X3 − 0.00842 X2X3
Again, the sediments after evaporation and left overnight were influenced by solvent concentration linearly (p < 0.01) (Table 1). A higher ultrasonic frequency (40 kHz) increases the effects of ethanol concentration (higher absolute coefficient value: 0.521) on sediment yield. Ultrasound waves, ranging from 20 kHz to 100 MHz, can damage and disrupt cell membranes during extraction. In this way, the cell contents will be released, and thus, increase the extraction yield [13]. On the other hand, the boiling point of ethanol (78.4 °C) is higher than that of methanol (64.7 °C); after the same vacuum evaporation for eliminating the organic solvents, there was more ethanol left in the extraction solution, leading to the comparably higher weight and sediments yield.

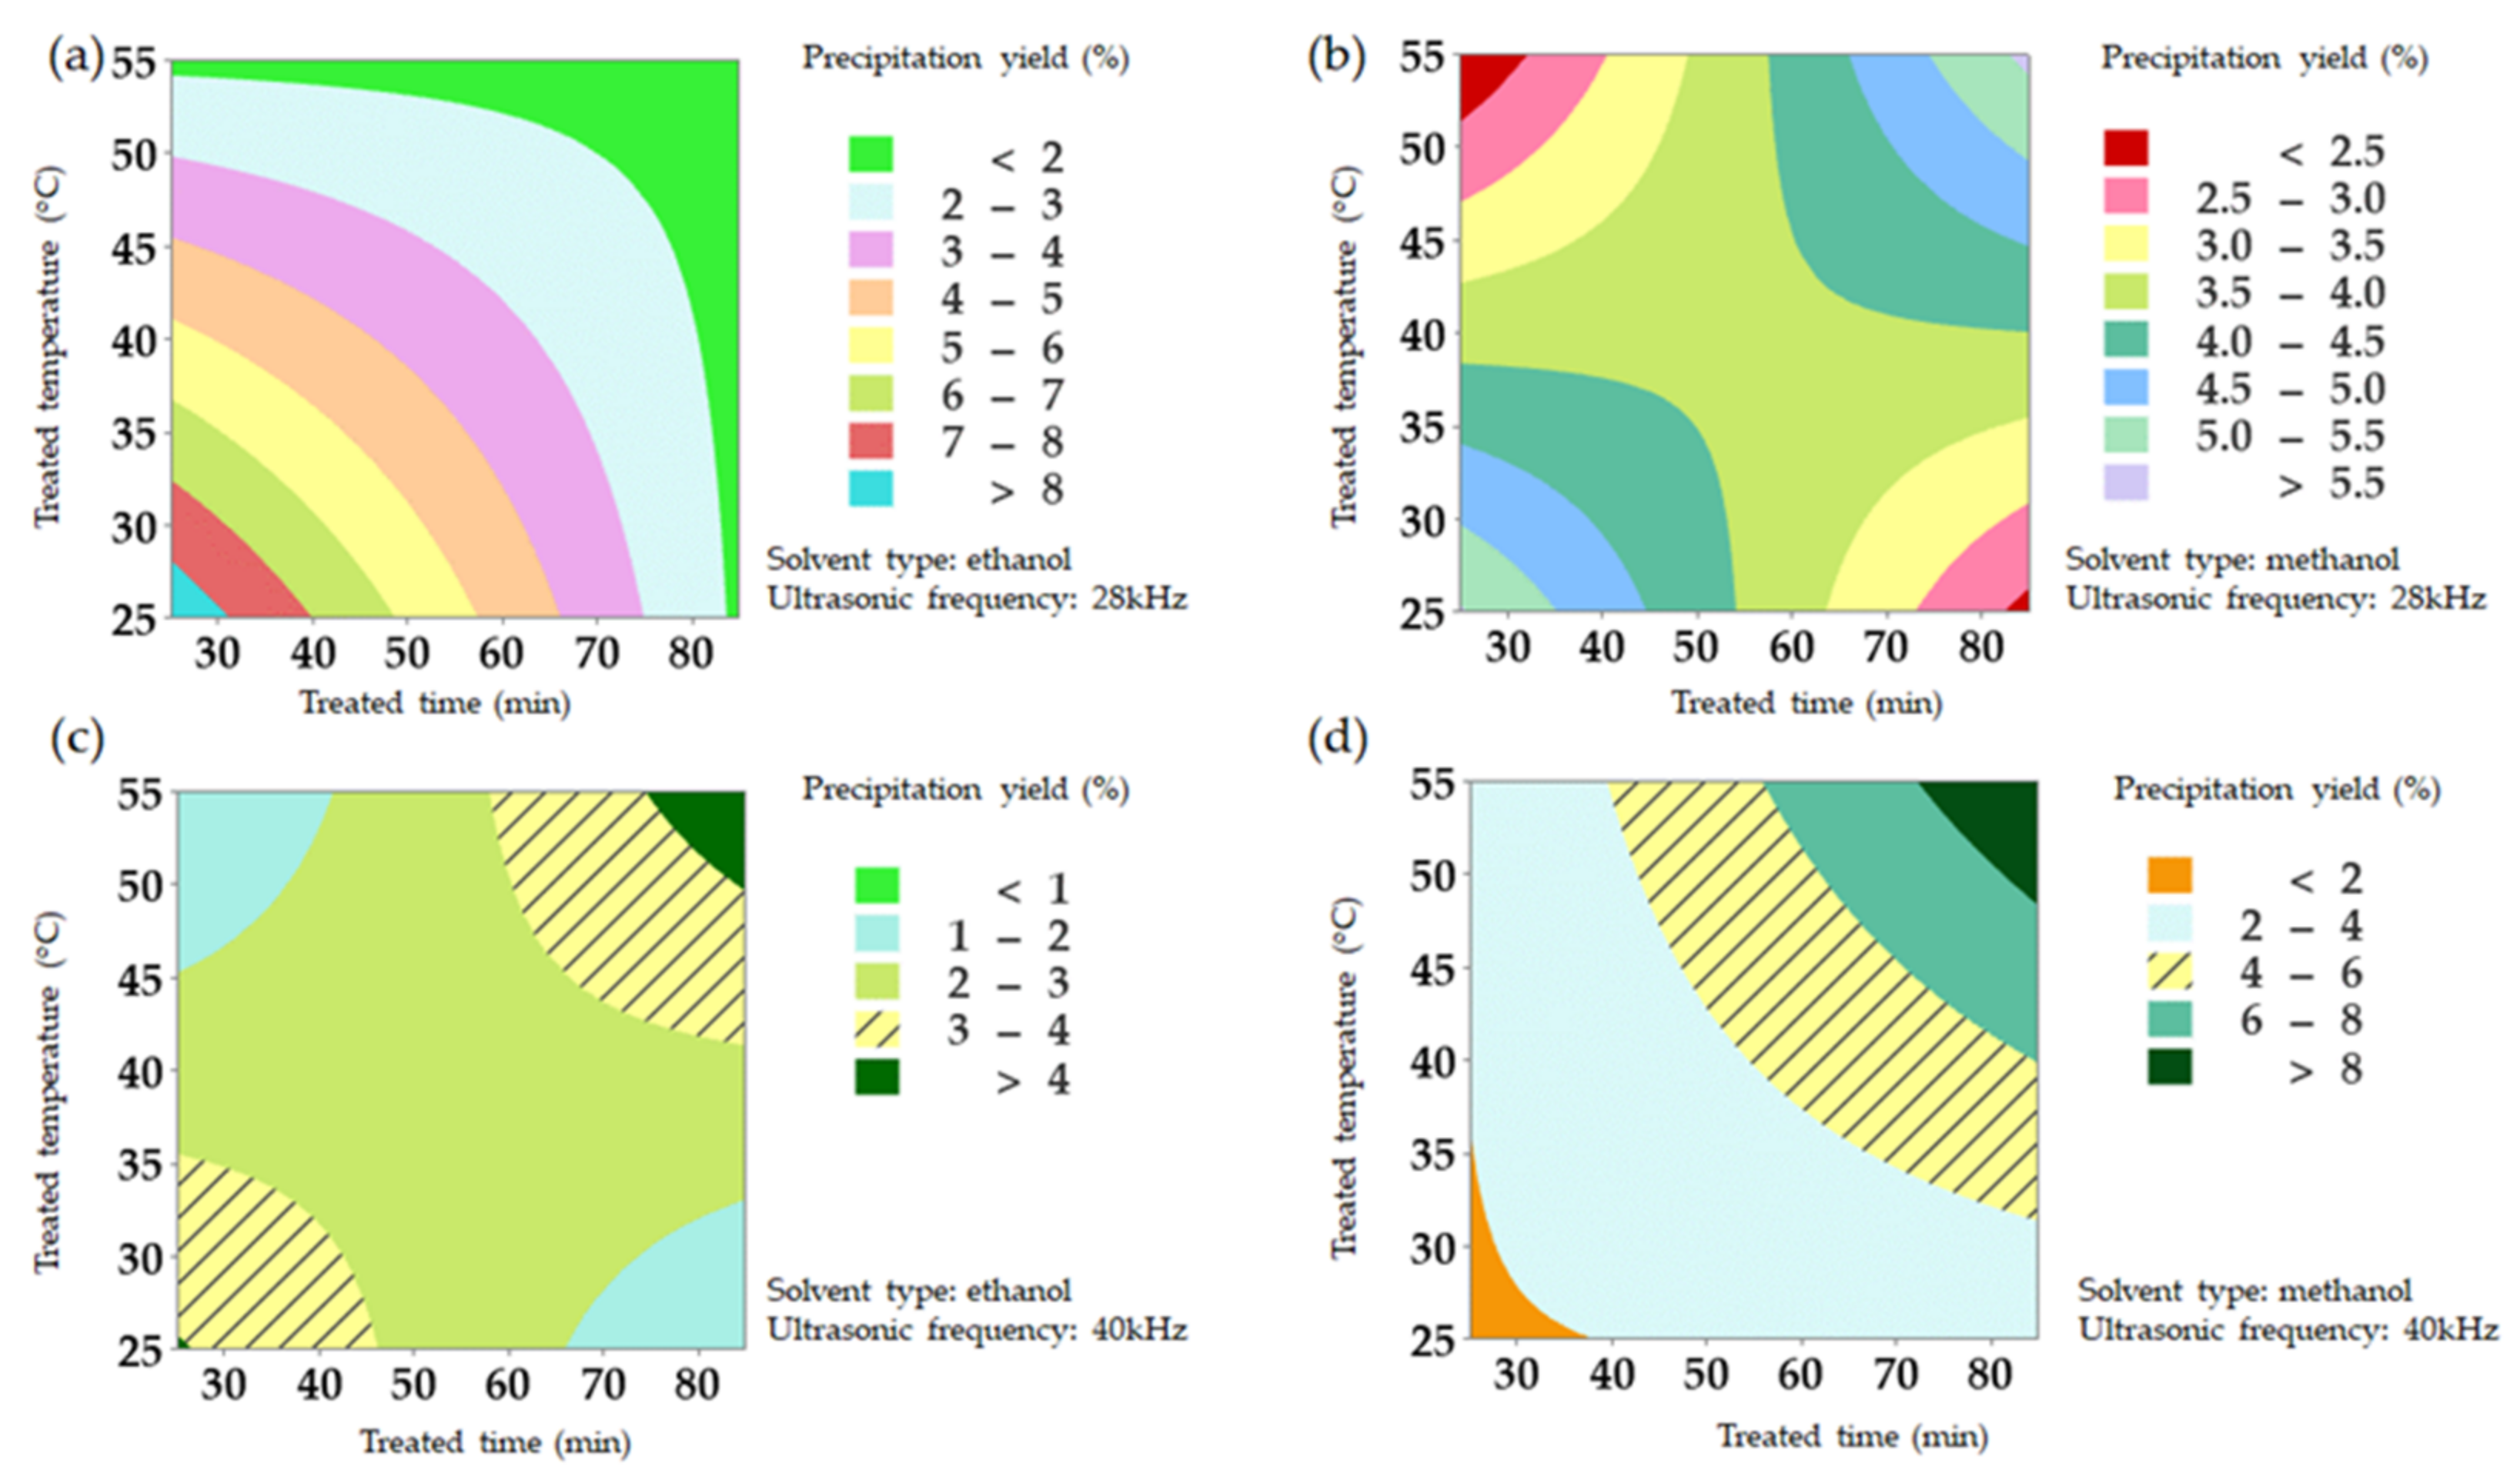
2.3. Precipitation Yield

According to a previous study, precipitation contains certain useful bioactive compounds, such as hesperidin, naringin, quinic acid, p-coumaric acid, and so on [8]. Consequently, the precipitation yield is essential from the industrial economical point of view. It is environmentally friendly and of practical use for optimizing the extraction of those bioactive compounds from waste orange peels. The regression model developed for Y3 was significant (p < 0.05), although the R2 was not high (R2 = 53.06%).
Figure 2 illustrates the interactive effects of treated time and temperature (p < 0.01). The two-way interaction showed significance at a 1% level and its contribution occupied nearly half (36.72%) of that for the whole model (52.95%) (Table 1). Take the threshold of 75% solvent concentration as an example, higher precipitation yield (>4%) achieved with a shorter treated time (<60 min) with a lower temperature (<45 °C) for samples extracted by ethanol at 28 kHz (Figure 2a).
A longer treated time (>60 min) combined with a higher treated temperature (>45 °C) or a shorter treated time (<50 min) with a lower treated temperature (<35 °C) rendered a higher precipitation yield (>4%) concerning methanol at 28 kHz (Figure 2b).
Concerning a higher ultrasonic frequency (40 kHz), a higher temperature (>45 °C) along with a longer treated time (>60 min) leads to a higher precipitation yield (>3%) for samples extracted by ethanol (Figure 2c) and methanol (Figure 2d).

2.4. Processing Optimization

To achieve a higher precipitation yield, two predictive modules were set up. Module 1: the goal of the precipitation yield was set as maximum (regardless of other response parameters) and the predicted precipitation yield would be 11.95%. The results of the optimization were using 100% methanol with 85 min at 55 °C under 40 kHz ultrasonic frequency. Module 2: Y3 was set as the most important parameter, followed by Y1 and Y2 (less importance), the precipitation yield was predicted to be 8.30%. Here, the optimized operational parameters of solvent concentration, treated times, treated temperature, type of solvents, and ultrasonic frequency were 61.42%, 85 min, 55 °C, methanol, and 40 kHz, respectively. To validate the optimized operational conditions provided by the modules, the two additional laboratory works were conducted in triplicates. The experimental precipitation yields for Modules 1 and 2 were 17.19 ± 1.03% and 6.29 ± 1.26%, respectively. Module 2 is recommended for economically and more practical industrial utilization of solvent concentration.

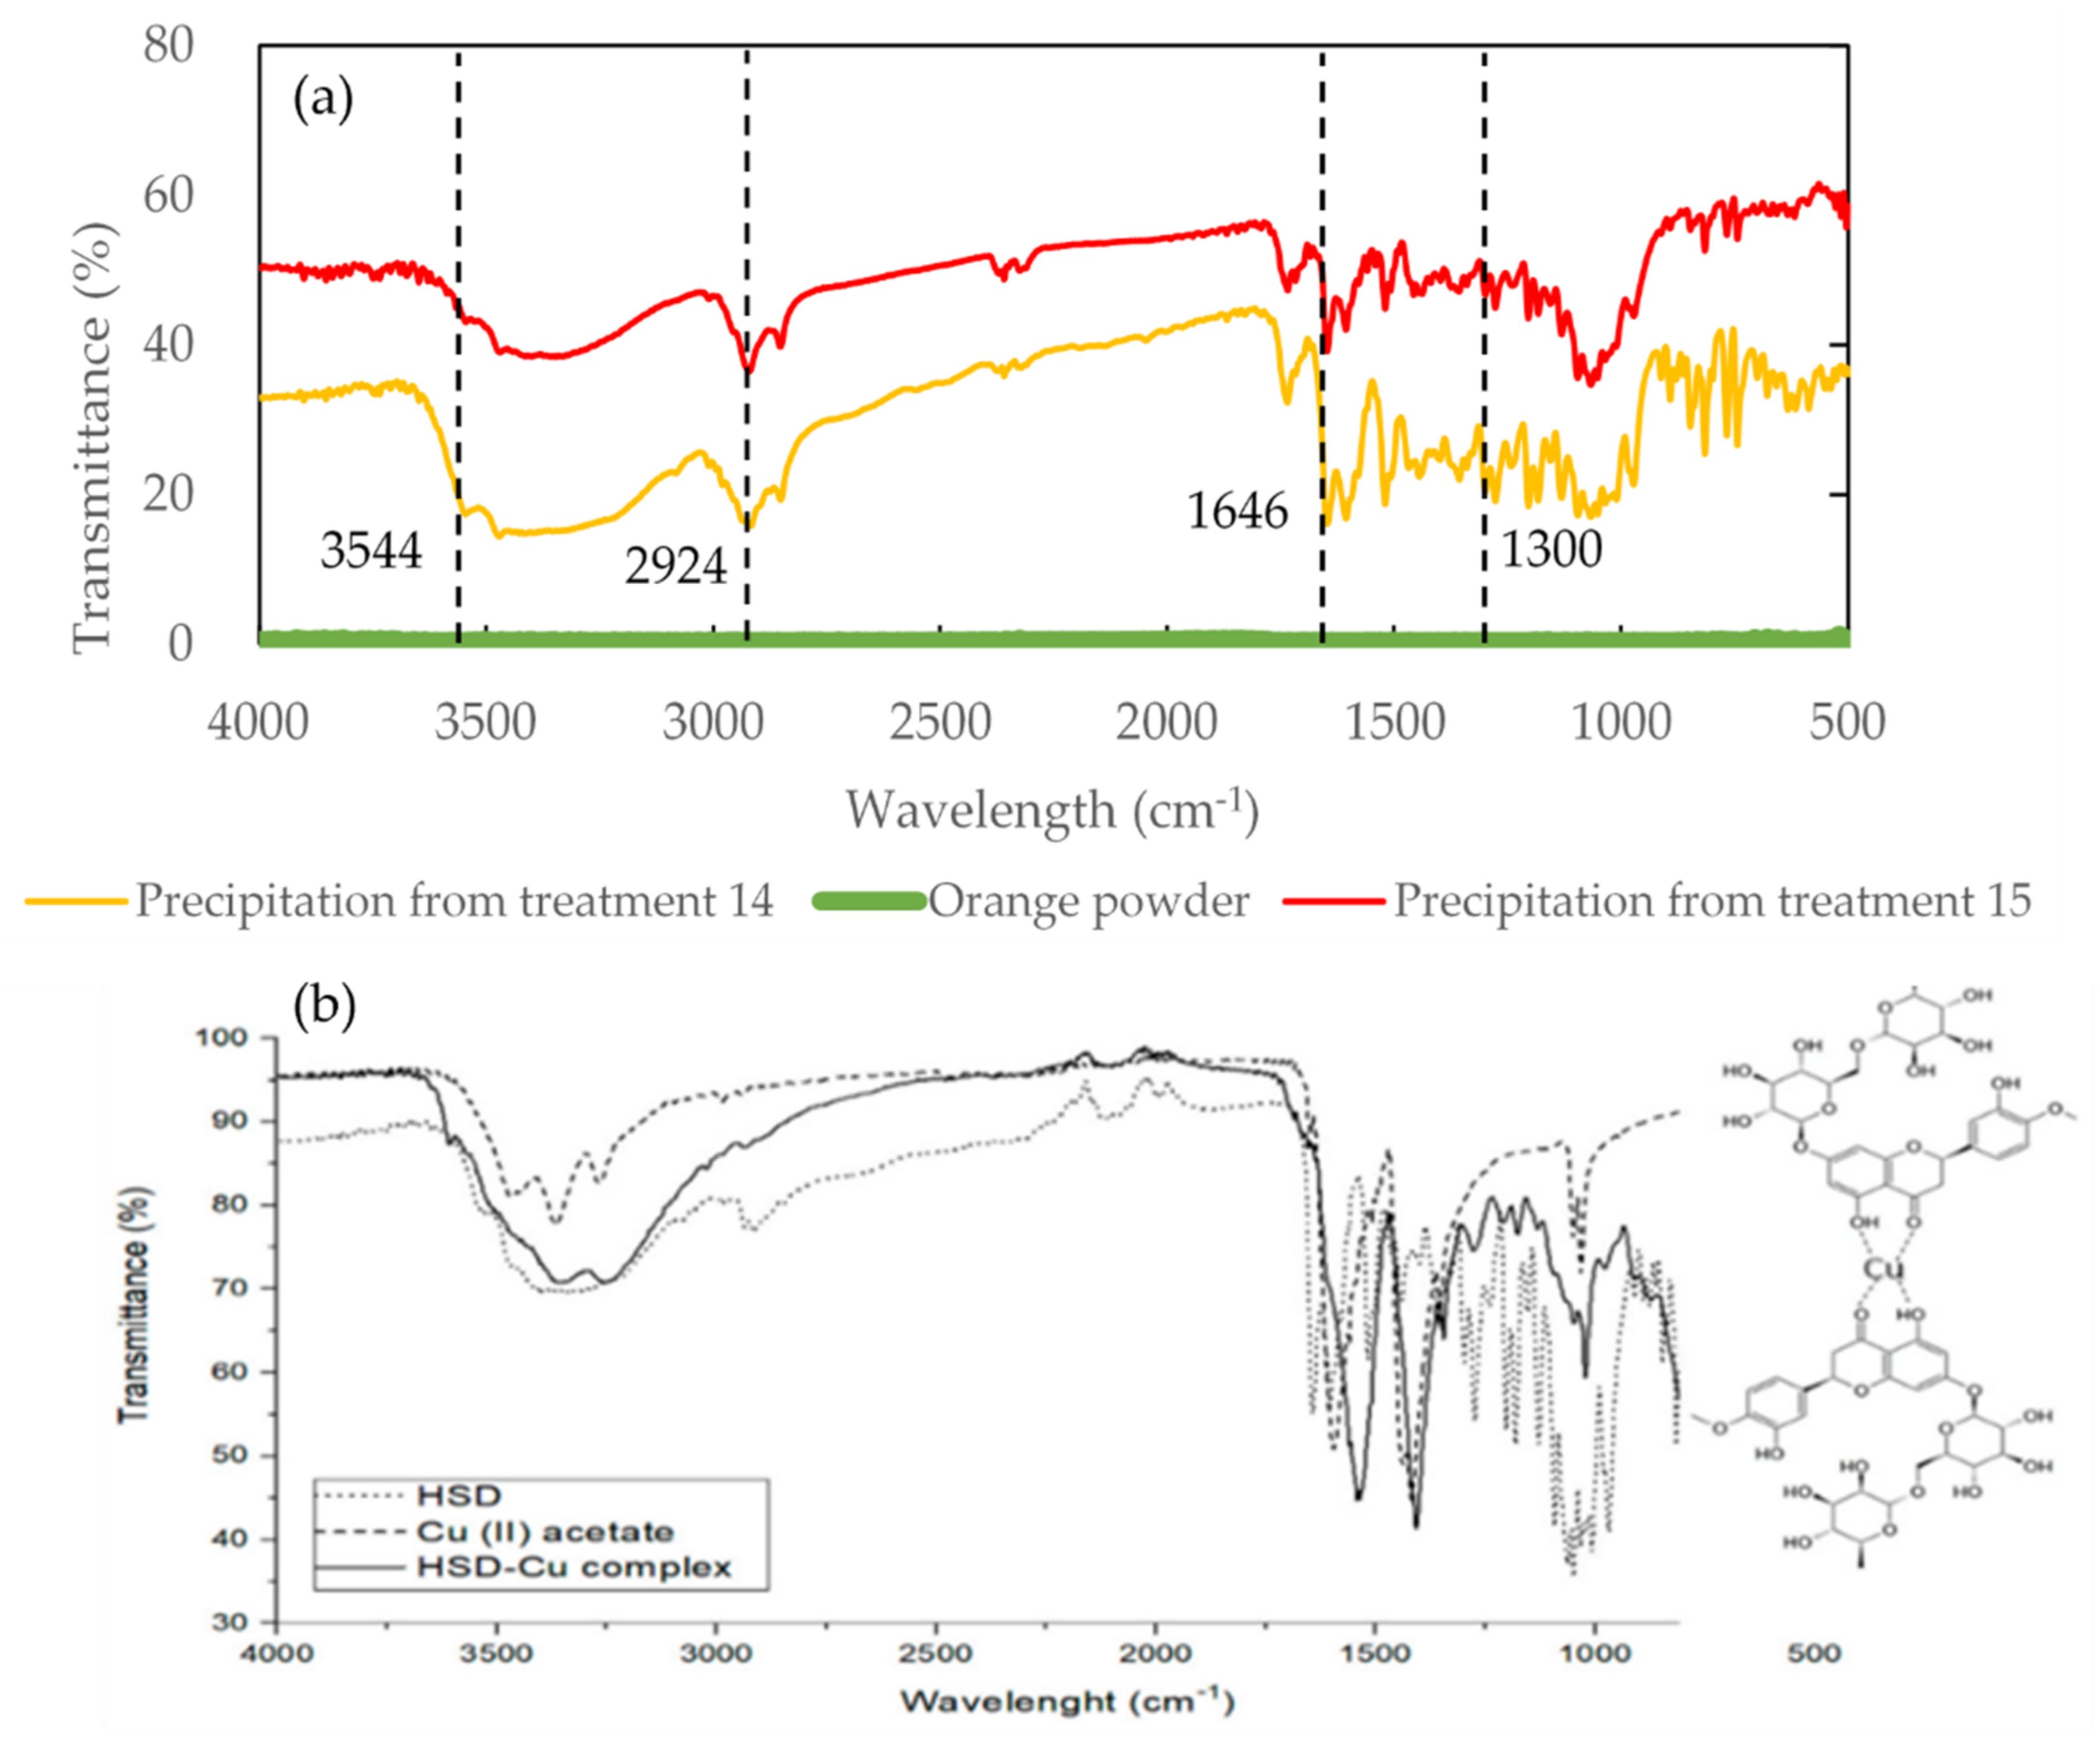
2.5. Spectral Characteristics Overview for the Sample with Different Treatments Measured by FTIR

Figure 3 illustrates transmittance spectra of an orange powder: precipitations from different treatments detected by using FTIR. There was no absorption peak for the sample before treatment (i.e., orange powder). No considerable differences between the sample with treatment 14 (sample extracted by 100% methanol with 55 min at 25 °C using 40 kHz) and 15 (sample extracted by 75% ethanol with 85 min at 25 °C using 28 kHz) were observed in accordance with their spectra in the infrared range. Further investigation displays that extract from orange peels (Figure 3a) possessed a similar fingerprint of hesperidin (Figure 3b) in the wavelength from 500 cm−1 to 4000 cm1 [41], indicating that it contains hesperidin.
It was stated that the vibration stretching for -C=O in hesperidin was at 1644 cm−1 and the absorption peaks for C-O were detected at 1297, 1275, 1242, 1206, 1184, 1154, 1132, 1095, 1054, 1037, and 1009 cm−1 [41]. The absorption peaks detected at 3544 and 2924 cm−1 (Figure 3) may be related to hydroxyl (-OH) [42] and aliphatic (CH) [43] stretching vibration for hesperidin. The IR spectra of hesperidin were also reported to present the characteristic patterns of flavonoids at 1649 cm−1 (C=O-valence), 3545 cm−1 (-OH-valence), 2938 cm−1 (CH-valence, arene), 2917 cm−1 (-CH valence, alkane), and 2850–2865 cm−1 (-CH valence), and characteristics patterns of methoxylic (alkane, OCH3) at 1277 cm−1 [44].
The spectra of hesperidin and naringin in the range of 2800–3000 cm−1 were studied via employing ATR-FTIR [29] and it is difficult to identify the differences in this range due to the similar molecule structure [8]. However, the fingerprint spectrum of hesperidin was able to clearly distinguished from that of naringin in the terahertz range [6]; thus, it is interesting to detect samples with different ultrasonic treatments by THz spectroscopy to verify whether there is any difference.
The treatment 14 sample showed a lower transmittance (i.e., higher absorbance) than the treatment 15 sample, indicating a higher concentration of hesperidin content in the precipitation due to the saturation effect.

3. Materials and Methods

3.1. Sample Preparation and Ultrasound-Assisted Extraction

The peels of sweet oranges (Citrus sinensis) were dried in an oven (40 °C) for 7 days. The dried orange peels were blade milled and an average of 10.05 ± 0.08 g orange powder, mixed with 200 mL of solvent, was put in a flask to an ultrasonic bath with the internal dimensions of 30.0 cm × 24.0 cm × 15.0 cm and a capacity of 10 L (MCD-10P, ASONE Corporation, Osaka, Japan). The sample was centrifuged at 4000 rpm for 15 min at 20 °C. The supernatant was collected and a rotary vacuum evaporator (EYELA NVC-2100, Rikakikai Co. Ltd., Tokyo, Japan) was used to eliminate the excess solvent at 45 °C at 61 hPa for 8 min (Y1). The extracts were left overnight to continuously render the solvent evaporate throughout (Y2).
The extracts from the UAE were diluted with distilled water at twice the weight of the extract. The sediments were vacuum filtered with filter paper and stored in the desiccator. The precipitation yield (Y3) was calculated as:
Y 3   =   W p W o   ×   100 %
where Wp and Wo were the weight of precipitate and orange powder, respectively. The extraction method was modified based on the methods of Wang et al. [45], Shehata et al. [13], and Feng et al. [8].

3.2. Experiment Design

The simultaneous effects of three continuous factors and two categorical factors on the yield of extraction were studied using RSM. The three continuous factors were solvent concentration (X1: 50–100%), treated times (X2: 25–85 min), and treated temperatures (X3: 25–55 °C), while the two categorical factors were types of solvents (X4: methanol (Lot. DLM3136, FUJIFILM Wako Pure Chemical Corporation, Osaka, Japan) or ethanol (Lot. DLM2697, FUJIFILM Wako Pure Chemical Corporation, Osaka, Japan)) and ultrasonic frequency (X5: 28 kHz or 40kHz). A Box-Behnken design (BBD) [45] was employed and performed in Minitab 21.1 software (Kozo Keikaku Engineering Inc., Tokyo, Japan). The uncoded values are displayed in Table 2 and a total of 60 experiments consisted of the whole design. The responses (Yn; n = 1–3) in this study were crude extraction after UAE (Y1), sediments after evaporation and left overnight (Y2), and the yield of the precipitation (Y3). The experimental data were fitted to a second-order polynomial model below:
Yn   = α 0   +   i = 1 3 α i x i   +   i = 1 2 j = i + 1 3 α ij x i x j
where α 0 was the constant of the model and α i and α i j were the linear and interaction coefficients, respectively. To minimize the effect of unexplained variability in the observed responses due to extraneous factors, all the experiments were carried out in a randomized order.
The three-dimensional contour curve of the response surface and all the coefficients of the polynomial model were calculated using Minitab 21.1. The significance of the regression parameters for a response was estimated by the F-test (p < 0.05). The determination coefficient (R2) and non-significant lack of fit were utilized to estimate the accuracy of fitted models.

3.3. Compounds Pellets Preparation and FTIR Analysis

Anhydrous potassium bromide (KBr, Jasco Corporation, Tokyo, Japan), as a background, was well ground and the orange powders and flavonoids extracts were mixed with KBr. The mixture was put into a transparent disc (as a pellet holder) and placed onto an evacuable die. The pellets were made by pressing the die for 10 s. The spectra were detected and recorded by using an FTIR spectroscopy (FT/IR-4700, Jasco, Tokyo, Japan) with a rapid scanning speed of 16 cm−1 and a resolution of 0.4 cm−1.

4. Conclusions

The current study successfully applied RSM to elaborate the simultaneous effects of three continuous factors and two categorical factors on ultrasound-assisted extraction yield. The optimal extraction conditions were established and could provide useful information for food and pharmaceutical applications. A deeper investigation shows that solvent concentration played an important role in crude extraction. Interactive effects of treated time and treated temperature influenced the precipitation yield and precipitation contained hesperidin. RSM can effectively optimize extraction conditions and the ultrasonic extracts are recommended to be identified in the terahertz range in future work.

Funding

This research was funded by the Japan Society for the Promotion of Science Grant-in-Aid for Early Career Scientists (20K15477), Leading Initiative for Excellent Young Researchers (LEADER) from the Government of Japan Ministry of Education, Culture, Sports, Science and Technology (MEXT) (2020L0277), FY 2021 President’s Discretionary Grants, funded by the Kitami Institute of Technology, and Special Postdoctoral Researcher Program funded at Riken.

Institutional Review Board Statement

Not applicable.

Informed Consent Statement

Not applicable.

Data Availability Statement

Data are contained within this article.

Acknowledgments

The author would also like to thank the anonymous reviewers for their constructive comments.

Conflicts of Interest

The author declares no conflict of interest.

Sample Availability

Samples of the compounds are not available from the authors.

References

  1. Sammani, M.S.; Cerdà, V. Sample pre-treatment and flavonoids analytical methodologies for the quality control of foods and pharmaceuticals matrices. In The Book of Flavonoids, 1st ed.; Feng, C.-H., García Martín, J.F., Eds.; Nova Science Publishers, Inc.: New York, NY, USA, 2021; Chapter 1; pp. 1–129. [Google Scholar]
  2. Terahara, N. Flavonoids in Foods: A review. Nat. Prod. Commun. 2015, 10, 521–528. [Google Scholar] [CrossRef] [PubMed] [Green Version]
  3. Bellavite, P.; Donzelli, A. Hesperidin and SARS-CoV-2: New light on the healthy function of citrus fruits. Antioxidants 2020, 9, 742. [Google Scholar] [CrossRef] [PubMed]
  4. Wu, C.R.; Liu, Y.; Yang, Y.Y.; Zhang, P.; Zhong, W.; Wang, Y.L.; Wang, Q.Q.; Xu, Y.; Li, M.X.; Li, X.Z.; et al. Analysis of therapeutic targets for SARS-CoV-2 and discovery of potential drugs by computational methods. Acta Pharm. Sin. B 2020, 10, 766–788. [Google Scholar] [CrossRef] [PubMed]
  5. Feng, C.H.; Otani, C.; García-Martín, J.F. Flavonoids as a starting point for therapeutics against COVID-19: Current state-of-the art research advances. In The Book of Flavonoids, 1st ed.; Feng, C.-H., García Martín, J.F., Eds.; Nova Science Publishers, Inc.: New York, NY, USA, 2021; Chapter 12; pp. 340–350. [Google Scholar]
  6. Feng, C.H.; Otani, C.; Ogawa, Y. Innovatively identifying naringin and hesperidin by using terahertz spectroscopy and evaluating flavonoids extracts from waste orange peels by coupling with multivariate analysis. Food Control 2022, 137, 108897. [Google Scholar] [CrossRef]
  7. Abd El-Aziz, N.M.; Awad, O.M.; Shehata, M.G.; El-Sohaimy, S.A. Antioxidant and anti-acetylcholinesterase potential of artichoke phenolic compounds. Food Biosci. 2021, 41, 101006. [Google Scholar] [CrossRef]
  8. Feng, C.H.; García-Martín, J.F.; Lavado, M.B.; López-Barrera, M.C.; Álvarez-Mateos, P. Evaluation of different solvents on flavonoids extraction efficiency from sweet oranges and ripe and immature Seville oranges. Int. J. Food Sci. 2020, 55, 3123–3134. [Google Scholar] [CrossRef]
  9. Leila, M.; Ratiba, D.; Al-Marzouqi, A.H. Experimental and mathematical modelling data of green process of essential oil extraction: Supercritical CO2 extraction. Mater. Proc. 2022, 49, 1023–1029. [Google Scholar] [CrossRef]
  10. Hosseini, S.S.; Khodaiyan, F.; Yarmand, M.S. Optimization of microwave assisted extraction of pectin from sour orange peel and its physicochemical properties. Carbohydr. Polym. 2016, 140, 59–65. [Google Scholar] [CrossRef]
  11. Lefebvre, T.; Destandau, E.; West, C.; Lesellier, E. Supercritical Fluid Chromatography development of a predictive analytical tool to selectively extract bioactive compounds by supercritical fluid extraction and pressurised liquid extraction. J. Chromatogr. A 2020, 1632, 461582. [Google Scholar] [CrossRef]
  12. Liović, N.; Bratanić, A.; Zorić, Z.; Pedisić, S.; Režek Jambrak, A.; Krešić, G.; Bilušić, T. The effect of freeze-drying, pasteurisation and high-intensity ultrasound on gastrointestinal stability and antioxidant activity of blueberry phenolics. Int. J. Food Sci. 2021, 56, 1996–2008. [Google Scholar] [CrossRef]
  13. Shehata, M.G.; Abd EI Aziz, M.N.; Youssef, M.M.; EI-Sohaimy, S.A. Optimization conditions of ultrasound-assisted extraction of phenolic compounds from orange peels using response surface methodology. J. Food Processing Preserv. 2021, 45, e15870. [Google Scholar] [CrossRef]
  14. Khan, M.K.; Ahmad, K.; Hassan, S.; Imran, M.; Ahmad, N.; Xu, C.M. Effect of novel technologies on polyphenols during food processing. Innov. Food Sci. Emerg. Technol. 2018, 45, 361–381. [Google Scholar] [CrossRef]
  15. Sirichan, T.; Kijpatanasilp, I.; Asadatorn, N.; Assatarakul, K. Optimization of ultrasound extraction of functional compound from makiang seed by response surface methodology and antimicrobial activity of optimized extract with its application in orange juice. Ultrason. Sonochem. 2022, 83, 105916. [Google Scholar] [CrossRef] [PubMed]
  16. Khan, M.K.; Abert-Vian, M.; Fabiano-Tixier, A.-S.; Dangles, O.; Chemat, F. Ultrasound-assisted extraction of polyphenols (flavanone glycosides) from orange (Citrus sinensis L.) peel. Food Chem. 2010, 119, 851–858. [Google Scholar] [CrossRef]
  17. Mohammad, N.A.; Zaidel, D.N.A.; Muhamad, I.I.; Hamid, M.A.; Yaakob, H.; Jusoh, Y.M.M. Optimization of the amtopxodamt-rich xanthone extract from mangosteen (Garcinia mangostana L.) pericarp via microwave-assisted extraction. Heliyon 2019, 5, e02571. [Google Scholar] [CrossRef] [PubMed] [Green Version]
  18. Feng, C.H.; Drummond, L.; Sun, D.W.; Zhang, Z.-H. Evaluation of natural hog casings modified by surfactant solutions combined with lactic acid by response surface methodology. LWT-Food Sci. Technol. 2014, 58, 427–438. [Google Scholar] [CrossRef]
  19. Fan, T.; Hu, J.G.; Fu, L.D.; Zhang, L.J. Optimization of enzymolysis-ultrasonic assisted extraction of polysaccharides from Momordica charabtia L. by response surface methodology. Carbohydr. Polym. 2015, 115, 701–706. [Google Scholar] [CrossRef]
  20. Murphy, S.C.; Gilroy, D.; Kerry, J.F.; Buckley, D.J.; Kerry, J.P. Evaluation of surimi, fat, and water content in a low/no added pork sausage formulation using response surface methodology. Meat Sci. 2004, 66, 689–701. [Google Scholar] [CrossRef]
  21. Feng, C.H.; Makino, Y. Colour analysis in sausages stuffed in modified casings with different storage days using hyperspectral imaging—A feasibility study. Food Control 2020, 111, 107047. [Google Scholar] [CrossRef]
  22. Feng, C.H.; Makino, Y.; García-Martín, J.F. Hyperspectral imaging coupled with multivariate analysis and image processing for detection and visualisation of colour in cooked sausages stuffed with different modified casings. Foods 2020, 9, 1089. [Google Scholar] [CrossRef]
  23. Feng, C.H.; Makino, Y.; Yoshimura, M.; Rodríguez-Pulido, F.J. Real-time prediction of pre-cooked Japanese sausages colour with different storage days using hyperspectral imaging. J. Sci. Food Agric. 2018, 98, 2564–2572. [Google Scholar] [CrossRef] [PubMed]
  24. Feng, C.H.; Makino, Y.; Yoshimura, M.; Rodríguez-Pulido, F.J. Estimation of adenosine triphosphate content in ready-to-eat sausages with different storage days, using hyperspectral imaging coupled with R statistics. Food Chem. 2018, 264, 419–426. [Google Scholar] [CrossRef] [PubMed]
  25. Karacaglar, N.N.Y.; Bulat, T.; Boyaci, I.H.; Topcu, A. Raman spectroscopy coupled with chemometric methods for the discrimination of foreign fats and oils in cream and yogurt. J. Food Drug Anal. 2019, 27, 101–110. [Google Scholar] [CrossRef] [PubMed] [Green Version]
  26. Feng, C.H.; Otani, C.; Ogawa, Y.; García-Martín, J.F. Evaluation of properties in different casings modified by surfactants and lactic acid using terahertz spectroscopy—A feasibility study. Food Control 2021, 127, 108152. [Google Scholar] [CrossRef]
  27. Huang, H.; Liu, L.; Ngadi, M.O. Assessment of intramuscular fat content of pork using NIR hyperspectral images of rib end. J. Food Eng. 2017, 193, 29–41. [Google Scholar] [CrossRef]
  28. Hosseini, H.; Jafari, S.M. Fourier transform infrared (FT-IR) spectroscopy of nanoencapsulated food ingredients. In Characterization of Nanoencapsulated Food Ingredients; Afari, S.M., Ed.; Academic Press: Cambridge, MA, USA, 2020; Volume 4, pp. 347–410. [Google Scholar]
  29. Altunayar-Unsalan, C.; Unsalan, O.; Mavromoustakos, T. Insights into molecular mechanism of action of citrus flavonoids hesperidin and naringin on lipid bilayers using spectroscopic, calorimetric, microscopic and theoretical studies. J. Mol. Liq. 2022, 347, 118411. [Google Scholar] [CrossRef]
  30. Tunchaiyaphum, S.; Eshtiaghi, M.; Yoswathana, N. Extraction of bioactive compounds from mango peels using green technology. Int. J. Chem. Eng. Appl. 2013, 4, 194–198. [Google Scholar] [CrossRef] [Green Version]
  31. Shehata, M.G.; Awad, T.S.; Asker, D.; El Sohaimy, S.A.; Abd El-Aziz, N.M.; Youssef, M.M. Antioxidant and antimicrobial activities and UPLC-ESI-MS/MS polyphenolic profile of sweet orange peel extracts. Curr. Res. Nutr. Food Sci. 2021, 4, 326–335. [Google Scholar] [CrossRef]
  32. Feng, C.H. Quality evaluation and mathematical modelling approach to estimate the growth parameters of total viable count in sausages with different casings. Foods 2022, 11, 634. [Google Scholar] [CrossRef]
  33. Iqbal, A.; Sun, D.-W.; Allen, P. Prediction of moisture, colour and pH in cooked, pre-sliced turkey hams by NIR hyperspectral imaging system. J. Food Eng. 2013, 117, 42–51. [Google Scholar] [CrossRef]
  34. Truong, D.-H.; Nguyen, D.H.; Ta, N.T.A.; Bio, A.V.; Do, T.H.; Nguyen, H.C. Evaluation of the use of different solvents for phytochemical constituents, antioxidants, and in vitro anti-inflammatory activities of Severinia buxifolia. J. Food Qual. 2019, 2019, 8178294. [Google Scholar] [CrossRef] [Green Version]
  35. Du Preez, B.V.P.; Beer, D.D.; Joubert, E. By-product of honeybush (Cyclopia maculata) tea processing as source of hesperidin-enriched nutraceutical extract. Ind. Crops Prod. 2016, 87, 132–141. [Google Scholar] [CrossRef]
  36. Barrales, F.M.; Silveira, P.; Barbasa, P.P.M.; Ruviaro, A.R.; Paulino, B.N.; Pastore, G.M.; Macedo, G.A.; Martinez, J. Recovery of phenolic compounds from citrus by-products using pressurized liquids—An application to orange peel. Food Bioprod. Process. 2018, 112, 9–21. [Google Scholar] [CrossRef]
  37. Do, Q.D.; Angkawijaya, A.E.; Tran-Nguyen, P.L.; Huynh, L.H.; Soetaredio, F.E.; Ismadji, S.; Ju, Y.-H. Effect of extraction solvent on total phenol content, total flavonoid content, and antioxidant activity of Limnophila aromatica. J. Food Drug Anal. 2014, 22, 296–302. [Google Scholar] [CrossRef] [Green Version]
  38. Lang, Q.; Wai, C.M. Supercritical fluid extraction in herbal and natural product studies—A practical review. Talanta 2001, 53, 771–782. [Google Scholar] [CrossRef]
  39. Garcia-Castello, E.M.; Rodriguez-Lopez, A.D.; Mayor, L.; Ballesteros, R.; Conidi, C.; Cassano, A. Optimization of conventional and ultrasound assisted extraction of flavonoids from grapefruit (Citrus paradisi L.) solid wastes. LWT-Food Sci. Technol. 2015, 64, 1114–1122. [Google Scholar] [CrossRef]
  40. Zhang, G.W.; He, L.; Hu, M.M. Optimized ultrasonic-assisted extraction of flavonoids from Prunella vulgaris L. and evaluation of antioxidant activities in vitro. Innov. Food Sci. Emerg. Technol. 2011, 12, 18–25. [Google Scholar] [CrossRef]
  41. Stanisic, D.; Liu, L.H.B.; Santos, R.V.D.; Costa, A.F.; Durán, N.; Tasic, L. New Sustainable Process for Hesperidin Isolation and Anti-Ageing Effects of Hesperidin Nanocrystals. Molecules 2020, 25, 4534. [Google Scholar] [CrossRef]
  42. Li, Y.S.; Kandhare, A.D.; Mukherjee, A.A.; Bodhankar, S.L. Acute and sub-chronic oral toxicity studies of hesperidin isolated from orange peel extract in Sprague Dawley rats. Regul. Toxicol. Pharmacol. 2019, 105, 77–85. [Google Scholar] [CrossRef]
  43. Nabil, M.; Donia, T.; Mohamed, T.M. Antioxidant effect of hesperidin isolated from orange peels. Appl. Sci. Eng. Prog. 2016, 35, 1–5. [Google Scholar]
  44. Rekha, S.S.; Pradeepkiran, J.A.; Bhaskar, M. Bioflavonoid hesperidin possesses the anti-hyperglycemic and hypolipidemic property in STZ induced diabetic myocardial infarction (DMI) in male Wister rats. J. Nutr. Intermed. Metab. 2019, 15, 58–64. [Google Scholar] [CrossRef]
  45. Wang, X.S.; Wu, Q.N.; Wu, Y.F.; Chen, G.Y.; Yue, W.; Liang, Q.L. Response surface optimized ultrasonic-assisted extraction of flavonoids from sparganii rhizoma and evaluation of their in vitro antioxidant activities. Molecules 2012, 17, 6769–6783. [Google Scholar] [CrossRef] [PubMed]
Figure 1. Response surface plot (a) and 2D contour plot (b) for the effect of solvent concentration and treated temperature on crude extraction.
Molecules 27 02268 g001
Figure 2. Contour plot for the effect of treated time and treated temperature on precipitation yield under different solvent types [(a,c): ethanol; (b,d): methanol] and ultrasonic frequencies [(a,b): 28 kHz; (c,d): 40 kHz].
Molecules 27 02268 g002
Figure 3. The transmittance of precipitation with different ultrasonic treatments mixed with potassium bromide detected by FTIR (a) and hesperidin–copper complex cited from the study of Stanisic et al. (2020) [41] (b).
Molecules 27 02268 g003
Table 1. Regression coefficients and analysis of variance of the regression models for extraction efficiency.
Source of VariationDfResponse Variables
Crude Extraction (Y1, g)Sediments after Evaporation and Left Overnight (Y2, g)Precipitation Yield (Y3, %)
Source SSSContribution (%)FSSSContribution (%)FSSSContribution (%)F
Model1511,284.1080.4912.10 **10,569.6077.019.83 **2.6452.953.30 **
Linear59820.6070.0531.60 **9546.9069.5626.63 **0.8116.343.07 *
X1 (%, v/v)19248.0065.97148.78 **9035.0065.83126.02 **0.6713.5612.71 **
X2 (min)112.900.090.21 ns0.100.000.00 ns0.000.080.09 ns
X3 (°C)138.900.280.63 ns0.300.000 ns0.000.010.01 ns
X4 (methanol or ethanol)1189.401.353.05 ns166.301.212.32 ns0.122.332.20 ns
X5 (kHz)1331.402.365.33 *345.102.514.81 *0.020.360.33 ns
2-Way Interaction101463.5010.402.35*1022.707.451.43 ns1.8236.723.42 **
X1×X215.000.040.08 ns1.100.010.01 ns0.030.570.54 ns
X1×X3172.700.521.17 *43.600.320.61 ns0.010.120.12 ns
X1×X4192.500.661.49 *15.800.120.22 ns0.183.533.33 ns
X1×X51167.401.192.69 ns4.600.030.06 ns0.000.010.01 ns
X2×X31196.001.403.15 ns229.501.673.20 ns0.469.258.61 **
X2×X4140.300.290.65 ns2.400.020.03 ns0.285.575.22 *
X2×X51689.104.9211.09 **547.003.997.63 *0.306.025.55 *
X3×X4182.900.591.33 ns18.900.140.26 ns0.244.914.56 *
X3×X51106.200.761.71 ns88.400.641.23 ns0.306.025.58 *
X4×X5111.400.080.18 ns71.500.521.00 ns0.040.720.65 ns
Error442734.9019.50 3154.7022.99 2.3346.94
Lack-of-Fit362518.9017.972.59 ns2750.4020.041.51 ns2.3246.6231.75 **
Pure Error8216.101.54 404.302.95 0.020.32
Total5914,019.00100.00 13,724.30100.00 4.97100.00
R2(%) 80.49 77.01 53.06
Note: ** means significant at p ≤ 0.01; * means significant at p ≤ 0.05. ns means not significant. SSS: sequential sum of squares; F: ratio of variance estimates; Df: degree of freedom; X1: solvent concentration; X2: treated times; X3: treated temperatures; X4: types of solvents; X5: ultrasonic frequency.
Table 2. Matrix of Box-Behnken design for treatment combinations and the response of crude extraction, sediments after evaporation and left overnight, and the yield of the precipitation.
TreatmentX1 (%)X2 (min)X3 (°C)X4X5 (kHz)Y1 (g)Y2 (g)Y3 (%)
ExperimentalPredicted ExperimentalPredicted ExperimentalPredicted
11002540Ethanol4024.3033.801.5016.453.712.78
2752525Methanol4053.4051.2122.9026.122.611.86
3508540Methanol2866.3067.9240.0041.841.661.35
4502540Methanol4067.5073.9240.2045.332.320.32
5758555Ethanol2844.0046.4332.3024.762.501.65
6758525Methanol4065.0052.4431.3024.792.302.50
7755540Ethanol4046.9046.8130.0030.172.612.69
8505525Ethanol4077.6065.6455.0048.742.031.70
9508540Methanol4066.3067.0436.8036.941.393.48
101005525Ethanol4030.9026.237.4016.272.133.41
111005555Methanol4022.6028.314.405.745.327.85
12505525Methanol4068.1074.9444.6040.281.25-0.16
13752525Methanol2836.3034.4513.7011.914.145.54
141005525Methanol4034.5028.713.4010.633.364.52
15758525Ethanol2851.0044.3643.3030.351.961.84
16758555Methanol4047.0040.7820.7015.6313.819.59
171008540Methanol4015.5026.183.703.479.188.60
18755540Ethanol4037.8046.8114.8030.173.332.69
19505525Ethanol2848.8051.8536.3037.681.524.34
20502540Ethanol4067.8070.0950.4051.711.412.30
21508540Ethanol4052.3058.7239.6044.41.931.75
22505555Methanol4063.6066.0245.2041.992.363.96
231008540Ethanol4015.0024.651.408.124.623.92
24752525Ethanol4049.7047.5541.8032.632.024.08
251005525Ethanol2825.1021.561.606.723.506.23
261002540Methanol2823.7022.35.802.777.825.62
27752555Ethanol2841.9045.1228.8023.623.521.80
28755540Methanol2859.8045.6733.3022.052.573.90
29502540Methanol2866.0056.2436.5033.71.652.01
30758555Methanol2847.2049.8822.8024.613.035.63
31755540Methanol2851.2045.6721.0022.052.973.90
32758525Ethanol4039.7044.2921.2032.383.431.02
331002540Ethanol2819.3023.523.201.962.985.59
34755540Methanol4052.8049.498.8024.662.754.04
351005525Methanol2818.3025.813.305.445.666.38
361002540Methanol4027.1030.8311.5012.895.133.76
37752555Methanol2830.3044.0915.3024.551.952.08
38758525Methanol2852.4054.2527.3027.123.552.36
391005555Ethanol2838.1034.893.805.412.212.28
401005555Methanol2832.8032.711.607.215.075.88
41755540Ethanol4049.8046.8132.9030.171.982.69
421008540Methanol2836.5036.213.909.889.946.64
43502540Ethanol2851.0050.6634.7035.711.524.93
44755540Ethanol2849.5041.2430.3023.192.293.50
45505555Ethanol4056.9063.1640.7047.382.272.36
46505525Methanol2849.9062.8933.6033.591.281.53
47505555Methanol2862.5061.2638.3041.954.631.82
48755540Ethanol2850.6041.2423.0023.193.103.50
491005555Ethanol4041.6032.254.308.313.913.29
50755540Methanol4041.9049.4917.4024.663.404.04
51755540Methanol2851.8045.6724.3022.052.613.90
52755540Methanol4053.3049.4923.3024.662.954.04
53755540Ethanol2846.6041.2425.3023.192.483.50
54752525Ethanol2821.8029.055.7014.0517.768.72
55758555Ethanol4050.3039.0837.0020.152.594.65
561008540Ethanol2823.1032.941.5010.173.052.92
57752555Methanol4063.8053.5545.7032.112.502.22
58752555Ethanol4061.6056.3344.6035.542.350.99
59505555Ethanol2853.6056.6640.1042.971.831.17
60508540Ethanol2854.2057.8538.0044.942.320.57
Note: X1: solvent concentration; X2: treated times; X3: treated temperatures; X4: types of solvents; X5: ultrasonic frequency; Y1: crude extraction; Y2: sediments after evaporation and left overnight; Y3: the yield of the precipitation.
Publisher’s Note: MDPI stays neutral with regard to jurisdictional claims in published maps and institutional affiliations.

