Abstract
This research aimed to excavate compounds with activity reducing hepatocytes lipid accumulation from Delphinium brunonianum. Four novel diterpenoid alkaloids, brunodelphinine B–E, were isolated from D. brunonianum together with eleven known diterpenoid alkaloids through a phytochemical investigation. Their structures were elucidated by comprehensive spectroscopy methods including HR-ESI-MS, NMR, IR, UV, CD, and single-crystal X-ray diffraction analysis. The inhibitory effects of a total of 15 diterpenoid alkaloids on hepatocytes lipid accumulation were evaluated using 0.5 mM FFA (oleate/palmitate 2:1 ratio) to induce buffalo rat liver (BRL) cells by measuring the levels of triglyceride (TG), total cholesterol (TC), alanine transaminase (ALT), aspartate transaminase (AST), and the staining of oil red O. The results show that five diterpenoid alkaloids—brunodelphinine E (4), delbruline (5), lycoctonine (7), delbrunine (8), and sharwuphinine A (12)—exhibited significant inhibitory effects on lipid accumulation in a dose-dependent manner and without cytotoxicity. Among them, sharwuphinine A (12) displayed the strongest inhibition of hepatocytes lipid accumulation in vitro. Our research increased the understanding on the chemical composition of D. brunonianum and provided experimental and theoretical evidence for the active ingredients screened from this herbal medicine in the treatment of the diseases related to lipid accumulation, such as non-alcoholic fatty liver disease and hyperlipidemia.
1. Introduction
The metabolic diseases caused by lipid accumulation, such as non-alcoholic fatty liver disease (NAFLD) and obesity, affect an increasing number of people. The global prevalence of NAFLD continues to increase and is now estimated as being up to 25% [1,2]. Despite extensive research on NAFLD, there are still no FDA-approved effective drugs as of now. Although many lipid-lowering drugs (statins), insulin sensitizers (metformin), and antioxidants (vitamin E) have been shown to improve NAFLD, there are still several adverse effects [3]. Therefore, it is of great significance to explore drugs with safety and effective lipid accumulation reducing activity from plants for treatment of the metabolic diseases.
Delphinium brunonianum Royle, belonging to genus Delphinium (Ranunculaceae family), is a perennial herbaceous plant and mainly distributed at an altitude of 4000–6000 m from Tibet Autonomous Region of China to Nepal and Afghanistan [4]. The dried aerial parts of D. brunonianum, as a traditional Chinese aboriginal medicine named “Qiagaobei” in Tibetan, have been widely used for a long time in the treatment of jaundice, influenza, skin itching, and snake bites due to its properties of cooling blood, clearing heat, and detoxification. Traditional Chinese medicines with the above properties are more likely to have anti-inflammatory, antiviral, and antibacterial activity.
Phytochemical research has presented that alkaloids, flavonoids, and sterols were the predominant composition of D. brunonianum. Among them, diterpenoid alkaloids are the characteristic constituents having complex structural features, which mainly include lycoctonine-type C19 and atisine-type C20 diterpenoid alkaloids. The two types of diterpenoid alkaloids are different in terms of skeletal structure. The former, as the main type of diterpenoid alkaloid in D. brunonianum, is different from the latter in the number of carbon atoms. Additionally, the latter have an exocyclic double bond on the 16-carbon. Pharmacological studies have proven that diterpenoid alkaloids have many bioactivities with antihypertensive, anti-bacterial, anti-epileptic, diuretic, and anti-inflammatory effects, etc. [5,6,7]. Research showed that several diterpenoid alkaloids may exert anti-inflammatory effects through NF-κB/MAPK and Nrf2/HO-1 [8].
The extract of D. brunonianum possesses efficacy in the regulation of metabolic disorders in high fructose-induced rats [9]. Moreover, our previous research exhibited the D. brunonianum extract, which is enriched with diterpenoid alkaloids, could alleviate NAFLD by reducing the accumulation of lipids in the liver. So far, fourteen lycoctonine-type diterpenoid alkaloids, three atisine-type diterpenoid, and eleven amide alkaloids have been isolated from D. brunonianum [6,10,11,12]. Therefore, information on the chemical composition of diterpenoid alkaloids in D. brunonianum is limited.
To further discover structurally and biologically intriguing active diterpenoid alkaloids in D. brunonianum, a phytochemical study of D. brunonianum was performed as part of our continuous work, which resulted in the isolation of fifteen diterpenoid alkaloids (as shown in Figure 1), including four novel diterpenoid alkaloids (named brunodelphinine B–E) and eleven known ones. Furthermore, these isolated compounds were evaluated for their inhibitory effects on lipid accumulation in free fatty acid (FFA)-induced BRL cells, aiming to screen a series of entities with potential for development as drugs to treat NAFLD.
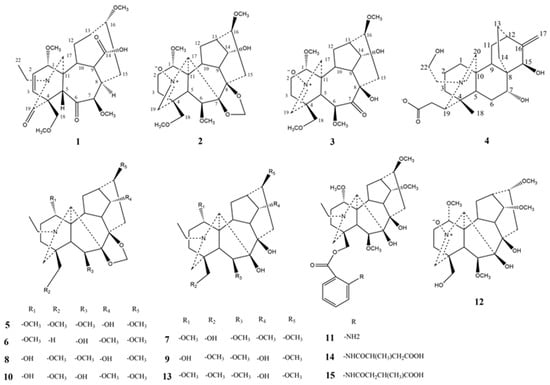
Figure 1.
The structures of compounds 1–15 isolated from D. brunonianum.
2. Results and Discussion
2.1. Structure Elucidation of Compounds
Compound 1 was obtained as amorphous powder, and it showed a positive reaction tested with Dragendorff’s reagent. Its molecular formula was determined as C25H37NO8 (eight degrees of unsaturation) based on protonated molecular ion at m/z 480.2592 [M + H]+ in the HR-ESI-MS (calculated for C25H38NO8, 480.2597). Its IR spectrum showed absorptions due to the hydroxyl (3435 cm−1) and carbonyl (1728, 1671, and 1629 cm−1) groups. The 1H and 13C NMR spectroscopic data (Table 1) of compound 1 exhibited five quaternary carbon signals (δC 40.7, 50.8, 170.2, 174.6, and 202.2), three of which are carbonyl signals (δC 170.2, 174.6, and 202.2), nine methine groups (δC 38.3, 39.4, 45.5, 56.1, 76.88, 77.1, 89.6, 148.8, and 129.6), six methylene groups (δC 21.8, 27.7, 27.9, 42.7, 48.7, and 67.9), four methoxy groups (δH 3.0 (3H, s), 3.23 (3H, s), 3.61 (3H, s), 3.63 (3H, s), δC 52.6, 56.0, 59.0, and 51.2), an intracyclic double bond signal (δH 5.98 (1H, dd, J = 9.7, 1.4 Hz), 7.02 (1H, tt, J = 19.7, 7.3 Hz), δC 129.6, 148.8), and a N-ethyl signal (δH 1.20 (3H, t, J = 7.2 Hz), δC 42.7, 11.1). Thus, compound 1 was considered as a lycoctonine-type C19-diterpenoid alkaloid based on the above data.

Table 1.
NMR spectroscopic data of brunodelphinine B–E (1–4) (400 MHz for 1H-NMR and 100 MHz for 13C-NMR).
The HMBC correlations of H-21 (δH 3.67 (1H, d, J = 3.3 Hz), 3.32 (1H, d, J = 3.3 Hz)), H-18 (δH 3.67 (1H, m)), H-17 (δH 3.28 (1H, m)) with C-19 (δC 170.2) and H-3 (δH 7.02 (1H, tt, J = 19.7, 7.3 Hz)), H-1 (δH 3.82 (1H, m)), H-10 (2.87 (1H, dd, J = 9.7, 5.0 Hz)) with C-6 (δC 202.2) suggested that two carbonyl groups might positioned at C-19 and C-6, respectively. The location of double bond group was attached to C-2 and C-3 positions on the basis of HMBC correlations of H-1 (δH 3.82 (1H, m)) with C- 3 (δC 56.0), H-2 (δH 5.98 (1H, dd, J = 9.7, 1.4 Hz)) with C-10 (δC 56.1), and H-3 (δH 7.02 (1H, tt, J = 19.7, 7.3 Hz)) with C-5 (δC 38.3). According to the HMBC correlations of H-8 (δH 2.04 (1H, s) with C-14 (δC 174.6), a carboxyl group was considered positioned at C-14. Four methoxy groups was attached to C-1, C-7, C-16, and C-18 position due to the HMBC correlations of 1-OCH3 (δH 3.23 (3H, s)) with C-1 (δC 89.6), 7-OCH3 (δH 3.61 (3H, s)) with C-14 (δC 77.1), 16-OCH3 (δH 3.31 (3H, s)) with C-16 (δC 76.9), and 18-OCH3 (δH 3.63 (1H, s)) with C-7 (δC 67.9).
The relative configuration of compound 1 was deduced by NOESY spectrum. The NOESY correlations of H-1 with H-3/H-8/H-10/H-12, H-8 with H-3/H-9/H-1, H-7 with H-21/H-5/7-OCH3, and H-13 with H-12/H-16 indicated β-orientation for H-7, H-18, and H-5, and α-orientation for H-1, H-14, H-8, and H-16. Finally, compound 1 was determined as 7,17-seco, 6,14-dione, 7β,16α-methoxy, 18α-hydrogen, 19-oxobrowniine (Figure 2), which was named brunodelphinine B.
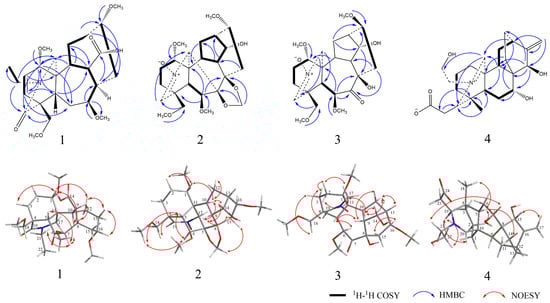
Figure 2.
Selected 1H–1H COSY, HMBC, and NOESY correlations of compounds 1–4.
Compound 2, a yellow amorphous powder, exhibited positive reaction using Dragendorff’s reagent. Its molecular formula was determined as C24H35NO8 (night degrees of unsaturation) on the basis of the HR-ESI-MS (calculated for C24H36NO8, 466.2441). Its IR spectrum showed absorptions for the hydroxyl (3437 cm−1) groups. The 1H and 13C NMR spectroscopic data (Table 1) of compound 2 displayed the presence of one double bond group (δH 6.78 (1H, d, J = 1.6 Hz, δC 138.0)), four methoxy groups (δH 3.18 (3H, s), 3.33 (3H, d, J = 2.7 Hz), 3.31 (3H, d, J = 2.9 Hz), 3.29 (3H, d, J = 3.2 Hz), δC 56.0, 58.9, 56.7, and 59.3), one methylenedioxy group (δH 5.18 (2H, d, J = 4.9 Hz), δC 95.0), ten methines (δC 35.6, 41.9, 47.1, 48.4, 73.9, 77.7, 80.2, 81.3, 89.2, and 138.0), five methylene groups (δC 24.4, 28.4, 26.5, 31.4, and 74.3), and four quaternary carbon groups (δC 44.5, 49.5, 80.9, and 90.4).
HMBC correlations of -O-CH2-O- (δH 5.18 (2H, d, J = 4.9 Hz), δC 95.0) with C-7 (δC 90.4) and C-8 (δC 80.9) indicated a methylenedioxy group locating at the C-7 and C-8 positions. Four methoxy groups were assigned to be positioned at C-1, C-6, C-16, and C-18 due to the HMBC correlations of 1-OCH3 (δH 3.18 (3H, s)) with C-1 (δC 80.2), 6-OCH3 (δH 3.33 (3H, d, J = 2.7 Hz)) with C-6 (δC 89.2), 16-OCH3 (δH 3.31 (3H, d, J = 2.9 Hz)) with C-16 (δC 81.3), and 18-OCH3 (δH 3.29 (3H, d, J = 3.2 Hz)) with C-18 (δC 74.3). In addition, it was substantiated the position of the hydroxyl group at C-14 by the 1H-1H COSY correlations of H-14 (δH 3.99 (1H, d, J = 5.5 Hz)) with H-9 and H-13.
Careful comparison of the 13C NMR spectral data with the known compound sharwuphinine A (12) revealed that compound 2 might be a deazoethyl compound that contained a nitrone structure and a nitrogen–oxygen double bond with C-19 (δH 6.78 (1H, d, J = 1.6 Hz), δC 138.0). Our results confirmed that compound 2 is a lycoctonine-type C19-diterpenoid alkaloid. The NOESY correlations of H-5 with H-18 /H-6/18-OCH3, H-6 with H-18, H-10 with H-1/H-12/H-9/H-14, and H-15 with H-17, H-9 with H-14/H-15 suggested the β-orientation for H-6, H-7, H-8, H-16, and H-18 and the α-orientation for H-1 and H-14. Therefore, compound 2 was determined as 14α-hydroxy-18β-methoxy-Nnitrone (Figure 2), and named as brunodelphinine C.
Compound 3 was isolated as a yellow amorphous powder and showed a positive reaction with Dragendorff’s reagent. Its molecular formula was determined as C23H35NO8 by HR-ESI-MS at m/z 454.2439 [M + H]+ (calculated for C23H36NO8, 454.2446), corresponding to 7 degrees of unsaturation. The IR spectrum showed absorptions for hydroxyl (3447 cm−1) groups. The 1H and 13C NMR spectroscopic data (Table 1) of compound 3 were essentially identical with those of compound 2, suggesting that 3 also belonged to lycoctonine-type C19-diterpenoid alkaloid. The only difference between 3 and 2 was the presence of a methylenedioxy group (δH 5.18 (2H, d, J = 4.9 Hz), δC 95.0) in the former, instead of the carbonyl group (δC 209.3) in the latter. This was also supported by 2D-NMR data; the location of one carbonyl group could be assigned at C-7 due to the HMBC correlation of H-6 with C-7 (δC 209.3) and H-15 with C-7 (δC 209.3). By comparison with compound 2, it was found that compound 3 is also a C19-diterpenoid alkaloids containing deazoethyl group. Finally, 3 was identified as 7,17-seco, 7-keto, 8-hydroxy-brunodelphinine C (Figure 2), named brunodelphinine D.
Compound 4 was isolated as a white amorphous powder, and it presented a positive reaction under Dragendorff’s reagent. Its molecular formula was ascertained as C24H35NO5 (night degrees of unsaturation), deducing from the quasi-molecular ion peak (M + H)+ at m/z 418.2543 (calculated for C24H36NO5, 418.2586) in HR-ESI-MS. The IR spectrum displayed absorptions bands for hydroxyl (3410 cm−1), carboxylate (1594 cm−1 and 1384 cm−1), and amine salt (2932 cm−1 and 2872 cm−1) groups. The 1H NMR and 13C NMR spectroscopic data (Table 1) of compound 4 exhibited one methyl group (δH 0.96 (3H, s), δC 25.0) and two methine signals substituted with hydroxyl groups (δH 3.76 (1H, dd, J = 11.6, 4.1Hz), 4.02 (1H, s), δC 67.2, 69.5), and a set of terminal double bond signals (δH 5.00 (1H, s), 4.96 (1H, s), δC 155.8, 109.5), and four quaternary carbon groups (δC 36.3, 42.2, 44.9, and 182.9) that included one carboxyl group (δC 182.9), and of the eleven methylene groups (δC 18.3, 18.9, 24.8, 27.5, 27.8, 34.8, 36.2, 36.3, 58.0, 61.3, and 109.5), one nitrogen-containing substituted methine groups (δC 173.2) and four methine groups (δC 44.7, 35.5, 39.4, and 66.1). The above results indicate that compound 4 was a C20-diterpenoid alkaloid.
The four hydroxyl groups were assigned to be positioned at C-19, C-22, C-7, and C-15 due to the HMBC correlations of H-18 (δH 0.96 (3H, s)) with C-4 (δC 36.3), C-5 (δC 44.7), C-19 (δC 66.1), H-9 (δH 2.03 (1H, t, J = 8.6 Hz)) with C-20 (δC 173.2), H-20 (δH 8.60 (1H, s)) with C-19 (δC 66.1), C-23 (δC 36.2), H-7 (δH 3.76 (1H, dd, J = 11.6, 4.1 Hz)) with C-8 (δC 42.2), C-15 (δC 69.5), H-15 (δH 4.02 (1H, s)) with C-13 (δC 24.8), C-9 (δC 39.4), and H-17 (δH 5.00 (1H, s), 4.96 (1H, s)) with C-15 (δC 69.5).
The NOESY correlations of H-5 with H-2/H-14/H-18, H-7 with H-21, H-15 with H-17, and H-19 with H-20/H-22 indicated the β-orientation for C-15, C-18, and the α-orientation for C-7. Combined with the single crystal diffraction X-ray experiment, the hydroxyl groups on C-22 at the β-position, and the carboxyl group on C-19 was β-substituted (Figure 3). Finally, compound 4 was confirmed as 7α, 15β, 22β-hydroxy-19β-carboxylatisine (Figure 2), and named brunodelphinine E.
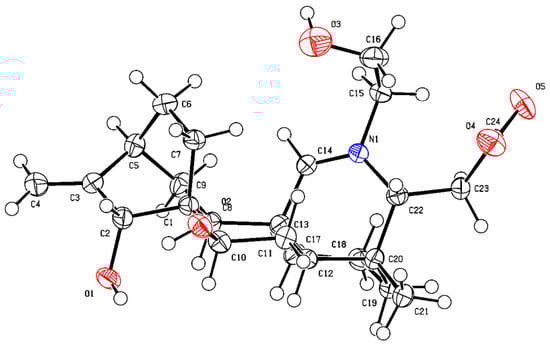
Figure 3.
ORTEP drawing of compound 4.
Furthermore, eleven known diterpenoid alkaloids were determined to be delbruline (5) [11], delpheline (6) [13], lycoctonine (7) [11], delbrunine (8) [11], delcosine (9) [11], uraphine (10) [14], anthranoyllycoctonine (11) [15], sharwuphinine A (12) [16], browniine (13) [11], shawurensine (14) [17], and delavaine B (15) [17] by comparison of their corresponding spectroscopic data with those reported previously in the literature.
2.2. Cell Viability of Fifteen Isolated Compound and Positive Drug in BRL Cells
The cell viability (%) of the isolated diterpenoid alkaloids in the concentration range of 1–500 μM and the time-effectiveness of them for 24 h and 48 h were evaluated using CCK-8 assay (Figure 4). The results show that the cell viability of isolated compounds 1–15 and positive (ATC) decreased after 48 h treatment and was generally lower than that of cells treated for 24 h at the same concentration. The IC50 values of 15 compounds and positive drug were calculated by SPSS 23.0 software. The results show that the IC50 values of compounds (1, 2, 8, and 11) were in the range of 300–500 μM, while others were more than 500 μM (Table 2). Therefore, through the entire experiments, the maximum concentration of tested diterpenoid alkaloids was limited to 10 μM, a concentration about one-tenth to one-fiftieth of IC50 of them. In addition, optimum dosage of modeling agent (FFA) was also selected as the concentration of 0.5 mM through CCK-8 assay (Figure S77).
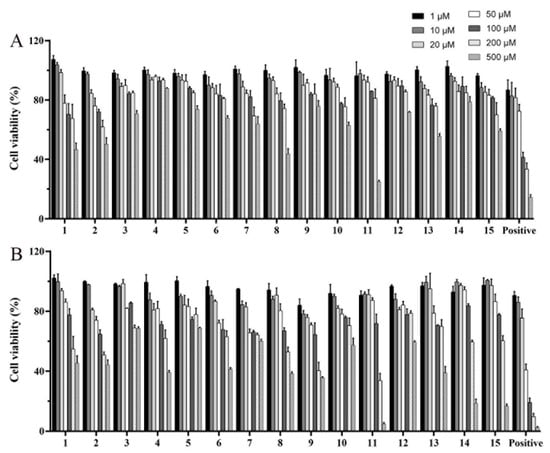
Figure 4.
Cell viability of compounds 1–15 positive (ATC) with the concentration range of 1–500 μM in BRL cells for 24 h (A) and 48 h (B).
Table 2.
The IC50 value of compounds 1–15 and positive (ATC) in BRL cells.
2.3. The Inhibitory Effects of Isolated Compounds on Lipid Accumulation in FFA-Induced BRL Cells
2.3.1. TG, TC, ALT, and AST Levels of Fifteen Isolated Compounds in FFA-Induced BRL Cells
We selected FFA-induced BRL cells (oleate and palmitate ratio was 2:1) to establish a cellular NAFLD model, which is a widely used method by researchers for studying diseases related to hepatocytes lipid accumulation [18]. The TG secretion was measured to preliminarily evaluate the inhibitory effect on lipid accumulation of 15 isolated alkaloid compounds. The results show that TG content in the model group was 3 times that of the normal control group, indicating that BRL cell stimulated by 0.5 mM FFA for 24 h could successfully establish a hepatocytes model of lipid accumulation. Compounds 1–15 were tested at a concentration of 10 μM in FFA-induced BRL cells to determine their inhibitory effects on hepatocytes TG secretion (Figure 5). Atorvastatin calcium (ATC) is a statin cholesterol-lowering drug and widely used in the clinical treatment of hyperlipidemia and NAFLD, etc. [19,20]. Therefore, we used atorvastatin calcium (ATC, 10 µM) as a positive control drug. Compared with the model group, compounds 1, 2, 4–8, 10–12, 14, and 15 had the effect of inhibiting the lipid accumulation (TG secretion) in BRL cells stimulated by FFA (p < 0.05), and compound 12 showed the strongest inhibition effect on the level of TG (p < 0.01).
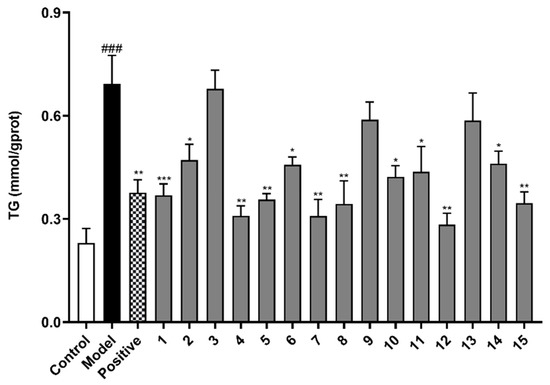
Figure 5.
The effects of compounds (1–15) on triglyceride (TG) level in FFA-induced BRL cells. BRL cells were treated with a mixture of 0.5 mM FFA in the absence or presence of compounds (1–15) at a concentration of 10 µM. The values are presented as mean ± SEM of six independent experiments. ### p < 0.001, vs. the control group; * p < 0.05, ** p < 0.01, *** p < 0.001, vs. the model group.
The activity of reducing lipid accumulation (TG secretion) of compounds 4, 5, 7, 8, and 12 was better than that of the positive control drug (10 µM). Therefore, we selected these five compounds for the further experiments. In addition to TG level, TC level and the liver injury indicators (ALT and AST) as typical indicators of NAFLD metabolic phenotype are also necessary for the five isolated compounds to be measured. According to the results, compounds 4, 5, 7, 8, and 12 ameliorated the indicators of TG, TC, ALT, and AST levels to varying degrees in FFA-induced BRL cells (Figure 6), showing that these five compounds have the potential to be developed as drugs for treatment of NAFLD.
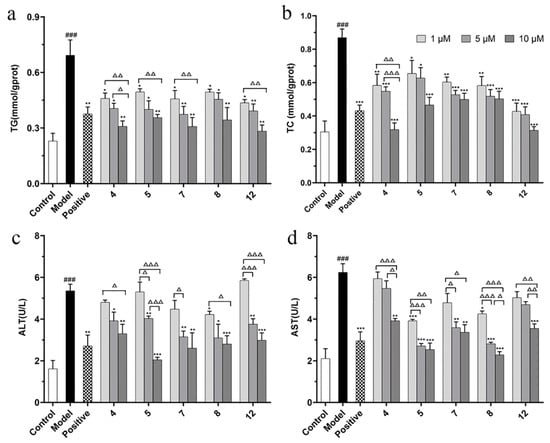
Figure 6.
The effects of compounds (4, 5, 7, 8, and 12) on TG (a), TC (b), ALT (c), and AST (d) level in FFA-induced BRL cells. BRL cells were treated with a mixture of 0.5 mM FFA in the absence or presence of compounds (4, 5, 7, 8, and 12) at the concentration of 1, 5, or 10 µM. The values are presented as mean ± SEM of six independent experiments. ### p < 0.001, vs. the control group; * p < 0.05, ** p < 0.01, *** p < 0.001, vs. the model group. Δ p < 0.05, ΔΔ p < 0.01, ΔΔΔ p < 0.001, pairwise comparisons between three doses of each compound group.
The significance across dosage was evaluated by performing multiple comparisons within each compound with the different concentrations compared with each other. The results show that the low (1 µM) and high (10 µM) doses of compound 4 were statistically significant at TG, TC, ALT, and ALT levels (Δ p < 0.05), while the medium (5 µM) and high (10 µM) doses of compound 4 were statistically significant at TG, TC, and AST levels (Δ p < 0.05). The low (1 µM) and high (10 µM) doses of compound 5 and 12 were statistically significant at TG, ALT, and ALT levels (ΔΔ p < 0.01). The low (1 µM) and high (10 µM) doses of compound 7 were statistically significant at TG and AST levels (Δ p < 0.05). In pairwise comparison between different dose groups, compound 5 had a significant difference in ALT level (Δ p < 0.05), as did compound 8 in AST level (Δ p < 0.05).
2.3.2. Oil Red O Staining of Lipid Droplets and Quantitative Analysis in FFA-Induced BRL Cells
Combined with the oil red O staining and quantitative analysis assay, the effect of reducing lipid accumulation of compounds 4, 5, 7, 8, and 12 was performed in FFA-induced BRL cells. Oil red O staining showed that the above five compounds can significantly reduce lipid accumulation in FFA-induced BRL cells compared to the model group (Figure 7A,B). Quantitative analysis of lipid accumulation was also analyzed by ImageJ 1.8.0 software by calculating the area of red-stained cells (Figure 7C). Compared with the control group, the fold change values decreased significantly in FFA-stimulated cells, indicating that using 0.5 mM FFA as a modeling agent could successfully establish lipid accumulation in hepatocytes. Meanwhile, the fold change values on cells treated with compounds 4, 5, 7, 8, or 12 were less than the model group (*** p < 0.001), which was comparable with the positive group (ATC). The above experimental results show that compounds 4, 5, 7, 8, and 12 could significantly reduce lipid accumulation in FFA-induced BRL cells. Similarly, the above five compounds also had good inhibitory effects on lipid accumulation in FFA-induced HepG2 cells by oil red O evaluation and TG secretion assay (Figures S78 and S79).
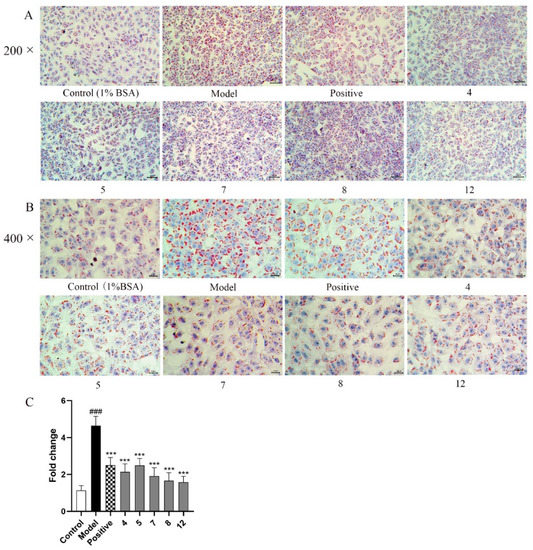
Figure 7.
Oil red O staining of lipid droplets and quantitative analysis in BRL cells treated with or without 0.5 mM FFA mixed compounds 4, 5, 7, 8, and 12 (10 µM); (A) 200×; (B) 400×; (C) Quantitative analysis of red-stained cells. The images shown are representatives of 3 replicates of each. The values are presented as mean ± SEM. ### p < 0.001, vs. the control group; *** p < 0.001, vs. the model group.
2.4. Preliminary Mechanism Study of Five Isolated Compounds Based on Network Pharmacology Method
2.4.1. Prediction of Underlying Mechanism for Five Isolated Compounds in the Treatment of NAFLD
According to the network pharmacology method, a total of 81 targets were screened, and these targets were considered as potential targets of five compounds for the treatment of NAFLD. At the same time, Cytoscape 3.8.0 software was used to construct a compounds–targets network diagram (Figure 8A). The protein interaction (PPI) network diagram (Figure 8B) shows that PPARG, MTOR, ACE, PPARA, NOS3, etc., play very important roles in protein interaction, indicating that these targets may be potential therapeutic targets. It is worth noting that PPARG has the strongest protein interaction among the screened targets, suggesting that the inhibition of lipid synthesis may be the underlying mechanism by which five compounds exert their effect on reducing lipid accumulation.
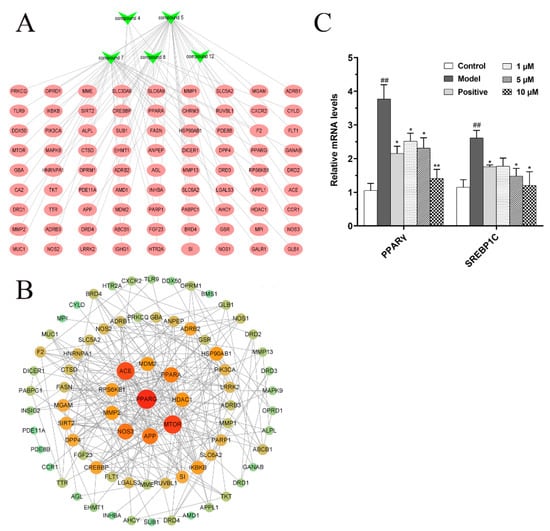
Figure 8.
Underlying mechanism study of five isolated compounds based on network pharmacology method. (A) Component–target network diagram; (B) Protein interaction (PPI) network diagram. (C) The effects of compound 12 on fatty acid synthesis in FFA-induced BRL cells. ## p < 0.01, vs. the control group; * p < 0.05, ** p < 0.01, vs. the model group.
2.4.2. Effects of Compound 12 on Fatty Acid Synthesis in FFA Mixture-Induced BRL Cells
Studies have shown that many enzymes involved in lipid synthesis are upregulated by lipogenic transcription factors, such as peroxisome proliferator-activated receptor gamma (PPARγ, also known PPARG) and sterol regulatory element-binding protein 1C (SREBP1C), which in turn lead to cellular lipid accumulation. Therefore, PPARγ and SREBP1C as the lipogenic regulators play an important role in the occurrence and development of NAFLD [21,22,23]. Compared with the other 14 compounds, compound 12 has the strongest inhibitory effect on TG level (p < 0.01). Therefore, we selected compound 12 as a representative for subsequent potential mechanism studies. Based on network pharmacology predicted results and studies in the literature, the relative mRNA levels of PPARγ and SREBP1C in FFA-induced BRL cells were analyzed by real-time PCR system. Our results show that compound 12 decreased relative mRNA levels of PPARγ and SREBP1C in a dose-dependent manner (Figure 8C). It indicated that compound 12, as a representative of diterpenoid alkaloids isolated from D. brunonianum, may inhibit fat accumulation by regulating the expression of lipid synthesis transcription factors, such as PPARγ and SREBP1C.
3. Materials and Methods
3.1. General Experimental Procedures
The optical rotations were measured on an Autopol IV Automatic polarimeter (SiberHegner, Hong Kong, China). UV spectra were measured by a Shimadzu UV-2550 ultra-visible spectrophotometer (Shimadzu, Kyoto, Japan). IR spectra were recorded on EQUINOX55 FTIR spectrophotometer (Bruker, Bremerhaven, Germany). NMR spectra were obtained with Bruker AV 400 spectrometer (Bruker, Bremerhaven, Germany). HR-ESI-MS spectra were performed on a Triple-TOF 5600 mass spectrometer (AB Sciex, Redwood City, CA, USA). Silica gel (200–300 mesh, Qingdao Haiyang Chemical Co., Ltd., Qingdao, China) was used for column chromatography (CC). Sephadex LH-20 (25–100 μm, Fluka BioChemika, Buchs, Switzerland) and ODS RP-C18 silica gel (40–63 μm, Merck KgaA). The pre-coated silica gel GF254 plates (Qingdao Haiyang Chemical Co., Ltd., Qingdao, China) were used for TLC. Multimode Microplate Reader (PerkinElmer EnSpire, Waltham, MA, USA). Optical microscope (Mingmei Microscope, Guangzhou, China). StepOne Real-Time PCR System (Applied Biosystems, Foster City, CA, USA).
Atorvastatin calcium (product number A121956), sodium palmitate (product number S161450), and sodium oleate (product number S1O4196) were obtained from Shanghai Aladdin Biochemical Technology Co., Ltd., Shanghai, China. Bovine serum albumin (fatty acid free, product number A8850) was obtained from Beijing Solarbio Science & Technology Co., Ltd., Beijing, China. Dulbecco’s modified Eagle medium (Thermo Fisher Biochemicals Co., Ltd., Beijing, China). Fetal bovine serum (Biological Industries, Kibbutz Beit Haemek, USA). Penicillin/streptomycin (1%), oil red O, ematoxylin solution (Solarbio, Beijing, China). Cell Counting Kit-8 (Biosharp, Beijing, China). TG, TC, ALT, and AST reagent test kits (Nanjing Jiancheng Bioengineering Research Institute Co., Ltd., Nanjing, China). Trizol reagent (Ambion, Waltham, MA, USA). All solvents were of analytical grade.
3.2. Plant Material
The aerial parts of D. brunonianum Royle were collected from Linzhi (Tibet Autonomous Region, China) and were identified by Professor Ga Wu (Tibetan Traditional Medical College, Lasa, China). The voucher specimen was deposited at the Department of College of Chinese Medicine, Guangzhou University of Chinese Medicine, Guangzhou, China.
3.3. Extraction and Isolation
Dried and powdered aerial parts of D. Brunonianum Royle (20 kg) were repeatedly extracted with methanol (MeOH) at room temperature for five times, and each extraction time was for 24 h. The extracted solution was evaporated in vacuum to afford the crude methanol extraction. The concentrated extraction was suspended in water and partitioned in different solvents to obtain petroleum extract (650 g), chloroform extract (240 g), EtOAc extract (42 g), and n-butanol extract (400 g), respectively.
The crude chloroform fraction was subjected to CC with silica gel (100–200 mesh) and eluted with cyclohexane (CYH)/ethyl acetate (EtOAc) gradient system (5:0 to 1:0) and EtOAc/MeOH gradient system (4:1 to 1:1); the gradient system gave fractions 1–9. Fr.5 was separated to Sephadex LH-20 CC (CHCl3/MeOH, 1:1) to afford subfractions (Fr.5-1 and Fr.5-2). Fr.5-2 was subjected to normal phase silica gel column with CYH/EtOAc gradient system (3:1 to 1:3), ODS middle pressure column eluted with MeOH/H2O (30–80%) to obtain compounds 5 (10 g), 6 (22 mg), 7 (1034 mg), 8 (2800 mg), 9 (254 mg). Fr. 6 was subjected to Sephadex LH-20 CC (CHCl3/MeOH, 1:1) to afford subfractions (Fr.6-1 and Fr.6-2). Fr.6-1 was purified by ODS middle pressure column eluted with MeOH/H2O (60%) to obtain 10 (93 mg), and Fr.6-1 was subjected to normal phase silica gel column CYH/EtOAc (1:5) to obtain 11 (110 mg). Fr.6-2 was subjected to normal phase silica gel column CYH/EtOAc (1:1) and ODS middle pressure column eluted with MeOH/H2O (40–80%) to obtain 12 (18 mg). Fr.7 was subjected to Sephadex LH-20 CC (CHCl3/MeOH, 1:1) and ODS reversed phase column (40–80%) to yield 13 (382 mg). Fr.8 was subjected to Sephadex LH-20 CC (CHCl3/MeOH, 1:1), and ODS reversed phase column (40–80%) to afford subfractions (Fr.8-1 and Fr.8-2). Fr.8-1 was subjected to silica gel column (CHCl3/MeOH, 10:1) to obtain 14 (15 mg) and 15 (80 mg). Fr.9 was subjected to silica gel column with CHCl3/MeOH gradient system (100:1 to 5:1), and preparative HPLC (acetonitrile-Water system) to obtain 1 (9 mg), 2 (25 mg), and 3 (6 mg).
The crude n-butanol extract (400 g) was subjected to normal phase silica CC eluted with CH2Cl2/MeOH gradient system (50:1 to 1:1) to provide Frs.1–9. Fr.3 (53 g) was subjected to silica gel CC with CH2Cl2/MeOH gradient system (1:0 to 2:1) to obtain (Fr.3.1-Fr.3.4). Fr.3.4 was eluted by Sephadex LH-20 column (80% MeOH/H2O), gradient elution by ODS CC (MeOH/H2O, 20–70%), and silica gel column chromatography eluted with EtOAc/MeOH gradient system (1:0 to 5:1) to obtain 4 (375 mg).
3.4. Characterization of Compounds 1–4
Brunodelphinine B (1): White amorphous powder; +70.00 (c = 0.800, MeOH); UV(MeOH) λmax: 193, 208 nm; IR (KBr) vmax: 3435, 2952, 2885, 2826, 1728, 1671, 1629, 1454, 1124, 1084, 744, 659 cm−1; CD (MeOH, Δε) λmax 227 (−5.01), 310 (−0.55); HR-ESI-MS m/z 480.2592 [M + H]+ (calculated for C25H38NO7, 480.2597); 1H-NMR (MeOD, 400 MHz) and 13C-NMR (MeOD) data see Table 1.
Brunodelphinine C (2): Light yellow amorphous powder; +4.35 (c = 0.850, MeOH); UV(MeOH) λmax: 200, 209, 245 nm; IR (KBr) vmax: 3437, 2939, 2895, 1647,1462, 1196, 1088, 560 cm−1. CD (MeOH, Δε) λmax 203 (+4.07), 225 (−0.30), 259 (−2.14) nm; HR-ESI-MS m/z 466.2445 [M + H]+ (calculated for C24H36NO8, 466.2441). 1H-NMR (CDCl3) and 13C-NMR (CDCl3) data see Table 1.
Brunodelphinine D (3): Light yellow amorphous powder; −9.33 (c = 0.300, MeOH); UV(MeOH) λmax: 200, 209, 257 nm; IR (KBr) vmax: 3447, 2949, 2894, 2827, 1697, 1627, 1585, 1464, 1200, 1126, and 1089 cm−1. CD (MeOH, Δε) λmax 203 (+4.07), 225 (−0.30), 259 (−2.14) nm; HR-ESI-MS m/z 454.2439 [M + H]+ (calculated for C23H36NO8, 454.2446). 1H-NMR (MeOD) and 13C-NMR (MeOD) data are shown in Table 1.
Brunodelphinine E (4): White amorphous powder; +46.0 (c = 0.10, MeOH); UV(MeOH) λmax: 282 nm; IR (KBr) vmax: 3410, 2932, 2872, 1594, 1459, 1384, 1079 cm−1; HR-ESI-MS m/z 418.2586 [M + H]+ (calculated for C24H36NO5, 418.2543); 1H-NMR (DMSO) and 13C-NMR (DMSO) data see Table 1.
3.5. Effects of Fifteen Isolated Compounds on Cell Activity
Buffalo rat liver (BRL) cells were obtained from the Cell Bank, Committee for Typical Culture Preservation, Chinese Academy of Sciences. BRL cells were cultured in DMEM (containing 10% fetal bovine serum and 1% penicillin/streptomycin) under humidified 5% CO2 (v/v) atmosphere at 37 °C. To determine the cell viability of compounds 1–15, the CCK-8 assay was performed [24]. The fifteen isolated compounds were dissolved in DMSO and diluted 1:1000 in culture medium, respectively. Cells were seeded in 96-well plates (6 × 10³ cells per well) for 24 h incubation and then treatment with different concentrations (1, 10, 20, 50, 100, 200, and 500 µM) of each compound for 24 h or 48 h, respectively. CCK-8 solution (10% of the total solution) was added to each well, further incubated for 1 h at 37 °C. The absorbance was measured at 450 nm using a Multimode Microplate Reader.
3.6. Effects of Fifteen Isolated Compounds on the Inhibition of Lipid Accumulation in FFA-Induced BRL Cells
3.6.1. TG, TC, ALT, and AST Quantification of Fifteen Isolated Compounds in FFA-Induced BRL Cells
BRL cells were grown in 24-well plates until 70–80% confluence. Subsequently, 0.5 mM FFA (oleate and palmitate in a final ratio of 2:1) was applied for 24 h to establish an in vitro model of hepatocytes lipid accumulation in the model group, treated with 0.5 mM FFA combination with 1, 5, or 10 µM isolated compounds for 24 h in alkaloids groups. A portion of 1% bovine serum albumin (BSA) was added in BRL cells of the control group. Then, the medium of each group was collected for determination of ALT and AST levels by commercial kits. After removing the medium, 200 µL of 0.25% trypsin was added to digest the cells in 37 °C for 2 min. Then, 500 µL of DMEM that contained 10% fetal bovine serum (FBS) was added to stop digesting. Cells suspension was centrifuged at 800 r/min for 3 min. After adding 200 µL of ethanol, cells were collected and crushed by ultrasonic cell disruptor at 4 °C. Part of the cell fragmentation solution was used for the determination of cell protein content, the other part was used to determine TG and TC levels by commercial kits according to the manufacturer’s instruction [25].
3.6.2. Oil Red O Staining Assay
BRL cells were plated in 96-well plates until reaching 70–80% confluence and treated with 0.5 mM FFA mixture and the tested compounds for 24 h. Controls were incubated for the same period in complete medium.
After 24 h of incubation, the cells were fixed with 5% formalin solution for 30 min and then incubated with oil red O working solution for 15 min at room temperature. After that, the cells were washed once with 60% isopropanol and three times with water. The nuclei were stained with hematoxylin solution for 2 min at room temperature. Then, the operation of oil red O staining was referred to the previous research [26]. Finally, the red oil droplets were observed using an optical microscope.
3.7. Underlying Mechanism Study of Five Isolated Compounds Based on Network Pharmacology
3.7.1. Prediction of Potential Targets of Action for Five Isolated Compounds in the Treatment of NAFLD
The ChemDraw software (14.0) was used to draw the structural formulas of the five compounds (4, 5, 7, 8, and 12), and their respective SMILE formulas were saved. The pharmmapper database (http://www.lilab-ecust.cn/pharmmapper/ (accessed on 14 February 2022)) and swisstarget database (http://swisstargetprediction.ch/ (accessed on 14 February 2022)) were used to predict the potential targets of five compounds. All targets were aggregated, and duplicate targets were removed to obtain potential targets for five compounds. In OMIM (https://www.omim.org/ (accessed on 14 February 2022)), TTD (http://db.idrblab.net/ttd/ (accessed on 15 February 2022)), GeneCards (https://www.genecards.org/ (accessed on 15 February 2022)), DisGeNET (https://www.disgenet.org/dbinfo (accessed on 15 February 2022)) and DrugBank (https://go.drugbank.com/drugs (accessed on 15 February 2022)) databases, with “Non-alcoholic liver disease” as the search term, NAFLD-related targets were searched. The predicted targets of the five compounds were intersected with the related targets of NAFLD, and the intersection genes were considered as possible targets for the treatment of NAFLD by the five compounds.
3.7.2. Target Protein Interaction (PPI) Core Network Construction
The potential therapeutic targets were imported to the String (https://string-db.org/ (accessed on 16 February 2022)) database, and the multiple proteins tool was used to define the species as “Homo sapiens” to obtain protein interaction relationships. The results were imported into Cytoscape 3.8.0 software in CSV format for visual analysis, and a protein interaction network diagram was constructed.
3.7.3. Effects of Compound 12 on Fatty Acid Synthesis in FFA Mixture-Induced BRL Cells
Total RNA was extracted from BRL cells with the use of the Trizol reagent. The expression levels of PPARγ and SREBP1C mRNA in FFA-induced BRL cells were analyzed by Applied Biosystems StepOne Real-Time PCR (RT-PCR) System. In addition, the PCR amplification was performed for 40 repetitive thermal cycles with SYBR green (95 °C for 15 s, 60 °C for 15 s, and 72 °C for 32 s). Data were normalized by the amount of β-actin mRNA. Primers are listed in Table 3.
Table 3.
Primer sequences of target genes for RT-PCR.
3.8. Statistical Analysis
All data are expressed as mean ± SEM of six independent experiments. SPSS 23.0 software was used for statistical analysis by one-way ANOVA method. A p value less than 0.05 was considered statistically significant.
4. Conclusions
Natural products extracted from medical plants are a rich source of biologically active substances, which play an important and irreplaceable role in the drug discovery field [27,28,29]. In our present research, fifteen compounds were isolated from the CHCl3 extraction of D. brunonianum, including four undescribed compounds (1–4) and eleven known compounds (5–15). Among the known compounds, uraphine (10) was isolated from genus Delphinium for the first time, and delpheline (6), anthranoyllycoctonine (11), sharwuphinine A (12), shawurensine (14), and delavaine B (15) were first discovered in D. brunonianum. The inhibitory effects of isolated compounds (1–15) on hepatocytes lipid accumulation were also evaluated in FFA-induced BRL cells. Our results indicate that five selected compounds (4, 5, 7, 8, and 12) showed strong inhibitory effects on hepatocytes lipid accumulation in a dose-dependent manner (1, 5, and 10 µM). Compound 12, as a representative of diterpenoid alkaloids isolated from D. brunonianum, may inhibit fat accumulation by regulating the expression of lipid synthesis transcription factors PPARγ and SREBP1C. In summary, the compounds isolated in this study could serve as a potential for treatment of diseases caused by lipid accumulation, such as NAFLD and hyperlipidemia diseases. In addition, this study enriches the chemical constituents and activity of D. brunonianum and provides a reference for further research on the potential mechanism of diterpenoid alkaloids in improving hepatocytes lipid accumulation.
Supplementary Materials
The following supporting information can be downloaded at: https://www.mdpi.com/article/10.3390/molecules27072257/s1, HR-ESI-MS, NMR, IR, UV, and CD spectra of 1–4 (Figure S1–S43); HR-ESI-MS, 1H and 13C NMR spectra of 5–15 (Figure S44–S76); Cell viability at different FFA concentrations in BRL cells (Figure S77); Effects of compounds (4, 5, 7, 8, and 12) on TG levels in FFA-induced HepG2 cells (Figure S78); Oil red O staining of lipid droplets and quantitative analysis in HepG2 cells (Figure S79).
Author Contributions
Conceptualization, C.Z. and C.L.; methodology, H.M. and Y.M.; software, Y.Y. and M.W.; validation, Z.D. and K.Z.; formal analysis, Z.D. and F.L.; investigation, C.Z. and C.L.; resources, C.Z., C.L. and Z.D.; data curation, H.M. and Y.M.; writing—original draft preparation, H.M. and Y.M.; writing—review and editing, H.M. and F.L.; visualization, Y.M., Y.Y. and F.L.; supervision, C.Z. and C.L.; project administration, F.L. and C.L. All authors have read and agreed to the published version of the manuscript.
Funding
This research was funded by the National Natural Science Foundation of China (Grant No. 81873091, 81573566, 81673872, 82174266, and 81974520) and the Department of Education, Guangdong Province (Grant No. YQ2013043). It was also supported by the Department of Science and Technology of Tibet autonomous region (Grant No. 2016ZR-ZY-01).
Institutional Review Board Statement
Not applicable.
Informed Consent Statement
Not applicable.
Data Availability Statement
The data presented in this study are available in this article.
Conflicts of Interest
The authors declare no conflict of interest.
Sample Availability
Samples of the compounds are not available from the authors.
Abbreviations
High Resolution Electrospray Ionization Mass Spectrometry, HR-ESI-MS; Nuclear Magnetic Resonance, NMR; Infrared Spectrometry, IR; Ultraviolet Visible Spectrometry, UV; Circular Dichroism Spectrometry, CD; Distortionless Enhancement by Polarization Transfer, DEPT; Two Dimensional 1H Correlation Spectroscopy, 1H-1H COSY; 1H-Detected Heteronuclear Multiple Bond Correlation, HMBC; 1H-Detected Heteronuclear Single Quantum Correlation, HSQC; Nuclear Overhauser Effect Spectroscopy, NOESY; High Performance Liquid Chromatography, HPLC; Thin Layer Chromatography, TLC; Crude Chloroform, CC; Octadecylsilyl, ODS; Real-Time PCR, RT-PCR; Nonalcoholic Fatty Liver Disease, NAFLD; Atorvastatin Calcium, ATC; Triglyceride, TG; Total Cholesterol, TC; Alanine Transaminase, ALT; Aspartate Transaminase, AST; Dulbecco’s Modified Eagle Medium, DMEM; Fetal Bovine Serum, FBS; Bovine Serum Albumin, BSA; Free Fatty Acids, FFA; Cell Counting Kit-8, CCK-8; Deuterated Chloroform, CDCl3; Methanlol-D4, MeOD; Dimethyl Sulfoxide, DMSO; Oak Ridge Thermal Ellipsoid Plot, ORTEP; Cyclohexane, CYH; Ethyl Acetate, EtOAc; Methyl Alcohol, MeOH; Dichloromethane, CHCl2; Trichloromethane, CHCl3; Methanol, MeOH; Buffalo Rat Liver, BRL.
References
- Friedman, S.L.; Neuschwander-Tetri, B.A.; Mary, R.; Sanyal, A.J.J.N.M. Mechanisms of NAFLD development and therapeutic strategies. Nat. Med. 2018, 24, 908–922. [Google Scholar] [CrossRef] [PubMed]
- Yan, T.; Yan, N.; Wang, P.; Xia, Y.; Hao, H.; Wang, G.; Gonzalez, F.J. Herbal drug discovery for the treatment of nonalcoholic fatty liver disease. Acta Pharm. Sin. B 2020, 10, 3–18. [Google Scholar] [CrossRef] [PubMed]
- Singh, S.; Osna, N.A.; Kharbanda, K.K. Treatment options for alcoholic and non-alcoholic fatty liver disease: A review. World J. Gastroenterol. 2017, 23, 6549–6570. [Google Scholar] [CrossRef] [PubMed]
- The Chinese Academy of Sciences; Flora Reipublicae Popularis Sinicae Editorial Board. Flora Reipublicae Popularis Sinicae; Science Press: Beijing, China, 1979; p. 365. [Google Scholar]
- Thawabteh, A.M.; Thawabteh, A.; Lelario, F.; Bufo, S.A.; Scrano, L. Classification, Toxicity and Bioactivity of Natural Diterpenoid Alkaloids. Molecules. 2021, 26, 4103. [Google Scholar] [CrossRef]
- Tang, Q.; Chen, S.; Rizvi, S.A.H.; Qu, J.; Wang, L.; Wang, S.; Ma, C.; Liu, L.; Kang, W. Two Alkaloids from Delphinium brunonianum Royle, Their Anti-inflammatory and Anti-oxidative Stress Activity via NF-κB Signaling Pathway. Front. Nutr. 2022, 20, 826957. [Google Scholar] [CrossRef] [PubMed]
- Asif, H.; Alamgeer; Ahmad, M.I.; Alotaibi, N.H.; Alharbi, K.S.; Bukhari, S.N.A.; Saleem, H.; Locatelli, M. Phytochemical analysis and reappraisal of diuretic activity of Delphinium brunonianum Royle and its mode of action in experimental rats. Pak. J. Pharm. Sci. 2020, 33, 1833–1838. [Google Scholar]
- Song, Z.; Gao, C.; Jiang, Q.; Xu, J.; Xiong, L.; Liu, K.; Sun, D.; Li, H.; Chen, L. Diterpenoid alkaloids from Delphinium forrestii var. viride and their anti-inflammation activity. Phytochemistry. 2021, 192, 112971. [Google Scholar] [CrossRef] [PubMed]
- Asif, H.; Alamgeer; Bukhari, I.A.; Vohra, F.; Afzal, S.; Khan, S.W.; Niazi, Z.R. Phytochemical analysis of crude extract of Delphinium brunonianum and its effect on hypertension and metabolic perturbations in fructose fed rats. Nat. Prod. Res. 2021, 35, 2982–2986. [Google Scholar] [CrossRef] [PubMed]
- Ulubelen, A.; Desai, H.K.; Teng, Q.; Mericli, A.H.; Meriçli, F.; Kolak, U.S.; Arfan, M.; Lee, C.K.; Pelletier, S.W. Delbruninol, a New Norditerpenoid Alkaloid from Delphinium brunonianum Royle. Heterocycles 1999, 8, 1897–1903. [Google Scholar]
- Wei, D.; Liang, S.W.; Wei, L.S.J.H. Three New C19-Diterpenoid Alkaloids, Delbrunine, Delbruline and Delbrusine from Delphinium brunonianum Royle. Heterocycles 1986, 24, 4. [Google Scholar]
- Zou, Y.S.; Dawa, Z.; Lin, C.Z.; Zhang, Q.Y.; Yao, Y.F.; Yuan, Y.; Zhu, C.C.; Wang, Z.Y. New amide alkaloids from Delphinium brunonianum. Fitoterapia 2019, 136, 104186. [Google Scholar] [CrossRef]
- Wada, K.; Chiba, R.; Kanazawa, R.; Matsuoka, K.; Suzuki, M.; Ikuta, M.; Goto, M.; Yamashita, H.; Lee, K.H. Six new norditerpenoid alkaloids from Delphinium elatum. Phytochem. Lett. 2015, 12, 79–83. [Google Scholar] [CrossRef]
- Gabbasov, T.M.; Tsyrlina, E.M.; Spirikhin, L.V.; Danilov, V.T.; Iunusov, M.S. Uraline, a new norditerpenoid alkaloid from aerial parts of Delphinium uralense nevski. Bioorg. Khim. 2005, 31, 425–429. [Google Scholar] [CrossRef] [PubMed]
- Lu, J.; Desai, H.K.; Ross, S.A.; Sayed, H.M.; Pelletier, S.W. New Norditerpenoid Alkaloids from the Leaves of Delphinium ajacis. J. Nat. Prod. 1993, 56, 2098–2103. [Google Scholar] [CrossRef]
- Morita, H.; Aisa, H.A.; Chen, L.; Hirasawa, Y.; Arai, H.J.C. A New Diterpenoid Alkaloid, Sharwuphinine A from Delphinium sharwurense. Heterocycles 2010, 41, 607–612. [Google Scholar] [CrossRef]
- Gu, D.Y.; Aisa, H.A.; Usmanova, S.K. Shawurensine, a new C19-diterpenoid alkaloid from Delphinium shawurense. Chem. Nat. Compd. 2007, 43, 298–301. [Google Scholar] [CrossRef]
- Ahn, J.; Lee, H.; Jung, C.H.; Ha, S.Y.; Seo, H.D.; Kim, Y.I.; Ha, T. 6-Gingerol Ameliorates Hepatic Steatosis via HNF4α/miR-467b-3p/GPAT1 Cascade. Cell. Mol. Gastroenterol. Hepatol. 2021, 12, 1201–1213. [Google Scholar] [CrossRef]
- Cerda, A.; Bortolin, R.H.; Manriquez, V.; Salazar, L.; Zambrano, T.; Fajardo, C.M.; Hirata, M.H.; Hirata, R.D.C. Effect of statins on lipid metabolism-related microRNA expression in HepG2 cells. Pharmacol. Rep. 2021, 73, 868–880. [Google Scholar] [CrossRef]
- Genvigir, F.D.; Rodrigues, A.C.; Cerda, A.; Arazi, S.S.; Willrich, M.A.; Oliveira, R.; Hirata, M.H.; Dorea, E.L.; Bernik, M.M.; Curi, R.; et al. Effects of lipid-lowering drugs on reverse cholesterol transport gene expressions in peripheral blood mononuclear and HepG2 cells. Pharmacogenomics 2010, 11, 1235–1246. [Google Scholar] [CrossRef] [PubMed]
- Zhang, Y.; Park, J.; Han, S.J.; Park, I.; Huu, T.N.; Kim, J.S.; Woo, H.A.; Lee, S.R. The critical role of redox regulation of PTEN and peroxiredoxin III in alcoholic fatty liver. Free Radic. Biol. Med. 2021, 162, 141–148. [Google Scholar] [CrossRef]
- Jang, J.; Jung, Y.; Chae, S.; Cho, S.H.; Yoon, M.; Yang, H.; Shin, S.S.; Yoon, Y. Gangjihwan, a polyherbal composition, inhibits fat accumulation through the modulation of lipogenic transcription factors SREBP1C, PPARγ and C/EBPα. J. Ethnopharmacol. 2018, 210, 10–22. [Google Scholar] [CrossRef] [PubMed]
- Ju, U.I.; Jeong, D.W.; Seo, J.; Park, J.B.; Park, J.W.; Suh, K.S.; Kim, J.B.; Chun, Y.S. Neddylation of sterol regulatory element-binding protein 1c is a potential therapeutic target for nonalcoholic fatty liver treatment. Cell Death Dis. 2020, 11, 283. [Google Scholar] [CrossRef] [PubMed] [Green Version]
- Zhang, X.; Zhang, Y.; Gao, W.; Guo, Z.; Wang, K.; Liu, S.; Duan, Z.; Chen, Y. Naringin improves lipid metabolism in a tissue-engineered liver model of NAFLD and the underlying mechanisms. Life Sci. 2021, 277, 119487. [Google Scholar] [CrossRef]
- Hu, J.; Hong, W.; Yao, K.N.; Zhu, X.H.; Chen, Z.Y.; Ye, L. Ursodeoxycholic acid ameliorates hepatic lipid metabolism in LO2 cells by regulating the AKT/mTOR/SREBP-1 signaling pathway. World J. Gastroenterol. 2019, 25, 1492–1501. [Google Scholar] [CrossRef]
- Chen, X.; Tan, Q.Q.; Tan, X.R.; Li, S.J.; Zhang, X.X. Circ_0057558 promotes nonalcoholic fatty liver disease by regulating ROCK1/AMPK signaling through targeting miR-206. Cell Death Dis. 2021, 12, 809. [Google Scholar] [CrossRef] [PubMed]
- An, J.P.; Dang, L.H.; Ha, T.K.Q.; Pham, H.T.T.; Lee, B.W.; Lee, C.H.; Oh, W.K. Flavone glycosides from Sicyos angulatus and their inhibitory effects on hepatic lipid accumulation. Phytochemistry 2019, 157, 53–63. [Google Scholar] [CrossRef] [PubMed]
- Ibrahim, M.A.; Na, M.; Oh, J.; Schinazi, R.F.; McBrayer, T.R.; Whitaker, T.; Doerksen, R.J.; Newman, D.J.; Zachos, L.G.; Hamann, M.T. Significance of endangered and threatened plant natural products in the control of human disease. Proc. Natl. Acad. Sci. USA 2013, 110, 16832–16837. [Google Scholar] [CrossRef] [Green Version]
- Zhang, S.; Zheng, L.; Dong, D.; Xu, L.; Yin, L.; Qi, Y.; Han, X.; Lin, Y.; Liu, K.; Peng, J. Effects of flavonoids from Rosa laevigata Michx fruit against high-fat diet-induced non-alcoholic fatty liver disease in rats. Food Chem. 2013, 141, 2108–2116. [Google Scholar] [CrossRef] [PubMed]
Publisher’s Note: MDPI stays neutral with regard to jurisdictional claims in published maps and institutional affiliations. |
© 2022 by the authors. Licensee MDPI, Basel, Switzerland. This article is an open access article distributed under the terms and conditions of the Creative Commons Attribution (CC BY) license (https://creativecommons.org/licenses/by/4.0/).