
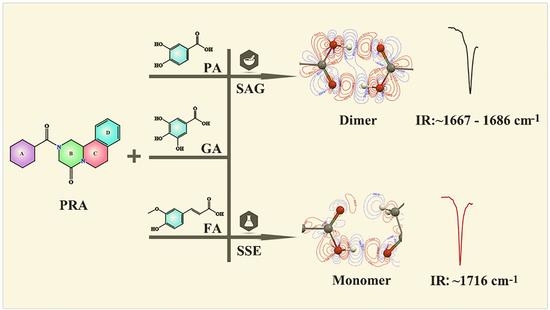
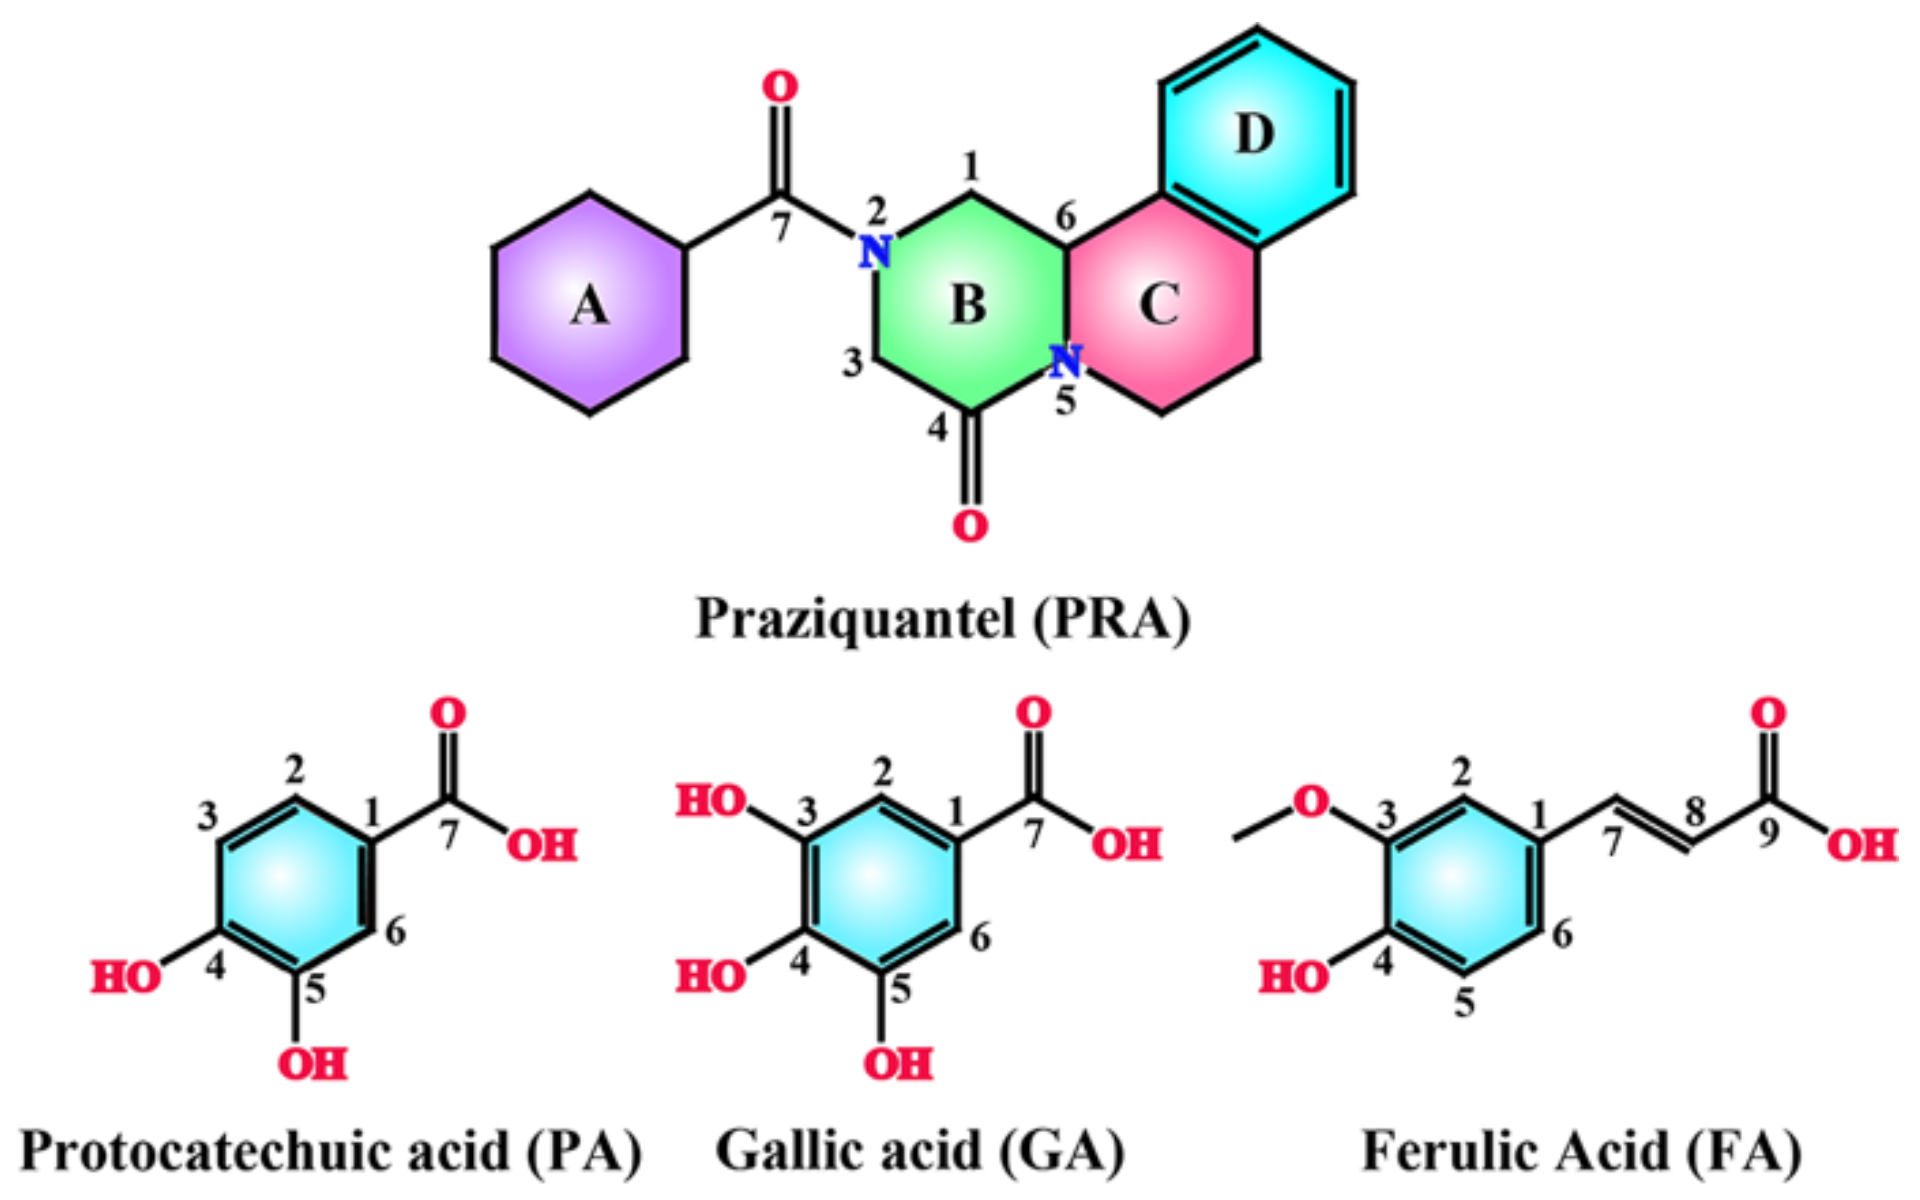
Cocrystals of Praziquantel with Phenolic Acids: Discovery, Characterization, and Evaluation

 ,
,  ,
, 

 ,
, 
Abstract
:
1. Introduction
2. Results and Discussion
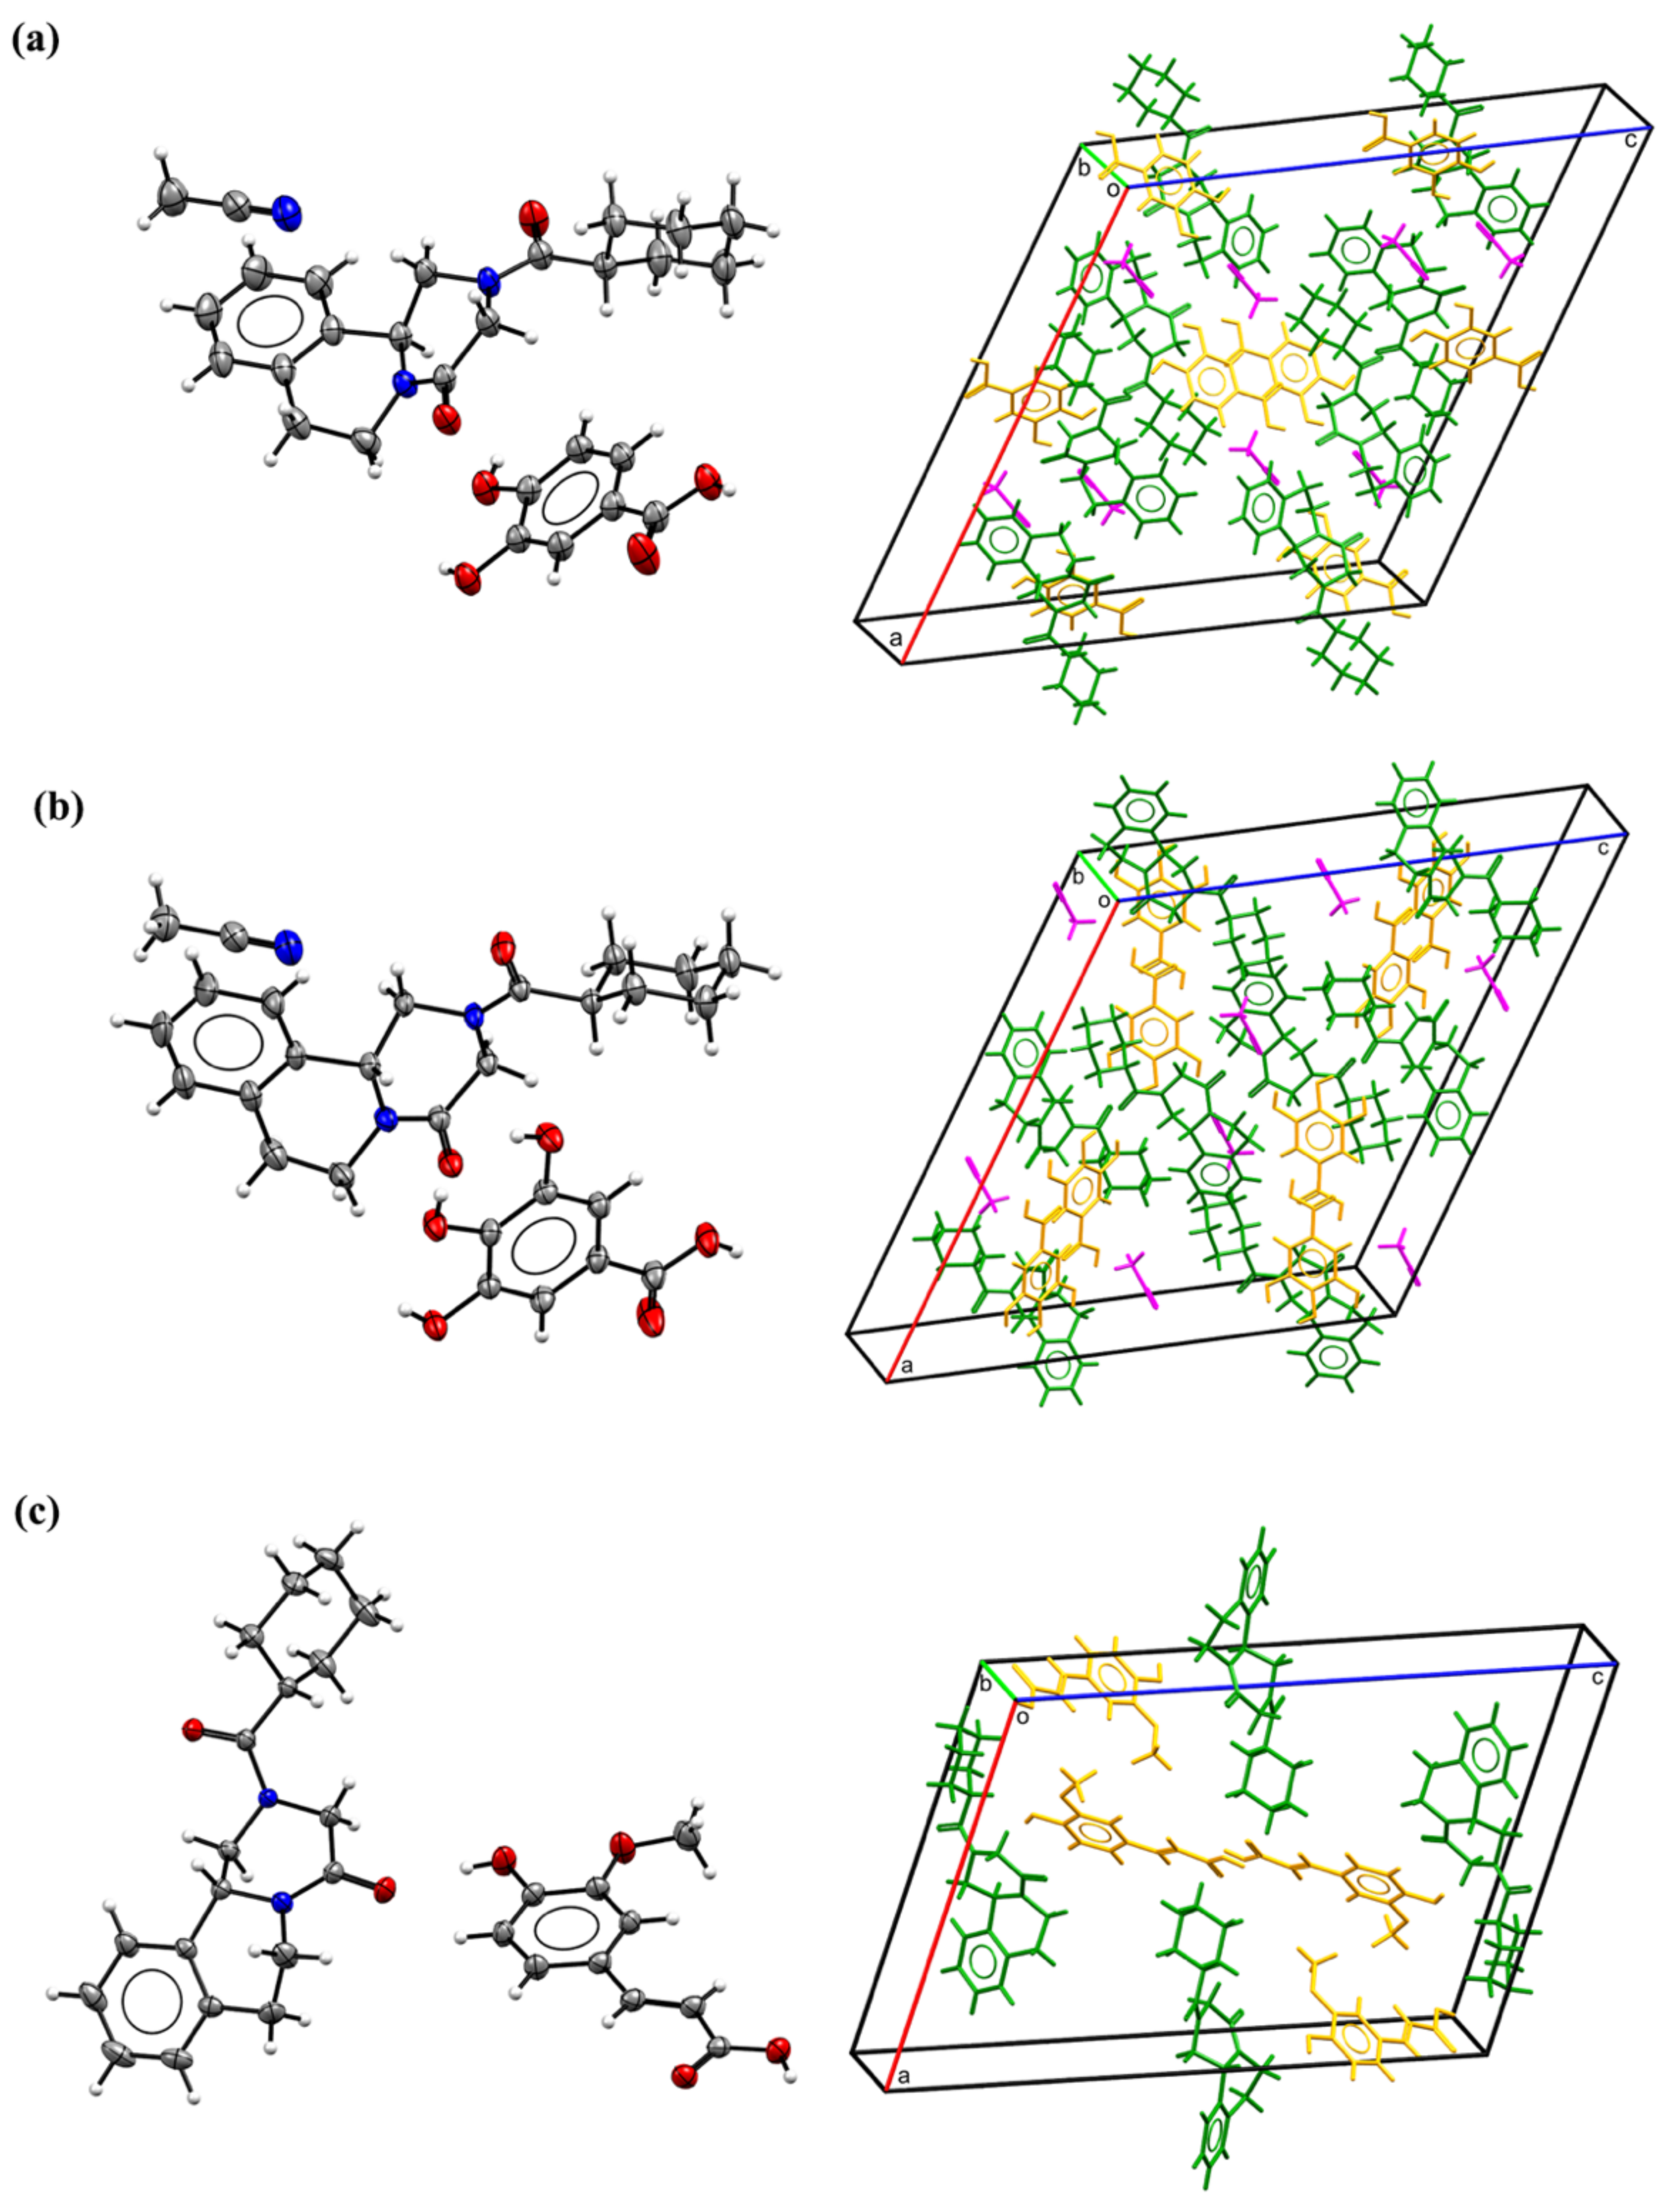
2.1. SXRD Analysis
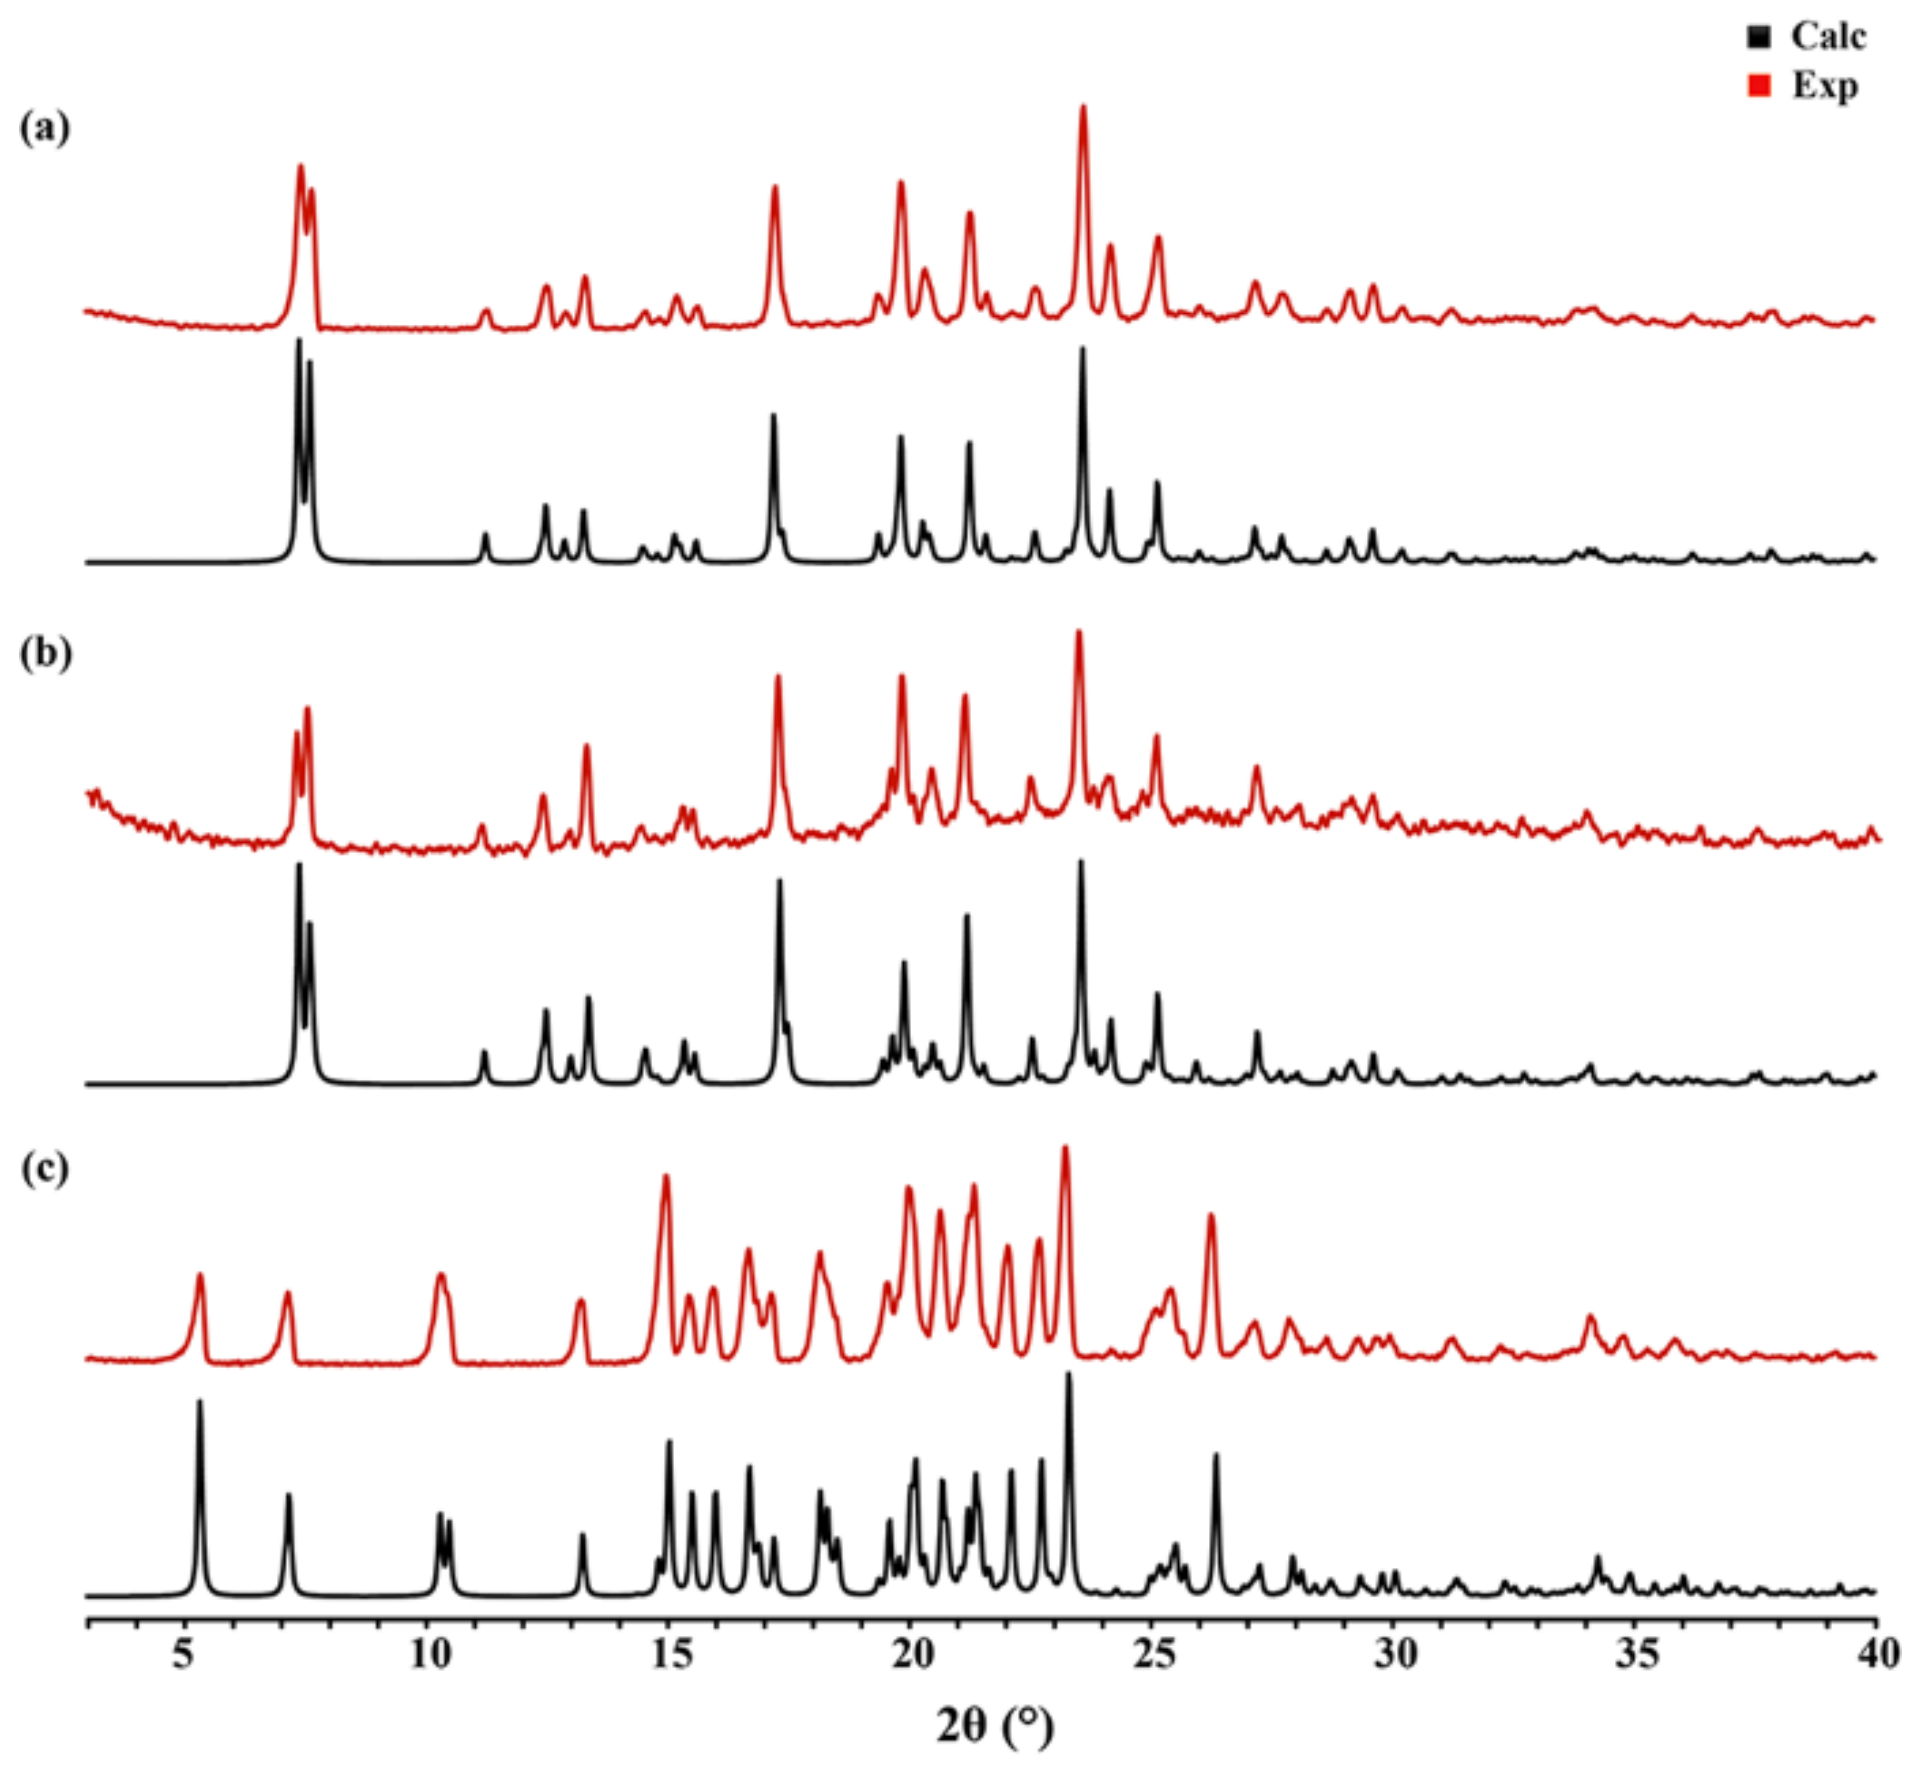
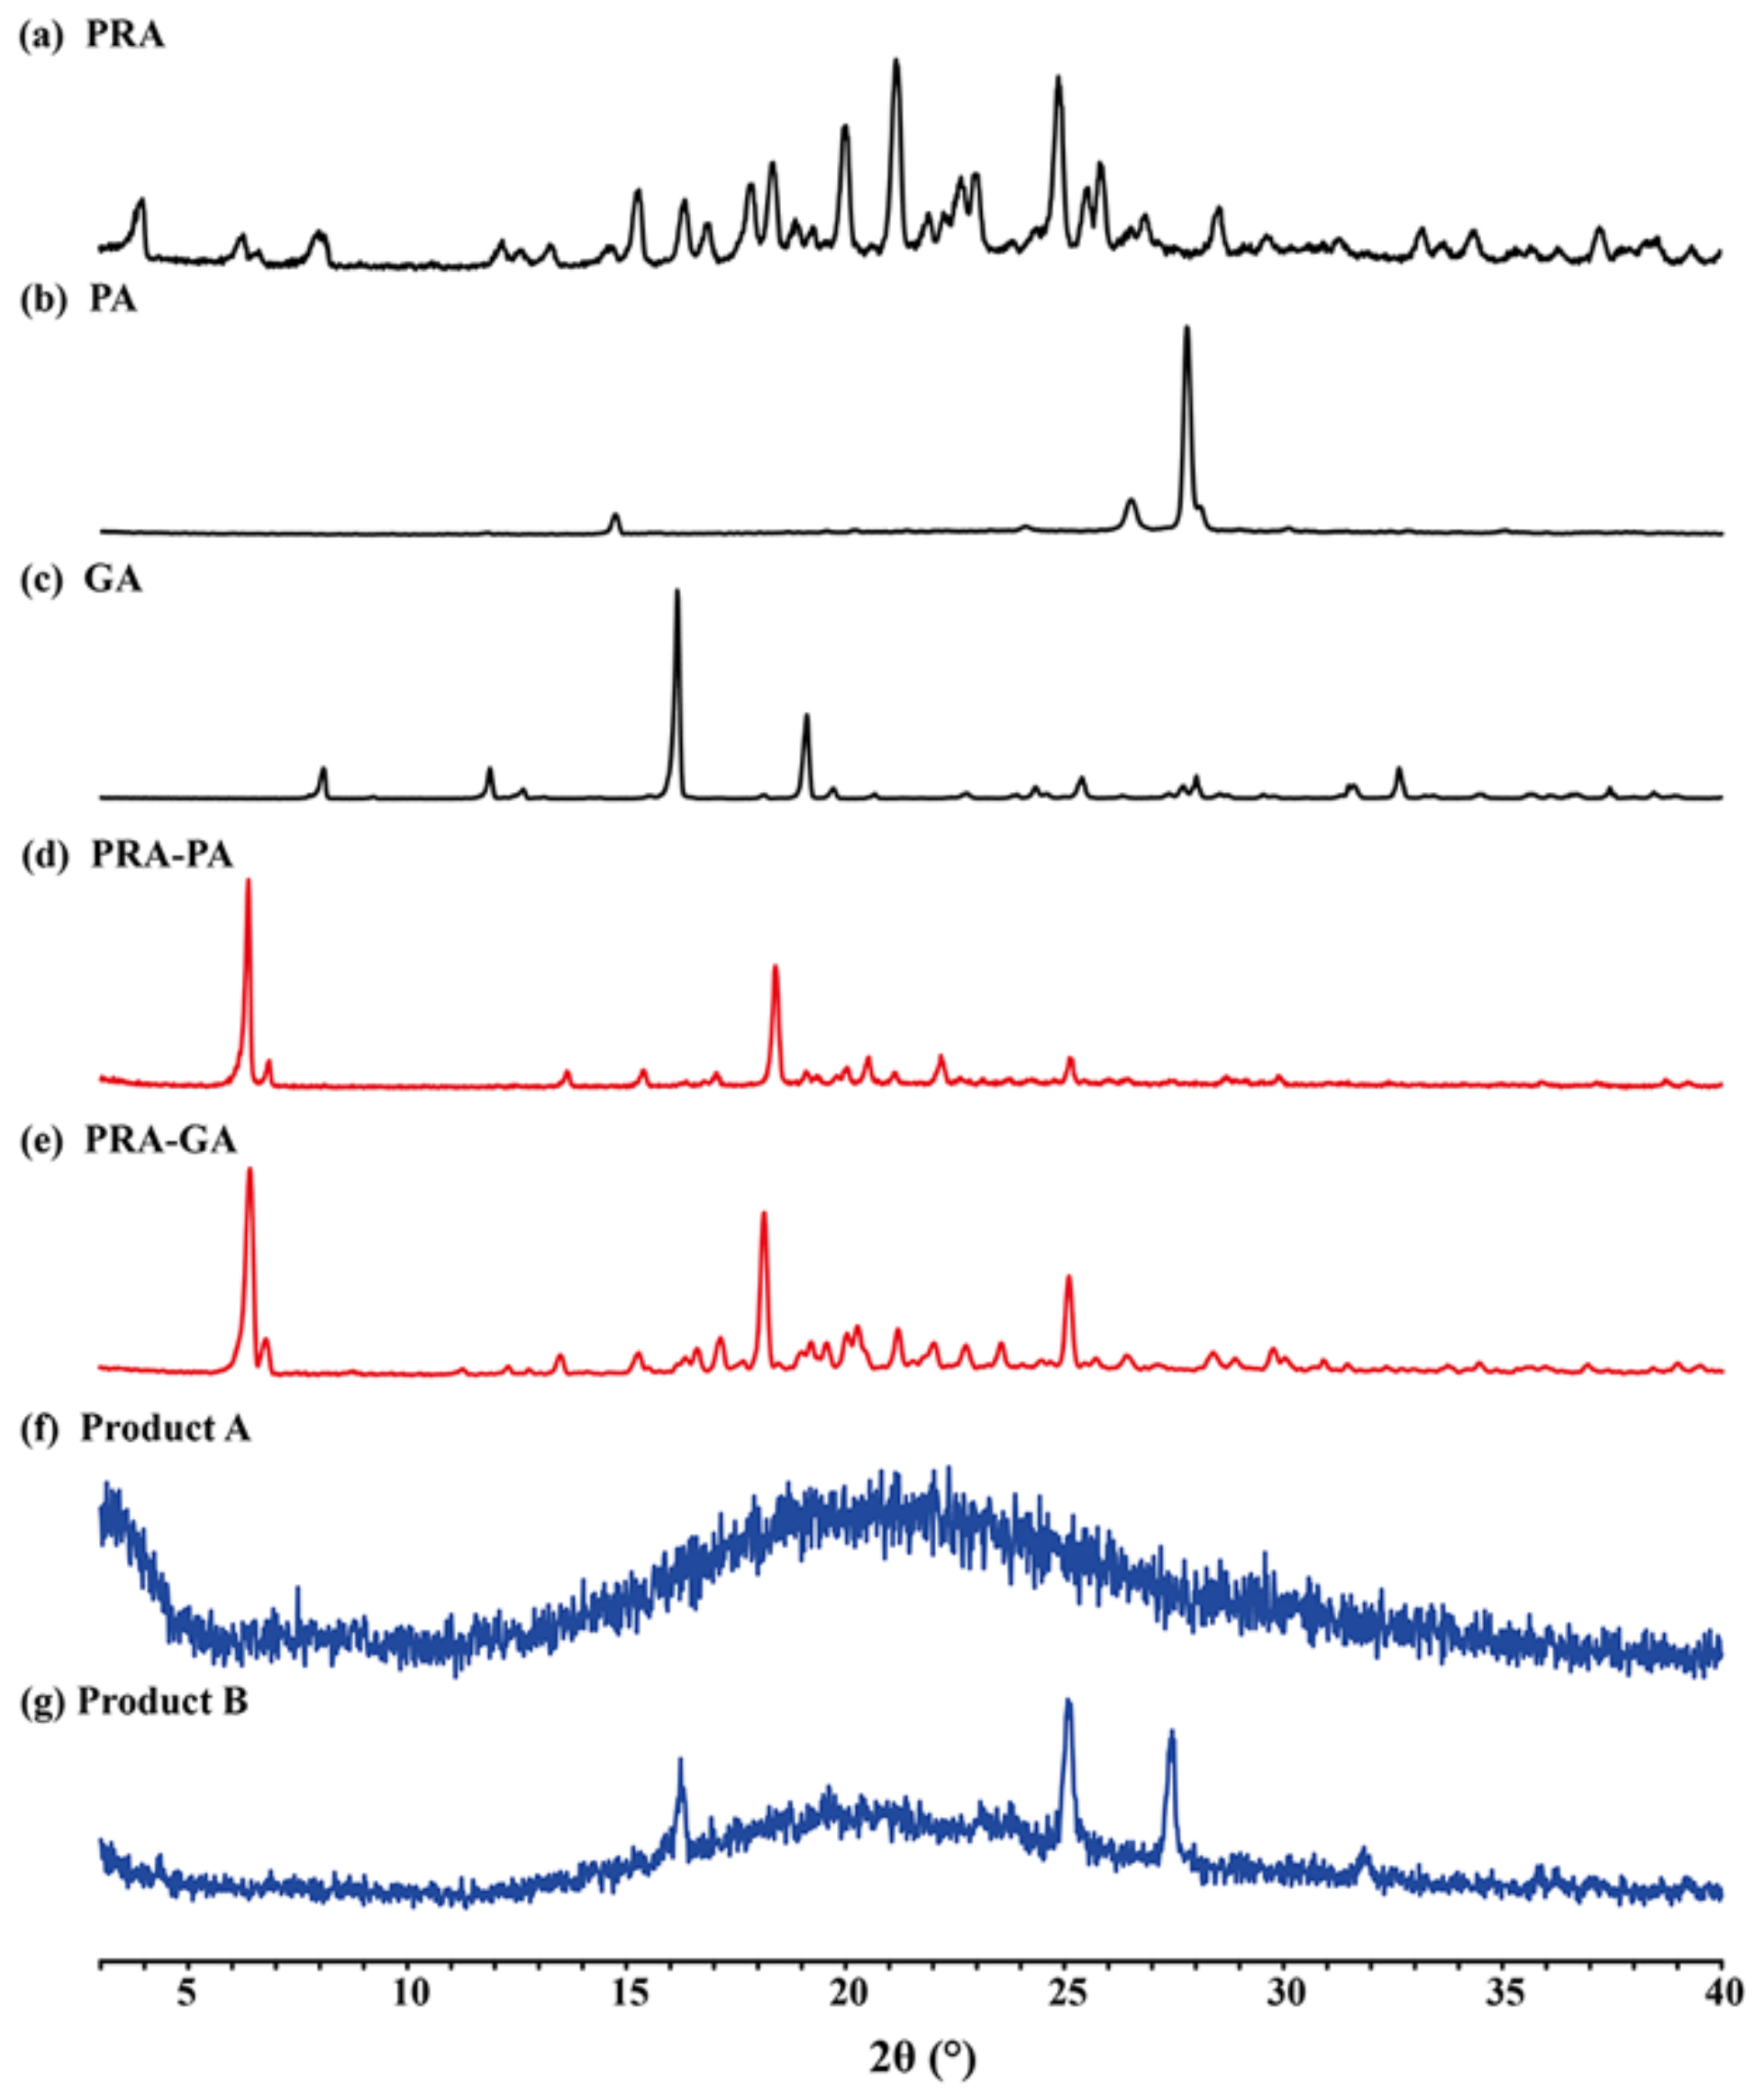
2.2. PXRD Analysis
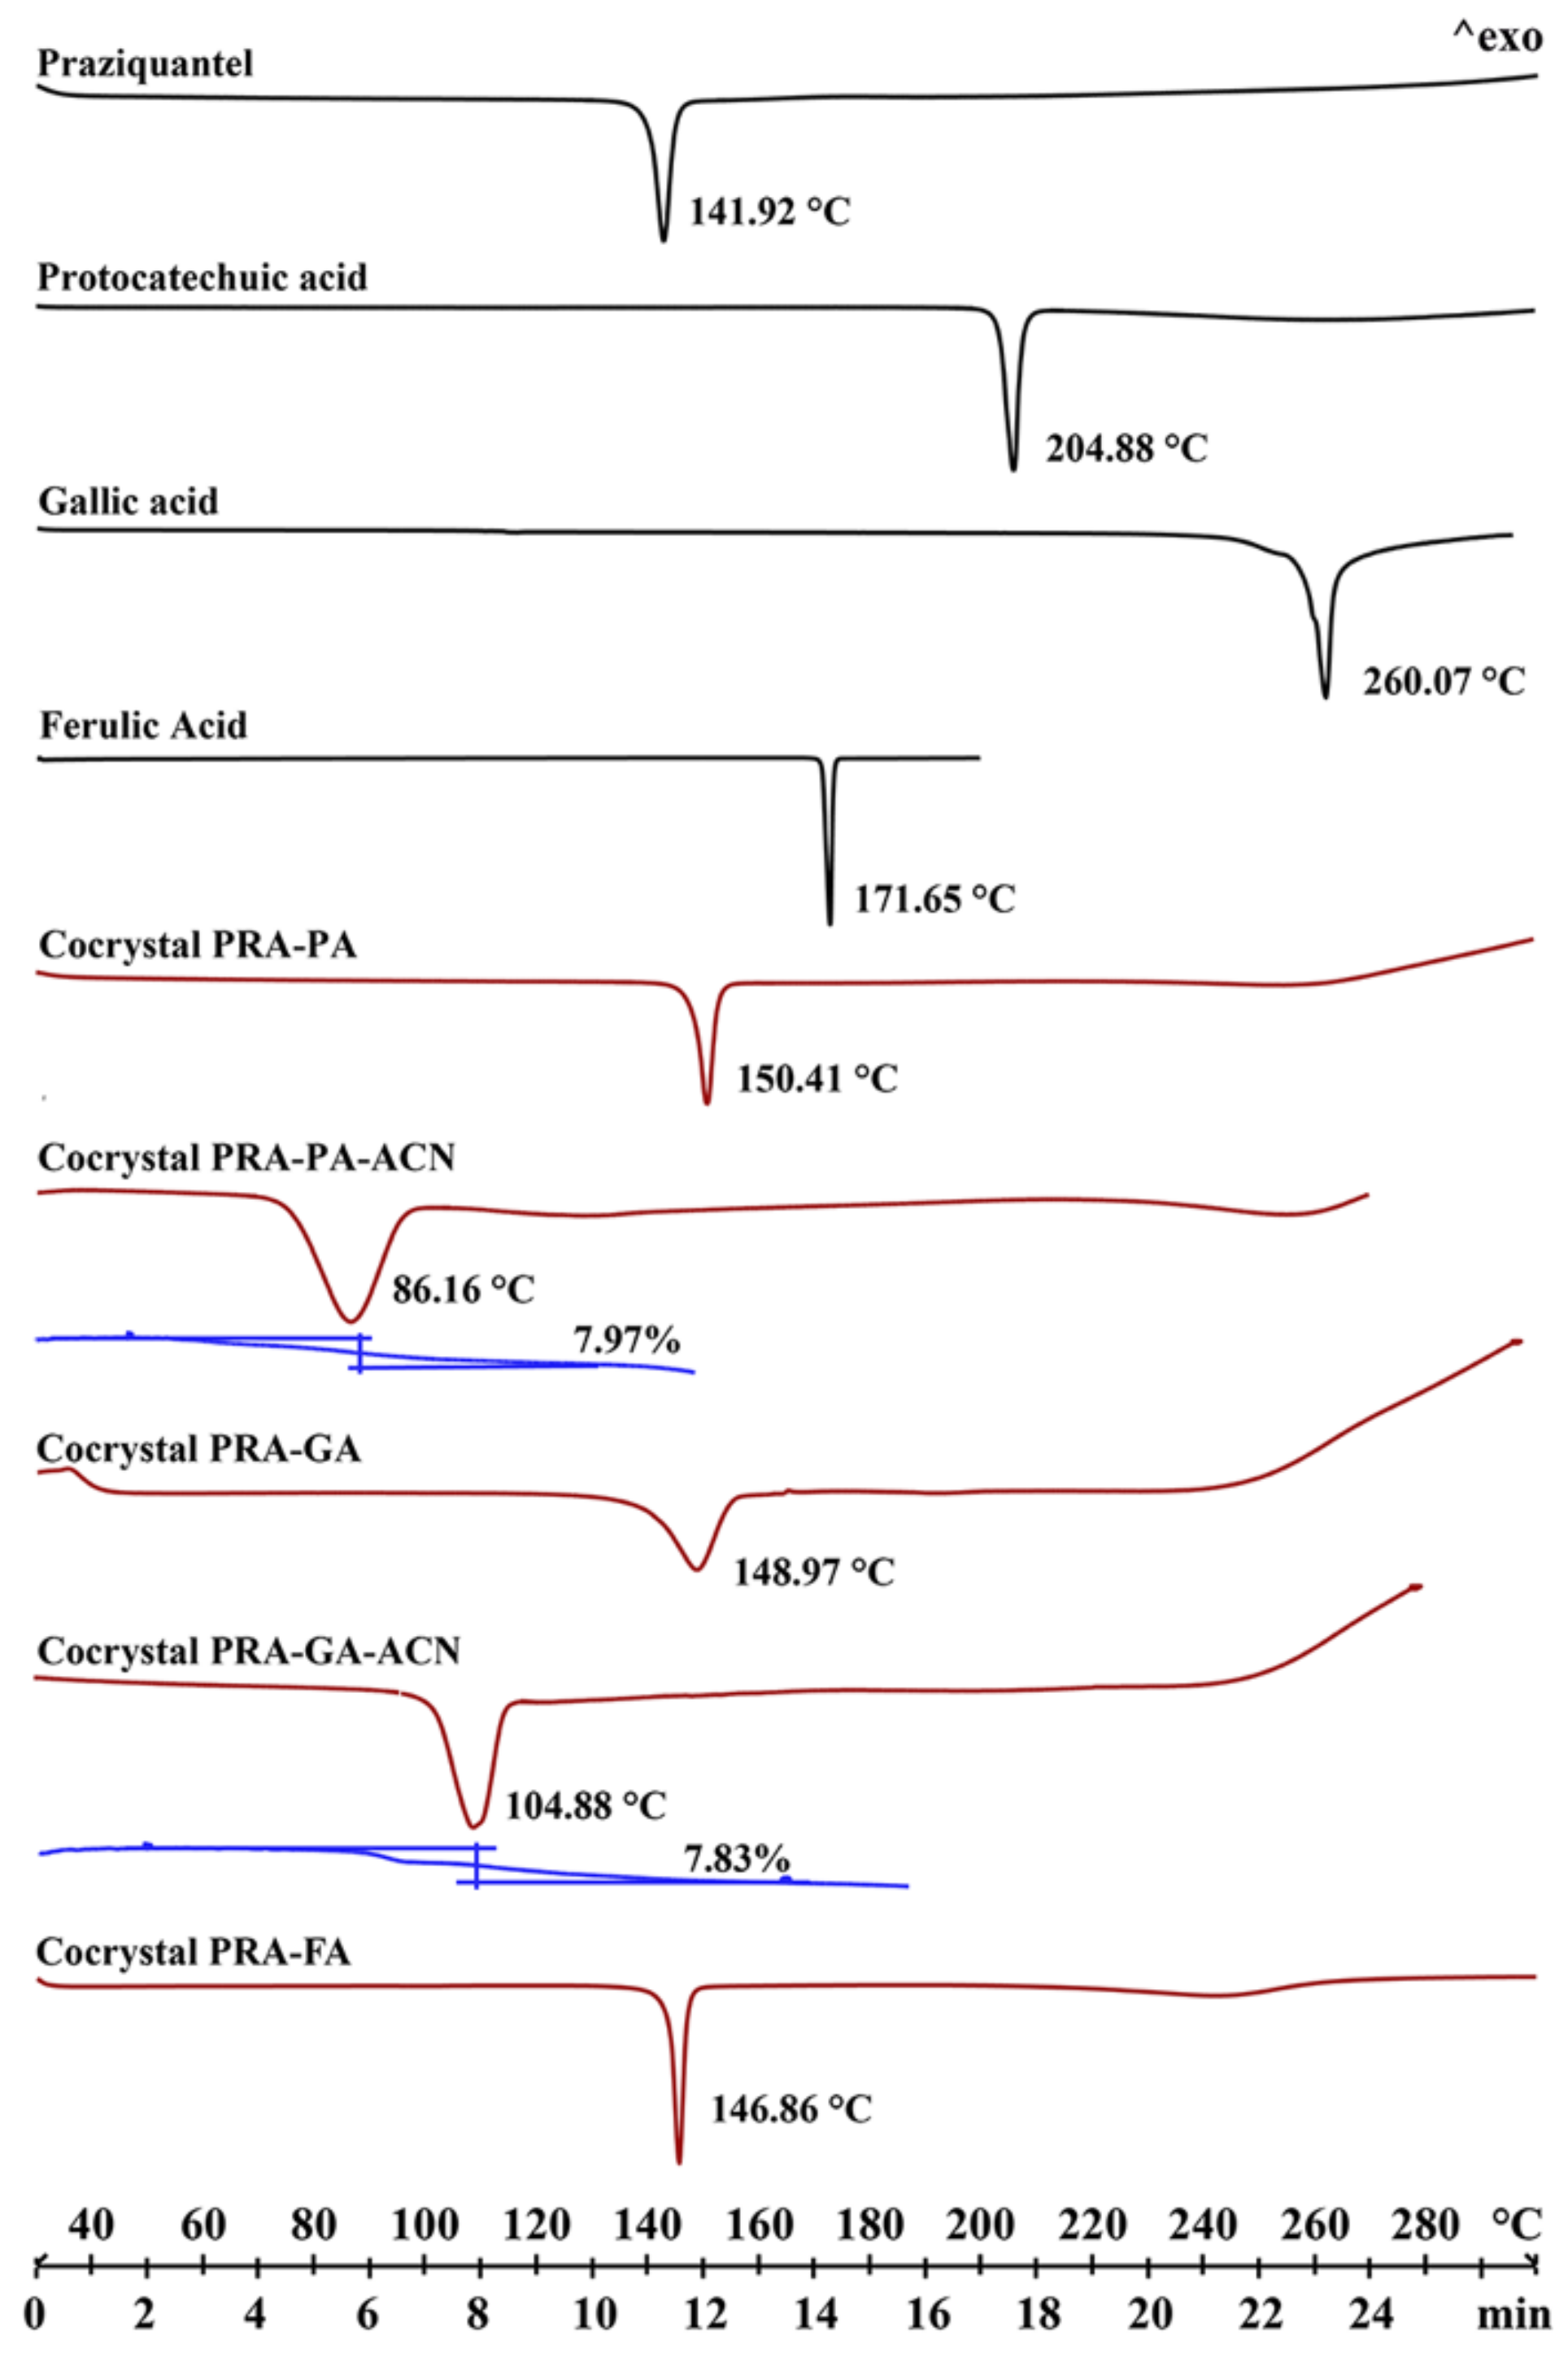
2.3. Thermal Analysis
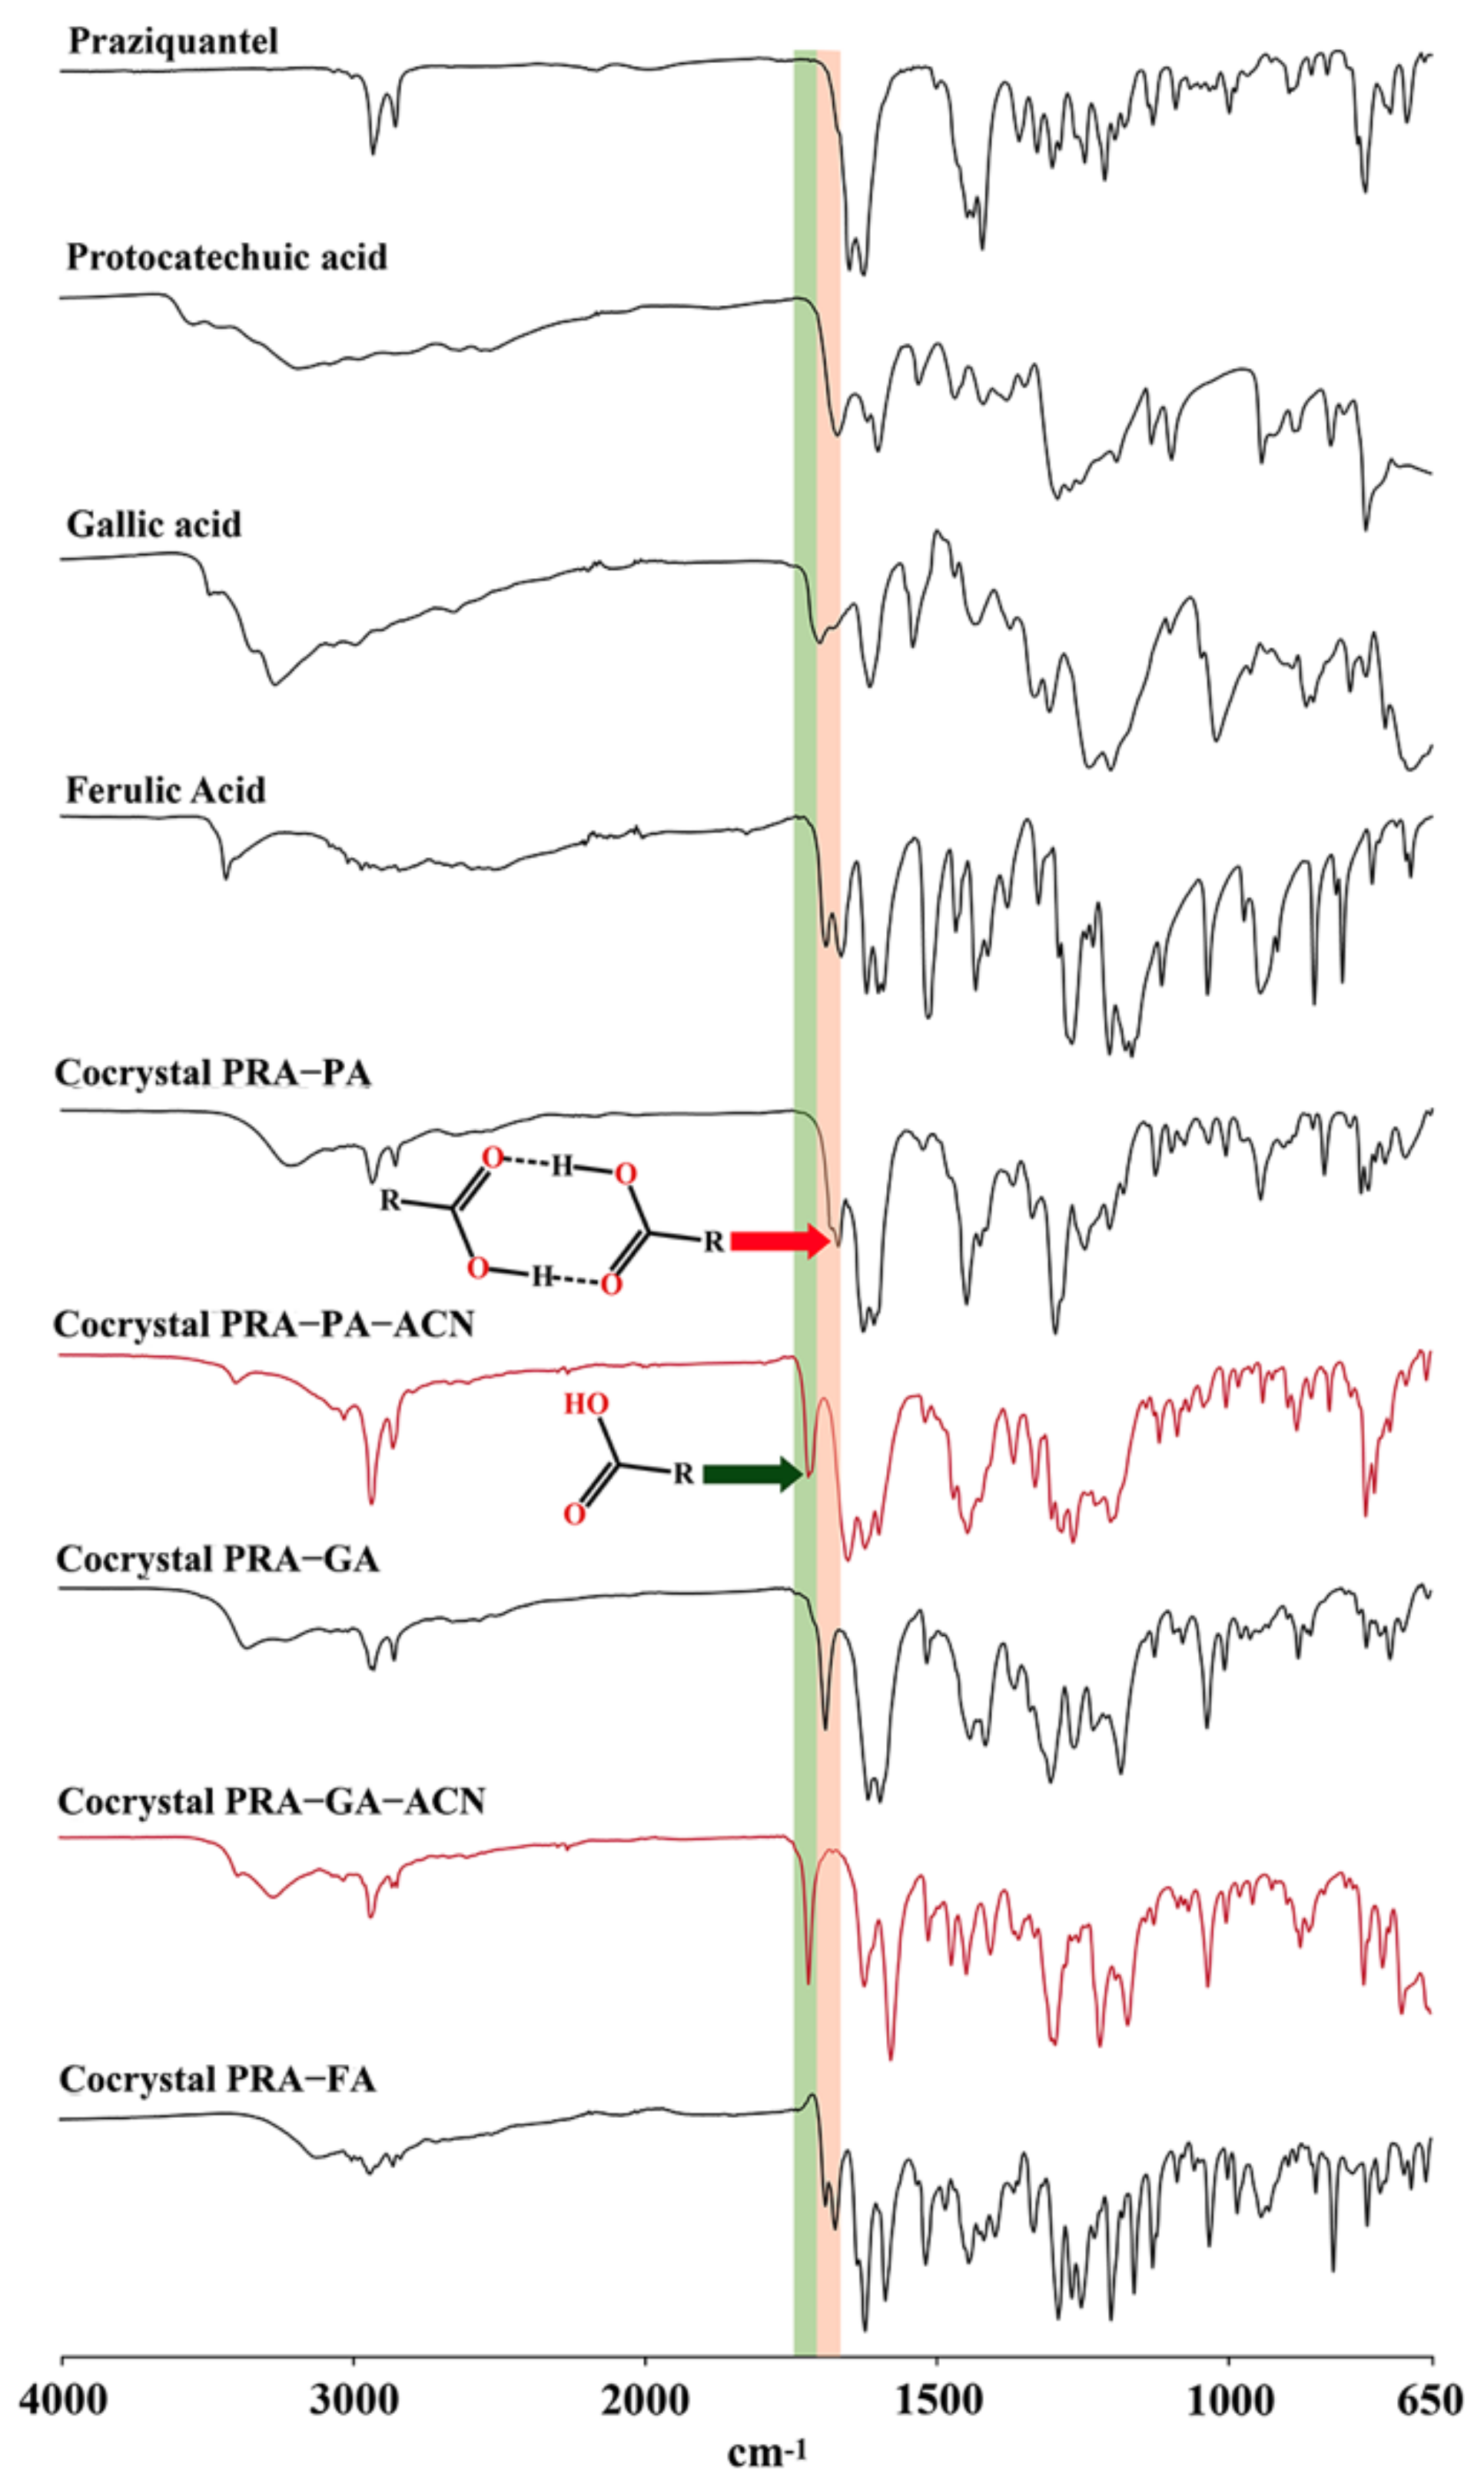
2.4. IR Analysis
2.5. Theoretical Computation
2.5.1. Interaction Energy
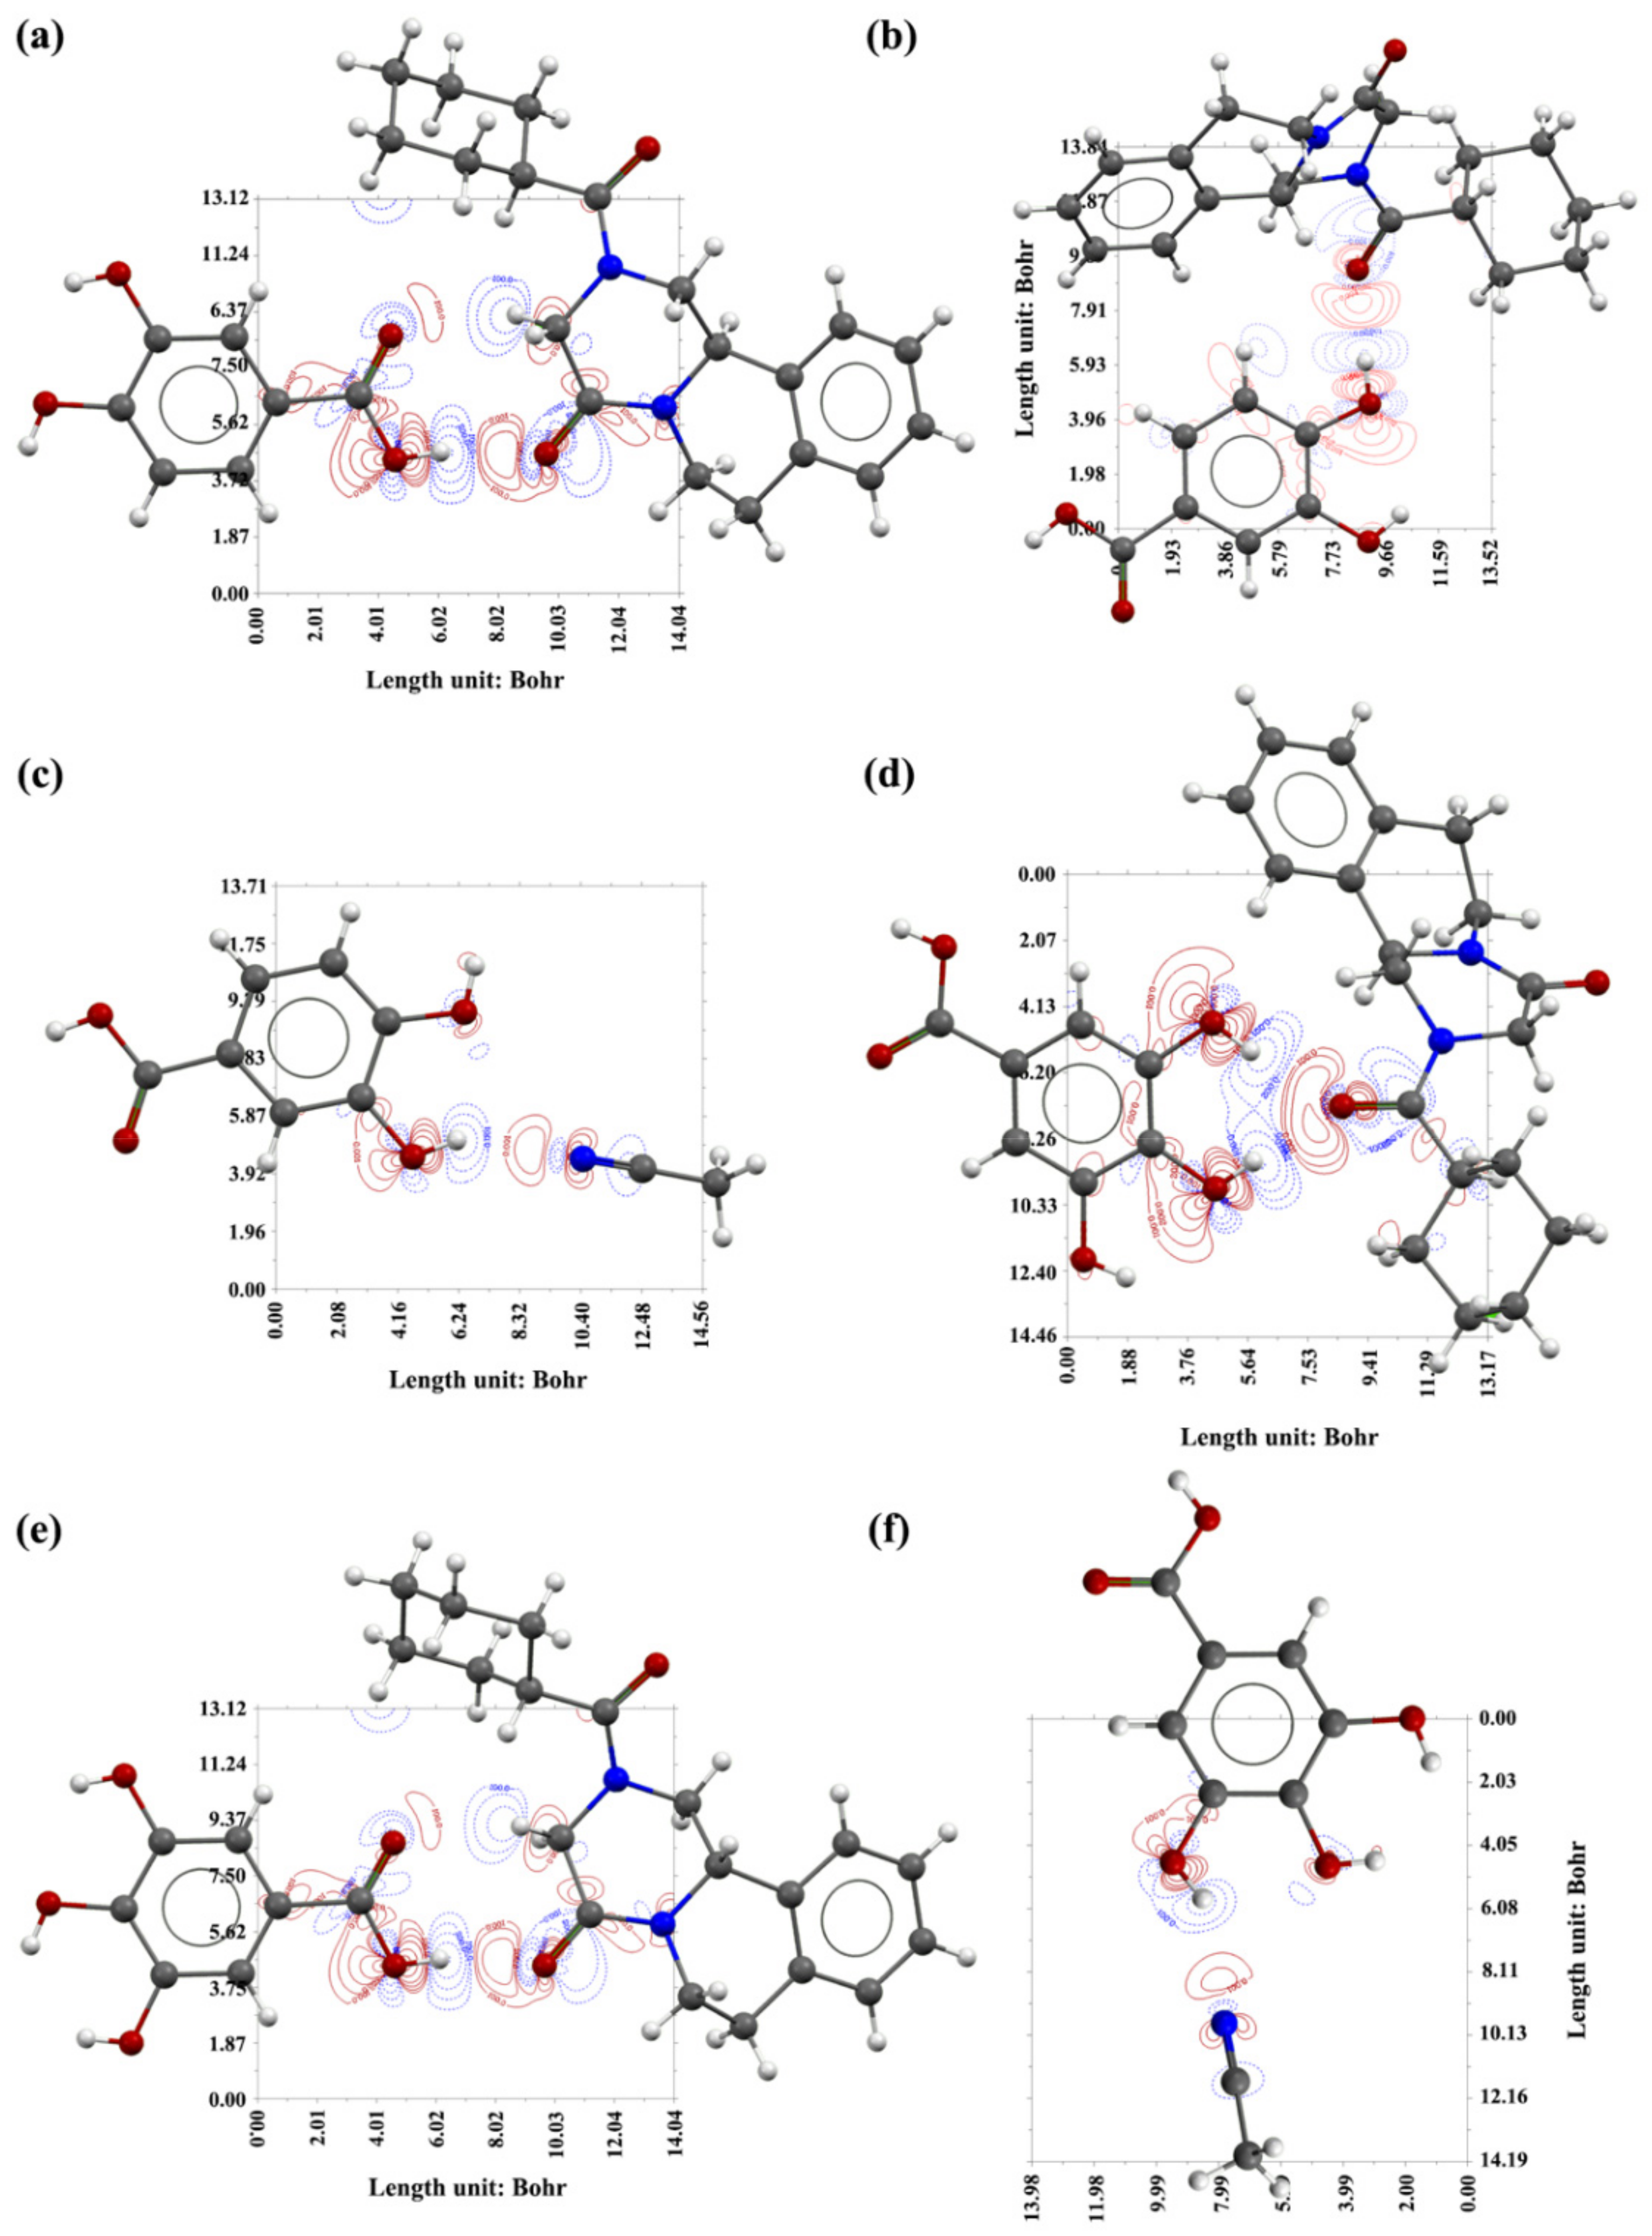
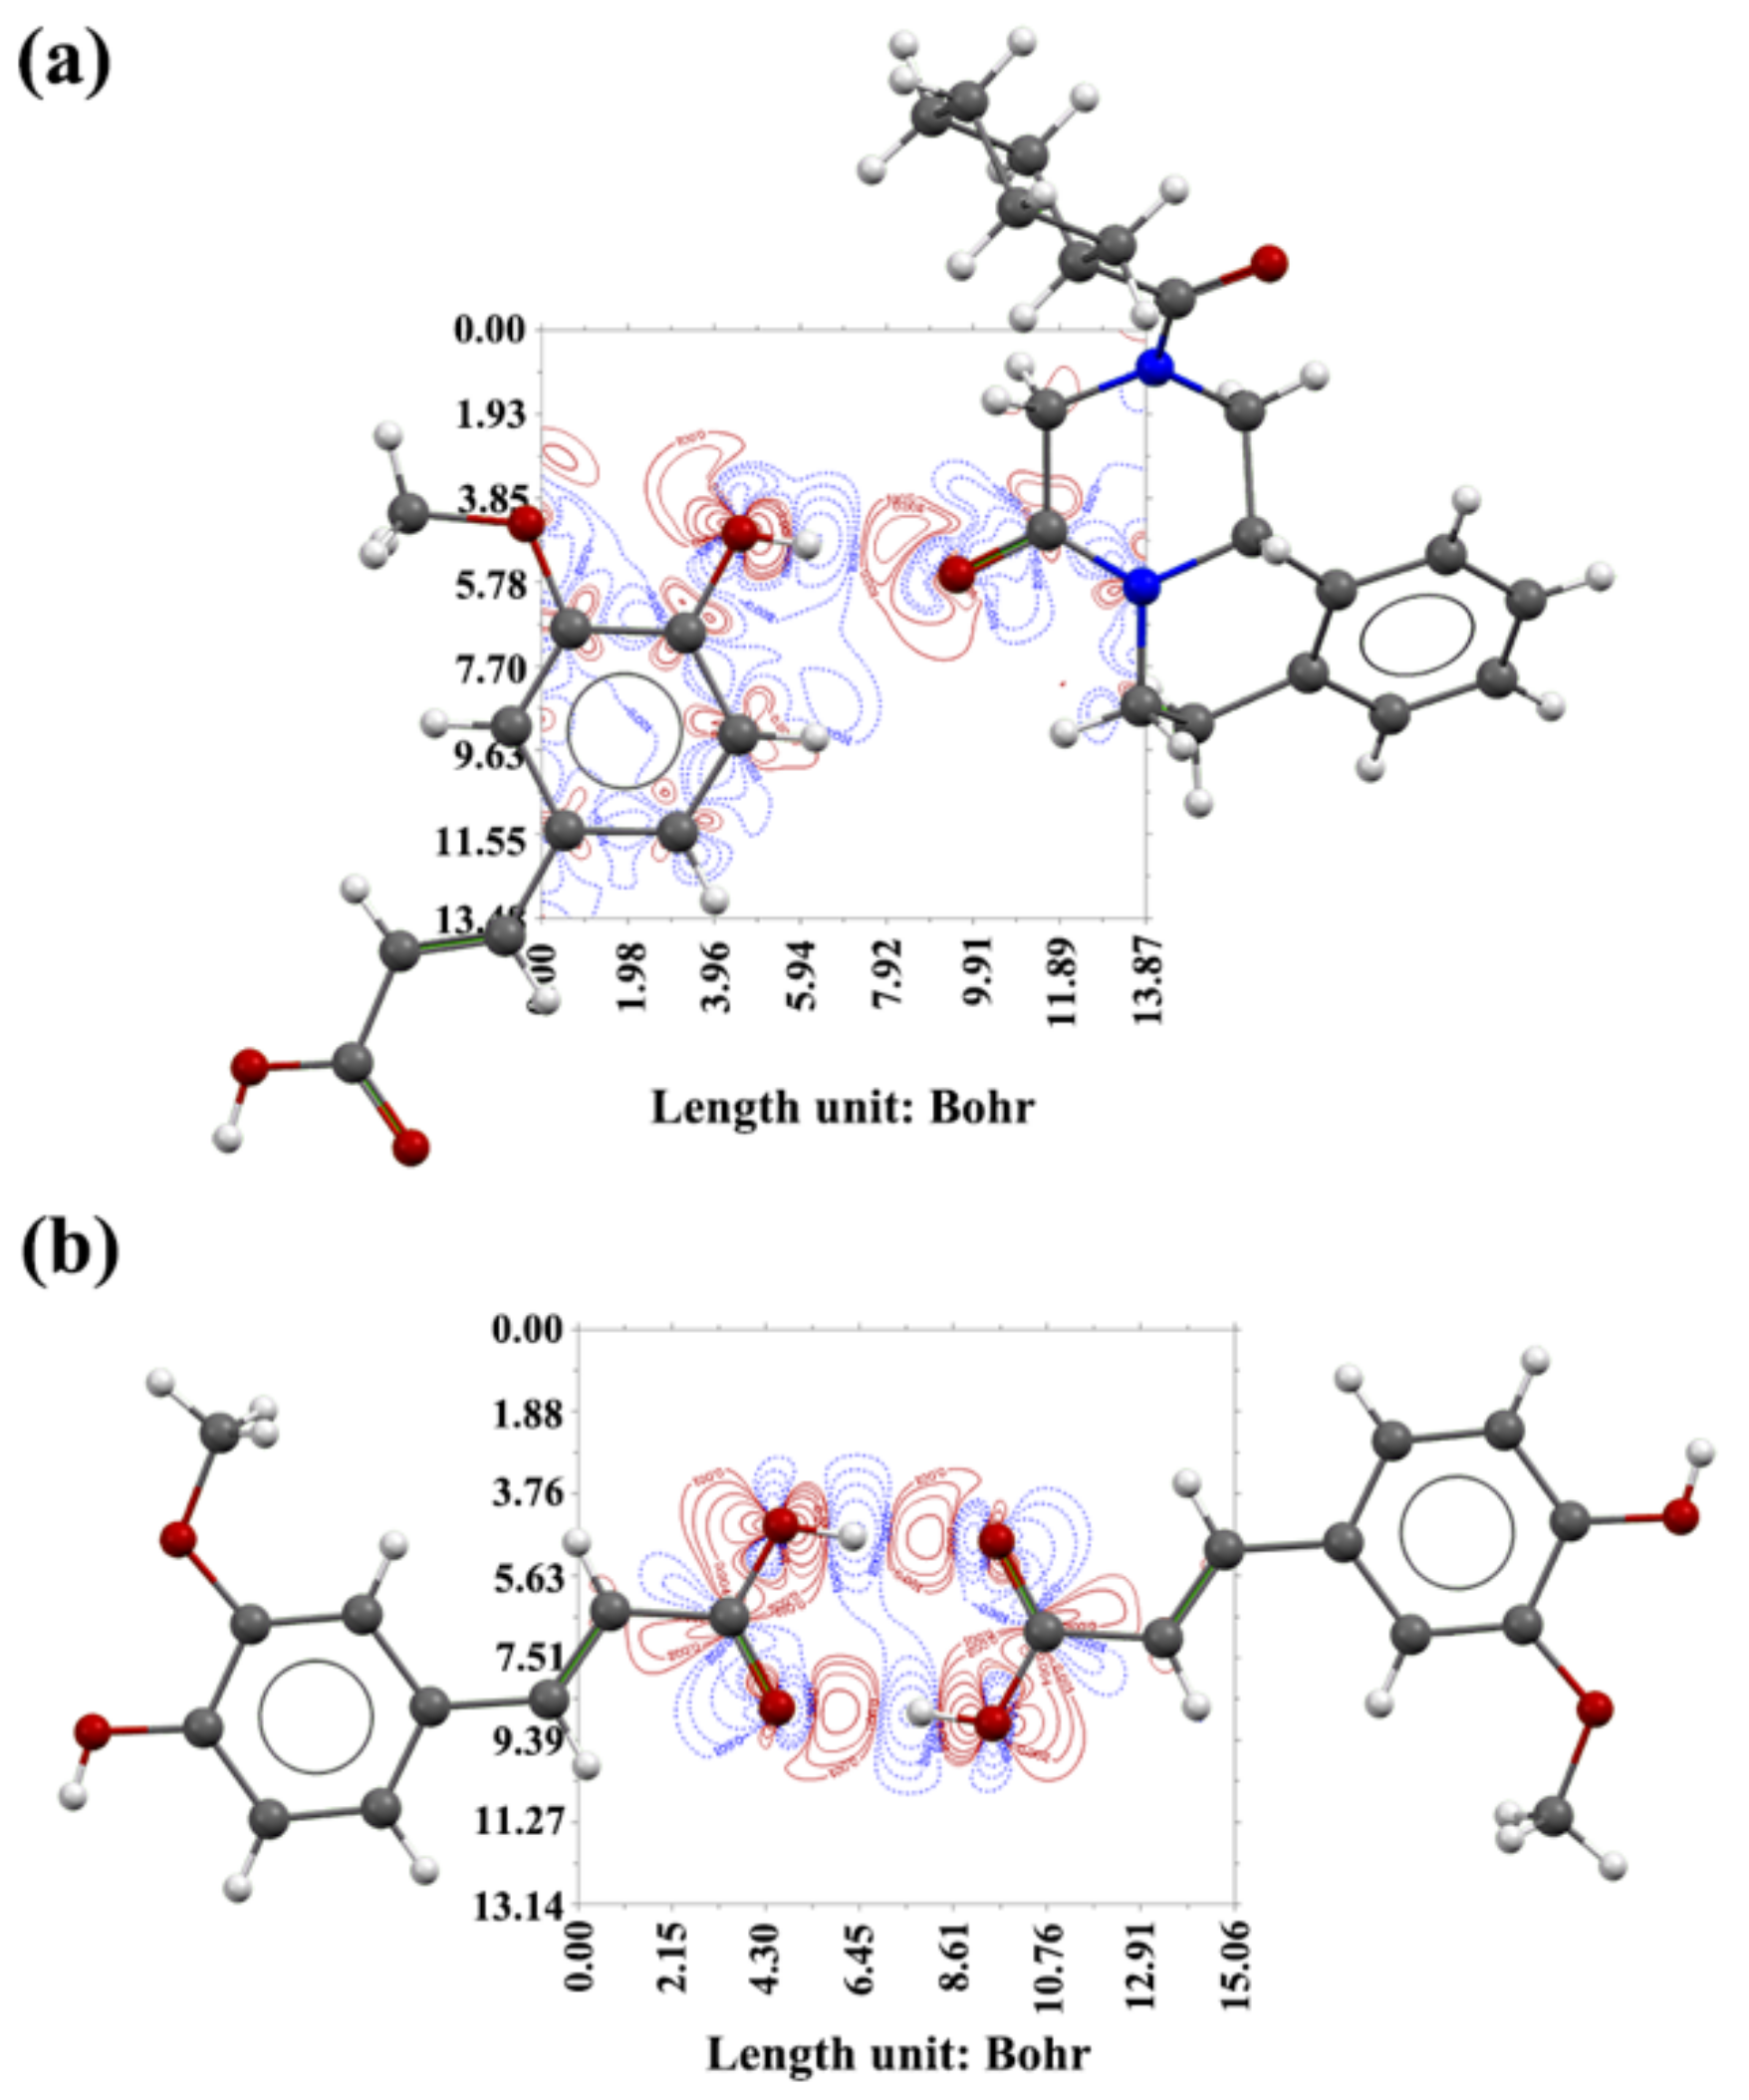
2.5.2. Contour Maps of the Electron Density Difference
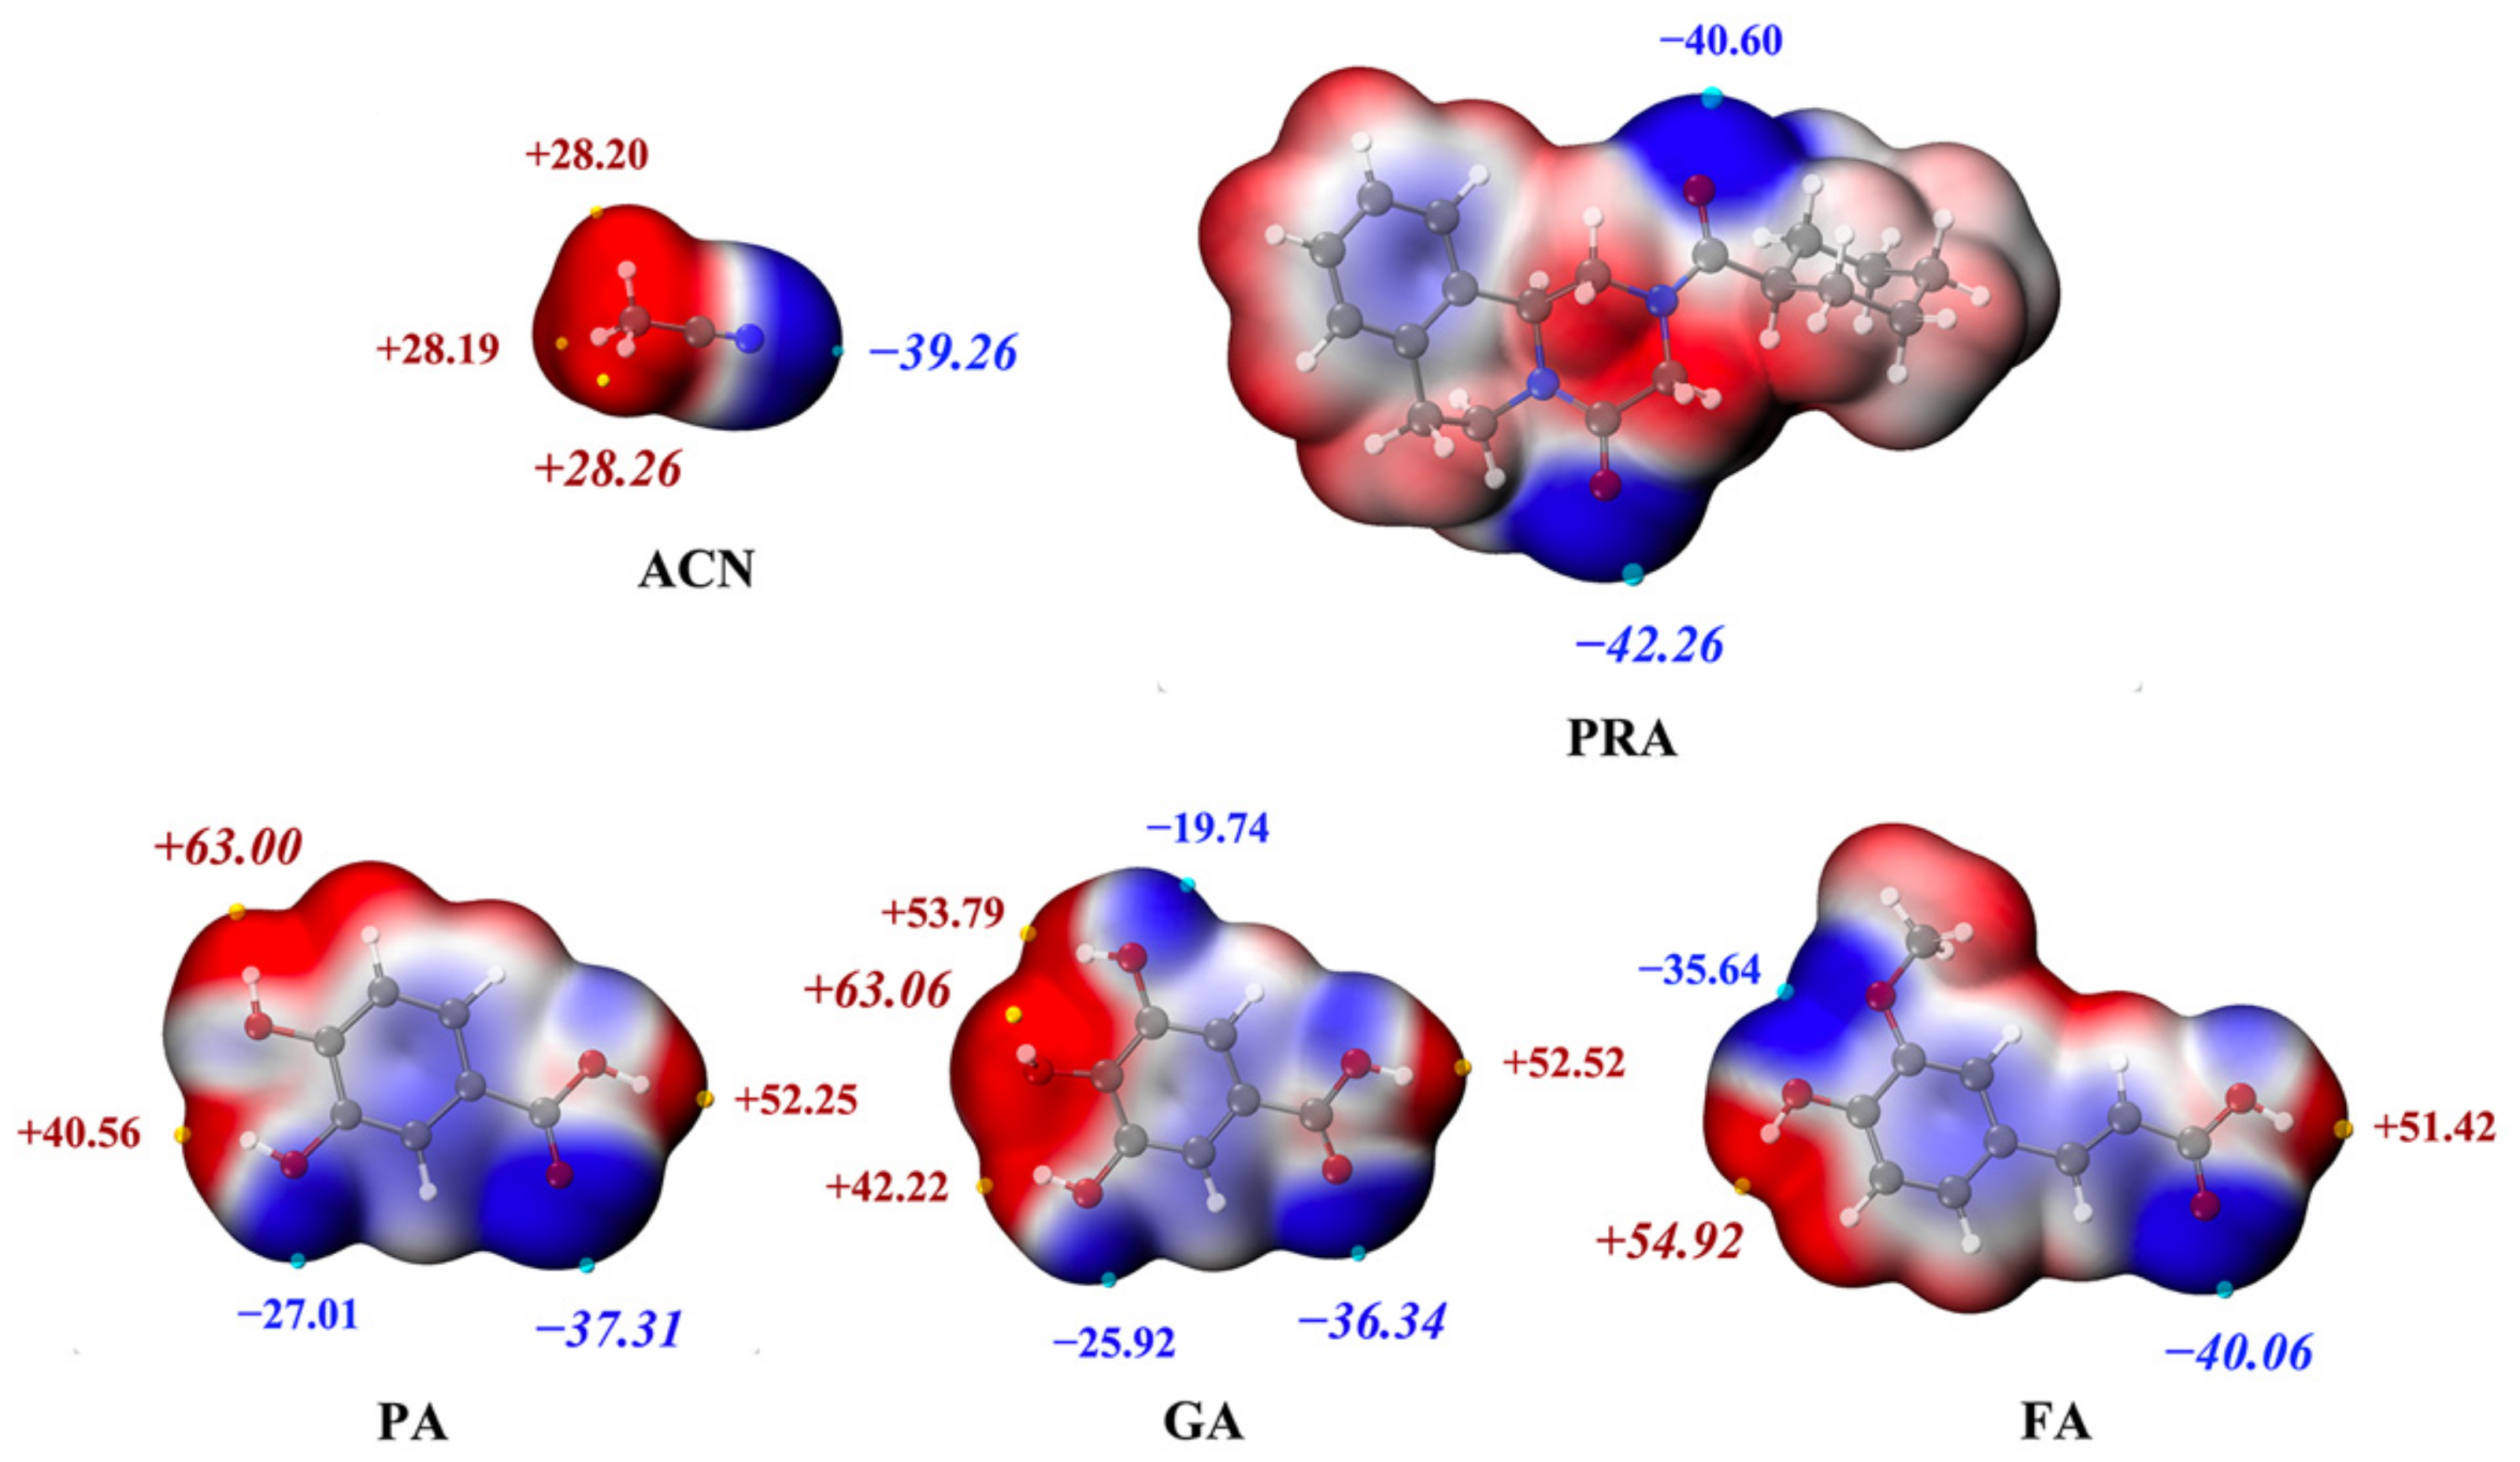
2.5.3. MEPS
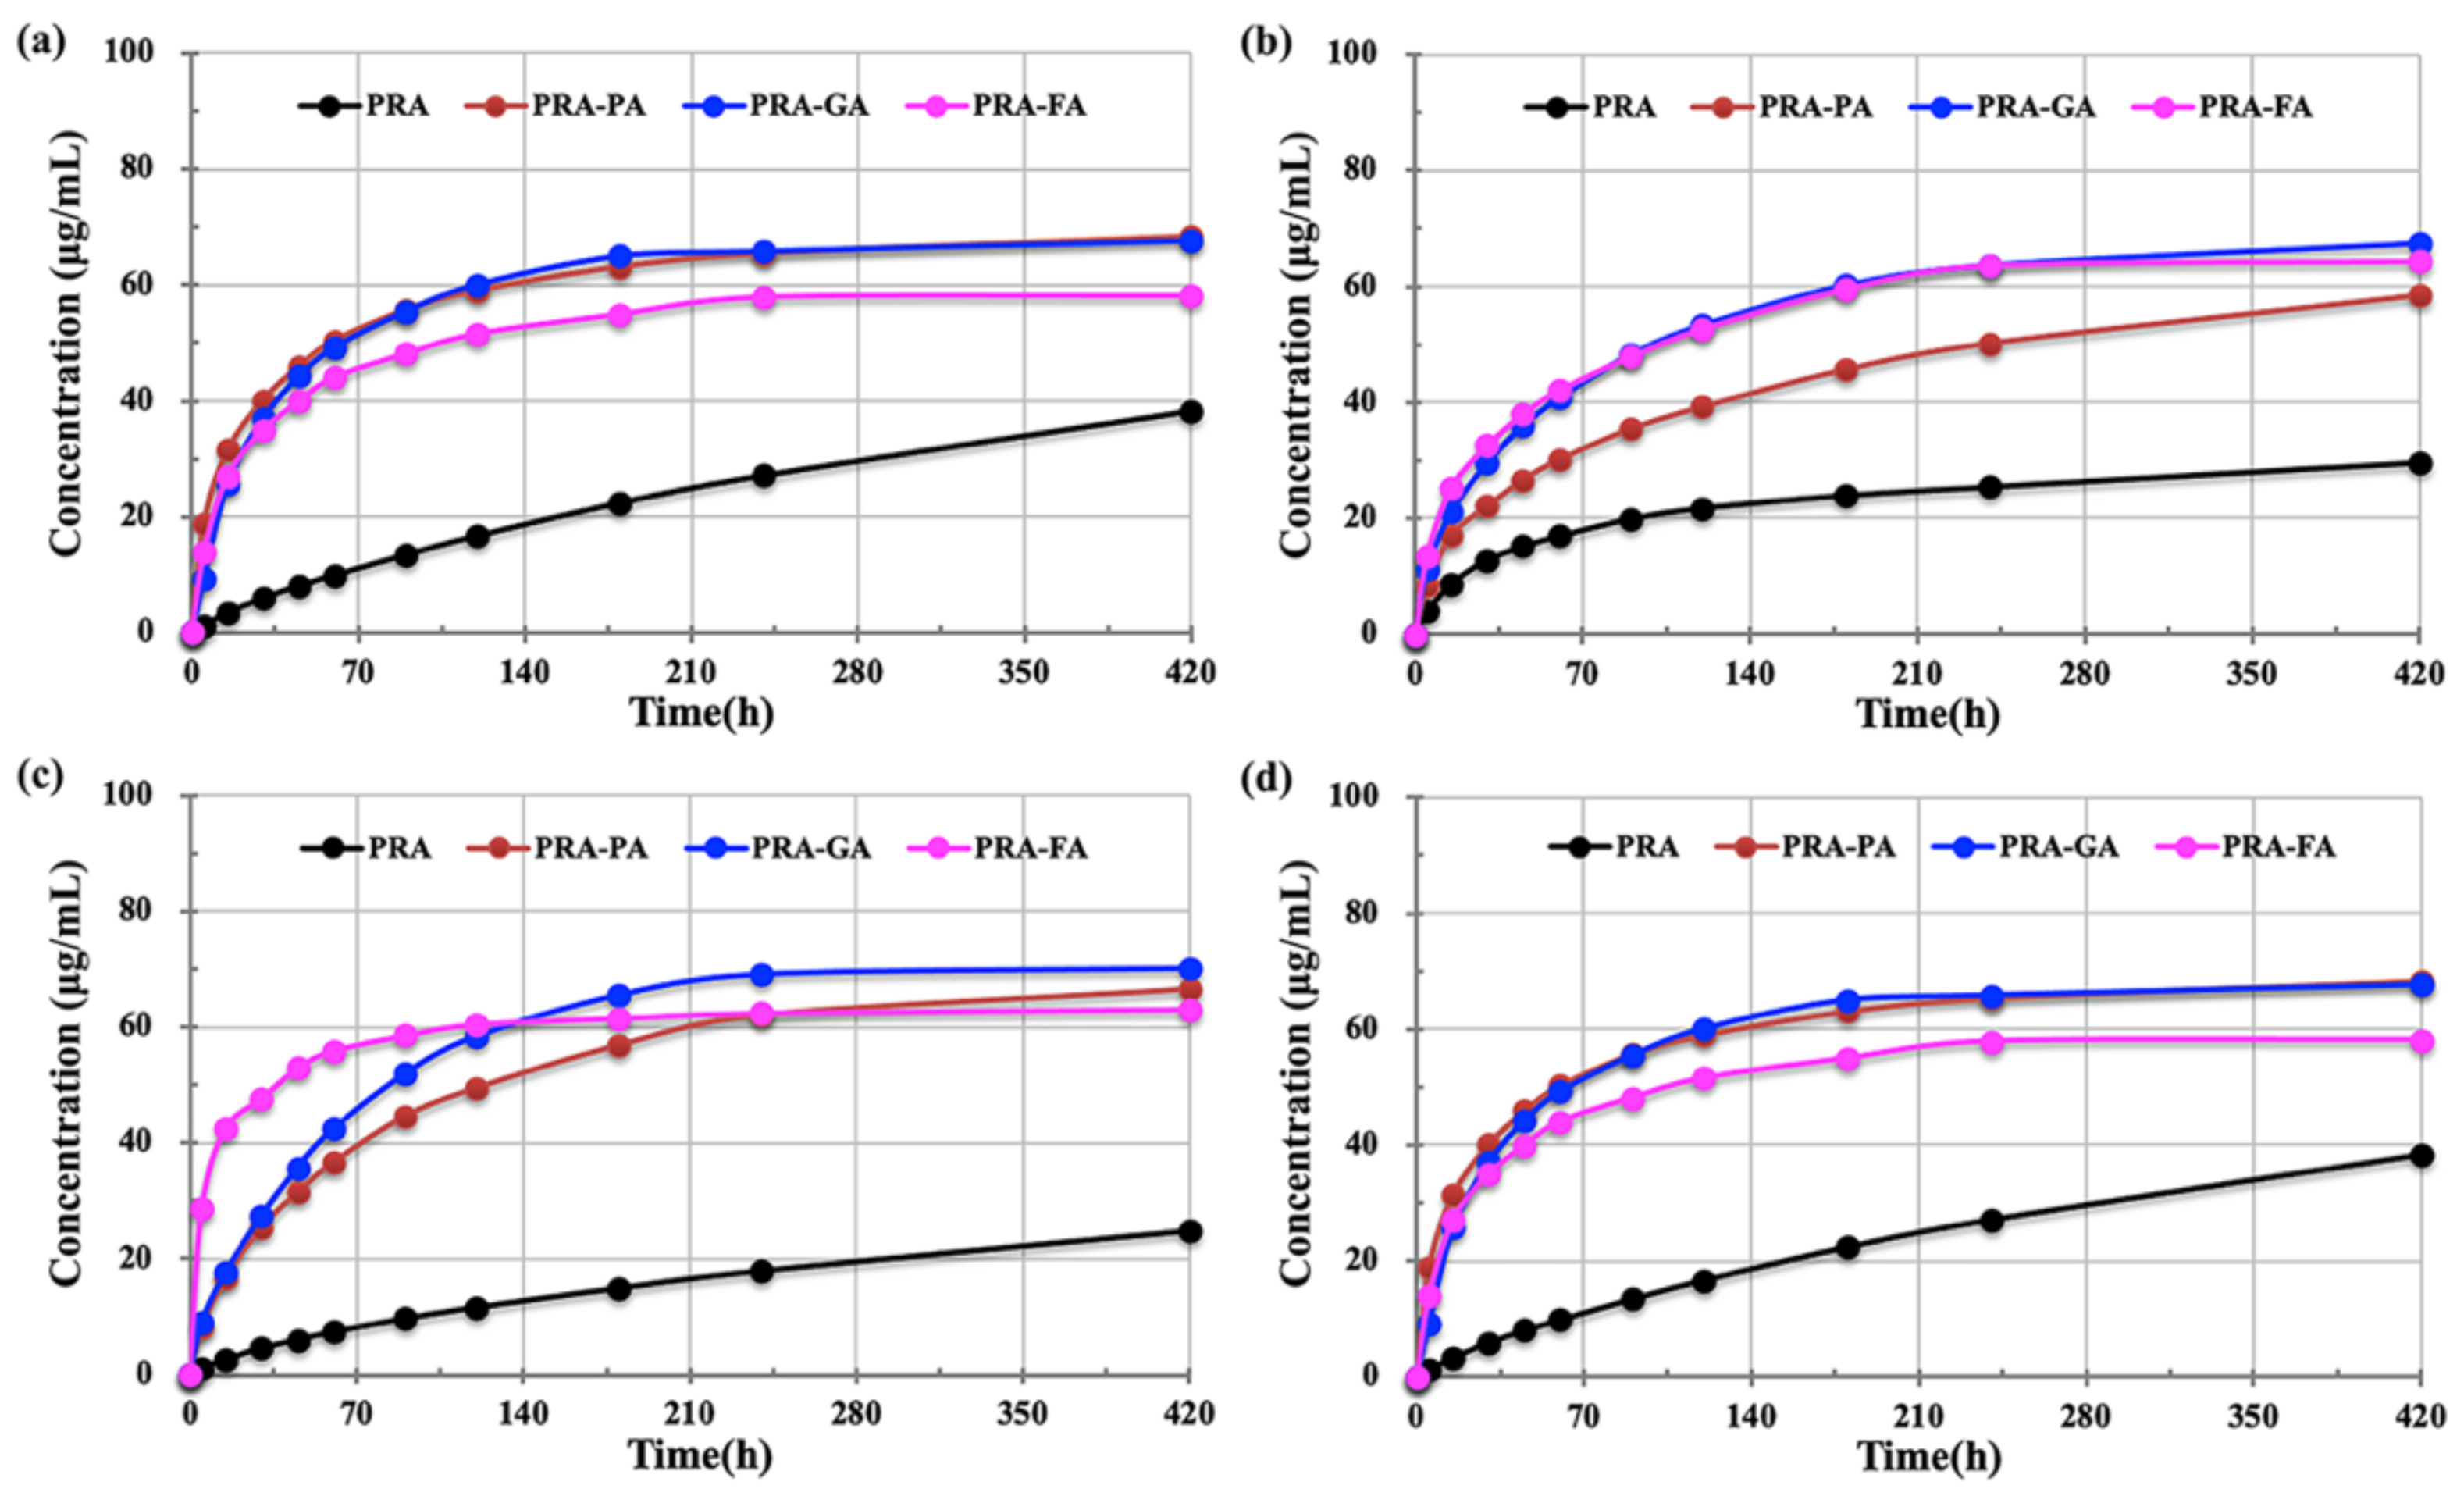
2.6. Solubility
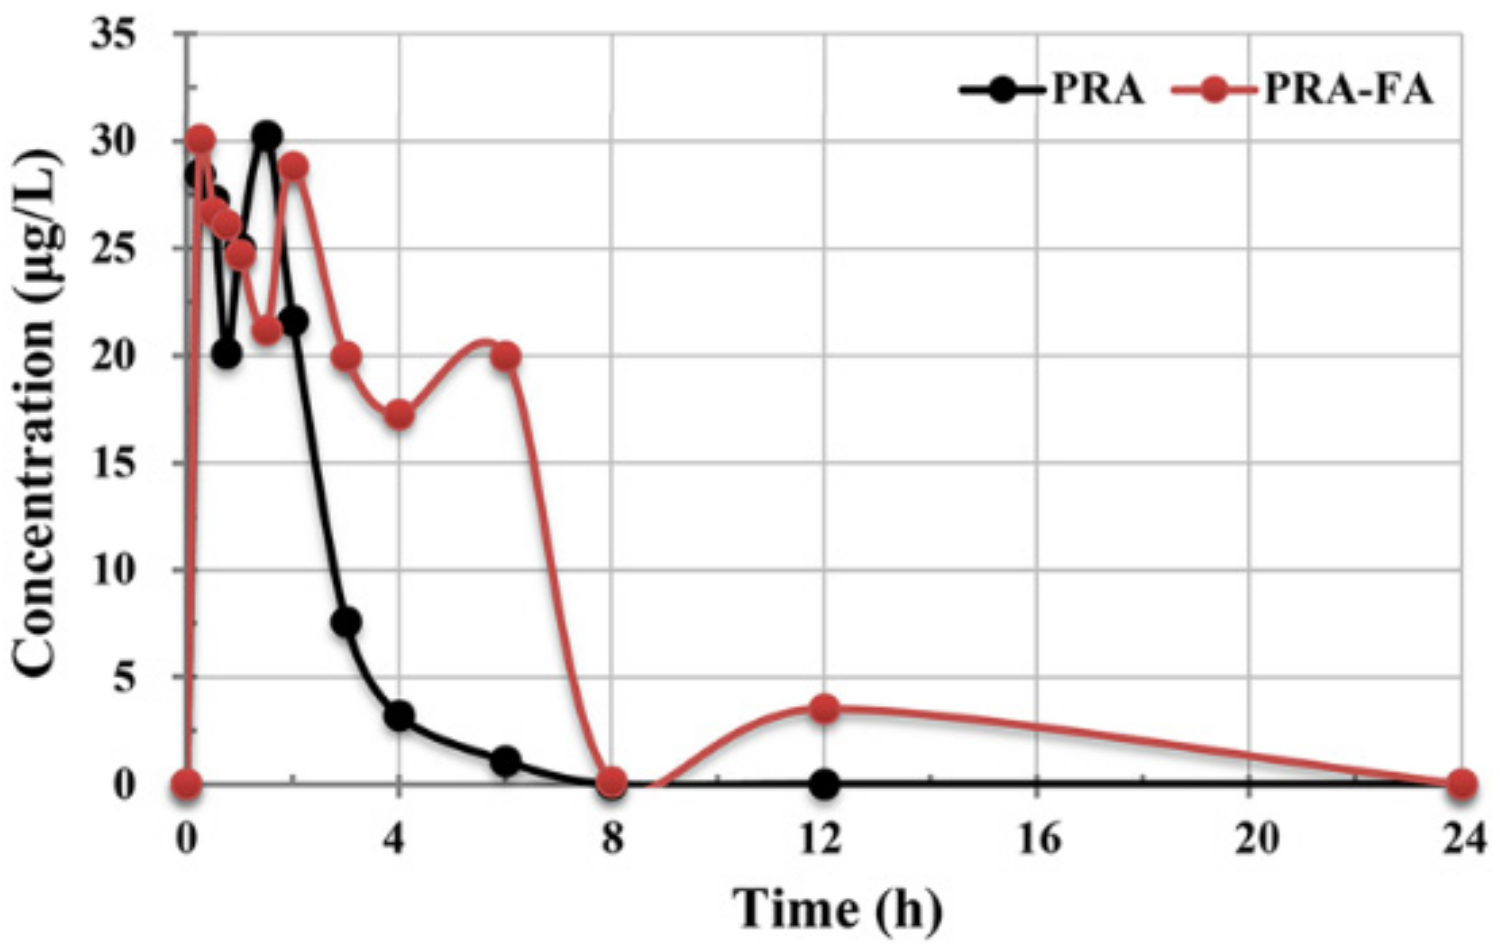
2.7. In Vivo Evaluation
3. Materials and Methods
3.1. Materials and Chemicals
3.2. Methods
3.2.1. Preparation of Cocrystals
3.2.2. Single Crystal X-ray Diffraction (SXRD)
3.2.3. Powder X-ray Diffractometry (PXRD)
3.2.4. Differential Scanning Calorimetry (DSC) and Thermogravimetric Analysis (TGA)
3.2.5. Fourier-Transform Infrared Spectroscopy (FT-IR)
3.2.6. Theoretical Computation
3.2.7. Powder Dissolution Experiments
3.2.8. In Vivo Evaluation
4. Conclusions
Author Contributions
Funding
Institutional Review Board Statement
Informed Consent Statement
Conflicts of Interest
Sample Availability
References
- LoVerde, P.T. Schistosomiasis. Adv. Exp. Med. Biol. 2019, 1154, 45–70. [Google Scholar]
- Cioli, D.; Pica-Mattoccia, L. Praziquantel. Parasitol. Res. 2003, 90, S3–S9. [Google Scholar] [CrossRef]
- Schneeberger, P.H.H.; Coulibaly, J.T.; Panic, G.; Daubenberger, C.; Gueuning, M.; Frey, J.E.; Keiser, J. Investigations on the interplays between Schistosoma mansoni, praziquantel and the gut microbiome. Parasite Vectors 2018, 11, 168–172. [Google Scholar] [CrossRef] [PubMed]
- Benet, L.Z.; Broccatelli, F.; Oprea, T.I. BDDCS Applied to Over 900 Drugs. AAPS J. 2011, 13, 519–547. [Google Scholar] [CrossRef] [PubMed] [Green Version]
- Manders, S. Tropical infectious diseases. In Textbook of Adult Emergency Medicine, 4th ed.; Cameron, P., Jelinek, G., Kelly, A., Brown, A., Little, M., Eds.; Elsevier Health Sciences: London, UK, 2014; pp. 494–502. [Google Scholar]
- Cioli, D.; Pica-Mattoccia, L.; Basso, A.; Guidi, A. Schistosomiasis control: Praziquantel forever? Mol. Biochem. Parasitol. 2014, 195, 23–29. [Google Scholar] [CrossRef] [PubMed]
- McManus, D.P.; Dunne, D.W.; Sacko, M.; Utzinger, J.; Vennervald, B.J.; Zhou, X.N. Schistosomiasis. Nat. Rev. Dis. Primers 2018, 4, 13. [Google Scholar] [CrossRef] [PubMed]
- Sánchez-Guadarrama, O.; Mendoza-Navarro, F.; Cedillo-Cruz, A.; Jung-Cook, H.; Arenas-Garcia, J.I. Chiral resolution of rs-praziquantel via diastereomeric co-crystal pair formation with l-malic acid. Cryst. Growth Des. 2016, 16, 307–314. [Google Scholar] [CrossRef]
- Martina, C.; Jablan, J.; Lovric, J.; Cincic, D.; Galic, N.; Jug, M. Biopharmaceutical characterization of praziquantel cocrystals and cyclodextrin complexes prepared by grinding. J. Pharm. Biomed. 2017, 137, 42–53. [Google Scholar]
- Devogelaer, J.J.; Charpentier, M.D.; Tijink, A.; Dupray, V.; Coquerel, G.; Johnston, K.; Meekes, H.; Tinnemans, P.; Vlig, E.; Horst, J.H.T.; et al. Co-crystals of Praziquantel: Discovery by Network-Based Link Prediction. Cryst. Growth Des. 2021, 21, 3428–3437. [Google Scholar] [CrossRef]
- Zanolla, D.; Gigli, L.; Hasa, D.; Chierotti, M.R.; Arhangelskis, M.; Demitri, N.; Jones, W.; Voinovich, D.; Perissutti, B. Mechanochemical Synthesis and Physicochemical Characterization of Previously Unreported Praziquantel Solvates with 2-Pyrrolidone and Acetic Acid. Pharmaceutics 2021, 13, 1606. [Google Scholar] [CrossRef]
- Yang, D.Z.; Cao, J.Z.; Heng, T.Y.; Xing, C.; Yang, S.Y.; Zhang, L.; Lu, Y.; Du, G.H. Theoretical Calculation and Structural Analysis of the Cocrystals of Three Flavonols with Praziquantel. Cryst. Growth Des. 2021, 21, 2292–2300. [Google Scholar] [CrossRef]
- Liu, Q.W.; Yang, D.Z.; Chen, T.; Zhang, B.X.; Xing, C.; Zhang, L.; Lu, Y.; Du, G.H. Insights into the Solubility and Structural Features of Four Praziquantel Cocrystals. Cryst. Growth Des. 2021, 21, 6321–6331. [Google Scholar] [CrossRef]
- Yang, D.Z.; Wang, H.J.; Liu, Q.W.; Yuan, P.H.; Chen, T.; Zhang, L.; Yang, S.Y.; Zhou, Z.Z.; Lu, Y.; Du, G.H. Structural landscape on a series of rhein: Berberine cocrystal salt solvates: The formation, dissolution elucidation from experimental and theoretical investigations. Chin. Chem. Lett. 2021; in press. [Google Scholar] [CrossRef]
- Liu, H.J.; Nie, J.J.; Chan, S.H.C.; Zhang, H.L.; Lin, H.Q.; Tong, H.H.Y.; Ma, A.; Zhou, Z.Z. Phase solubility diagrams and energy surface calculations support the solubility enhancement with low hygroscopicity of bergenin: 4-aminobenzamide (1:1) cocrystal. Int. J. Pharm. 2021, 60, 120537. [Google Scholar] [CrossRef] [PubMed]
- Dolomanov, O.V.; Bourhis, L.J.; Gildea, R.J.; Howard, J.A.K.; Puschmann, H. OLEX2: A complete structure solution, refinement and analysis program. J. Appl. Crystallogr. 2009, 42, 339–341. [Google Scholar] [CrossRef]
- Herbst-Irmer, R.; Spek, A.; Schneider, T.; Sawaya, M. Crystal Structure Refinement: A Crystallographer’s Guide to SHELXL; Oxford University Press: New York, NY, USA, 2006; Volume 8, pp. 1–26. [Google Scholar]
- Sheldrick, G.M. Crystal structure refinement with SHELXL. Acta Crystallogr. Sect. C Struct. Chem. 2015, 71, 3–8. [Google Scholar] [CrossRef]
- Mercury Version 2021.2.0 Windows; Cambridge Crystallographic Database Centre: Cambridge, UK, 2021.
- Macrae, C.F.; Edgington, P.R.; McCabe, P.; Pidcock, E.; Shields, G.P.; Taylor, R.; Towler, M.; van de Streek, J. Mercury: Visualization and analysis of crystal structures. J. Appl. Crystallogr. 2006, 39, 453–457. [Google Scholar] [CrossRef] [Green Version]
- Frisch, M.; Trucks, G.; Schlegel, H.; Scuseria, G.; Robb, M.; Cheeseman, J.; Scalmani, G.; Barone, V.; Petersson, G.; Nakatsuji, H. Gaussian 16, Revision, A03; Gaussian, Inc.: Wallingford, CT, USA, 2016. [Google Scholar]
- Huang, D.D.; Yang, D.Z.; Lv, Y.; Zhou, J.L.; Li, L.; Xu, J.P.; Yang, X.M.; Zhou, Z.Z. Lattice water provides hydrogen atom donor to form hydrate: A case study of chlorbipram: M-hydroxylbenzoic acid (1:1) cocrystal. J. Mol. Struct. 2021, 1250, 131891. [Google Scholar] [CrossRef]
- Lu, T.; Chen, F. Multiwfn: A multifunctional wavefunction analyzer. J. Comput. Chem. 2012, 33, 580–592. [Google Scholar] [CrossRef]
- Guan, H.Y.; Wu, Y.H.; Han, Y.; Liu, J.Y.; Huang, D.D.; Liang, Z.S.; Zhou, Z.Z.; Guo, F. Furosemide adducts with hexamethylenetetramine, amantadine, and isoniazid: A structural case that demonstrates the effect of carboxylic acid dimer and sulfonic acid dimer on the solubility. Cryst. Growth. Des. 2020, 20, 4395–4401. [Google Scholar] [CrossRef]
- Huang, D.D.; Chan, H.C.S.; Wu, Y.S.; Li, L.; Zhang, L.; Lv, Y.; Yang, X.M.; Zhou, Z.Z. Phase solubility investigation and theoretical calculations on drug-drug cocrystals of carbamazepine with emodin, paeonol. J. Mol. Liq. 2021, 329, 115604. [Google Scholar] [CrossRef]
- Zhang, L.; Kong, D.W.; Wang, H.J.; Jiao, L.T.; Zhao, X.Y.; Song, J.K.; Yang, D.Z.; Yang, H.G.; Yang, S.Y.; Du, G.H.; et al. Cocrystal of apixaban–quercetin: Improving solubility and bioavailability of drug combination of two poorly soluble drugs. Molecules 2021, 26, 2677. [Google Scholar] [CrossRef] [PubMed]
- Ren, S.Y.; Jiao, L.T.; Yang, S.Y.; Zhang, L.; Song, J.K.; Yu, H.Y.; Wang, J.R.; Lv, T.T.; Sun, L.; Lu, Y.; et al. A novel co-crystal of bexarotene and ligustrazine improves pharmacokinetics and tissue distribution of bexarotene in SD rats. Pharmaceutics 2020, 12, 906. [Google Scholar] [CrossRef] [PubMed]


| PRA-PA-ACN | PRA-GA-ACN | PRA-FA | |
|---|---|---|---|
| Formula | C28H33N3O6 | C28H33N3O7 | C29H34N2O6 |
| Crystal size (mm) | 0.15 × 0.25 × 0.35 | 0.28 × 0.28 × 0.43 | 0.15 × 0.22 × 0.46 |
| Description | block | block | block |
| Crystal system | monoclinic | monoclinic | monoclinic |
| Space group | I 2/a | I 2/a | P 21/n |
| Unit cell parameters (Å, °) | a = 26.4615 (3) | a = 27.475 (1) | a = 17.7267 (19) |
| b = 8.37690 (10) | b = 8.353 (1) | b = 5.8624 (7) | |
| c = 27.2338 (3) | c = 26.648 (1) | c = 26.209 (3) | |
| β = 118.541 (2) | β = 119.50 (1) | β = 108.058 (12) | |
| Volume (Å3) | 5303.17 (14) | 5322.77 (7) | 2589.5 (5) |
| Z | 8 | 8 | 4 |
| Density (g/cm3) | 1.271 | 1.307 | 1.297 |
| Theta range for data collection | 3.695 < θ < 72.271 | 3.697 < θ < 72.311 | 3.412 < θ < 29.485 |
| Independent reflections | 5171 | 5191 | 5978 |
| Reflections with I > 2σ(I) | 4298 | 4990 | 3681 |
| Completeness | 99.8% | 99.7% | 99.2% |
| R (I > 2σI) | R = 0.051 | R = 0.040 | R = 0.055 |
| wR2 = 0.146 | wR2 = 0.111 | wR2 = 0.117 | |
| Goodness-of-fit on F2 | 1.072 | 1.075 | 1.018 |
| Deposition Number | 2133511 | 2133510 | 2133509 |
| Cocrystal | Interaction | D–H…A | D…A (Å) | <D–H…A (°) |
|---|---|---|---|---|
| PRA-PA-ACN | PRA-PA-1 | a O1Y–H1Y…O1 | 2.71 | 169.11 |
| PRA-PA-2 | b O4Y–H4Y…O2 | 2.62 | 174.69 | |
| PA-ACN | c O3Y–H3Y…N1YJ | 2.98 | 151.24 | |
| PRA-GA-ACN | PRA-GA-1-1 | d O4M–H4M…O2 | 2.68 | 176.08 |
| PRA-GA-1-2 | e O5M–H5M…O2 | 2.68 | 174.82 | |
| PRA-GA-2 | f O2M–H2M…O1 | 2.71 | 168.29 | |
| GA-ACN | g O3M–H3M…N1YJ | 2.95 | 150.74 | |
| PRA-FA | PRA-FA | h O3–H3A…O1 | 2.66 | 174.83 |
| FA dimer | i O6–H6…O5 | 2.65 | 172.62 |
| Interaction | Energy (kcal/mol) |
|---|---|
| PA-PRA-1 | −16.39 |
| PA-PRA-2 | −13.95 |
| PA-ACN | −4.57 |
| PA-PA | −21.99 |
| GA-PRA-1 | −16.05 |
| GA-PRA-2 | −22.68 |
| GA-ACN | -12.80 |
| GA-GA | −35.22 |
| PRA-FA | −11.13 |
| FA-FA | −26.49 |
| PRA-PRA | −7.71 |
| Parameter | PRA | PRA-FA |
|---|---|---|
| AUC(0–24 h) (ng/mL·h) | 73.67 ± 30.51 | 178.02 ± 190.75 |
| MRT(0–∞) | 3.02 ± 2.29 | 4.24 ± 1.99 |
| Tmax (h) | 0.58 ± 0.38 | 3.00 ± 2.65 |
| Cmax (μg/L) | 40.18 ± 14.66 | 38.93 ± 25.17 |
| t1/2 (h) | 2.03 ± 2.25 | 2.22 ± 1.55 |
Publisher’s Note: MDPI stays neutral with regard to jurisdictional claims in published maps and institutional affiliations. |
© 2022 by the authors. Licensee MDPI, Basel, Switzerland. This article is an open access article distributed under the terms and conditions of the Creative Commons Attribution (CC BY) license (https://creativecommons.org/licenses/by/4.0/).
Share and Cite
Yang, S.; Liu, Q.; Ji, W.; An, Q.; Song, J.; Xing, C.; Yang, D.; Zhang, L.; Lu, Y.; Du, G. Cocrystals of Praziquantel with Phenolic Acids: Discovery, Characterization, and Evaluation. Molecules 2022, 27, 2022. https://doi.org/10.3390/molecules27062022
Yang S, Liu Q, Ji W, An Q, Song J, Xing C, Yang D, Zhang L, Lu Y, Du G. Cocrystals of Praziquantel with Phenolic Acids: Discovery, Characterization, and Evaluation. Molecules. 2022; 27(6):2022. https://doi.org/10.3390/molecules27062022
Chicago/Turabian StyleYang, Shiying, Qiwen Liu, Weiwen Ji, Qi An, Junke Song, Cheng Xing, Dezhi Yang, Li Zhang, Yang Lu, and Guanhua Du. 2022. "Cocrystals of Praziquantel with Phenolic Acids: Discovery, Characterization, and Evaluation" Molecules 27, no. 6: 2022. https://doi.org/10.3390/molecules27062022
APA StyleYang, S., Liu, Q., Ji, W., An, Q., Song, J., Xing, C., Yang, D., Zhang, L., Lu, Y., & Du, G. (2022). Cocrystals of Praziquantel with Phenolic Acids: Discovery, Characterization, and Evaluation. Molecules, 27(6), 2022. https://doi.org/10.3390/molecules27062022