
Quantification of Venetoclax for Therapeutic Drug Monitoring in Chinese Acute Myeloid Leukemia Patients by a Validated UPLC-MS/MS Method

 ,
,
Abstract
: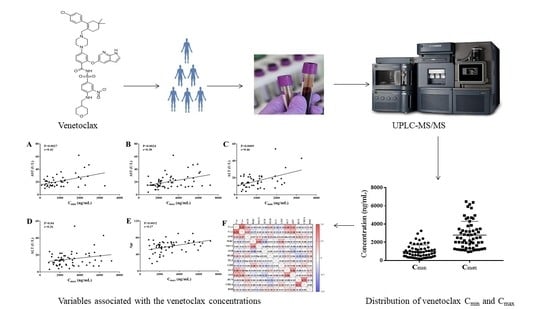
1. Introduction
2. Results and Discussion
2.1. Method Development and Optimization
2.2. Method Validation
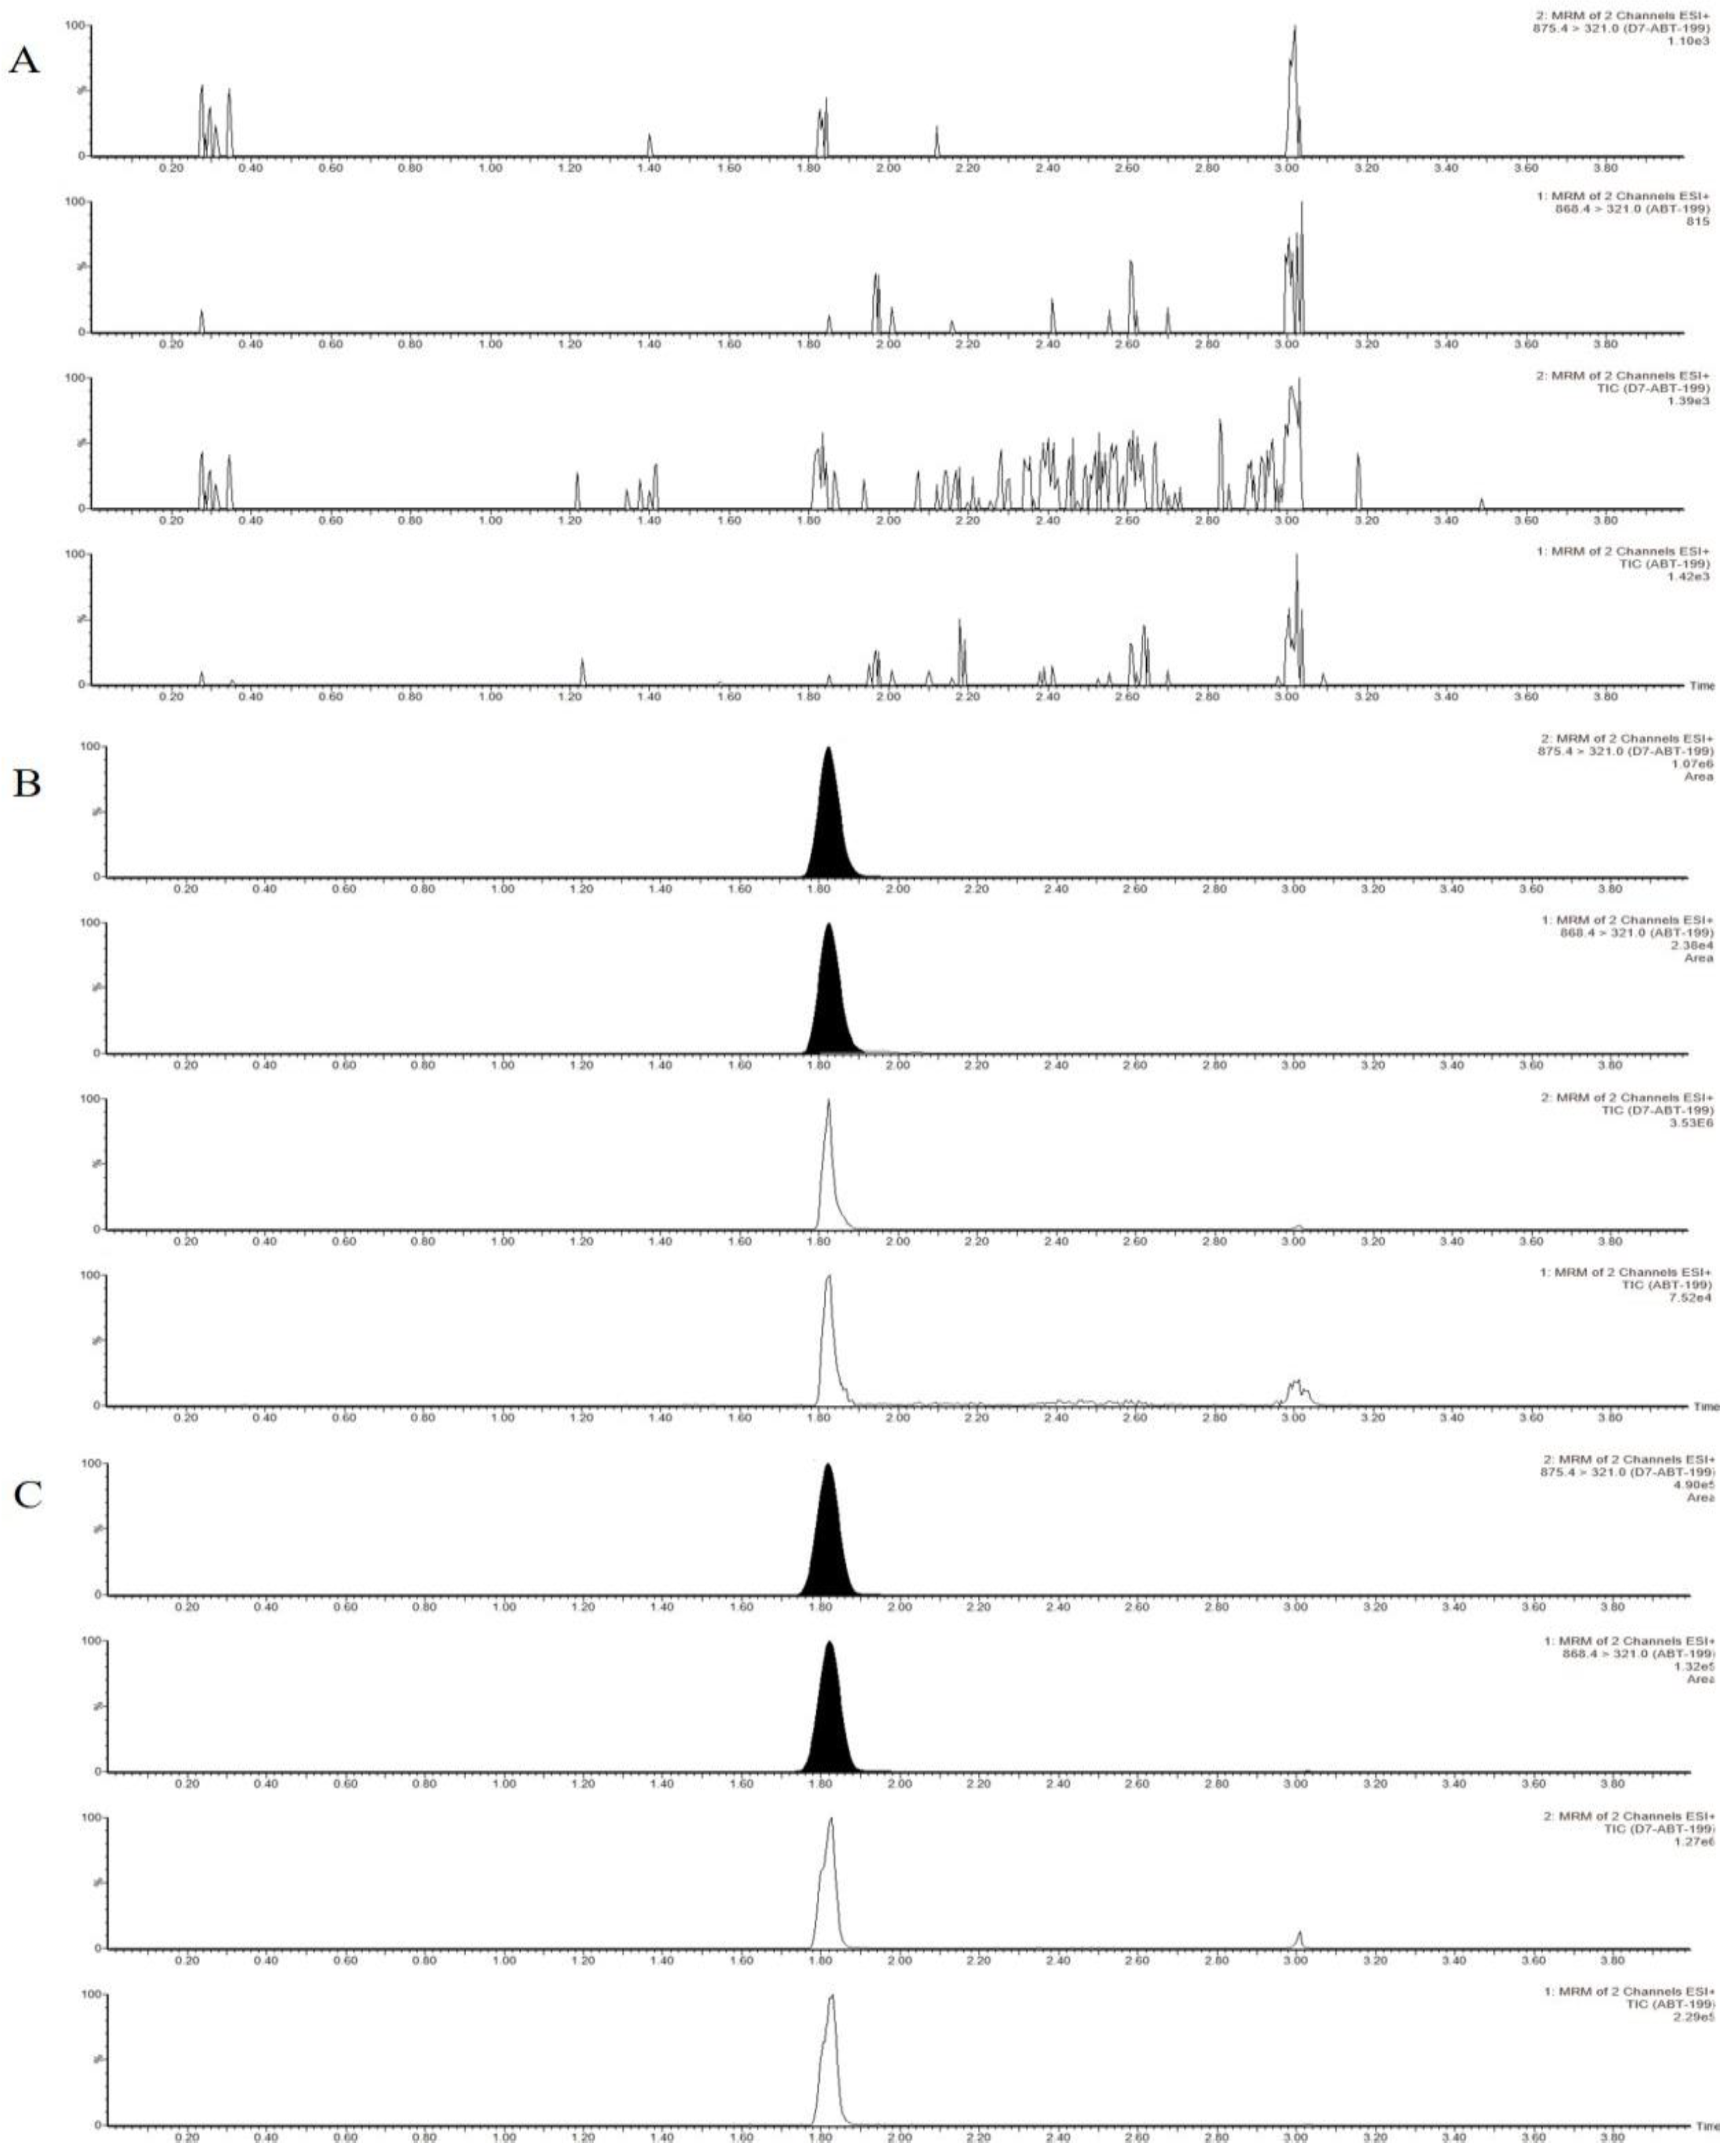
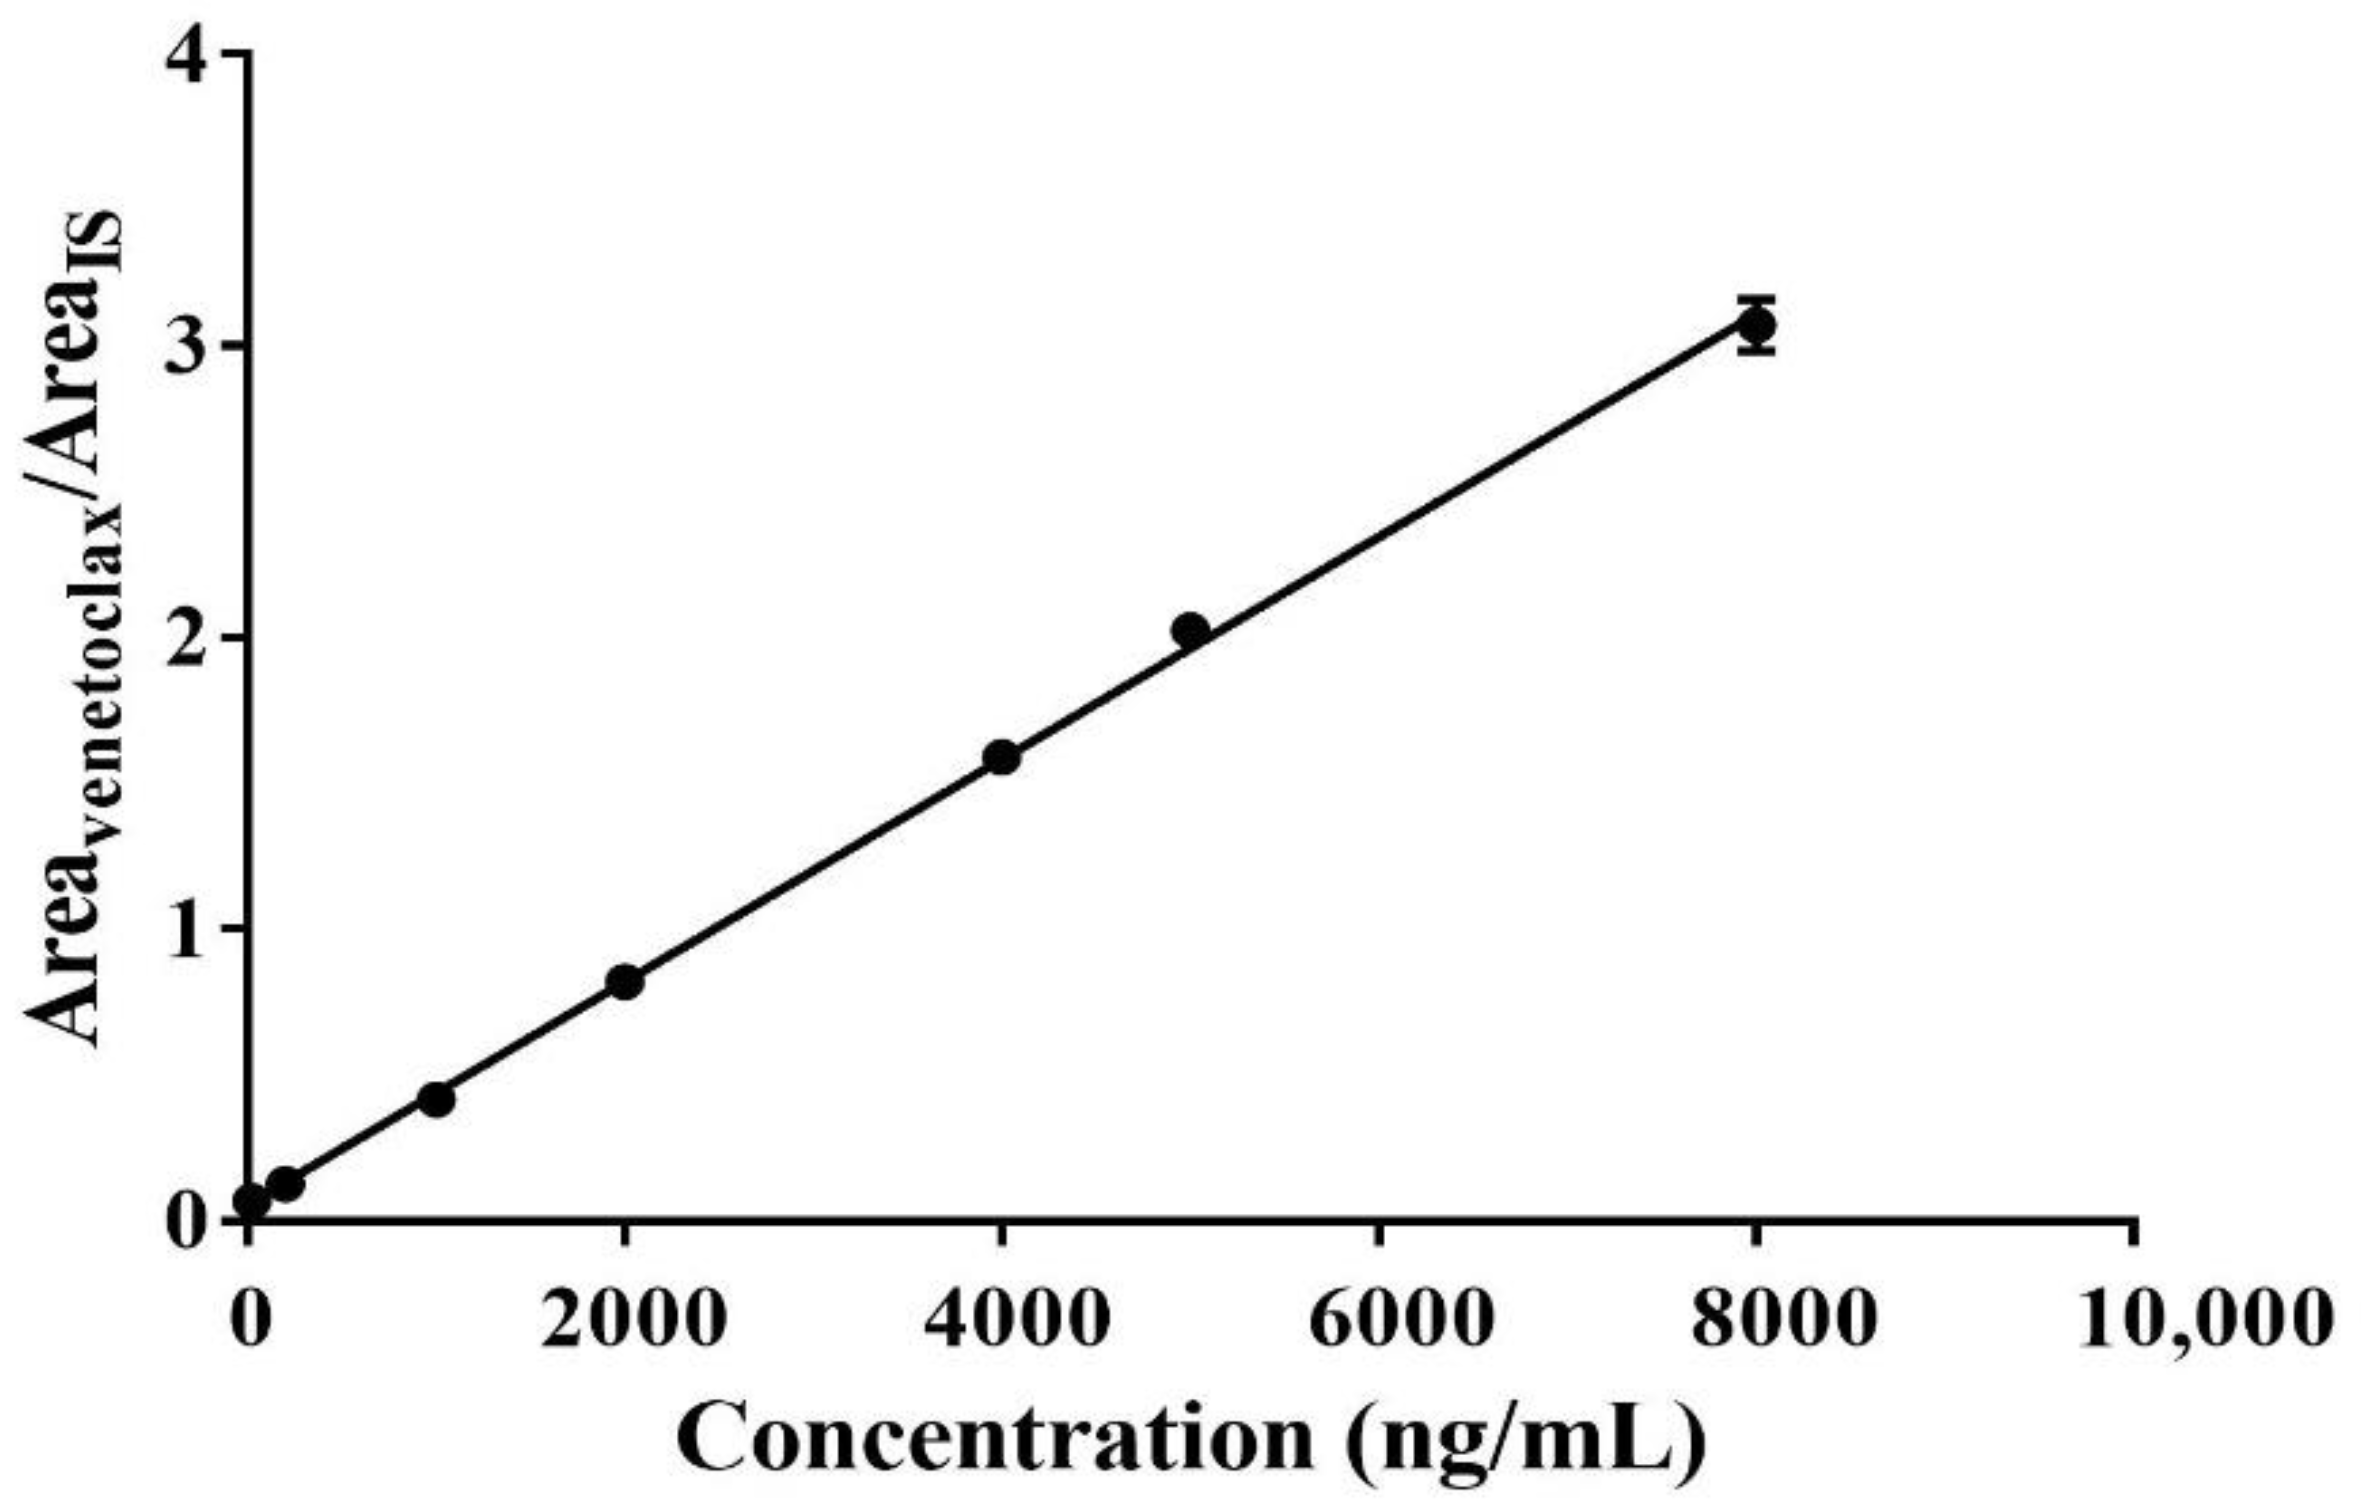
2.2.1. Linearity, Selectivity and Specificity
2.2.2. Precision and Accuracy
2.2.3. Recovery and Matrix Effect
2.2.4. Carry-Over
2.2.5. Stability
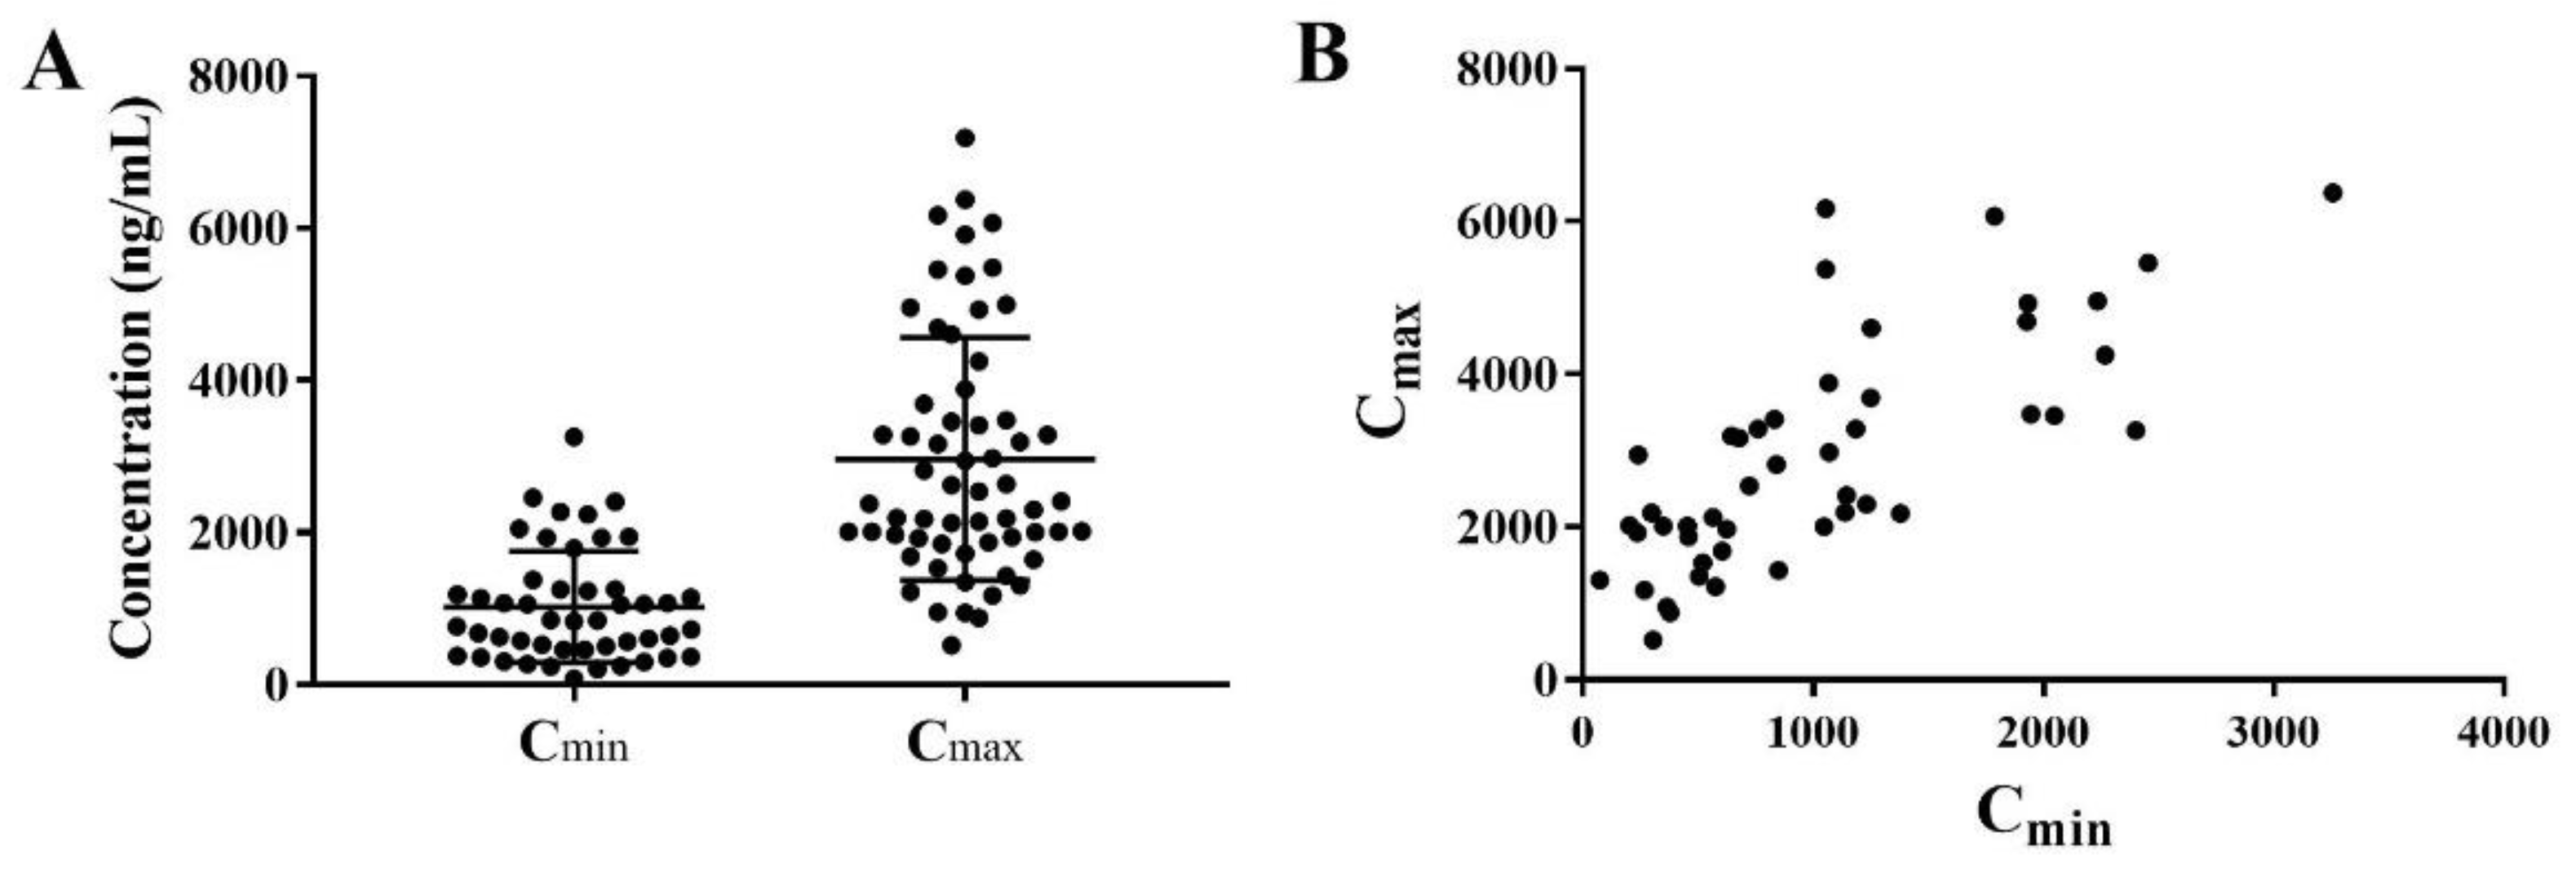
2.3. Patient Characteristics and Venetoclax Concentrations
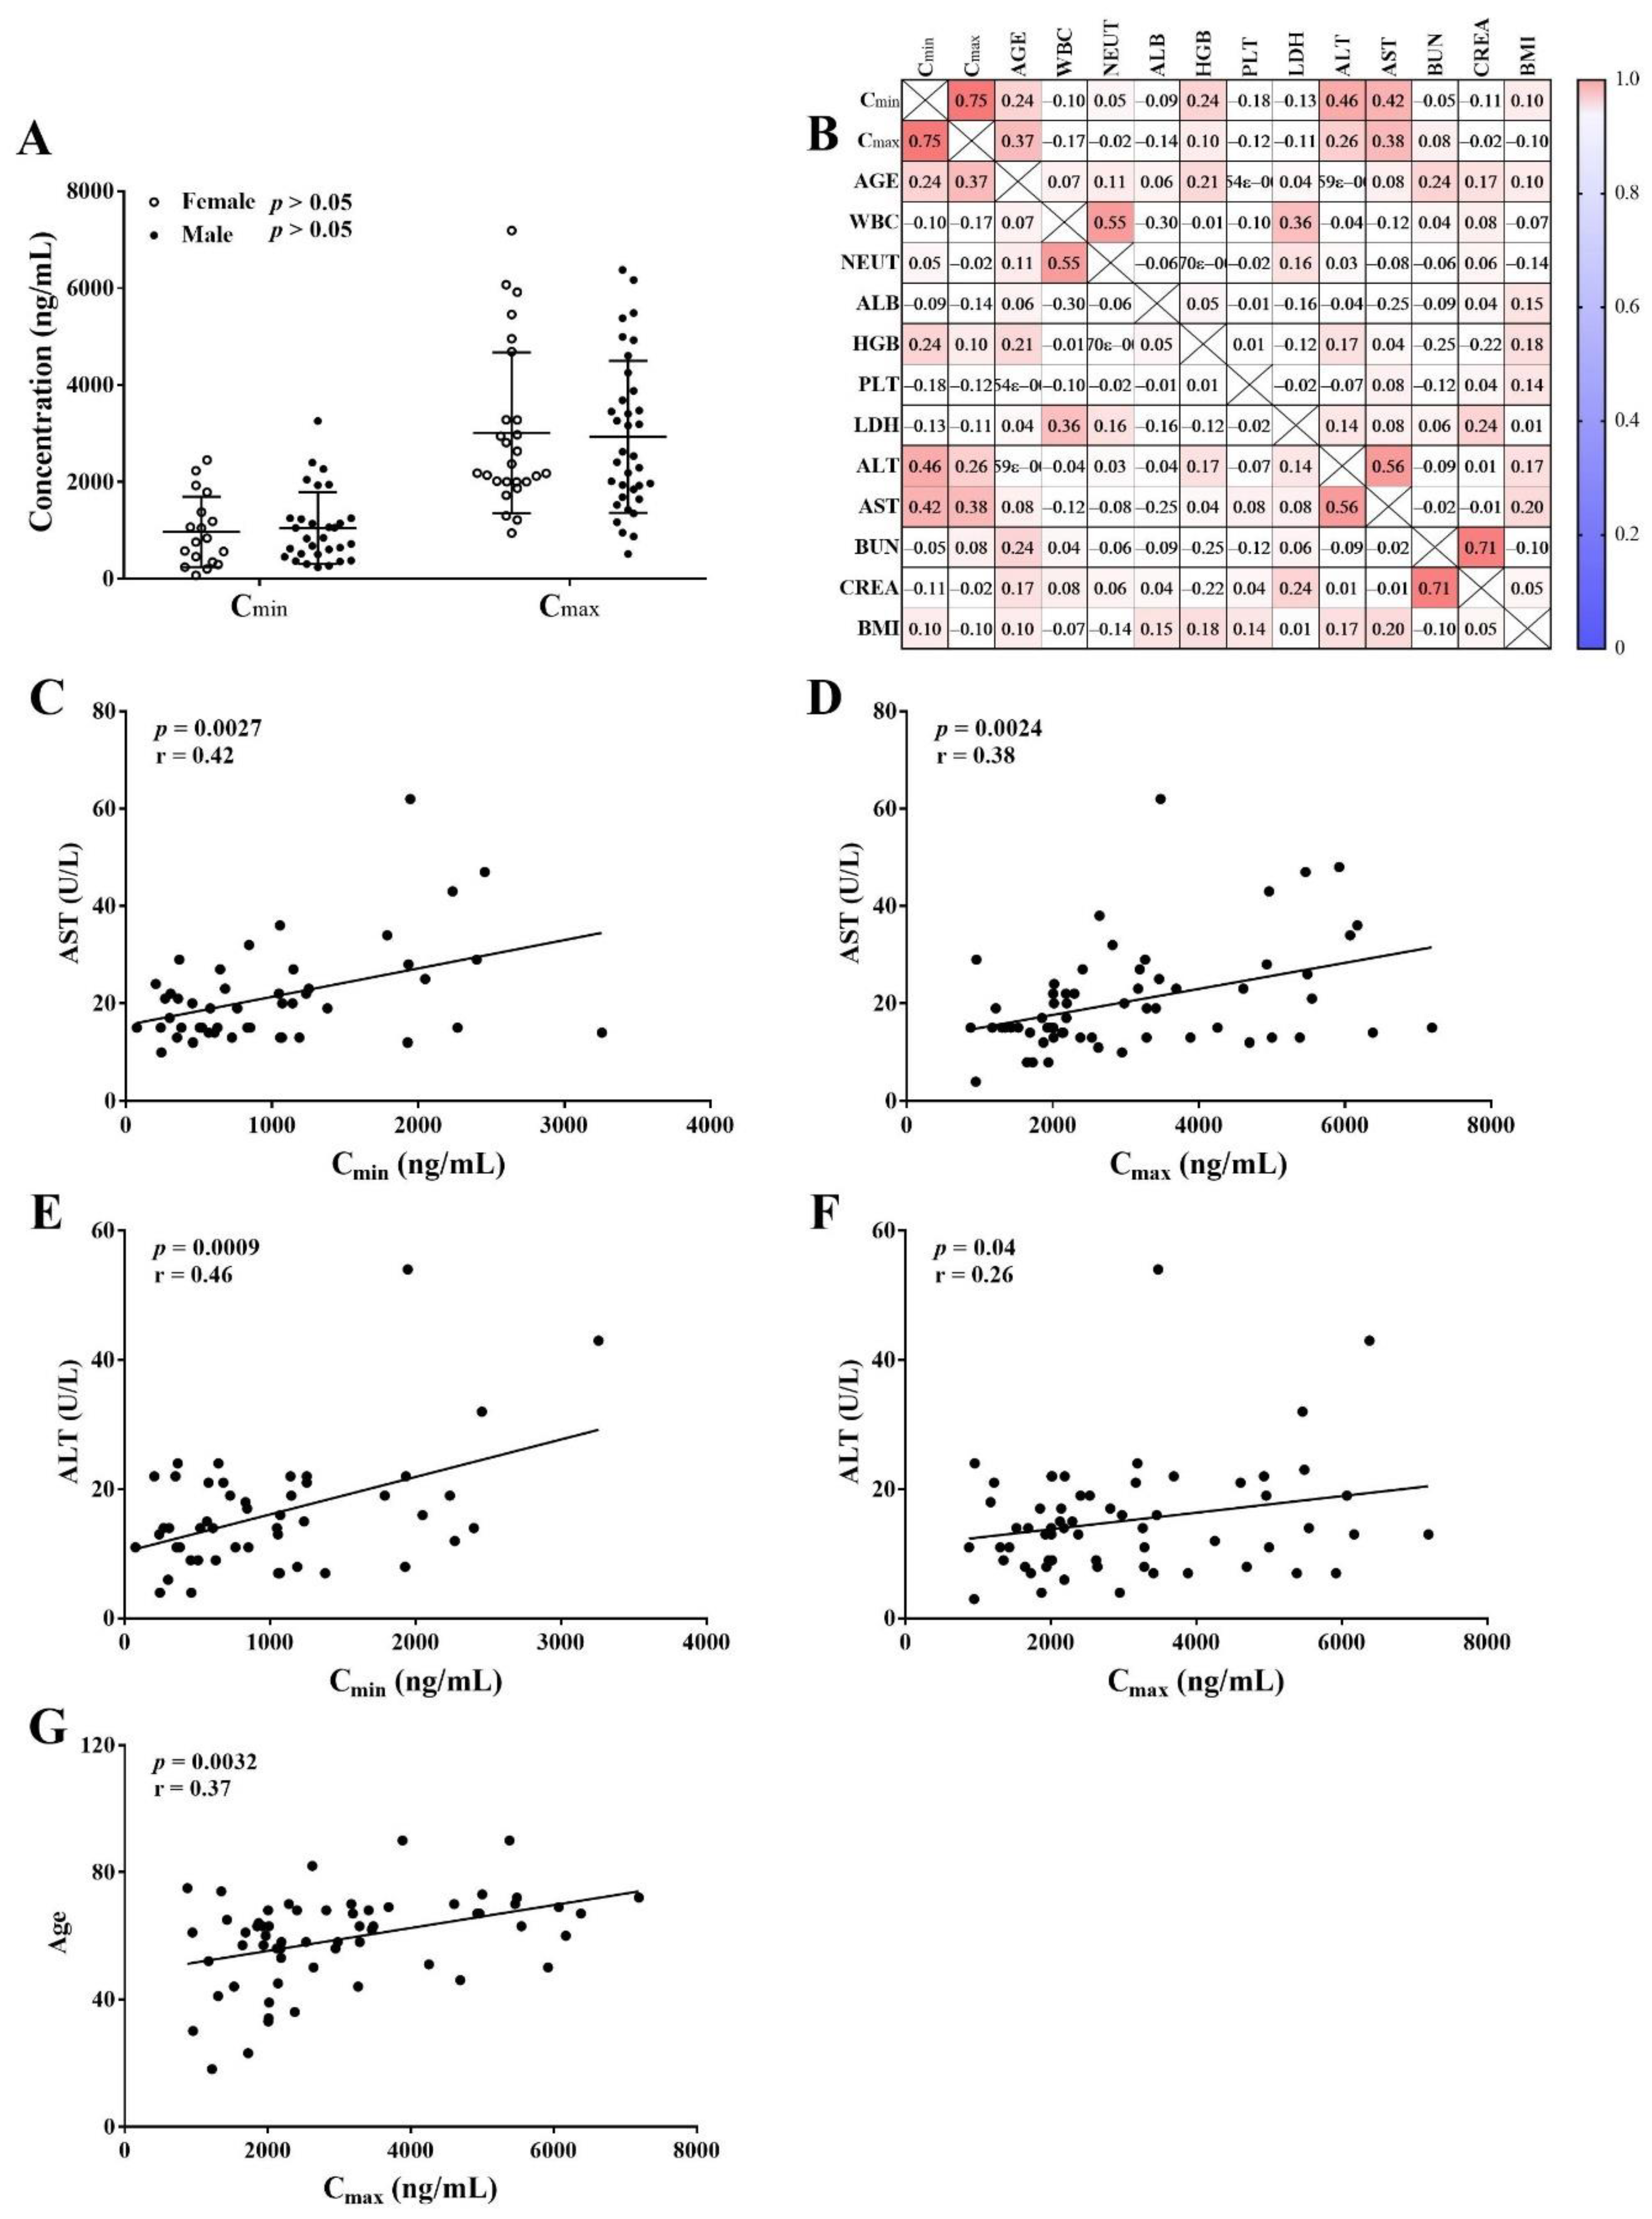
2.4. Relationship between Covariates and Venetoclax Concentrations
3. Material and Methods
3.1. Chemicals and Reagents
3.2. Calibrators and QCs
3.3. Sample Preparation
3.4. UPLC-MS/MS Conditions
3.5. Method Validation
3.5.1. Calibration Curve, Selectivity and Specificity
3.5.2. Precision and Accuracy
3.5.3. Matrix Effect and Recovery
3.5.4. Carry-Over
3.5.5. Stability
3.6. Application
3.7. Statistical Analysis
4. Conclusions
Supplementary Materials
Author Contributions
Funding
Institutional Review Board Statement
Informed Consent Statement
Data Availability Statement
Acknowledgments
Conflicts of Interest
Sample Availability
References
- Stirewalt, D.L.; Radich, J.P. The role of FLT3 in haematopoietic malignancies. Nat. Rev. Cancer 2003, 3, 650–665. [Google Scholar] [CrossRef] [PubMed]
- Woyach, J.A.; Johnson, A.J. Targeted therapies in CLL: Mechanisms of resistance and strategies for management. Blood 2015, 126, 471–477. [Google Scholar] [CrossRef] [PubMed] [Green Version]
- Papanicolas, L.E.; Gordon, D.L.; Wesselingh, S.L.; Rogers, G.B. Not Just Antibiotics: Is Cancer Chemotherapy Driving Antimicrobial Resistance? Trends Microbiol. 2018, 26, 393–400. [Google Scholar] [CrossRef] [PubMed]
- Campbell, K.J.; Tait, S.W.G. Targeting BCL-2 regulated apoptosis in cancer. Open Biol. 2018, 26, 393–400. [Google Scholar] [CrossRef]
- Dai, H.; Ding, H.; Meng, X.W.; Lee, S.H.; Schneider, P.A.; Kaufmann, S.H. Contribution of Bcl-2 phosphorylation to Bak binding and drug resistance. Cancer Res. 2013, 73, 6998–7008. [Google Scholar] [CrossRef] [Green Version]
- Delbridge, A.R.; Grabow, S.; Strasser, A.; Vaux, D.L. Thirty years of BCL-2: Translating cell death discoveries into novel cancer therapies. Nat. Rev. Cancer 2016, 16, 99–109. [Google Scholar] [CrossRef]
- Li, Q.; Cheng, L.; Shen, K.; Jin, H.; Li, H.; Cheng, Y.; Ma, X. Efficacy and Safety of Bcl-2 Inhibitor Venetoclax in Hematological Malignancy: A Systematic Review and Meta-Analysis of Clinical Trials. Front. Pharmacol. 2019, 10, 697. [Google Scholar] [CrossRef]
- Mihalyova, J.; Jelinek, T.; Growkova, K.; Hrdinka, M.; Simicek, M.; Hajek, R. Venetoclax: A new wave in hematooncology. Exp. Hematol. 2018, 61, 10–25. [Google Scholar] [CrossRef]
- Deeks, E.D. Venetoclax: First Global Approval. Drugs 2016, 76, 979–987. [Google Scholar] [CrossRef]
- Jonas, B.A.; Pollyea, D.A. How we use venetoclax with hypomethylating agents for the treatment of newly diagnosed patients with acute myeloid leukemia. Leukemia 2019, 33, 2795–2804. [Google Scholar] [CrossRef]
- Juarez-Salcedo, L.M.; Desai, V.; Dalia, S. Venetoclax: Evidence to date and clinical potential. Drugs Context 2019, 8, 212574. [Google Scholar] [CrossRef]
- Konopleva, M.; Pollyea, D.A.; Potluri, J.; Chyla, B.; Hogdal, L.; Busman, T.; McKeegan, E.; Salem, A.H.; Zhu, M.; Ricker, J.L.; et al. Efficacy and Biological Correlates of Response in a Phase II Study of Venetoclax Monotherapy in Patients with Acute Myelogenous Leukemia. Cancer Discov. 2016, 6, 1106–1117. [Google Scholar] [CrossRef] [Green Version]
- Eyre, T.A.; Roeker, L.E.; Fox, C.P.; Gohill, S.H.; Walewska, R.; Walter, H.S.; Forconi, F.; Broom, A.; Arumainathan, A.; Brander, D.M.; et al. The efficacy and safety of venetoclax therapy in elderly patients with relapsed, refractory chronic lymphocytic leukaemia. Br. J. Haematol. 2020, 188, 918–923. [Google Scholar] [CrossRef]
- Al-Sawaf, O.; Zhang, C.; Tandon, M.; Sinha, A.; Fink, A.M.; Robrecht, S.; Samoylova, O.; Liberati, A.M.; Pinilla-Ibarz, J.; Opat, S.; et al. Venetoclax plus obinutuzumab versus chlorambucil plus obinutuzumab for previously untreated chronic lymphocytic leukaemia (CLL14): Follow-up results from a multicentre, open-label, randomised, phase 3 trial. Lancet Oncol. 2020, 21, 1188–1200. [Google Scholar] [CrossRef]
- Freise, K.J.; Shebley, M.; Salem, A.H. Quantitative Prediction of the Effect of CYP3A Inhibitors and Inducers on Venetoclax Pharmacokinetics Using a Physiologically Based Pharmacokinetic Model. J. Clin. Pharmacol. 2017, 57, 796–804. [Google Scholar] [CrossRef]
- Kaufman, J.L.; Gasparetto, C.; Schjesvold, F.H.; Moreau, P.; Touzeau, C.; Facon, T.; Boise, L.H.; Jiang, Y.; Yang, X.; Dunbar, F.; et al. Targeting BCL-2 with venetoclax and dexamethasone in patients with relapsed/refractory t(11;14) multiple myeloma. Am. J. Hematol. 2021, 96, 418–427. [Google Scholar] [CrossRef]
- Megias-Vericat, J.E.; Solana-Altabella, A.; Ballesta-Lopez, O.; Martinez-Cuadron, D.; Montesinos, P. Drug-drug interactions of newly approved small molecule inhibitors for acute myeloid leukemia. Ann. Hematol. 2020, 99, 1989–2007. [Google Scholar] [CrossRef]
- Cheung, T.T.; Salem, A.H.; Menon, R.M.; Munasinghe, W.P.; Bueno, O.F.; Agarwal, S.K. Pharmacokinetics of the BCL-2 Inhibitor Venetoclax in Healthy Chinese Subjects. Clin. Pharmacol. Drug Dev. 2018, 7, 435–440. [Google Scholar] [CrossRef]
- Kang, J.S.; Lee, M.H. Overview of therapeutic drug monitoring. Korean J. Intern. Med. 2009, 24, 1–10. [Google Scholar] [CrossRef]
- Knezevic, C.E.; Clarke, W. Cancer Chemotherapy: The Case for Therapeutic Drug Monitoring. Ther. Drug. Monit. 2020, 42, 6–19. [Google Scholar] [CrossRef]
- Gao, B.; Yeap, S.; Clements, A.; Balakrishnar, B.; Wong, M.; Gurney, H. Evidence for therapeutic drug monitoring of targeted anticancer therapies. J. Clin. Oncol. 2012, 30, 4017–4025. [Google Scholar] [CrossRef]
- Bardin, C.; Veal, G.; Paci, A.; Chatelut, E.; Astier, A.; Leveque, D.; Widmer, N.; Beijnen, J. Therapeutic drug monitoring in cancer--are we missing a trick? Eur. J. Cancer 2014, 50, 2005–2009. [Google Scholar] [CrossRef]
- de Jonge, M.E.; Huitema, A.D.; Schellens, J.H.; Rodenhuis, S.; Beijnen, J.H. Individualised cancer chemotherapy: Strategies and performance of prospective studies on therapeutic drug monitoring with dose adaptation: A review. Clin. Pharmacokinet. 2005, 44, 147–173. [Google Scholar] [CrossRef]
- Eisenmann, E.D.; Jin, Y.; Weber, R.H.; Sparreboom, A.; Baker, S.D. Development and validation of a sensitive UHPLC-MS/MS analytical method for venetoclax in mouse plasma, and its application to pharmacokinetic studies. J. Chromatogr. B Analyt. Technol. Biomed. Life Sci. 2020, 1152, 122176. [Google Scholar] [CrossRef]
- Liu, H.; Michmerhuizen, M.J.; Lao, Y.; Wan, K.; Salem, A.H.; Sawicki, J.; Serby, M.; Vaidyanathan, S.; Wong, S.L.; Agarwal, S.; et al. Metabolism and Disposition of a Novel B-Cell Lymphoma-2 Inhibitor Venetoclax in Humans and Characterization of Its Unusual Metabolites. Drug Metab. Dispos. 2017, 45, 294–305. [Google Scholar] [CrossRef] [Green Version]
- Choo, E.F.; Boggs, J.; Zhu, C.; Lubach, J.W.; Catron, N.D.; Jenkins, G.; Souers, A.J.; Voorman, R. The role of lymphatic transport on the systemic bioavailability of the Bcl-2 protein family inhibitors navitoclax (ABT-263) and ABT-199. Drug Metab. Dispos. 2014, 42, 207–212. [Google Scholar] [CrossRef] [Green Version]
- Reddy, A.; Jadav, T.; Sahu, A.K.; Sengupta, P. LC-MS/MS bioanalytical method for quantification of binimetinib and venetoclax, and their pharmacokinetic interaction. Bioanalysis 2022, 14, 75–86. [Google Scholar] [CrossRef]
- Roberts, A.W.; Davids, M.S.; Pagel, J.M.; Kahl, B.S.; Puvvada, S.D.; Gerecitano, J.F.; Kipps, T.J.; Anderson, M.A.; Brown, J.R.; Gressick, L.; et al. Targeting BCL2 with Venetoclax in Relapsed Chronic Lymphocytic Leukemia. N. Engl. J. Med. 2016, 374, 311–322. [Google Scholar] [CrossRef]
- Minocha, M.; Zeng, J.; Medema, J.K.; Othman, A.A. Pharmacokinetics of the B-Cell Lymphoma 2 (Bcl-2) Inhibitor Venetoclax in Female Subjects with Systemic Lupus Erythematosus. Clin. Pharmacokinet. 2018, 57, 1185–1198. [Google Scholar] [CrossRef]
- Schieber, M.; Ma, S. The expanding role of venetoclax in chronic lymphocytic leukemia and small lymphocytic lymphoma. Blood Lymphat. Cancer 2019, 9, 9–17. [Google Scholar] [CrossRef] [Green Version]
- Izutsu, K.; Yamamoto, K.; Kato, K.; Ishikawa, T.; Fukuhara, N.; Terui, Y.; Choi, I.; Humphrey, K.; Kim, S.Y.; Okubo, S.; et al. Phase 1/2 study of venetoclax, a BCL-2 inhibitor, in Japanese patients with relapsed or refractory chronic lymphocytic leukemia and small lymphocytic lymphoma. Int. J. Hematol. 2021, 113, 370–380. [Google Scholar] [CrossRef] [PubMed]
- Deng, R.; Gibiansky, L.; Lu, T.; Agarwal, P.; Ding, H.; Li, X.; Kshirsagar, S.; Lu, D.; Li, C.; Girish, S.; et al. Bayesian Population Model of the Pharmacokinetics of Venetoclax in Combination with Rituximab in Patients with Relapsed/Refractory Chronic Lymphocytic Leukemia: Results from the Phase III MURANO Study. Clin. Pharmacokinet. 2019, 58, 1621–1634. [Google Scholar] [CrossRef] [PubMed]
- Jones, A.K.; Freise, K.J.; Agarwal, S.K.; Humerickhouse, R.A.; Wong, S.L.; Salem, A.H. Clinical Predictors of Venetoclax Pharmacokinetics in Chronic Lymphocytic Leukemia and Non-Hodgkin’s Lymphoma Patients: A Pooled Population Pharmacokinetic Analysis. AAPS J. 2016, 18, 1192–1202. [Google Scholar] [CrossRef] [PubMed]
- Ramanathan, R.K.; Egorin, M.J.; Takimoto, C.H.; Remick, S.C.; Doroshow, J.H.; LoRusso, P.A.; Mulkerin, D.L.; Grem, J.L.; Hamilton, A.; Murgo, A.J.; et al. Phase I and pharmacokinetic study of imatinib mesylate in patients with advanced malignancies and varying degrees of liver dysfunction: A study by the National Cancer Institute Organ Dysfunction Working Group. J. Clin. Oncol. 2008, 26, 563–569. [Google Scholar] [CrossRef]
- Salem, A.H.; Dave, N.; Marbury, T.; Hu, B.; Miles, D.; Agarwal, S.K.; Bueno, O.F.; Menon, R.M. Pharmacokinetics of the BCL-2 Inhibitor Venetoclax in Subjects with Hepatic Impairment. Clin. Pharmacokinet. 2019, 58, 1091–1100. [Google Scholar] [CrossRef]
- FDA; CDER; CVM. Guidance for Industry. Bioanalytical Method Validation. 2018. Available online: http://www.fda.gov/downloads/drugs/guidances/ucm070107.pdf (accessed on 17 December 2021).


| Compound | Retention Time (tR, min) | Transition (m/z) | Cone Voltage (V) | Collision Energy (V) | |
|---|---|---|---|---|---|
| Quantification | Confirmation | ||||
| venetoclax | 1.8 | 868.5→321.0 | 868.5→636.3 | 70 | 36 |
| IS | 1.8 | 875.5→321.0 | 875.5→636.3 | 60 | 40 |
| Compound | Concentration Spiked (ng/mL) | Intra-Day Concentration Measured (ng/mL) | Accuracy RE (%) | Precision RSD (%) | Inter-Day Concentration Measured (ng/mL) | Accuracy RE (%) | Precision RSD (%) |
|---|---|---|---|---|---|---|---|
| Venetoclax | 25 | 24.80 ± 0.57 | −0.80 | 2.28 | 25.12 ± 1.64 | 0.49 | 6.51 |
| 50 | 51.35 ± 3.17 | 2.70 | 6.18 | 48.44 ± 3.54 | −3.11 | 7.30 | |
| 2500 | 2523.77 ± 89.95 | 0.95 | 3.56 | 2419.72 ± 122.66 | −3.21 | 5.07 | |
| 6000 | 5609.22 ± 111.53 | −6.51 | 1.99 | 5711.31 ± 235.93 | −4.81 | 4.13 |
| Compound | Concentration Spiked (ng/mL) | Recovery (%) | Matrix Effect (%) | ||
|---|---|---|---|---|---|
| Mean ± SD | RSD% | Mean ± SD | RSD% | ||
| Venetoclax | 50 | 108.36 ± 2.63 | 2.63 | 89.77 ± 4.78 | 5.33 |
| 2500 | 106.24 ± 1.93 | 1.82 | 89.36 ± 3.38 | 3.78 | |
| 6000 | 106.64 ± 5.73 | 5.37 | 91.12 ± 2.02 | 2.21 | |
| IS | 1000 | 104.41 ± 2.76 | 2.62 | 90.19 ± 2.34 | 2.60 |
| Spiked (ng/mL) | Condition | Found (ng/mL, Mean ± SD) | Precision RSD (%) | Accuracy RE (%) |
|---|---|---|---|---|
| 50 | Room temperature for 6 h | 45.67 ± 1.12 | 2.4 | −8.66 |
| −80 °C for 31 days | 49.57 ± 1.15 | 2.3 | −0.87 | |
| Three freeze-thaw cycles | 48.77 ± 1.53 | 3.1 | −5.38 | |
| Autosampler in 4 °C for 8 h | 46.70 ± 2.13 | 4.6 | −6.60 | |
| 6000 | Room temperature for 6 h | 6045.47 ± 152.82 | 2.5 | 0.76 |
| −80 °C for 31 days | 5618.17 ± 56.22 | 1.0 | −6.36 | |
| Three freeze-thaw cycles | 5676.83 ± 71.15 | 1.3 | −2.5 | |
| Autosampler in 4 °C for 8 h | 5800.63 ± 168.44 | 2.9 | −3.32 |
| Characteristic | Mean (±SD) | Median (Range) |
|---|---|---|
| Age (year) | 58.9 ± 14.3 | 62 (18.0–90.0) |
| Height (cm) | 165.5 ± 5.5 | 165.0 (153.0–177.0) |
| Weight (kg) | 63.44 ± 10.48 | 62.25 (43.5–92.0) |
| BMI (kg/m2) | 23.1 ± 3.3 | 23.0 (16.9–31.46) |
| Gender (Female/Male) | 26/36 | |
| ALB (g/L) | 40.1 ± 5.65 | 40.85 (25.7–51) |
| ALT (U/L) | 15.08 ± 8.65 | 14 (3–54) |
| AST (U/L) | 20.45 ± 10.66 | 17 (4–62) |
| BUN (mmol/L) | 5.83 ± 2.61 | 5.41 (1.94–18.70) |
| CREA (µmol/L) | 77.4 ± 30.6 | 69.5 (42.0–224.0) |
| LDH (U/L) | 358 ± 325.1 | 234.5 (54–2066) |
| WBC (10^9/L) | 9.37 ± 14.34 | 3.94 (0.77–83.59) |
| NEUT (10^9/L) | 2.60 ± 5.21 | 1.485 (0.06–31.29) |
| HGB (g/L) | 86.4 ± 24.85 | 83 (45–137) |
| PLT (10^9/L) | 85.18 ± 151.9 | 33.5 (3–1097) |
| Cmax (ng/mL, n = 61) | 2966.0 ± 1595.0 | 2408.0 (515.4–7189.0) |
| Cmin (ng/mL, n = 48). | 1018.0 ± 729.4 | 836.6 (74.2–3257.0) |
Publisher’s Note: MDPI stays neutral with regard to jurisdictional claims in published maps and institutional affiliations. |
© 2022 by the authors. Licensee MDPI, Basel, Switzerland. This article is an open access article distributed under the terms and conditions of the Creative Commons Attribution (CC BY) license (https://creativecommons.org/licenses/by/4.0/).
Share and Cite
Yang, X.; Mei, C.; He, X.; He, L.; Lu, X.; Tong, H.; Lou, Y. Quantification of Venetoclax for Therapeutic Drug Monitoring in Chinese Acute Myeloid Leukemia Patients by a Validated UPLC-MS/MS Method. Molecules 2022, 27, 1607. https://doi.org/10.3390/molecules27051607
Yang X, Mei C, He X, He L, Lu X, Tong H, Lou Y. Quantification of Venetoclax for Therapeutic Drug Monitoring in Chinese Acute Myeloid Leukemia Patients by a Validated UPLC-MS/MS Method. Molecules. 2022; 27(5):1607. https://doi.org/10.3390/molecules27051607
Chicago/Turabian StyleYang, Xi, Chen Mei, Xiaoying He, Lingjuan He, Xiaoyang Lu, Hongyan Tong, and Yan Lou. 2022. "Quantification of Venetoclax for Therapeutic Drug Monitoring in Chinese Acute Myeloid Leukemia Patients by a Validated UPLC-MS/MS Method" Molecules 27, no. 5: 1607. https://doi.org/10.3390/molecules27051607
APA StyleYang, X., Mei, C., He, X., He, L., Lu, X., Tong, H., & Lou, Y. (2022). Quantification of Venetoclax for Therapeutic Drug Monitoring in Chinese Acute Myeloid Leukemia Patients by a Validated UPLC-MS/MS Method. Molecules, 27(5), 1607. https://doi.org/10.3390/molecules27051607