Abstract
Boerhavia diffusa L. Nyctanginaceae (B. diffusa) is a medicinal herb commonly considered as a weed. The exploration of phytochemicals in different parts of B. diffusa with different solvents will create awareness, along with the suitable solvent and method for extraction of pharmaceutical compounds. Hence, the present study focuses on phytochemical analysis of B. diffusa leaves, stems, and roots in various solvents with hot and cold extraction. The decoctions performed well in most of the qualitative and quantitative tests, along with the DPPH assay. The aqueous extract showed a good result in the FRAP assay and ABTS assay. In the antimicrobial test, the B. diffusa root ethanol extract inhibited the growth of Pseudomonas aeruginosa and Staphylococcus aureus with zones of inhibition of about 8 mm and 20 mm at 200 µg concentration, respectively. Using a molecular docking approach, the top four ranked molecules from the crude extract of B. diffusa profiled from GC–MS spectroscopy in terms of growth inhibition of the pathogenic bacterium P. aeruginosa were selected; among them, 2-(1,2 dihydroxyethyl)-5-[[2,5,7,8-tetramethyl-2-(4,8,12-trimethyltridecyl)-3,4-dihydrochromen-6-yl]oxy]oxolane-3,4-diol exhibited the minimum binding score, revealing high affinity in complex. B. diffusa is highly nutritious, and the maceration and decoction extracts were similar except for the chloroform extract that was found to be weak.
1. Introduction
Nature has been enriched with numerous medicinal plants whose medicinal properties are not much known or where the correct way of using the resource provided by nature is not known. The antioxidant properties of plants help in reducing oxidative stress [1]. Staphylococcus aureus and Pseudomonas aeruginosa are the bacterial types most commonly found to exhibit multidrug resistance [2]. Therefore, knowing the phytochemical profile of the plant, along with its antimicrobial and antioxidant properties in various parts, as a function of the extract and extraction procedure, can aid in the development of herbal medicine. The conventional process of drug development is complex, challenging, lavish, time-consuming, and exhausting. To overcome these barriers, computational approaches such as molecular docking have played a significant role in streamlining the road to drug development. The use of molecular docking technology in drug research is currently a valuable method for quickly screening candidates from drug libraries [3]. B. diffusa is commonly known as red spiderling or common hogweed. It belongs to the order Caryophyllales, indicating it to be a dicotyledonous herb or shrub. It belongs to the family Nyctanginaceae, indicating it to be a four o’clock plant. B. diffusa is an herb that branches laterally at ground level with green leaves, pinkish or purplish stems, and purple flowers that are campanulate [4,5]. About 40 species of Boerhavia are widely distributed throughout the tropical and subtropical regions of the world, with many variations in South and North America [6]. The plant grows in a creeping manner, and it has been found to grow more during the rainy season because the species Boerhavia tends to grow in wet soil and in sandy, stony, and clayey soils found near dried up water resources, as well as riverbeds, hill slopes, and mountains [7]. It is indigenous to India, where it is also referred to as Punarnava and used in traditional medicine [8]. In Tamil, the plant is identified by various terms such as Mukkuratai Kodi, Sarai, and Sarandai. The plant is enriched with anti-inflammatory [9], antibacterial [10] antioxidant [11], and immunomodulatory [12] properties. B. diffusa has been identified among many other plants to confer protection against SARS CoV-2 [13]. The secondary metabolites present in the plants can act as effective pharmaceutical compounds [14]. The antioxidant properties of the plants help in reducing oxidative stress in humans [15]. Quercetin which is a flavonoid compound obtained from the plant can be used as a treatment for coronary heart disease and fatty liver [16]. The volatile compounds have been identified to have a variety of pharmaceutical roles when consumed in the form of aroma and fresh juice with anti-inflammatory, antimicrobial, antioxidant, anti-depressive, and analgesic properties [17,18,19]. Quorum sensing is an important behavior exhibited by bacteria that regulates gene expression on the basis of the cell density and signals produced, which control the behavior of the group [20]. Quorum sensing has also been found to be responsible for the virulence, amplification, and antimicrobial resistance of bacteria; hence, quorum-sensing inhibitors are of recent interest for antimicrobial activity. In a study conducted with P. aeruginosa, PqsR was found to be a useful receptor for quorum-sensing inhibition [21]. The present study conducts an in vitro antioxidant and antimicrobial analysis of different parts of B. diffusa (leaves, stems, and roots) and their phytochemicals in various extracts (decoction, maceration extracts using aqueous, ethanol, and chloroform). Additionally, the phytochemicals extracted from the crude extract of B. diffusa were exploited against pathogenic bacteria through a molecular docking experiment using GLIDE ligand docking, Schrodinger software. The phytochemical analysis involved qualitative tests for carbohydrates, proteins, amino acids, phenols, flavonoids, terpenoids, phytosterols, saponins, and quinone. It also involved the quantification of chlorophyll, carbohydrates, proteins, amino acids, phenols, and flavonoids. The in vitro antioxidant analysis constituted DPPH, FRAP, and ABTS assays. The antimicrobial activity against P. aeruginosa and S. aureus was determined using the disc diffusion method. The extract that showed good results in the antimicrobial tests was subjected to GC–MS analysis to qualitatively identify the presence of volatile compounds that could have antimicrobial potential. The results revealed that B. diffusa leaves are highly nutritious compared to other parts, whereas the roots provided the most substantial antibacterial activity against P. aeruginosa and S. aureus. The extraction procedure involving hot and cold extraction did not show much variance, except that the ethanolic extract performed well in the antimicrobial tests, whereas the chloroform extract did not.
2. Results
2.1. Qualitative Tests
In the qualitative tests, the aqueous extract and decoctions of B. diffusa leaves, stems, and roots showed the presence of most phytochemicals such as proteins, flavonoids, terpenoids, carbohydrates, phenols, and phytosterols. The chloroform extracts of B. diffusa leaves, stems, and roots unanimously showed the presence of proteins, while phenol was present in B. diffusa leaves and stems. The ethanolic extract of B. diffusa leaves, stems, and roots showed the presence of carbohydrates, amino acids, and alkaloids, along with terpenoids in roots and stems, as well as phenol in stems and leaves. The B. diffusa root ethanolic extract also showed the presence of flavonoids. The decoctions of B. diffusa stood out among all other extracts, while B. diffusa aqueous extracts were similar to the decoctions. Ethanolic extracts showed the presence of alkaloids which were mostly absent in decoctions. The chloroform extract showed the presence of the least number of phytochemicals. The results are presented in Table 1, where + indicates the presence of the compound, ++ indicates a higher presence, and − indicates the absence of the compound.

Table 1.
Qualitative tests using different extracts of B. diffusa leaves, stems, and roots. LA, LD, LC, and LE represent the aqueous extract, decoction, chloroform extract, and ethanol extract of B. diffusa leaves. SA, SD, SCm and SE represent the aqueous extract, decoction, chloroform extract, and ethanol extract of stems. RA, RD, RC, and RE represent the aqueous extract, decoction, chloroform extract, and ethanol extract of B. diffusa roots. + indicates the presence of a particular compound, while ++ indicates a higher presence, according to a rapid and intense color change; –− indicates the absence of a particular compound.
2.2. Quantitative Tests
- Chlorophyll
The chlorophyll content was measured in the fresh leaves and stems of B. diffusa. The chlorophyll content was found to be higher in the leaves of B. diffusa than the stems. The chlorophyll content is expressed in mg/g as the mean ± standard error (SE) in Table 2.
Table 2.
Chlorophyll content present in B. diffusa leaves and stems.
- Carbohydrates
Carbohydrate levels were found to be high in the decoctions of B. diffusa leaves and stems. The carbohydrate content was high in the aqueous extract of the stem. Maximum carbohydrate content was observed in the B. diffusa root decoction. The carbohydrate content in B. diffusa leaves, stems, and roots is expressed in mg/g as the mean ± SE in Table 3.
Table 3.
Carbohydrate content present in B. diffusa leaves, stems, and roots.
- Proteins
In the total protein estimation, the B. diffusa decoction showed the highest protein concentration of about 305.8 ± 5.8 mg/g. The aqueous extract of the B. diffusa leaves was the next highest, and the same pattern was observed in the B. diffusa stem decoction and aqueous extract. The B. diffusa roots showed the highest protein concentration among chloroform extracts. The results are expressed in mg/g as the mean ± SE in Table 4.
Table 4.
Protein content present in B. diffusa leaves, stems, and roots.
- Amino Acids
The B. diffusa leaf decoction and stem ethanolic extract showed the maximum amino-acid content. The ethanolic extracts showed close values to the decoction, whereas the root ethanolic extract showed the maximum value of amino acids. The results of amino-acid content in the B. diffusa leaves, stems, and roots are expressed in mg/g as the mean ± SE in Table 5.
Table 5.
Amino-acid content present in B. diffusa leaves, stems, and roots.
- Flavonoids
The flavonoid content was found to be high in the decoctions of B. diffusa stems and roots, while the aqueous leaf extract showed a high level of flavonoids. The B. diffusa leaves were observed to have the highest flavonoid content among all extracts. The flavonoid content observed in the B. diffusa leaves, stems, and roots are expressed in mg/g as the mean ± SE in Table 6.
Table 6.
Flavonoid content present in B. diffusa leaves, stems, and roots.
- Phenols
The phenolic content was found to be high in the decoctions of B. diffusa stems and roots, while the aqueous leaf extract showed a slightly greater level of phenolic content. The B. diffusa leaves were observed to have the highest phenolic content among all extracts. The phenolic contents are expressed in mg/g as the mean ± SE in Table 7.
Table 7.
Phenolic content present in B. diffusa leaves, stems, and roots.
2.3. In Vitro Antioxidant Assays
- DPPH Assay
The decoctions of the B. diffusa leaves and stems, as well as the ethanol extracts, showed the maximum scavenging activity against DPPH. The B. diffusa leaves showed the highest inhibition among decoctions. The IC50 values were calculated from the inhibitory concentrations of each extract using the trend line equation. The inhibitory concentrations are shown as the percentage inhibition for concentrations from 0–200 µg, along with their IC50 values, in Figure 1.
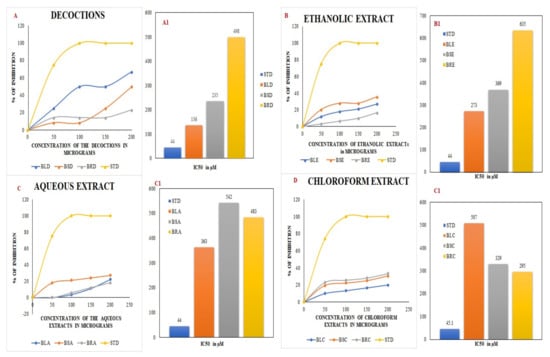
Figure 1.
DPPH assay using decoctions (A) and ethanolic (B), aqueous (C), and chloroform (D) extracts of B. diffusa. (A1–D1) depict the IC50 values obtained from the respective DPPH assays. BLD, BSD, and BRD are the decoctions of B. diffusa leaves, stems, and roots. The ethanolic extracts of B. diffusa leaves, stems, and roots are denoted as BLE, BSE, and BRE. The aqueous and chloroform extracts of B. diffusa leaves, stems, and roots are denoted as BLA, BSA, BRA, BLC, BSC, and BRC respectively. The values expressed in the graph are the means of triplicate samples. STD in the figure denotes the standard ascorbic acid.
2.3.1. FRAP Assay
The decoctions of the leaves, stems, and roots showed the maximum reducing power in the FRAP assay. The B. diffusa leaves showed the highest power among aqueous extracts, with lower reduction levels found in the chloroform extracts. The OD values obtained for the extracts in the concentration range 125–1000 µg are depicted in Figure 2.
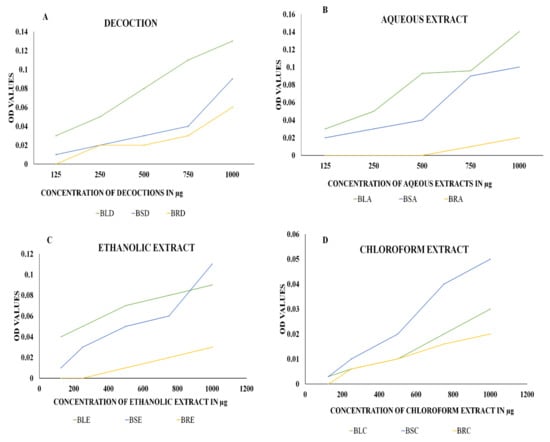
Figure 2.
The FRAP assay using (A) decoctions and (B) aqueous, (C) ethanolic, and (D) chloroform extracts of B. diffusa. The figures represent the reducing power of the extracts against ferric chloride. An increase in OD values represents increasing reducing power of the extracts with an increase in concentration measured at 700 nm. BLD, BSD, and BRD are the decoctions of B. diffusa leaves, stems, and roots. The ethanolic extracts of B. diffusa leaves, stems, and roots are denoted as BLE, BSE, and BRE. The aqueous and chloroform extracts of B. diffusa leaves, stems, and roots are denoted as BLA, BSA, BRA, BLC, BSC, and BRC, respectively.
2.3.2. ABTS Assay
In the ABTS assay, the maximum level of inhibition (about 100%) was achieved in the aqueous extracts of B. diffusa leaves and stems at 200 and 150 µg concentrations, respectively. The aqueous extracts and decoctions were similar to the standard ascorbic acid. The inhibitory concentrations are shown as the percentage inhibition for concentrations 0–200 µg in Figure 3.
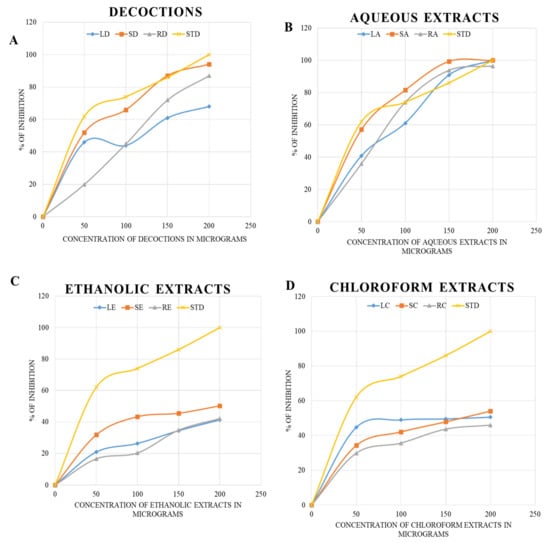
Figure 3.
The ABTS assay using decoctions (A) and aqueous (B), ethanolic (C), and chloroform (D) extracts of B. diffusa. The LD, SD and RD represents the decoction of leaf, stem and root respectively. The LA, SA, RA, LE, SE and RE represents the aqueous and ethanolic extracts. The chloroform extracts of leaf, stem and root are given as LC. SC and RC respectively. The STD refers to the standard used for ABTS assay.
2.4. Antimicrobial Activity
Antimicrobial activity was detected in the B. diffusa decoctions of leaves, stems, and roots, as well as the ethanolic extracts of leaves and roots. The aqueous and chloroform extracts did not show any antimicrobial resistance. The maximum inhibition of P. aeruginosa (ATCC 27853) was found in the decoctions of leaves and stems, as well as the ethanolic extract of roots. The maximum inhibition of bacterial growth was found at 200 µg concentration of the extracts, with a zone of about 8 mm. The zone of inhibition of various extracts is presented in mm as the mean ± standard error in Table 8.
Table 8.
Zone of inhibition of different extracts of B. diffusa leaves, stems, and roots against P. aeruginosa and S. aureus.
In terms of the antimicrobial activity against S. aureus (ATCC 25923), all extracts showed antibacterial activity except for the chloroform stem extract. The chloroform extract of leaves and roots showed inhibition zones of about 8 ± 0 mm and 4 ± 0 mm, respectively. The negative control ethanol was found to have an inhibition halo of about 4 ± 2 mm. The root ethanol extract exhibited the greatest antimicrobial activity, with an inhibition zone of about 20 mm. The results of the tests are depicted in Table 8.
The minimum inhibitory concentration (MIC) was determined for the extracts that performed well in the disc diffusion assay. The ethanolic extract that showed inhibition against P. aeruginosa exhibited an MIC of 50 µg. The leaf decoction and the aqueous and ethanolic extracts of roots exhibited MICs of 50 µg against S. aureus. The results are depicted in Figure 4a,b.
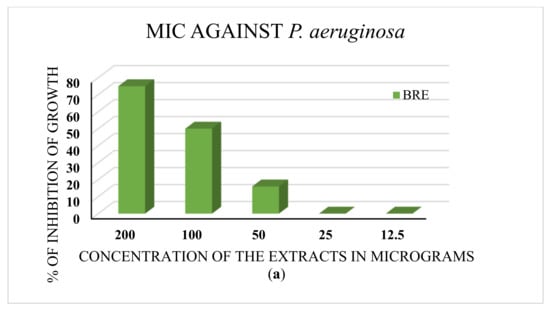
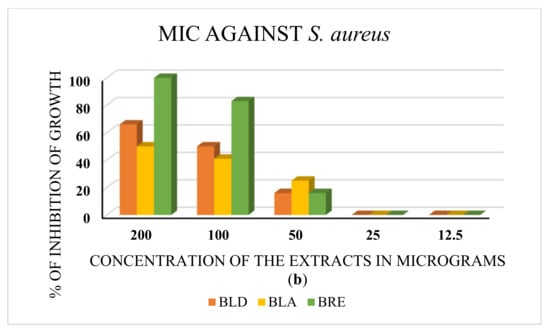
Figure 4.
(a) The MIC test against P. aeruginosa. BRE is the root ethanolic extract of B. diffusa. The minimum concentration of the extract with antibacterial activity is 50 μg. (b) MIC test against S. aureus. BLD, BLA, and BRE denote the leaf decoction, the leaf aqueous extract, and the root ethanolic extract of B. diffusa. All extracts showed inhibition of bacterial growth at 50 μg concentration (MIC).
2.5. GC–MS
The ethanolic extract of roots showed the maximum antimicrobial potential against both strains of bacteria. Since the ethanolic extract was prepared by cold extraction, the volatile compounds with antimicrobial activity were of interest; hence, the extract was subjected to GC–MS analysis. The peaks are shown in Figure 5, and the names of the compounds, along with their type, are mentioned in Table 9.
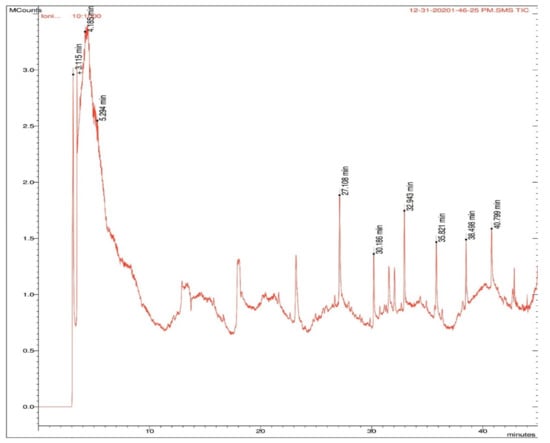
Figure 5.
Peaks obtained in GC–MS analysis with retention times in B. diffusa root ethanolic extract. The compounds identified at the retention times are listed in Table 9.
Table 9.
Different compounds obtained from GC–MS along with compound type and retention time.
2.6. Molecular Interaction Findings
The quorum-sensing regulator PqsR proteins from Pseudomonas aeruginosa were chosen as the molecular target for the current study. The chemical structures of the compounds identified by GC–MS were acquired from the NIST and PubChem databases. Molecular docking was conducted against 131 compounds utilizing GLIDE with the target protein, which generally prioritized results according to the program’s score calculation in the form of G-Score. The correctness of a docking pose is determined by the lowest-energy binding confirmation anticipated by the minimal scoring function. The G-score and GLIDE energy of the target proteins were all analyzed using the XP GLIDE docking technique. Table 10 depicts the interactions of amino acids with their bond lengths. According to the docking complex, the typical range of hydrogen bonds was roughly 3 Å. Our complex primary outcomes were below this range, indicating great interactions in the complexes. A total of 100 compounds successfully completed GLIDE docking, and the top-ranked results were highlighted. The ligand molecules with a cutoff GLIDE score below −7 are presented as 3D and 2D interaction diagrams (Figure 6, Figure 7, Figure 8 and Figure 9, Table 11).
Table 10.
Compounds obtained from crude extract of B. diffusa profiled from GC–MS exploited against the pathogenic bacterial quorum-sensing protein using molecular docking experiment. Complex interaction molecules and their minimum binding scores are listed; ARG209, TYR258, ILE236, and LEU197 interactions were conserved among the top four ranked molecules.
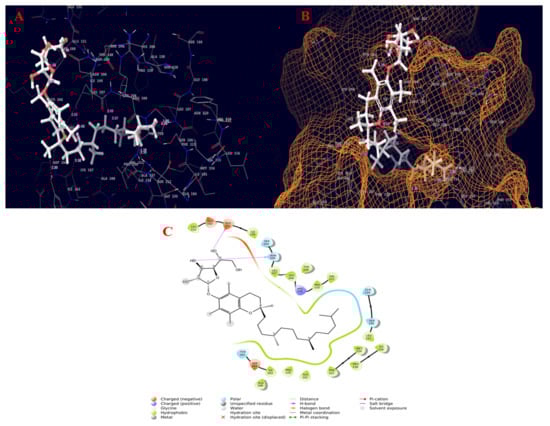
Figure 6.
Molecular interaction diagram of quorum-sensing responsive protein complexed with 2-(1,2-dihydroxyethyl)-5-[[2,5,7,8-tetramethyl-2-(4,8,12-trimethyltridecyl)-3,4-dihydrochromen-6-yl]oxy]oxolane-3,4-diol. (A) Molecular interactions in 3D space; (B) ligand occupancies in binding pocket of target protein; (C) 2D ligand interactions, highlighting the hydroxyl group as key for hydrogen bond interactions with the target protein.
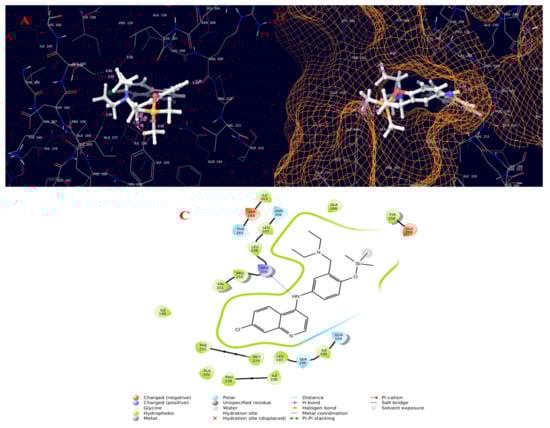
Figure 7.
Molecular interaction diagram of quorum-sensing responsive protein complexed with amodiaquine (TMS derivative). (A) Molecular interactions in 3D space; (B) ligand occupancies in binding pocket of target protein; (C) 2D ligand interactions, highlighting the amide bond as key for interactions with the target protein.
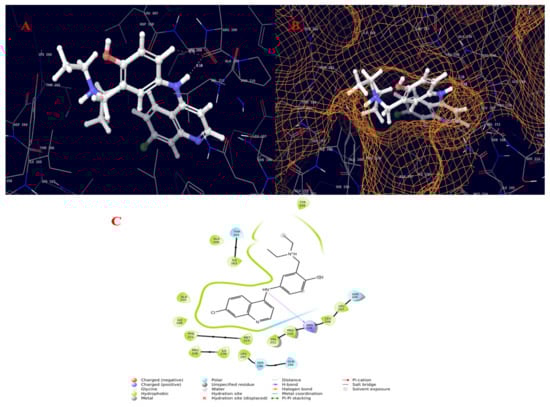
Figure 8.
Molecular interaction diagram of quorum-sensing responsive protein complexed with amodiaquine. (A) Molecular interactions in 3D space; (B) ligand occupancies in binding pocket of target protein; (C) 2D ligand interactions, highlighting the amide bond as key for interactions with the target protein.
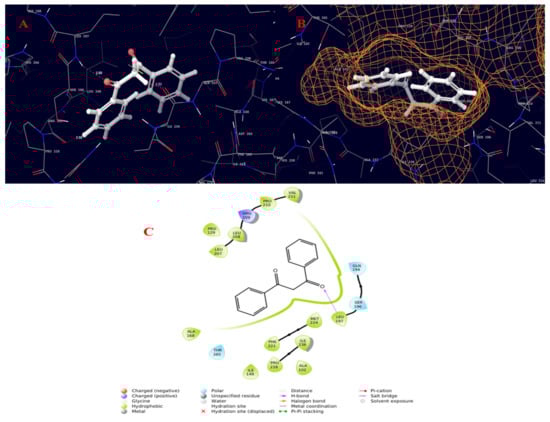
Figure 9.
Molecular interaction diagram of quorum-sensing responsive protein complexed with 22-propen-1-one, 3-hydroxy-1,3-diphenyl-. (A) Molecular interactions in 3D space; (B) ligand occupancies in binding pocket of target protein; (C) 2D ligand interactions, highlighting the epoxy bond as key for interactions with the target protein.
Table 11.
Compounds obtained from crude extract of B. diffusa profiled from GC–MS exploited against the pathogenic bacterial quorum-sensing protein using molecular docking experiment. Complex interaction molecules with minimum binding scores below the cutoff value of −5 are listed.
3. Discussion
The current study qualitatively and quantitatively evaluated decoctions and maceration extracts (aqueous, ethanol, and chloroform) of B. diffusa leaves, stems, and roots, as well as conducted in vitro antioxidant and antimicrobial activity tests. The phytoconstituents present in the ethanolic extract of B. diffusa roots were also analyzed using in silico molecular docking. In the qualitative tests, the decoction of B. diffusa roots showed the presence of most phytochemicals. Proteins, flavonoids, carbohydrates, amino acids, and phenols showed a higher presence in contrast to saponins, quinone, and phytosterols. The B. diffusa leaf decoction showed a higher presence of proteins, terpenoids, carbohydrates, amino acids, and phenols in contrast to flavonoids and phytosterols. The B. diffusa stem decoction showed a higher presence of proteins, quinone, terpenoids, amino acids, and phenols in contrast to carbohydrates, saponins, flavonoids, and phytosterols. The B. diffusa leaf aqueous extract showed a higher presence of proteins, flavonoids, carbohydrates, amino acids, and phenols in contrast to saponins, terpenoids, and phytosterols. The B. diffusa stem aqueous extract showed a higher presence of proteins, quinone, carbohydrates, amino acids, and phytosterols in contrast to flavonoids and terpenoids. The B. diffusa root aqueous extract showed a higher presence of flavonoids, terpenoids, and carbohydrates in contrast to proteins, phenols, and phytosterols. Ethanol has a similar polarity to water; thus, its extracts also exhibited a higher presence of carbohydrates and amino acids than terpenoids and alkaloids. The stem ethanolic extract showed a lower presence of alkaloids in contrast to terpenoids, carbohydrates, and amino acids. The leaf ethanolic extract exhibited a higher presence of carbohydrates and amino acids than phenols and alkaloids. Chloroform is a less polar solvent; thus, its extracts revealed the presence of proteins in B. diffusa stems, leaves, and roots. Furthermore, the leaf chloroform extract showed the presence of phenols, the stem chloroform extract showed the presence of carbohydrates, phenols, and alkaloids, and the root chloroform extract showed the presence of terpenoids, carbohydrates, alkaloids, and phytosterols. These results agree with those obtained in [30] for the whole-plant n-hexane extract of B. diffusa. This n-hexane extract was prepared by hot extraction, similar to the decoction process in this study; therefore, it can be concluded that heating the plant material enriched it with most phytochemicals. The leaf and stem decoctions and aqueous extracts were similar with respect to the presence of compounds.
Certain observations could be made in the qualitative study, such as the presence of alkaloids only in the ethanolic extracts and chloroform extracts of stems and roots. Proteins were not present in any of the ethanolic extracts. Saponins and flavonoids were present only in the water-based extracts, except for the mild presence of flavonoids in the ethanolic extract of roots. Carbohydrates and phenols were present in all extracts of roots and leaves. Amino acids were unanimously absent in all chloroform extracts. The leaf chloroform extract was found to exhibit the lowest number of compounds. In the quantitative test of chlorophyll content, the leaves were high in comparison to stems, with a greater contribution of chlorophyll a (1.03 mg/g) to the total chlorophyll of 1.43 mg/g than chlorophyll b (0.4 mg/g). The chlorophyll content was measured in fresh leaves and stems, and the results were in line with those in [31], where the level of chlorophyll a was higher than that of chlorophyll b. The carbohydrate content was found to be 127 mg/g in B. diffusa root aqueous extract, 122 mg/g in root decoction, and 43.1 mg/g in root ethanolic extract, higher values than found in the extracts of leaves and stems. The lowest level of carbohydrates was found in the stem ethanol and chloroform extracts (2.96 mg/g and 2 mg/g, respectively). The water-based extracts and decoctions showed the maximum level of carbohydrates in each part. In the leaf, the maximum carbohydrate content was found in the aqueous extract that (42.1 mg/g) in contrast to the decoction (19.86 mg/g). In the stem, the maximum carbohydrate content was found in the decoction (41.39 mg/g) in contrast to the aqueous extract (36.3 mg/g). A similar result was found in cabbage, where the mid rib portion that is stalky had a higher carbohydrate content than the leaf blades according to [32]. In our study, the B. diffusa root was slight stalky in comparison to leaf and stem, which might have favored the presence of carbohydrates. In the protein estimation, the decoction of the B. diffusa leaves showed the highest concentration (305.8 mg/g), followed by the aqueous extract of the leaves. In the amino-acid estimation of B. diffusa, the decoction had the highest content (104 mg/g), followed by the stem ethanolic extract. Among the root extracts, the ethanolic extract showed the maximum value (48.8 mg/g). Similar findings were obtained for Echinacae pallida, which exhibited about 120 mg/g of amino-acid content [33].
The total phenolic content estimated by [30] was found to be highest in the ethyl acetate stem extract, in line with the highest value found in the stem decoction in this study (235 mg/g). A higher concentration of phenols was also found in the aqueous root extract (105 mg/g). Among the leaf extracts, the greatest phenolic content was found in the ethanolic extract (165 mg/g). The stem chloroform extract exhibited about 70 mg/g of phenolic content. In terms of the total phenolic content, there was a significant difference between the qualitative and quantitative tests, as the leaf ethanolic extract and stem chloroform extract showed a high level of phenolic content despite a mild color change in qualitative tests. The total flavonoid content was found to be high in B. diffusa decoctions of leaves (70 mg/g), stems (60 mg/g), and roots (60 mg/g). This result is supported by [34], where the flavonoid content was found to be highest in solvents of high polarity (methanol vs. ethyl acetate and petroleum ether). In the aqueous and ethanol extracts of roots, the flavonoid content was found to be 50 mg/g in each case. The stem aqueous and leaf aqueous extracts exhibited total flavonoid contents of 50 mg/g and 12 mg/g, respectively. Among the solvents used, water and ethanol were most polar, revealing good agreement between quantitative and quantitative tests of flavonoids. The decoctions of B. diffusa leaves and stems showed the maximum antioxidant potential in the DPPH assay, with the former exhibiting more than 60% inhibition with an IC50 value of about 136 µg at 200 µg concentration of the extract. The stem and root decoctions exhibited about 50% and 23% inhibition, respectively, at 200 µg concentration with IC50 values of 235 and 498 µg, respectively. Among the aqueous extracts, the stems showed the maximum inhibition of about 27.2%, followed by the leaves (22.2%) and roots (18.1%). Among the ethanolic extracts, the stems showed the maximum inhibition at 200 µg concentration (35.8%) with an IC50 value of about 273 µg. The leaf ethanolic extract exhibited about 27.2% inhibition, while the root ethanolic extract exhibited about 16.6% inhibition, corresponding to their IC50 values of about 369 and 635 µg, respectively. The root chloroform extract exhibited about 33.3% inhibition of DPPH, which was the highest among chloroform extracts, with an IC50 value of about 295 µg. The leaf chloroform extract exhibited about 20% inhibition, while the stem chloroform extract exhibited about 30.5% inhibition, with IC50 values of about 507 and 329 µg, respectively. Among the results obtained, the leaves and stems showed their maximum activity in decoctions, while the root showed its highest inhibitory potential in chloroform extracts. This result obtained may be due to the polarity of the water and the heat used when preparing the decoction; similarly, the methanol extract of B. diffusa with hot extraction exhibited maximum DPPH radical scavenging activity in comparison to the n-hexane and ethyl acetate extracts in [30]. The root chloroform extract was an exception to the polarity-related observations, exhibiting good activity.
The FRAP assay analysis revealed the maximum reducing potential of ferric ions in the aqueous extract of B. diffusa leaves, for which the optical density value was 0.14 when measured at 700 nm. The stem aqueous extract also showed a higher level of reducing potential (0.11 optical density) than the ethanolic extract (0.09 optical density), decoction (0.10 optical density), and chloroform extract (0.05 optical density). The maximum reducing activity of root was observed in its decoction. In [35], the reducing power of the B. diffusa leaf methanol extract was higher than that of the chloroform extract, and both extracts were prepared without the involvement of heat. Hence, the polarity of the solvent plays a greater role than heat when extracting the compounds required for the reducing power assay. The B. diffusa roots required heat for the solubilization of compounds responsible for reducing power in the decoction. In the ABTS assay, the aqueous extracts and decoctions of B. diffusa leaves, stems, and roots exhibited maximum inhibition, with the aqueous extracts revealing similar inhibition to ascorbic acid used as a standard (100% inhibition at 200 µg concentration). The stem aqueous extract exhibited 100% inhibition at 150 µg concentration. These results are in agreement with the study on Hypericum cerastoids, with 92% inhibition in contrast to the standard ascorbic acid that showed 96% inhibition. In the antimicrobial assay, the highest zone of inhibition against the Gram-negative bacterium P. aeruginosa was found in the decoctions of B. diffusa leaves and stems, as well as root ethanol extract, at 200 µg concentration, whose zones of inhibition were about 8 mm in diameter. The B. diffusa root ethanol extract had antibacterial activity at concentrations from 100 to 200 µg, with zones of inhibition of about 7 mm at 150 µg and 8 mm at 200 µg concentration. The B. diffusa root ethanolic extract stood out with a zone of inhibition even at the minimum concentration. In the case of S. aureus, the ethanolic extract was found to have the largest inhibition zone of about 20 mm at 200 µg. These results are in line with those in [30], where the methanolic extract was determined to have the highest antimicrobial activity. The MIC tests further confirmed 50 µg as the minimum concentration of extracts with an effect on bacterial growth in the disc diffusion assay.
The B. diffusa root ethanolic extract was subjected to GC–MS analysis, revealing alkaloids, phenols, flavonoids, and terpenoids. Since the ethanolic extract was prepared by cold extraction, the volatile compounds were retained in the extract. In order to investigate the volatile compounds, present in the extract, GC–MS analysis was applied. Amodiaquine is an alkaloid known for its antimalarial properties [36]. Dipyridamole is an anti-platelet agent found to exert antitumor activity [37]. 6-Aza-5,7,12,14-tetrathiapentacene is an alkaloid found in the GC–MS analysis of sesame oil and Lilium candidum flowers used to treat patients with chronic lower back pain [38]. Colchicines are antimitotic agents, with an effective role in protecting the liver from various hepatotoxic agents [39]. ⍺-Tocopherol was found to be effective as an antitumor agent against oral cancer [40]. Brousso-flavonol D is an anticancer agent related to pancreatic cancer [41]. 3,4-Dihydroxymandelic acid, ethyl ester, tri-TMS is a terpenoid found to be an antiangiogenic agent with anticancer activity in the methanol extract of Rumex vasicarius [42]. Phytochemicals are chemical compounds that help plants fight pathogens. B. diffusa has been examined extensively for its pharmacological qualities, such as anticancer, anti-inflammatory, and antioxidant properties. Many bioactive substances are found in B. diffusa [43].
The PqsR is a protein target that is an important intermediate in activating the PqsE protein responsible for the development, virulence, and biofilm production of bacteria [44]. Ligand-based drug design was recommended to address P. aeruginosa virulence in [45]. 2-Heptyl-4-hydroxyquinoline (HHQ) and the Pseudomonas quinolone signal (PQS) are the two factors which can induce the overexpression of PqsR via the PqsABCDE operon, thereby increasing the expression of PqsE [46]. Therefore, when a ligand can bind to the PqsR protein, it can inhibit the binding of either HHQ or PQS and can act as a potential quorum-sensing inhibitor. Applying the molecular docking approach to our selected pathogenic bacteria, the quorum-sensing responsive protein showed common interactions with the top-ranked molecules featuring TYR258, ARG209, ILE236, and LEU197. The molecular docking results revealed good binding affinity with the crude extract explored using in vitro assays, exhibiting superior antibacterial activity against the tested pathogen at increasing concentrations, according to the antimicrobial investigation. The whole plant of B. diffusa is used in traditional medicine to treat diabetes, stress, dyspepsia, abdominal discomfort, inflammation, jaundice, spleen enlargement, heart problems, bacterial infections, elephantiasis, night blindness, corneal ulcers, different hepatic illnesses, epilepsy, infertility, and menstrual pain, anas well as viral infections [30]. 2-(1,2-Dihydroxyethyl)-5-[[2,5,7,8-tetramethyl-2-(4,8,12-trimethyltridecyl)-3,4-dihydrochromen-6-yl]oxy]oxolane-3,4-diol also known as ⍺-tocopherol-β-d-mannoside was patented for the treatment of benign prostatic hypertrophy (BPH) and related aging symptoms using herbal extracts of Ageratum sp. [47]. Amodiaquine and its analogues were found to exhibit antimalarial activity with an IC50 value of 0.004 [48].
4. Materials and Methods
4.1. Plant Collection
B. diffusa plant samples were collected from the Bharathiar University Campus, Coimbatore, Tamil Nadu, India. The plants were collected in the months of September to November 2019. The leaves, stems, and roots were separated and allowed to dry in the shade for about 6 weeks. B. diffusa was identified by the Botanical Survey of India, Tamil Nadu Agricultural University, Coimbatore, Tamil Nadu, India, with certificate number is BSI/SRC/5/23/2019/Tech./293. The chemicals used in the current study were purchased from Himedia Laboratories Pvt. Ltd., Mumbai, India and Central Drug House Pvt Ltd., New Delhi, India through their dealers.
4.2. Extraction
Maceration: The shade-dried parts of B. diffusa were powdered, sieved, and then stored in an airtight container for further use. Fifty milligrams of the powdered leaves, stems, and roots of B. diffusa were dissolved in 50 mL of distilled water, ethanol, or chloroform in an airtight container for about 48 h with frequent agitation. After 48 h, the solvents were filtered using quantitative filter paper and stored for further use.
Decoction: Fifty milligrams of the powdered plant samples were dissolved in 50 mL distilled water, which was kept in a boiling water bath for about 15 min. The mixture was filtered using quantitative filter paper and stored for further use [49].
4.3. Qualitative Tests
- Carbohydrates
Molisch’s test: The extract was mixed with 2 mL of Molisch’s reagent, and the mixture was shaken properly. Then, 2 mL of concentrated H2SO4 was poured carefully along the side of the test tube, which was observed for the appearance of a violet ring at the interface [50].
- Proteins
Xanthoproteic test: One milliliter of concentrated nitric acid was added to 2–3 mL of test solution in a test tube. A positive test is indicated by the formation of a white precipitate, which upon heating turns yellow and finally dissolves, imparting to the solution a yellow color. The solution is cooled before carefully adding ammonium hydroxide or sodium hydroxide in excess, whereby the yellow solution deepens into an orange color [40].
- Amino Acids
Ninhydrin test: Five drops of 0.2% ninhydrin solution in acetone were added to 1 mL of amino-acid solution. The mixture was boiled over a water bath for 2 min and allowed to cool, before observing the formation of a blue color [50].
- Flavonoids
Alkaline reagent test: Two milliliters of 2.0% NaOH mixture was mixed with aqueous plant crude extract; a concentrated yellow color was produced, which became colorless upon adding two drops of diluted acid to the mixture. This result showed the presence of flavonoids [51].
- Phenols
Lead acetate test: To 0.2 mL of extract, 2 mL of aqueous sodium carbonate was added, followed by the addition of 0.2 mL of Folin’s reagent. A color change to blue or gray indicated the presence of phenols [52].
- Alkaloids
Test for alkaloids: To 2 mL of extract, 2 mL of concentrated HCl was added. Then, a few drops of Mayer’s reagent were added. The presence of green color, white precipitate, or turbidity indicated the presence of alkaloids [53].
- Phytosterols
Salkowski’s test: The chloroform extract was treated with concentrated H2SO4 and observed for the formation of a red color [51].
- Saponins
Foam test: A fraction of the extract was vigorously shaken with 20 mL of water in a graduated cylinder for 15 min, which was observed for the presence of persistent foam [51].
- Terpenoids
Salkowski’s test: About 5.0 mL of extract was mixed with 2.0 mL of chloroform and 3.0 mL of concentrated H2SO4. A reddish-brown color at the interface indicated the presence of terpenoids [51].
- Quinone
HCl method: To 1.0 mL of extract, a few drops of concentrated HCl was added. A yellowish-brown color indicated the presence of quinone [40,41].
4.4. Quantitative Tests
- Chlorophyll
Chlorophyll was extracted from 1 g of the sample using 20 mL of 80% acetone. The supernatant was transferred to a volumetric flask after centrifugation at 5000 rpm for 5 min. The extraction was repeated until the residue became colorless. The volume in the flask was made up to 100 mL with 80% acetone. The absorbance of the extract was read in a spectrophotometer at 645 nm and 663 nm against an 80% acetone blank. The amount of total chlorophyll in the sample was calculated using the following formula: V total chlorophyll = 20.2 (A645) + 8.02 (A663) × V/1000 × W, where, V is the final volume of the extract, and W is the fresh weight of the leaves.
The amounts of chlorophyll a and b can be calculated as follows: 12.21 (A633) − 2.81 (A645) × V/1000 × W and 20.13 (A645) − 5.03 (A663) × V/1000 × W, respectively. The results are expressed as mg chlorophyll/g sample [54].
- Protein
The protein estimation was conducted using bovine serum albumin as a standard [55]. The plant extracts were taken in a concentration within the working standards, i.e., 40–200 µg. All tubes were made to 1.0 mL using distilled water, while 1.0 mL of distilled water served as a blank. Next, 5 mL of alkaline reagent was added to all tubes before incubating for 10 min at 37 °C. Then, 0.2 mL of Folin’s phenol reagent was added before incubating for 30 min. The intensity of the color developed was measured at 660 nm against the blank.
- Carbohydrate
Glucose was used as a standard for the carbohydrate analysis. The working standard was prepared at a concentration of 100 µg/mL. About 0.2 to 1.0 mL of the working standards were taken in test tubes, while 1.0 mL water served as a blank. The volume was made up to 1 mL in all tubes with distilled water along with the sample tubes, with a concentration range within the working standards. Then, 4 mL of anthrone reagent was added before heating for 8 min in a boiling water bath. The mixture was cooled rapidly and observed for the formation of a green to dark-green color at 630 nm [56].
- Amino acids
The amino-acid estimation was achieved using leucine as a standard [57]. Working standards within a concentration range of 20–100 µg were taken. Samples of plant extracts with concentration within the working standards were also taken, and all tubes were made to 1.0 mL along with the blank and standard. About 1.0 mL of ninhydrin reagent (0.8 g stannous chloride in 500 mL of 0.2 M citrate buffer, pH 5.0, added to 20 g of ninhydrin in 500 mL of acetone) was added to all tests tubes, which were left in a boiling water bath for about 20 min. About 5.0 mL of diluent made with an equal volume of propanol and water was added to all tubes before incubating for 15 min. The development of a purple color was read at 570 nm in a spectrophotometer.
- Flavonoids
About 1 mL of the test sample and 4 mL of water were added to a volumetric flask (10 mL volume). Then, 0.3 mL of 5% sodium nitrite and 0.3 mL of 10% aluminum chloride were added after 5 min. After 6 min of incubation at room temperature, 1 mL of 1 M sodium hydroxide was added to the reaction mixture. The final volume was immediately made up to 10 mL with distilled water. The absorbance of the sample was measured against the blank at 510 nm [53].
- Phenols
The phenol estimation was conducted using gallic acid as the standard. To varying concentrations of the standard and extracts, about 0.5 mL of Folin–Ciocâlteu reagent was added, and the mixture was incubated for 3 min. About 2.0 mL of sodium carbonate 20% was added, and the mixture was allowed to stand in the dark for 1 h. The blue color developed was measured at 650 nm [58].
4.5. In Vitro Antioxidant Assays
- DPPH Scavenging Assay
The DPPH assay was conducted using B. diffusa extracts of varying concentrations (50, 100, 150, and 200 μg) along with ascorbic acid standard at the same concentrations. About 3.0 mL of 0.1 mM DPPH dissolved in methanol was added to all tubes. The tube without any extract and 3.0 mL of DPPH served as the A0, while methanol was used as the blank. The mixture was allowed to react at room temperature for 30 min in the dark. After 30 min of incubation, the discoloration of the purple color was measured at 518 nm in a spectrophotometer [59]. The radical-scavenging activity was calculated as follows:
where A0 is the absorbance of the control, and A1 is the absorbance in the presence of various extracts.
- FRAP Assay
Different concentrations of extracts of B. diffusa (125, 250, 500, 750, and l000 μg) were made up to 1 mL with distilled water, and a tube with 1 mL of distilled water alone was used as the blank. About 2.5 mL of phosphate buffer (0.2 M, pH 6.6) and 2.5 mL of potassium ferricyanide (1%) were added to all extracts. The mixture was incubated at 50 °C for 20 min. A portion (2.5 mL) of trichloroacetic acid (10%) was added to the mixture, which was then centrifuged for 10 min at 1000× g. Then, 2.5 mL of the upper layer of the solution was mixed with 2.5 mL of distilled water and 0.5 mL of FeCl3 (0.1%), and the absorbance was measured at 700 nm in a spectrophotometer. A higher absorbance of the reaction mixture indicated a greater reductive potential of the extracts [60].
- ABTS Assay
The ABTS assay was performed using a diluted stock solution prepared by mixing an equal volume of 7 mM ABTS in phosphate-buffered saline and 2.4 mM potassium persulfate solution. The stock was left to incubate in the dark for about 14 h. The stock was diluted with the help of methanol or ethanol until the OD value reached 0.7 units at 734 nm. The plant extracts ranging in concentration from 50–200 µg were added to the test tubes and mixed with 1.0 mL of diluted ABTS solution. The mixture was left to incubate in the dark for about 7 min, and then the OD values were measured using a spectrophotometer. About 1.0 mL of the diluted ABTS solution was also incubated in a separate tube in the same manner, which served as the control. Ethanol or methanol was used as the blank. The percentage inhibition of ABTS was calculated as follows: (Ac − As/Ac) × 100, where Ac is the OD of the control, and As is the OD of the samples [61].
4.6. Antimicrobial Assay
- Agar disc diffusion method
The antimicrobial assay [62,63] was performed against the Gram-negative bacterium P. aeruginosa (ATCC 27853) and Gram-positive bacterium S. aureus (ATCC 25923) using the decoctions and aqueous, ethanol, and chloroform extracts of B. diffusa leaves, stems, and roots at concentrations of 100, 150, and 200 µg. The colony suspensions of the bacterial strain were maintained according to the 0.5 McFarland standard. Distilled water, ethanol, and chloroform were used as the negative controls, and a ceftazidime antimicrobial disc was used as the positive control for P. aeruginosa, while a vancomycin antimicrobial disc was used as the positive control for S. aureus. The medium used was Mueller–Hinton Agar. About 100 µL of microbial culture was spread all over the plate containing the medium. The discs immersed in the extracts of various concentrations were immediately placed on the plates after spreading the microbial culture. The plates were then incubated in an inverted position for about 16–18 and 24 h at 37 °C. After incubation, the plates were observed for the zone of inhibition, and its diameter was measured in mm. The antimicrobial assay followed the CLSI criteria.
An MIC test was performed in order to find the minimum concentration of the extracts with antibacterial activity, which performed well in the disc diffusion assay. The MIC using the broth dilution method was determined as a function of the turbidity measured in a spectrometer at 625 nm. The inhibition of bacterial growth was calculated as follows:
OD of positive control − OD of the sample/value of positive control − negative control × 100.
4.7. Computational Validation
- Molecular docking
All docking calculations were performed using the GLIDE program’s extra precision (XP) mode in the Maestro Platform of Schrodinger software. The docked ligand and protein interaction was assessed for optimum conformation using the best pose displayed in a pose viewer. The ligand interaction module was used to obtain the 2D interactions of protein and ligand (Schrödinger Release 2021-3: Glide, Schrödinger, LLC, New York, NY, USA, 2021). The three-dimensional structure with amino-acid interactions and active site cavity was analyzed in Maestro.
- Structure elucidation of small molecules
The metabolic compounds extracted from B. diffusa were chosen for this study; the molecular structures of the compounds were determined using GC–MS. Overall, 139 molecules were identified, the three-dimensional structures of which were retrieved from the NIST and PubChem databases in 2D and 3D SDF (Structure Data File) and Mol format (Supplementary Table S1). Using the Maestro platform with the LigPrep module, the molecular structures were computationally generated as 32 stereoisomers using OPLS4 force field energy minimization. Tautomers were created, and conformations of the ligand’s orientation were investigated (Schrödinger Release 2021-3:LigPrep, Schrödinger, LLC, New York, NY, USA, 2021).
- Target preprocessing
The quorum-sensing response, which involves three regulons, Las, Rhl, and Pqs, governs the expression of numerous virulence factors, and LasR and RhlR are transcriptional regulators of the Las and Rhl systems [48]. Accordingly, we chose the quorum-sensing responsive protein (PDB ID: 4JVC) as the target. The bond orders were assigned to the protein structure, hydrogens were added, zero-order bonds to metals and disulfide bonds were created, selenomethionines were converted to methionines, and missing side-chains were filled using Prime; the inhibitor present in the crystallized protein was removed, and the H-bonds were optimized, before final energy minimization using the OPLS4 force field.
- Statistical analysis
The values in the tables are expressed as the mean ± the standard error (n = 3). The IC50 values in the DPPH assay were calculated using the trend lines for each extract (y = ax + b), where y was considered to be 50, a and b were obtained from the graph, and x was the IC50 value obtained from the equation.
5. Conclusions
In the present study, hot extraction allowed for high-quality decoctions of B. diffusa leaves, stems, and root, whereas the use of organic solvents such as ethanol with higher polarity aided in the solubility of most alkaloids in comparison to flavonoids and phenols. The top-ranked molecules in B. diffusa extract were identified as 2-(1,2-dihydroxyethyl)-5-[[2,5,7,8-tetramethyl-2-(4,8,12-trimethyltridecyl)-3,4-dihydrochromen-6-yl]oxy]oxolane-3,4-diol, amodiaquine TMS derivative, amodiaquine, and 2-propen-1-one, 3-hydroxy-1,3-diphenyl, which were subsequently evaluated using GLIDE docking. The efficacy of these potential drug candidates was also evaluated through in silico molecular docking, which revealed the key molecular interactions, particularly hydrogen bond contacts. The present study revealed the difference between hot and cold extraction procedures, as well as the impact of solvent polarity, when extracting different compounds from B. diffusa, along with their antimicrobial activity against P. aeruginosa and S. aureus (infectious pathogens to humans). As potential candidates against Pseudomonas infection, our top-ranked molecules are expected to be carried over into clinical phase trials; however, the presented drugs require further confirmation using an in vivo model.
Supplementary Materials
The following supporting information can be downloaded: Table S1: Compound extracted from B. diffusa retrived from GCMS.
Author Contributions
Conceptualization, A.V.A., W.L. and B.B.; writing—original manuscript, M.K. and B.B.; methodology, data curation, and formal analysis, M.K. and K.B.; molecular docking, software, revision, and validation, A.M.; supervision, A.V.A.; Writing editing/revision, N.A.A.-D. and V.A.M., B.B; interpretation and review/revision, W.L., B.B. and A.V.A. All authors have read and agreed to the published version of the manuscript.
Funding
This research received no external funding.
Institutional Review Board Statement
Not applicable.
Informed Consent Statement
Not applicable.
Data Availability Statement
The data presented in this study are available on request from the corresponding author.
Acknowledgments
The authors are thankful to their respective institutes for their support. The authors are grateful to the International Center for Genetic Engineering and Biotechnology (ICGEB), New Delhi, for molecular docking and MMGBSA studies.
Conflicts of Interest
The authors declare no conflict of interest.
Sample Availability
Samples of the compounds are not available from the authors.
References
- Zengin, G.; Aktumsek, A.; Guler, G.O.; Cakmak, Y.S.; Yildiztugay, E. Antioxidant Properties of Methanolic Extract and Fatty Acid Composition of Centaurea urvillei DC. subsp. hayekiana Wagenitz. Rec. Nat. Prod. 2011, 5, 123–132. [Google Scholar]
- MacDougall, C.; Harpe, S.E.; Powell, J.P.; Johnson, C.K.; Edmond, M.B.; Polk, R.E. Pseudomonas aeruginosa, Staphylococcus aureus, and fluoroquinolone use. Emerg. Infect. Dis. 2005, 11, 1197–1204. [Google Scholar] [CrossRef] [PubMed]
- Arunkumar, M.; Gunaseelan, S.; Kubendran, A.M.; Mohankumar, V.; Anupam, P.; Harikrishnan, M.; Siva, A.; Ashokkumar, B.; Varalakshmi, P. Marine algal antagonists targeting 3CL protease and spike glycoprotein of SARS-CoV-2: A computational approach for anti-COVID-19 drug discovery. J. Biomol. Struct. Dyn. 2021, 39, 1–28. [Google Scholar] [CrossRef] [PubMed]
- Leistner, O.A. (Ed.) Seed Plants of Southern Africa: Families and Genera. Strelitzia 10; National Botanical Institute, Southern African Botanical Diversity Network (SABONET), Capture Press: Pretoria, South Africa, 2000; p. 775. [Google Scholar]
- Struwig, M.; Jordaan, A.; Siebert, S.J. Anatomy of the southern African Boerhavia and Commicarpus species (Nyctaginaceae). Bangladesh J. Plant Taxon. 2011, 18, 105–115. [Google Scholar] [CrossRef] [Green Version]
- Douglas, N.; Spellenberg, R. A new tribal classification of Nyctaginaceae. Taxon 2010, 59, 905–910. [Google Scholar] [CrossRef]
- Struwig, M.; Siebert, S.J. A taxonomic revision of Boerhavia (Nyctaginaceae) in southern Africa. S. Afr. J. Bot. 2013, 86, 116–134. [Google Scholar] [CrossRef] [Green Version]
- Selvaraj, D.; Shanmughanandhan, D.; Sarma, R.K.; Joseph, J.C.; Srinivasan, R.V.; Ramalingam, S. DNA barcode ITS effectively distinguishes the medicinal plant Boerhavia diffusa from its adulterants. Genom. Proteom. Bioinform. 2012, 10, 364–367. [Google Scholar] [CrossRef] [Green Version]
- Hiruma-Lima, C.A.; Gracioso, J.S.; Bighetti, E.J.; Robineou, L.G.; Brito, A.S. The juice of fresh leaves of Boerhaavia diffusa L.(Nyctaginaceae) markedly reduces pain in mice. J. Ethnopharmacol. 2000, 71, 267–274. [Google Scholar] [CrossRef]
- Olukoya, D.K.; Idika, N.; Odugbemi, T. Antibacterial activity of some medicinal plants from Nigeria. J. Ethnopharmacol. 1993, 39, 69–72. [Google Scholar] [CrossRef]
- Pari, L.; Satheesh, M.A. Antidiabetic activity of Boerhaavia diffusa L.: Effect on hepatic key enzymes in experimental diabetes. J. Ethnopharmacol. 2004, 91, 109–113. [Google Scholar] [CrossRef]
- Mehrotra, S.; Mishra, K.P.; Maurya, R.; Srimal, R.C.; Singh, V.K. Immunomodulation by ethanolic extract of Boerhaavia diffusa roots. Int. Immunopharmacol. 2002, 2, 987–996. [Google Scholar] [CrossRef]
- Anand, A.V.; Balamuralikrishnan, B.; Kaviya, M.; Bharathi, K.; Parithathvi, A.; Arun, M.; Senthilkumar, N.; Velayuthaprabhu, S.; Saradhadevi, M.; Al-Dhabi, N.A.; et al. Medicinal Plants, Phytochemicals, and Herbs to Combat Viral Pathogens Including SARS-CoV-2. Molecules 2021, 26, 1775. [Google Scholar] [CrossRef]
- Manikandan, R.; Anand, A.V.; Kumar, S. Phytochemical and in vitro Antidiabetic activity of Psidium Guajava leaves. Pharmacogn. J. 2016, 8, 392–394. [Google Scholar] [CrossRef] [Green Version]
- Bharathi, V.; Rengarajan, R.L.; Radhakrishnan, R.; Hashem, A.; Abd Allah, E.F.; Alqarawi, A.A.; Anand, A.V. Effects of a medicinal plant Macrotyloma uniflorum (Lam.) Verdc. formulation (MUF) on obesity-associated oxidative stress-induced liver injury. Saudi J. Biol. Sci. 2018, 25, 1115–1121. [Google Scholar] [CrossRef]
- Vijayakumar, K.; Rengarajan, R.L.; Radhakrishnan, R.; Anand, A.V. Hypolipidemic effect of Psidium guajava leaf extract against hepatotoxicity in rats. Pharmacogn. Mag. 2018, 14, 4. [Google Scholar]
- Antonelli, M.; Donelli, D.; Barbieri, G.; Valussi, M.; Maggini, V.; Firenzuoli, F. Forest volatile organic compounds and their effects on human health: A state-of-the-art review. Int. J. Environ. Res. Public Health 2020, 17, 6506. [Google Scholar] [CrossRef]
- Pinto, T.; Aires, A.; Cosme, F.; Bacelar, E.; Morais, M.C.; Oliveira, I.; Ferreira-Cardoso, J.; Anjos, R.; Vilela, A.; Gonçalves, B. Bioactive (Poly) phenols, Volatile Compounds from Vegetables, Medicinal and Aromatic Plants. Foods 2021, 10, 106. [Google Scholar] [CrossRef]
- Zhou, Q.; Li, G.; Ou-Yang, Z.; Yi, X.; Huang, L.; Wang, H. Volatile organic compounds profiles to determine authenticity of sweet orange juice using head space gas chromatography coupled with multivariate analysis. Foods 2020, 9, 505. [Google Scholar] [CrossRef]
- Miller, M.B.; Bassler, B.L. Quorum sensing in bacteria. Annu. Rev. Microbiol. 2001, 55, 165–199. [Google Scholar] [CrossRef] [Green Version]
- Allegretta, G.; Maurer, C.K.; Eberhard, J.; Maura, D.; Hartmann, R.W.; Rahme, L.; Empting, M. In-depth profiling of MvfR-regulated small molecules in Pseudomonas aeruginosa after quorum sensing inhibitor treatment. Front. Microbiol. 2017, 8, 924. [Google Scholar] [CrossRef]
- Huang, L.; Zhu, X.; Zhou, S.; Cheng, Z.; Shi, K.; Zhang, C.; Shao, H. Phthalic acid esters: Natural sources and biological activities. Toxins 2021, 13, 495. [Google Scholar] [CrossRef]
- Liu, X.; Li, Z.; Liu, S.; Sun, J.; Chen, Z.; Jiang, M.; Zhang, Q.; Wei, Y.; Wang, X.; Huang, Y.Y.; et al. Potential therapeutic effects of dipyridamole in the severely ill patients with COVID-19. Acta Pharm. Sin. B 2020, 10, 1205–1215. [Google Scholar] [CrossRef]
- Sweety, S.K.; Nepali, K.; Sapra, S.; Suri, O.P.; Dhar, K.L.; Sarma, G.S.; Saxena, A.K. Synthesis and Biological Evaluation of Chalcones having Heterosubstituent(s). Indian J. Pharm. Sci. 2010, 72, 801–806. [Google Scholar]
- Hawley, S.R.; Bray, P.G.; Park, B.K.; Ward, S.A. Amodiaquine accumulation in Plasmodium falciparum as a possible explanation for its superior antimalarial activity over chloroquine. Mol. Biochem. Parasitol. 1996, 80, 15–25. [Google Scholar] [CrossRef]
- Chang, E.L.; Simmers, C.; Knight, D.A. Cobalt Complexes as Antiviral and Antibacterial Agents. Pharmaceuticals 2010, 3, 1711–1728. [Google Scholar] [CrossRef] [Green Version]
- Gollo, A.L.; Tanobe, V.O.; de Melo Pereira, G.V.; Marin, O.; Bonatto, S.J.; Silva, S.; de Barros, I.R.; Soccol, C.R. Phytochemical analysis and biological activities of in vitro cultured Nidularium procerum, a bromeliad vulnerable to extinction. Sci. Rep. 2020, 10, 7008. [Google Scholar] [CrossRef]
- Bidossi, A.; Bortolin, M.; Toscano, M.; De Vecchi, E.; Romanò, C.L.; Mattina, R.; Drago, L. In vitro comparison between α-tocopheryl acetate and α-tocopheryl phosphate against bacteria responsible of prosthetic and joint infections. PLoS ONE 2017, 12, e0182323. [Google Scholar] [CrossRef] [Green Version]
- Kalinowska, M.; Gołębiewska, E.; Świderski, G.; Męczyńska-Wielgosz, S.; Lewandowska, H.; Pietryczuk, A.; Cudowski, A.; Astel, A.; Świsłocka, R.; Samsonowicz, M.; et al. Plant-Derived and Dietary Hydroxybenzoic Acids-A Comprehensive Study of Structural, Anti-/Pro-Oxidant, Lipophilic, Antimicrobial, and Cytotoxic Activity in MDA-MB-231 and MCF-7 Cell Lines. Nutrients 2021, 13, 3107. [Google Scholar] [CrossRef]
- Apu, A.S.; Liza, M.S.; Jamaluddin, A.T.M.; Howlader, M.A.; Saha, R.K.; Rizwan, F.; Nasrin, N. Phytochemical screening and in vitro bioactivities of the extracts of aerial part of Boerhavia diffusa Linn. Asian Pac. J. Trop. Biomed. 2012, 2, 673–678. [Google Scholar] [CrossRef] [Green Version]
- Pérez-Patricio, M.; Camas-Anzueto, J.L.; Sanchez-Alegría, A.; Aguilar-González, A.; Gutiérrez-Miceli, F.; Escobar-Gómez, E.; Voisin, Y.; Rios-Rojas, C.; Grajales-Coutiño, R. Optical method for estimating the chlorophyll contents in plant leaves. Sensors 2018, 18, 650. [Google Scholar] [CrossRef] [Green Version]
- Lee, J.; Dong, X.; Choi, K.; Song, H.; Yi, H.; Hur, Y. Identification of source-sink tissues in the leaf of Chinese cabbage (Brassica rapa ssp. pekinensis) by carbohydrate content and transcriptomic analysis. Genes Genom. 2020, 42, 13–24. [Google Scholar] [CrossRef] [PubMed]
- Carratù, B.; Boniglia, C.; Giammarioli, S.; Mosca, M.; Sanzini, E. Free amino acids in botanicals and botanical preparations. J. Food Sci. 2008, 73, C323–C328. [Google Scholar] [CrossRef] [PubMed]
- Sen, S.; De, B.; Devanna, N.; Chakraborty, R. Total phenolic, total flavonoid content, and antioxidant capacity of the leaves of Meyna spinosa Roxb., an Indian medicinal plant. Chin. J. Nat. Med. 2013, 11, 149–157. [Google Scholar] [CrossRef]
- Juneja, K.; Mishra, R.; Chauhan, S.; Gupta, S.; Roy, P.; Sircar, D. Metabolite profiling and wound-healing activity of Boerhavia diffusa leaf extracts using in vitro and in vivo models. J. Tradit. Complementary Med. 2020, 10, 52–59. [Google Scholar] [CrossRef]
- Chan, X.H.; Haeusler, I.L.; Win, Y.N.; Pike, J.; Hanboonkunupakarn, B.; Hanafiah, M.; Lee, S.J.; Djimdé, A.; Fanello, C.I.; Kiechel, J.R.; et al. The cardiovascular effects of amodiaquine and structurally related antimalarials: An individual patient data meta-analysis. PLoS Med. 2021, 18, e1003766. [Google Scholar] [CrossRef]
- Spano, D.; Marshall, J.C.; Marino, N.; De Martino, D.; Romano, A.; Scoppettuolo, M.N.; Bello, A.M.; Di Dato, V.; Navas, L.; De Vita, G.; et al. Dipyridamole prevents triple-negative breast-cancer progression. Clin. Exp. Metastasis 2013, 30, 47–68. [Google Scholar] [CrossRef]
- Rasoulinezhad, S.; Yekta, N.H.; Fallah, E. Promising pain-relieving activity of an ancient Persian remedy (mixture of white Lily in sesame oil) in patients with chronic low back pain. J. Fam. Med. Prim. Care 2019, 8, 634. [Google Scholar]
- Feng, G.; Kaplowitz, N. Colchicine protects mice from the lethal effect of an agonistic anti-Fas antibody. J. Clin. Investig. 2000, 105, 329–339. [Google Scholar] [CrossRef] [Green Version]
- Zulkapli, R.; Abdul Razak, F.; Zain, R.B. Vitamin E (α-Tocopherol) exhibits antitumour activity on Oral squamous carcinoma cells ORL-48. Integr. Cancer Ther. 2017, 16, 414–425. [Google Scholar] [CrossRef] [Green Version]
- Jeong, J.H.; Ryu, J.H. Broussoflavonol B from Broussonetia kazinoki Siebold Exerts Anti-Pancreatic Cancer Activity through Downregulating FoxM1. Molecules 2020, 25, 2328. [Google Scholar] [CrossRef]
- Farooq, M.; Abutaha, N.; Mahboob, S.; Baabbad, A.; Almoutiri, N.D.; Wadaan, M.A. Investigating the antiangiogenic potential of Rumex vesicarius (humeidh), anticancer activity in cancer cell lines and assessment of developmental toxicity in zebrafish embryos. Saudi J. Biol. Sci. 2020, 27, 611–622. [Google Scholar] [CrossRef]
- Sahu, S.N.; Satpathy, S.S.; Mohanty, C.; Pattanayak, S.K. Computational study to evaluate the potency of phytochemicals in Boerhavia diffusa and the impact of point mutation on cyclin-dependent kinase 2-associated protein 1. J. Biomol. Struct. Dyn. 2021, 20, 1–15. [Google Scholar] [CrossRef]
- Rampioni, G.; Pustelny, C.; Fletcher, M.P.; Wright, V.J.; Bruce, M.; Rumbaugh, K.P.; Heeb, S.; Cámara, M.; Williams, P. Transcriptomic analysis reveals a global alkyl-quinolone-independent regulatory role for PqsE in facilitating the environmental adaptation of Pseudomonas aeruginosa to plant and animal hosts. Env. Microbiol. 2010, 12, 1659–1673. [Google Scholar]
- Ilangovan, A.; Fletcher, M.; Rampioni, G.; Pustelny, C.; Rumbaugh, K.; Heeb, S.; Cámara, M.; Truman, A.; Chhabra, S.R.; Emsley, J.; et al. Structural basis for native agonist and synthetic inhibitor recognition by the Pseudomonas aeruginosa quorum sensing regulator PqsR (MvfR). PLoS Pathog. 2013, 9, e1003508. [Google Scholar] [CrossRef] [Green Version]
- Cao, H.; Krishnan, G.; Goumnerov, B.; Tsongalis, J.; Tompkins, R.; Rahme, L.G. A quorum sensing-associated virulence gene of Pseudomonas aeruginosa encodes a LysR-like transcription regulator with a unique self-regulatory mechanism. Proc. Natl. Acad. Sci. USA 2001, 98, 14613–14618. [Google Scholar] [CrossRef] [Green Version]
- National Center for Biotechnology Information. PubChem Patent Summary for US-2020000865-A1. 2022. Available online: https://pubchem.ncbi.nlm.nih.gov/patent/US-2020000865-A1 (accessed on 22 December 2021).
- Ongarora, D.S.; Strydom, N.; Wicht, K.; Njoroge, M.; Wiesner, L.; Egan, T.J.; Wittlin, S.; Jurva, U.; Masimirembwa, C.M.; Chibale, K. Antimalarial benzoheterocyclic 4-aminoquinolines: Structure-activity relationship, in vivo evaluation, mechanistic and bioactivation studies. Bioorg. Med. Chem. 2015, 23, 5419–5432. [Google Scholar] [CrossRef] [Green Version]
- Daswani, P.G.; Ghadge, A.A.; Birdi, T.J. Preparation of decoction of medicinal plants: A self-help measure? J. Altern. Complementary Med. 2011, 17, 1099–1100. [Google Scholar] [CrossRef]
- Auwal, M.S.; Saka, S.; Mairiga, I.A.; Sanda, K.A.; Shuaibu, A.; Ibrahim, A. Preliminary phytochemical and elemental analysis of aqueous and fractionated pod extracts of Acacia nilotica (Thorn mimosa). Vet. Res. Forum Int. Q. J. 2014, 5, 95. [Google Scholar]
- Gul, R.; Jan, S.U.; Faridullah, S.; Sherani, S.; Jahan, N. Preliminary phytochemical screening, quantitative analysis of alkaloids, and antioxidant activity of crude plant extracts from Ephedra intermedia indigenous to Balochistan. Sci. World J. 2017, 2017, 1–7. [Google Scholar] [CrossRef] [Green Version]
- Harborne, J.B.; Williams, C.A. Anthocyanins and other flavonoids. Nat. Prod. Rep. 2001, 18, 310–333. [Google Scholar] [CrossRef]
- Saeed, N.; Khan, M.R.; Shabbir, M. Antioxidant activity, total phenolic and total flavonoid contents of whole plant extracts Torilis leptophylla L. BMC Complementary Altern. Med. 2012, 12, 221. [Google Scholar] [CrossRef] [PubMed] [Green Version]
- Senthilkumar, M.; Amaresan, N.; Sankaranarayanan, A. Determination of Chlorophyll. In Plant-Microbe Interactions; Springer: Berlin/Heidelberg, Germany, 2021; pp. 145–146. [Google Scholar]
- Waterborg, J.H.; Matthews, H.R. The lowry method for protein quantitation. Methods Mol. Biol. 1984, 1, 1–3. [Google Scholar] [PubMed]
- Laurentin, A.; Edwards, C.A. A microtiter modification of the anthrone-sulfuric acid colorimetric assay for glucose-based carbohydrates. Anal. Biochem. 2003, 315, 143–145. [Google Scholar] [CrossRef]
- Moore, S.; Stein, W.H. A modified ninhydrin reagent for the photometric determination of amino acids and related compounds. J. Biol. Chem. 1954, 211, 907–913. [Google Scholar] [CrossRef]
- Ainsworth, E.A.; Gillespie, K.M. Estimation of total phenolic content and other oxidation substrates in plant tissues using Folin–Ciocalteu reagent. Nat. Protoc. 2007, 2, 875–877. [Google Scholar] [CrossRef]
- Shahwan, A.; El Aali, N.M.; Layas, Y.F.; El Tumi, S.G. Phytochemical content and antioxidant activities of Rhubarb (Rheum emodi). Natr. Resour. Hum. Health 2022, 2, 156–159. [Google Scholar] [CrossRef]
- Benzie, I.F.; Strain, J.J. The ferric reducing ability of plasma (FRAP) as a measure of “antioxidant power”: The FRAP assay. Anal. Biochem. 1996, 239, 70–76. [Google Scholar] [CrossRef] [Green Version]
- Zheleva-Dimitrova, D.; Nedialkov, P.; Kitanov, G. Radical scavenging and antioxidant activities of methanolic extracts from Hypericum species growing in Bulgaria. Pharmacogn. Mag. 2010, 6, 74. [Google Scholar] [CrossRef] [Green Version]
- Kirby, W.M.; Yoshihara, G.M.; Sundsted, K.S.; Warren, J.H. Clinical usefulness of a single disc method for antibiotic sensitivity testing. Antibiot. Annu. 1957, 892, 1956–1957. [Google Scholar]
- Tahir, F.; Sonibare, M.; Yagi, S.M. Comparative chemical profiling and antimicrobial activity of Nigella sativa seeds oils obtained from different sources. Natr. Resour. Hum. Health 2022, 2, 194–199. [Google Scholar] [CrossRef]
Publisher’s Note: MDPI stays neutral with regard to jurisdictional claims in published maps and institutional affiliations. |
© 2022 by the authors. Licensee MDPI, Basel, Switzerland. This article is an open access article distributed under the terms and conditions of the Creative Commons Attribution (CC BY) license (https://creativecommons.org/licenses/by/4.0/).