Abstract
In crystalline molecular solids, in the absence of strong intermolecular interactions, entropy-driven processes play a key role in the formation of dynamically modulated transient phases. Specifically, in crystalline simvastatin, the observed fully reversible enantiotropic behavior is associated with multiple order–disorder transitions: upon cooling, the dynamically disordered high-temperature polymorphic Form I is transformed to the completely ordered low-temperature polymorphic Form III via the intermediate (transient) modulated phase II. This behavior is associated with a significant reduction in the kinetic energy of the rotating and flipping ester substituents, as well as a decrease in structural ordering into two distinct positions. In transient phase II, the conventional three-dimensional structure is modulated by periodic distortions caused by cooperative conformation exchange of the ester substituent between the two states, which is enabled by weakened hydrogen bonding. Based on solid-state NMR data analysis, the mechanism of the enantiotropic phase transition and the presence of the transient modulated phase are documented.
1. Introduction
Crystal polymorphism, a phenomenon that occurs in both organic and inorganic solids, is defined as the ability of a compound to crystallize in different crystalline phases. In general, this phenomenon is associated with different arrangements and/or conformations of molecules in the crystal lattice and is controlled by intermolecular interactions in the crystal lattice [1]. Since polymorphs differ in essentially every property, determining the correct form of a compound is very important in many areas of materials research. Especially in the pharmaceutical industry, special attention must be paid to the production of the desired crystal modification. This requirement stems from the fact that any undesirable polymorphic transformation can alter the solubility, bioavailability and/or chemical stability of the drugs produced. This is why polymorphism, a difficult-to-predict phenomenon, continues to be the focus of intensive research [2,3].
In this respect, dynamic processes caused by weakened intermolecular interactions in the crystal lattice must be seriously considered. This is because completely rigid molecules are rather rare and a significant fraction of organic compounds contain rotatable bonds and molecular units that allow conformational flexibility. In many cases, internal molecular motions are not completely quenched, even at low temperatures. Rather, it is reasonable to assume that dynamic processes have a substantial impact not only on the chemical reactivity, solubility and bioavailability of different polymorphs but also on the mechanism of polymorphic transitions.
A typical representative of such compounds is simvastatin (Figure 1). Although active pharmaceutical ingredients (APIs) have long been used to control hypercholesterolemia, new low-temperature polymorphic APIs were serendipitously discovered in 2010 [4]. Later in 2018, Simões et al. [5] investigated the three-fold polymorphism of simvastatin, exploiting X-ray, calorimetry and molecular-simulation methods to investigate the related structural, conformational and thermodynamic aspects. In the present study, we report a detailed analysis of simvastatin polymorphisms and focus on unravelling the dynamical nature of the disorder in its high-temperature polymorph. Particular attention is given to the interpretation of the segmental dynamics of its molecules in the crystal lattice, especially in the context of its two reversible structural transitions. In this respect, segmental dynamics are experimentally analyzed over a wide range of temperatures, thus providing information on motional frequencies and amplitudes. In light of the obtained information on segmental dynamics, the intermolecular interactions of all three polymorphs of simvastatin are evaluated with nuclear magnetic resonance (NMR) crystallography, which has already demonstrated its remarkable potential [6,7,8,9,10,11,12,13,14]. We believe that the presented data on the role of segmental dynamics in the formation of new polymorphic forms of simvastatin can provide general information for understanding phase transformations in solid systems with substantial entropy changes.
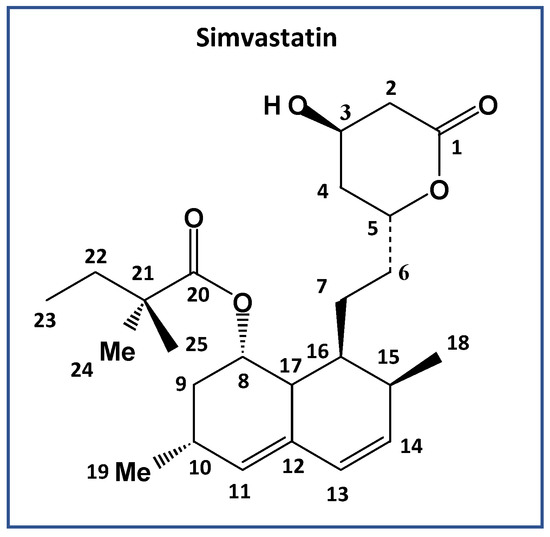
Figure 1.
Chemical structure and numbering of simvastatin, C25H38O5.
2. Results
2.1. Thermal Analysis
Differential scanning calorimetry (DSC), which can be used to examine melting, crystallization and glass transition temperatures, heat capacity and enthalpy, is one of the most suitable thermal techniques for characterizing organic solids. The ease with which this technique can monitor the interconversion between different crystal modifications induced by energy added or removed during DSC experiments contributes to its high potential. Because metastable forms can spontaneously convert to more stable forms and vice versa, DSC measurements can reveal unknown crystal modifications. A DSC thermogram of simvastatin (Figure 2) shows two structural transitions occurring at T1 = 272 and T2 = 232 K (exothermic when cooled). These events are reversible, independent of the heating/cooling rate and exhibit negligible hysteresis. The observed processes correspond to solid–solid inter-conversions between three crystal modifications. As both these transitions are reversible, simvastatin exhibits enantiotropic behavior in the temperature range from 213 to 373 K.
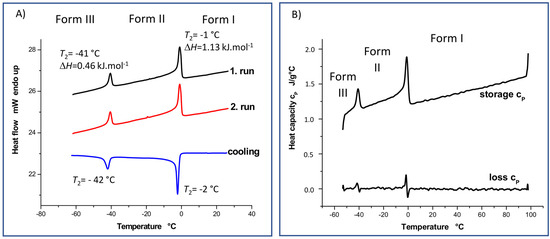
Figure 2.
DSC (A) and DDSC (B) thermograms measured for simvastatin at temperatures ranging from −60 to +30 °C and from −60 to +100 °C, respectively.
The lack of temperature hysteresis and the specific λ shape are signatures of second-order phase transitions, which usually accompany the order–disorder type of transitions [15], although a λ-transition has also been observed recently for a disorder–disorder transition in molecular crystals [16]. It is interesting to see that the measured ΔH values associated with both these transitions are rather low (ΔH = 1.13 and 0.46 kJ.mol−1, at T1 and T2, respectively), which is consistent with the exceptionally small changes of the unit–cell parameters upon both these phase transitions. The observed phase-transition data can be further exploited to evaluate the entropy changes associated with both solid–solid phase transitions (ΔS = 4.15 and 1.98 J·mol−1·K−1, at T1 and T2, respectively). One can deduce from these entropy changes that the extent of disorder is increased more significantly upon the phase transition from Form II to Form I. Still, the respective disorder needs to be limited only to certain molecular segments as long as the melting of Form I into liquid is accompanied by a significantly larger entropy change of 77.96 J·mol−1·K−1 [17].
It is worth emphasizing that a significant decrease in the heat flow and heat capacity was observed above the transition temperature T1 (specific heat capacity, cp, is reduced by about 0.102 J·g−1·K−1, Figure 2), which is consistent with the findings of Simões et al. [16]. Such a decrease in heat capacity is usually explained by the increase in molecular order, typically occurring upon the crystallization of liquids or glasses. In this case, however, it would be surprising if a higher-order system (simvastatin, Form I) occurred at higher temperatures, while the low-temperature forms of simvastatin would be considered to be more disordered. Based on the calorimetric heat capacities for individual polymorphs, the entropy changes due to heating of the Form II within the whole temperature interval of its thermodynamic stability, thus from T2 to T1, can be evaluated to 81.5 J·mol−1·K−1. For comparison, an analogous entropy change in the same temperature interval can be estimated to only 71.6 J·mol−1·K−1. A possible explanation of this unusual behavior of heat capacities and entropies might indeed arise from the disordered nature of the Forms II and I. Taking the close structural similarity of all three simvastatin polymorphs into account, this appreciably larger entropy increase in the heated Form II could be explained through the gradual temperature-induced turning on of the dynamic disorder on Form II, which is discussed below.
Still, the high-temperature Form I needs to exhibit the highest entropy among the polymorphs above T1, which can appear to contradict the observed heat capacity trends. Significant crossovers of the heat capacities of the polymorphs at lower temperatures and/or a more important residual entropy inherent to the Form I can explain why its entropy is the highest, although it is barely possible to verify these hypotheses experimentally due to the minimal hysteresis of the polymorphic phase transitions.
2.2. Variable-Temperature 13C CP/MAS NMR Spectroscopy
In our previous work [18], using the combination of spectral editing and two-dimensional correlation techniques including 13C cross-polarization polarization-inversion (CPPI), solid-state attach-proton-test (SoS APT) and the transfer-dephasing-optimized refocused 13C CP-INADEQUTE experiment, we achieved a complete signal assignment of 13C NMR resonances of Simvastatin Form I. Subsequently, using the 1H–13C through-bond and through-space HETCOR experiments we identified the resonance frequencies of the corresponding hydrogen atoms. In our current work, in order to verify the proposed signal assignment, the previous experimentation was supplemented by GIPAW DFT calculations of the 13C and 1H shielding parameters which are summarized in the Supplementary Materials (see Tables S1 and S2, and Figures S1 and S2; and the resulting MAGRES files and PDB files). In this regard, the overlay of the calculated and experimental 1H–13C correlations shows that all 1H and 13C resonances are appropriately mapped out and the proposed signal assignment is reliable and correct (Figure 3).
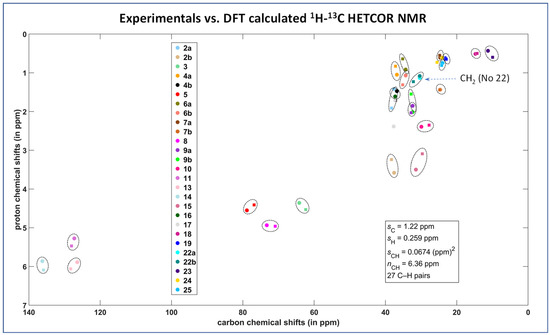
Figure 3.
Comparison between theory and experiment for the 1H–13C HETCOR spectrum of Form I of simvastatin. The measured and predicted data are marked with squares and circles, respectively (the atom numbering is detailed in Supplementary Materials, Tables S1 and S2). Statistical parameters, which are shown in the inset, are specified in the Section 5.
In the next step of our investigation, on the basis of the complete assignment of 13C NMR resonances, the variable-temperature 13C CP/MAS NMR spectra clearly identified the molecular sites whose local environment was considerably affected by phase transformations. At room temperature, the recorded 13C CP/MAS NMR signals of simvastatin were narrowed, with a linewidth mostly below 20 Hz. This indicates a highly ordered system without static structural defects (Form I). During cooling, a new set of 13C NMR signals appeared at approximately 274–269 K (Figure 4), indicating the formation of a new Form II crystal. In the temperature range of 272–232 K, the 13C resonance frequencies exhibited a strong temperature dependence, while the signals of methyls in the ester substituent (C23–C25) showed extensive broadening. Below approximately 247–242 K, all the detected NMR signals split into broad doublets whose resonance frequencies exhibited a pronounced temperature dependence (Figure 5). The signal of carbonyl carbon C1 was the only exception, suggesting that the local structure in this part of the simvastatin molecule was thermally stable. The signal broadening and temperature-induced splitting then clearly revealed an extensive conformation exchange process. As the temperature continued to decrease, the process of signal broadening was reversed, and the signals exhibited a distinct narrowing around the second transition temperature (T2 = 232 K). Below this temperature, the 13C NMR signals no longer exhibited considerable temperature dependences, and the two detected sets of 13C CP/MAS NMR signals corresponded to two symmetry-independent molecules in the low-temperature Form III.
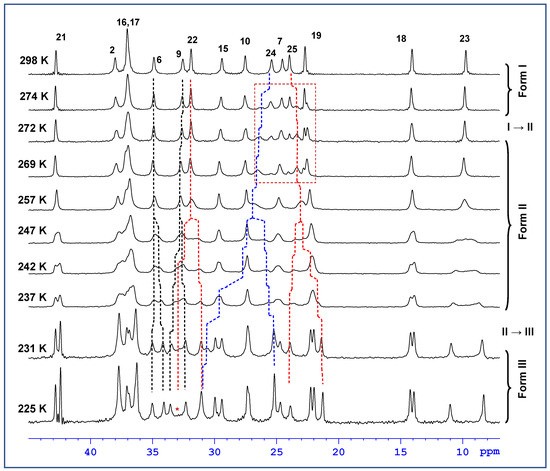
Figure 4.
Expanded part of the variable temperature 13C CP/MAS NMR spectra of simvastatin, measured in the temperature range 231–298 K. Asterix * indicates position of a broadened signal.
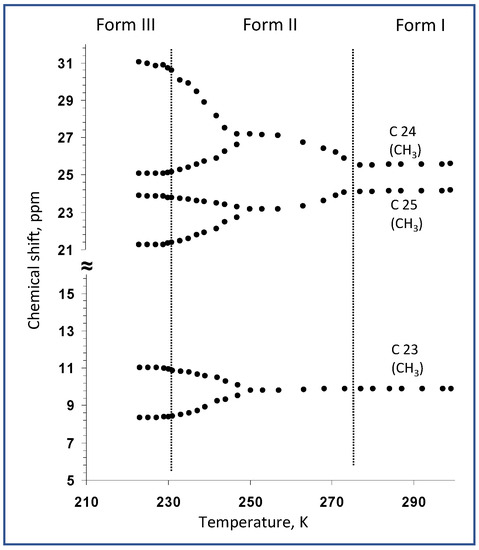
Figure 5.
Temperature dependences of 13C NMR chemical shifts of carbons of the ester tail, measured in the temperature range of 300 to 220 K.
The crystal structures of simvastatin were optimized by plane-wave density-functional theory (PW DFT) calculations, and their NMR chemical shielding was predicted using the gauge-including projector augmented wave (GIPAW) approach, as detailed in the Materials and Methods section. Importantly, the isotropic 13C and 1H chemical shieldings obtained by the GIPAW method for the PW DFT structure of the Form I crystal agreed well with the corresponding experimental 13C and 1H chemical shifts: the linear regression model had a standard deviation of 1.45 ppm and an adjusted R2 value of 0.99927 for 13C and 0.25 ppm and 0.97869 for 1H (the data are listed in the Supplementary Materials Tables S1 and S2 and Figures S1 and S2, respectively). The PW DFT geometries were used to obtain the structural parameter values discussed below.
Although the interconversion between crystal forms is a first-order transition that should occur instantly within a narrow temperature region according to thermodynamics, the recorded ssNMR spectra revealed much more gradual and complex processes. At first, the apparent coexistence of two crystal modifications (Forms I and II) in the temperature region 274–268 K around the transition I → II (Figure 4, red box) might be explained by a temperature gradient within the sample. Temperature gradients within the sample induced by the frictional heating of rapidly rotating rotors have been shown to reach up to 12 K at a spinning speed of 17 kHz [19]. At the spinning speed of 10 kHz applied during variable-temperature experiments, the gradient reached approximately 4–5 K, which corresponds well with the temperature region of the apparent coexistence of both crystal modifications. In this regard it is worth mentioning that the temperature gradient normally reaching up to ca. 12 K at 17 kHz in a 4 mm rotor can be reduced to ca. 1 K by applying the KelF spacer [19]. On the other hand, by using this spacer the amount of the sample is also significantly reduced, which would lead to a substantial increase in the experimental time required to reach an acceptable signal-to-noise ratio. Therefore, we decided to only reduce the spinning frequency to keep the temperature gradient in the acceptable limits mentioned above.
On the other hand, as indicated by the strong temperature dependences and severe broadening of some 13C NMR signals, extensive dynamic processes occurred not only in crystalline Form II but also in Form III. This was due to the asymmetry of the observed doublets. The asymmetric behavior of the individual components of the doublets was particularly apparent for the signals of the C22 methylene units in the nonequivalent molecules of simvastatin. While the component of the doublet resonating at approximately 31 ppm was relatively narrow, the second component at approximately 37 ppm was near the detection limit (Figure 4, see the asterisk in the spectrum measured at 225 K). This unusual broadening has been detected and described for crystalline poly(ethylene oxide) when the competition between segmental motions and dipolar decoupling leads to the destructive interference of NMR signals [20,21,22]. Thus, this finding indicates the existence of some residual motional disorder, even at temperatures below 220 K. Consequently, to better understand all the observed changes in 13C NMR chemical shifts, segmental dynamics, including motional frequencies and amplitudes, must be thoroughly investigated.
2.3. High-Frequency Motions
It has long been known that, in addition to their structure, molecular dynamics determines the physical properties of organic substances over a wide time range, from picoseconds to seconds. High-amplitude motions have been found in both amorphous systems and seemingly rigid crystallites [6,23]. Thus, the analysis of segmental dynamics is an important step toward understanding any solid–solid phase transitions. In this regard, two distinctive types of local motions are easily distinguishable via nuclear spin relaxation measurements: (i) high-frequency motions (librations, rotations and jumps of small groups with frequencies of approximately hundreds of MHz), which are probed by measurements of T1 relaxation times in the laboratory reference frame; and (ii) medium-frequency motions (approximately tens of kHz) involving movements of larger molecular segments, which are monitored by T1ρ relaxation experiments in the rotating frame. The temperature dependences of the determined relaxation times provide the most information. Ideally, a logarithmic plot of relaxation rates (ln(1/T1)) vs. inverse temperature (1/T) should exhibit an ∧-shaped curve with a maximum at the temperature where the relaxation mechanisms are the most effective. This is roughly reached when the segmental motion frequencies are close to the resonance frequency of the relaxing nucleus (e.g., 125 MHz for 13C at 11.7 T, T1 relaxation times) or to the frequency of the rotating rf field applied for spin locking (usually 10–100 kHz, T1ρ relaxation time). Furthermore, using the simplified approach, it is assumed that if the relaxation time increases with increasing temperature, the segmental motions are fast (correlation frequencies are higher than the resonance frequency), and that if the relaxation time decreases with increasing temperature, the internal motions are relatively slow. According to a simple Arrhenius function 1/T1 = A·exp(E*/RT) the activation energies (E*) of the segmental motions are then obtained from the slope of the linear parts of these dependences.
According to the abovementioned rules, the variable-temperature T1(13C) relaxation measurements reveal that the lactone ring and bicyclic part of the simvastatin molecule were rigid in the high-temperature crystal Form I. Additionally, the CH2 groups in the ethylene linker (C6, see Figure 6) were unlikely to have high segmental dynamics.
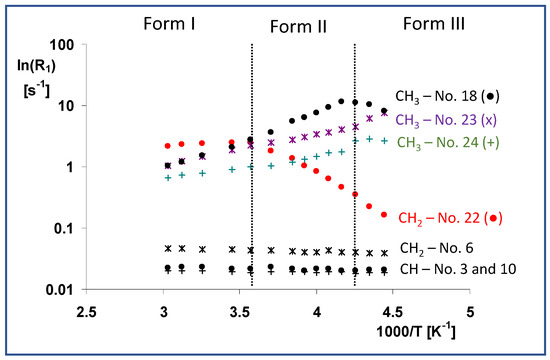
Figure 6.
Temperature dependences of T1(13C) relaxation times of the selected units (CH—No. 3 and 10, CH2—No. 6 and 22 and CH3—No. 21, 22, and 25), measured in the temperature range of 330 to 220 K. These dependences are expressed as ln(R1) vs. inverse temperature 1/T, where the relaxation rate is defined as R1 = 1/T1(13C).
On the other hand, very short T1 relaxation times ranging from 0.4 to 1.1 s can directly identify molecular segments undergoing high-frequency motions. As expected, these are predominantly methyl groups and fast rotation and three-site jumps have been observed even in crystalline solids. For instance, assuming three-site jumps were the dominant motion and applying a procedure recently used by J.M. Njus [24], we determined the angular correlation times τc of the methyl groups, which ranged from 4.8 × 10⁻¹¹ to 1.1 × 10⁻¹⁰ s under standard laboratory conditions. In addition to the methyl groups, however, the whole ester tail moves quickly with a comparable correlation frequency, as indicated by the very short relaxation times (0.4–0.5 s) of the corresponding methylene group (C22). According to a rough estimate based on the linear but still rising temperature dependence of the relaxation rate, the dominant motion of the whole ester tail in crystal Form I had a correlation time of less than 8.0 × 10⁻⁹ s. The first crystal phase transition (Form I → Form II), however, did not dramatically change the motional behavior of the methyl groups, and their correlation times increased monotonically, reaching 9.5 × 10⁻¹¹–6.3 × 10⁻¹⁰ s at 240 K. Similarly, the corresponding activation energies were nearly unchanged (Figure 6).
In contrast, and according to the Arrhenius function mentioned above, the very fast and almost unrestricted motion of the whole ester tail in Form I was characterized by the low activation energy of the motion of the ester CH2 group (carbon atom C22), E* = 4.1 kJ·mol−1, which became dramatically restricted after the transition to Form II, when the activation energy reached E* = 30.0 kJ·mol−1. The reversal of the temperature dependence of the relaxation rate indicates that the correlation time of the ester tail motion was greater than approximately 8.0 × 10⁻⁹ s (it increased with decreasing temperature).
The unchanged trend in the sharp decrease in T1 relaxation times of the ester CH2 group (carbon atom C22) was also apparent after the second phase transition from crystal Form II to Form III. Although the relatively long T1 (13C) relaxation time at 225 K (6.1 s) indicates gradually decreasing dynamics, the high-frequency motions of the ester tails persisted even below this relatively low temperature. In addition, the transition to crystal Form III was accompanied by considerable changes in the dynamics of the methyl rotations. The observed inversion of the temperature dependence of the relaxation rates (methyl carbons C18 and C24) indicates that the correlation times of their rotation had increased to greater than 8.0 × 10⁻⁹ s.
2.4. Medium-Frequency Motions
When we analyzed the relatively slow segmental motions, we found that the methylene group atom C22 and the neighboring methyl C23, both localized in the ester tail, exhibited remarkable motion activity. These units, specifically those in metastable transient modification II, executed strongly thermally activated segmental motions. Moreover, the obtained temperature dependence and maximum relaxation rate R1ρ (Figure 7) indicate that the overall correlation time of this motion at 250 K was close to approximately 16 μs (1/62.5 kHz, intensity of spin locking field). It is worth noting that the observed maximum relaxation rate corresponded to the splitting/coalescence temperature of the 13C NMR signals. In the low-temperature Form III, these motions appeared to be considerably quenched deep in the energy depression, exhibiting negligible thermal activity. On the other hand, the weak thermal dependence of the relaxation rate R1ρ observed for these units (C22 and C23) in high-temperature Form I indicates that all the energy barriers had already been overcome, thus allowing free unhindered rotation motions for the whole ester group. In this regard it is worth noting that the obtained experimental ss-NMR relaxation data are in good agreement with the previously published molecular dynamics simulations [5,25].
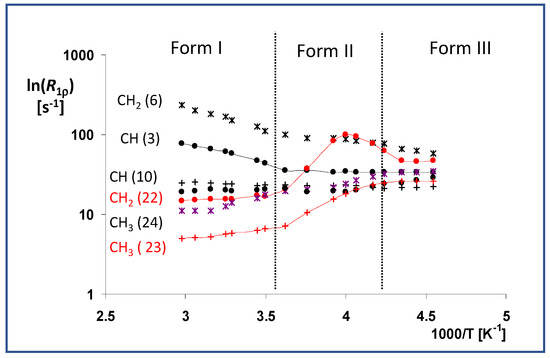
Figure 7.
Temperature dependences of the T1ρ (13C) relaxation times of the selected units (CH—No. 3 and 10, CH2—No. 6 and 20 and CH3—No. 21, 22, and 25), measured in the temperature range of 330 to 220 K. These dependences are expressed as ln(R1ρ) vs. inverse temperature 1/T, where the relaxation rate is defined as R1ρ = 1/T1ρ(13C).
2.5. Motional Amplitudes
A description of molecular dynamics would not be complete without knowledge of the motional amplitudes of individual segments. Recent developments in recoupling techniques have provided new ways to probe the geometry of segmental motion. In particular, 1H–13C separated local-field experiments [26,27,28,29] have enabled straightforward site-specific measurements of dipolar couplings that directly contain this information. This is because any molecular motion with a correlation time of less than approximately 40 μs causes the averaging of one-bond 13C–1H dipolar interactions. Consequently, the 1H–13C spin–pair dipolar interactions in the CH and CH2 units in powdered solids produce Pake’s doublets, with peak-to-peak splitting reflecting the effective dipolar coupling constants DCH [26,27,28,29,30,31]. Assuming that the C–H chemical bonds have a constant length, the reduced splitting of the 1H–13C dipolar spectra relative to the theoretical rigid limit value, DCH,rig, indicates the presence of segmental motion. The rigid limit value of one-bond 13C–1H dipolar interactions is ca. 23.5 kHz. However, under the applied experimental conditions (see Materials and Methods), the rigid-limit value was scaled down by a scaling factor of cos(54.7°) to be ca. 13.2 kHz. The one-bond dipolar spectra could easily be extracted as vertical slices from the 2D 1H–13C PILGRIM spectra shown in Figure 8A. The analysis of the site-specific dipolar profiles measured at temperatures ranging from 220 to 340 K (Figure 8B) enabled the motional amplitudes of each segment to be mapped over a wide temperature range and for different crystal modifications.
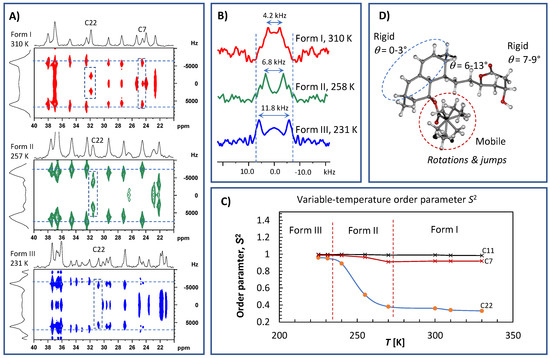
Figure 8.
Expanded parts of 1H–13C PILGRIM NMR spectra of crystalline simvastatin measured at 310, 257 and 231 K (A); the corresponding 1H–13C dipolar profiles extracted for methylene CH2 unit C22 (B); the plot of selected order parameters S2 vs. temperature (C); and the molecular structure of simvastatin displaying different segmental motions (D). The corresponding full range 1H–13C PILGRIM NMR spectra are presented in Supplementary Materials Figures S5–S7.
In this way, four parts of the simvastatin molecule with distinct motional amplitudes were revealed (Figure 8C). Specifically, all CH and CH2 segments of the bicyclic fragment were found to exhibit motionally averaged dipolar couplings, DCH, of approximately 13.3–13.5 kHz, which are very close to the values expected for completely rigid segments (DCH,rig = 13.2–13.5 kHz; the experimental uncertainty ±0.1 kHz corresponds to the FID resolution in indirect t1 dimension). Consequently, the related order parameter, , which is defined as the ratio of the motionally averaged dipolar coupling constant to the rigid-limit value, ranged between 0.98 and 1.00. In the simplest case, if the segmental motion is axially symmetric and small in amplitude (for a fluctuation angle θ, ), the order parameter can be converted to a root-mean-square angular fluctuation angle, , according to the following definition: . In contrast, for the high-amplitude discrete jumps between N distinct orientations, the order parameter is defined as in which p is the equilibrium population of vector having the i-th orientation and θij is the angle between vectors having the i-th and j-th orientations (see [31,32] for more details). This indicates that the bicyclic fragment of the simvastatin molecule is rigid, with nearly negligible reorientation amplitudes and an average fluctuation angle close to zero degrees (between approximately 0 and 5°). It is worth noting that this behavior is temperature independent and occurs in all three crystal modifications of simvastatin. The CH and CH2 groups of the lactone cycle showed slightly higher flexibility, as measured by motional amplitudes ranging from 7 to 9° ( = 0.97–0.96). Additionally, in this case, the observed low-amplitude wobbling of the lactone segment was essentially temperature independent and remained constant for all three crystal modifications.
A slightly surprising temperature dependence of motion amplitudes was found for the ethylene linker (C7) connecting the lactone ring with the bicyclic unit. During the first temperature transition, the low-amplitude fluctuations of approximately 12–13° at 310 K decreased to approximately 6–8° at 260 K (Figure 8D), whereas below 235 K in crystal Form III, these motions almost completely disappeared ( = 0.98–0.99).
As indicated by the spin–relaxation behavior, the most flexible part of simvastatin is its ester tail. This was clearly reflected by the very low-order parameter of the ethyl CH2 group C22, which was approximately = 0.33–0.37 and remained nearly constant over the temperature range of 320 to 275 K. This low value of the order parameter determined for the high-temperature crystal modification I shows that the ester substituent undergoes unrestricted, fast, large-amplitude rotations and jumps [32]. We assume that the rotation motions around the C20-C21 and C22-C21 axes occurred simultaneously. It is interesting that this motion had a negligible impact on the DFT GIPAW calculations of 1H and 13C NMR isotropic chemical shifts as demonstrated in Figure 3 (the region of the correlation of CH2 group No. 22 is highlighted by an arrow).
In contrast, below the first transition temperature (273 K), i.e., in crystal modification II, these motions exhibited a very strong temperature dependence, which was reflected in the steep increase in the order parameter from approximately 0.38 at 270 K to approximately 0.89 at 240 K. This indicates that nearly free rotation motions were gradually hindered, resembling discrete two-site jumps. This idea is further supported by signal splitting, which was clearly visible below approximately 255 K. Finally, below the second transition temperature (231 K), the order parameter was less temperature dependent, with values ranging from approximately = 0.91 to 0.97. This indicates that the ester group of at least one symmetry-independent molecule was immobilized and executed relatively low-amplitude motions (wobbling) with an average angular fluctuation angle of approximately 8–15°. Unfortunately, due to severe signal broadening, such a parameter could not be precisely determined for the ester unit of the second symmetry-independent molecule.
3. Discussion
Our NMR experimental results clearly reveal three distinct motional regimes in crystalline simvastatin that are separated by two fully-reversible solid–solid phase transitions in which ester substituents play a central role. At temperatures below the low-temperature transition (232 K), the simvastatin molecules are essentially rigid, with considerably restricted segmental dynamics that are practically temperature-independent. In contrast, above the high-temperature transition (272 K), the ester substituents exhibit extensive, unrestricted and highly symmetric uniaxial rotation motions. In this case, thermal activation is also very weak. The other parts of the simvastatin molecule remain basically rigid, undergoing only low-amplitude fluctuations. However, an intermediate phase II exists between the two temperature transitions, ranging from approximately 232 to 272 K, and shows strongly thermally activated segmental motions as well as dramatic structural rearrangement.
To better understand the molecular mechanisms of the phenomena that separate individual crystal phases of simvastatin and control phase transitions, we first analyzed the crystal structure of the low-temperature Form III (Figure 9). Form III is distinguished by the presence of two symmetry-independent molecules (designated A and B below; see also reference [4]), which have different torsion angles in the ester parts C20-C21-C22-C23 and O4-C20-C21-C22 (A: −172° and −11°; B: −76° and −36°). Molecular packing is driven predominantly by hydrogen bonding involving ester-carboxyl groups C20 and hydroxyl groups of the lacton cycle [33]. Additional interactions that appear to play a role are C–H…π noncovalent bonding. It is worth noting that the strength of hydrogen bonding differs for both symmetry-independent molecules, as reflected by O…O distances of 2.835 and 2.802 Å for A and B molecules, respectively. The differences in H-bond interactions between the inequivalent molecules are clearly seen in the Hirshfeld surfaces and the corresponding fingerprints (Figure 9B,C, respectively). The −OH···OC and CO···HO− intermolecular contacts in A and B molecules typically appear as two distinct spikes close to the diagonal in their 2D fingerprint plots (Figure 9C; O…H interactions are selectively highlighted in right-hand plots, and the spikes show a vdW radius of approximately 0.6 Å, confirming tight contacts). In the Hirshfeld surface plots, these interactions are indicated by bright red spots [34].
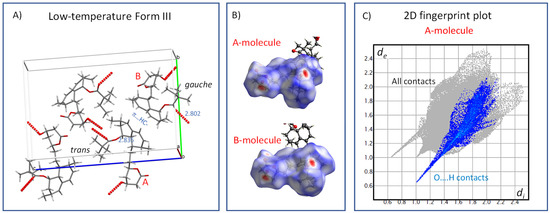
Figure 9.
The crystal structure of the low-temperature Form III (150 K, CSD Entry: EJEQAL01) (A); Hirshfeld surface mapped over dnorm, using a color scale of red (shorter than vdW separation), white (equal to vdW separation), and blue (longer than vdW separation) for the symmetry independent A and B molecules (B); and the corresponding 2D fingerprint plot (C).
As indicated by the strong temperature dependence of the T1 (13C) and T1ρ (13C) relaxation times of ester methylene carbon C22 (Figure 6 and Figure 7) observed upon heating above the low-temperature transition (232 K), the hydrogen bonding of ester substituents is considerably weakened and/or periodically interrupted in the intermediate Form II, thus allowing conformation exchange between molecules A and B. This exchange is evidenced by the gradual broadening and decreased separation of some pairs of 13C CP/MAS NMR signals after heating to approximately 250 K. The signal coalescence observed above this temperature indicates that the conformation exchange between molecules A and B becomes too fast to detect in the 13C CP/MAS NMR spectra. As this coalescence is not accompanied by any energetic event, according to the DSC results, no phase transition can be attributed to the observed splitting coalescence of the signal. Thus, the intermediate phase II, depending on the temperature and time window of the observation, may involve one or two symmetry-independent molecules. The low-temperature transition event is thus associated with overcoming the energy barriers required for temporal breaking or the weakening of hydrogen bonding and trans-gauche conformation transitions. Figure 10 shows a typical time-averaged crystal structure of Form II at 258 K, where the hydrogen bonding between the ester carboxyl C=O and lactone hydroxyl HO− group is uniform and described by an O…O distance of 2.817 Å.
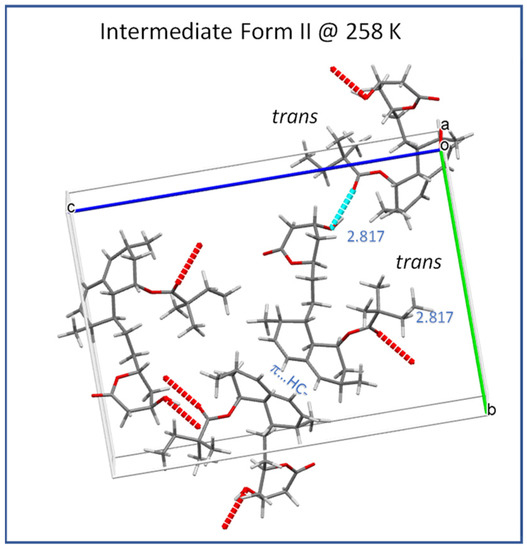
Figure 10.
Crystal structure of the intermediate Form II (258 K; CSD Entry: EJEQAL02).
Upon further heating, i.e., above the high-temperature transition (272 K), the unit cell volume increased from 2358 to 2382 Å3, which indicates a decreased density, the additional weakening and reconstitution of hydrogen bonds and an increase in the free crystal volume. The average length of the hydrogen bonds in the high-temperature Form I was 2.956 Å (Figure 11A), and the weakening of hydrogen bonding can be clearly seen in the Hirshfeld surfaces and corresponding fingerprints (Figure 11B,C, respectively). The red dots were less intense, whereas the spikes corresponding to O…H contacts were shorter and shifted toward higher values of approximately 0.8 Å. The ester substituents occupying the trans conformation underwent extensive, unrestricted and highly symmetric uniaxial rotation motions along the C20–C21 axis. This indicates that above this transition, all energy barriers of conformation exchange and overall rotation were overcome. The resulting segmental motion was so fast and symmetric that the corresponding 13C CP/MAS NMR resonances were extremely narrow, resembling liquid isotropic motions. This type of motion-induced effective time-average ordering of the system can hence explain the slightly unusual decrease in heat flow and heat capacity observed above the first transition temperature of 272 K (Figure 2).
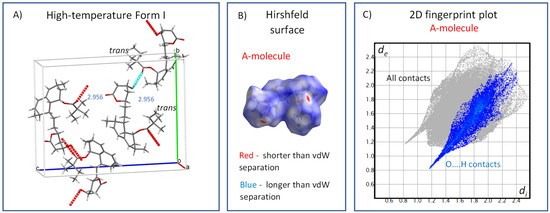
Figure 11.
The crystal structure of the high-temperature Form I (300 K, CSD Entry: EJEQAL); (A); Hirshfeld surface mapped over dnorm, using a color scale of red (shorter than vdW separation), white (equal to vdW separation) and blue (longer than vdW separation) for the single molecule (B); and the corresponding 2D fingerprint plot (C).
According to thermodynamics, the significant increase observed in segmental dynamics, which gradually occurred in the Form II when going from the Form III to Form I, consumes additional heat, causing the higher observed heat capacity of the Form II. This can also be regarded as an analogy to the heat capacity contribution of a hindered rotor, which typically rises steeply at low temperatures to exhibit a maximum and to converge from above to the high-temperature limit ½ R, valid for the heat capacity of a free rotor [35]. Provided that the ester moiety rotates nearly freely in the Form I, whereas a significant barrier to this motion is imposed in Form II, the observed lower heat capacity of the Form I arises from the fact that the segmental dynamics in Form I do not need to be further excited upon heating. Such a hierarchy of heat capacities of various polymorphs is rather unusual, but it typically occurs for rotationally disordered systems [36]. In these systems the fast time-scale dynamics impose a conformational entropic free energy penalty if the ester substituent is rigidified [31]. Consequently, the entropic contribution associated with the transition from the low-temperature polymorphic Form III to the high-temperature Form I must be considered as a key factor that stabilizes high-temperature crystal forms, especially given the weakened hydrogen bonds. As a result, polymorphs of simvastatin are not only associated with variations in molecular conformation or packing but also with changes in segmental dynamics, which must also be seriously considered.
Finally, when analyzing extensive high-amplitude segmental motions, the crystal-free volume must be considered. In this regard, the fraction of the free volume calculated for the intermediate Form II appeared to be particularly low. Specifically, empty spaces in the crystal unit cell large enough to hold spherical probes with radii of 0.8 or 0.6 Å occupied 0.4 or 4.4% of the free volume, respectively (see Figure 12). This finding thus suggests that high-amplitude jumps and conformation exchange require some form of cooperativity when several molecules simultaneously execute the same phase-coherent motion. The presence of such periodic changes, which occur when groups of atoms are shifted or rotated with respect to their neighbors, indicates the existence of a transient modulated intermediate phase [37].
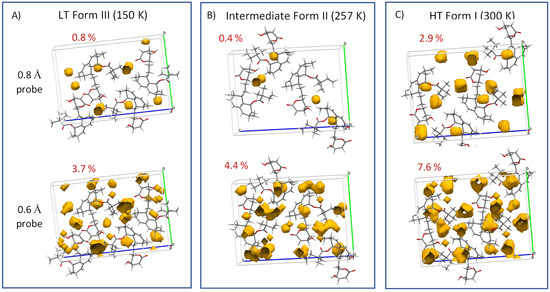
Figure 12.
Free volume calculated for low-temperature Form III (A), intermediate Form II (B) and high-temperature Form I (C). Specifically, the empty spaces in the crystal unit cells large enough to hold spherical probes with radii of 0.8 or 0.6 Å are displayed.
4. Conclusions
In summary, on the basis of extensive solid-state NMR data analysis, the mechanism of the enantiotropic phase transition and the presence of the transient modulated phase was documented. It was clearly demonstrated that in crystalline molecular solids, in the absence of strong intermolecular interactions, entropy-driven processes play a key role in the formation of dynamically modulated transient phases. Specifically, in crystalline simvastatin, the observed fully reversible enantiotropic behavior is associated with multiple order–disorder transitions: upon cooling, the dynamically disordered high-temperature polymorphic Form I is transformed to the completely-ordered low-temperature polymorphic Form III via the intermediate (transient) modulated phase II. This behavior is associated with a significant reduction in the kinetic energy of the rotating and flipping ester substituents, as well as a decrease in structural ordering into two distinct positions. In the transient phase II, the conventional three-dimensional structure is modulated by periodic distortions caused by the cooperative conformation exchange of the ester substituent between the two states, which is enabled by weakened hydrogen bonding. In general, in the transient forms, the conventional three-dimensional periodic structure is modulated by periodic distortions, which cause changes in key physical properties. Therefore, the discovery of the transient modulated phase for crystalline simvastatin increases the need for the further investigation of molecular crystalline solids with bulky, potentially movable molecular segments.
5. Materials and Methods
Sample preparation. n-heptane (6.5 mL) was added to a solution of simvastatin (Biocon Limited, Bengaluru, India, in acetone (1.1 g per 3.5 mL). The mixture was allowed to stand overnight, and the resulting crystals were washed with n-heptane. A powdered sample (crystal Form I) was used for further experiments without any purification. The other forms were obtained by cooling the sample below 0 °C (Form II) and −41 °C (Form III).
Differential Scanning Calorimetry (DSC). DSC was carried out on a Perkin-Elmer PYRIS 1 system. Aluminum sample pans were used with approximately 10 mg of the sample. The sample was cooled (cooling rate 40 °C/min) from the laboratory temperature to −60 °C and tempered for 10 minutes. Then, the sample was heated (heating rate 10 °C/min) to 30 °C (1st run). Before the 2nd run, the sample was cooled to −60 °C (cooling rate 10 °C/min). Dynamic DSC (DDSC) was performed in the temperature range of −50 to 100 °C. A single point calibration was carried out using indium (meting point 156.60 °C) as a standard sample. Nitrogen was used as a purge gas in an ambient mode.
Solid-state NMR spectroscopy (ssNMR). SSNMR spectra were measured at 11.7 T using a Bruker Avance III HD 500 US/WB NMR spectrometer (Karlsruhe, Germany, 2013) in 4 mm ZrO2 rotors. The magic angle spinning (MAS) speed was 11 kHz, the nutation frequency of the B1 (13C) field for the standard cross-polarization experiment was 62.5 kHz, the contact time was 2 ms and the repetition delay was 4 s. Standard TPPM (two-pulse phase-modulated) dipolar decoupling was applied during the detection period. The phase modulation angle was 15° and the flip-pulse length was 4.2 μs. The applied nutation frequency of the B1(1H) field was ω1/2π = 89.3 kHz. High-quality spectra were obtained by accumulating 128 scans. To measure the T1 and T1ρ relaxations of 13C magnetization, standard relaxation experiments [23] with cross polarization (CP) were performed. The intensity of the spin-locking field B1 (13C) expressed in frequency units ω1/2π = γB1 was 62.5 kHz, with durations ranging from 0.1 to 15 ms. Site-specific measurements of one-bond 1H–13C dipolar couplings under Lee–Goldburg conditions [38] were performed using PILGRIM experiments [26]. The length of the polarization–inversion period was 1 ms. Lee–Goldburg cross polarization was incremented from 50 to 2610 μs with 20 μs increments. The recycle delay was 2 s and the t1 evolution period consisted of 128 increments each made of 64–128 scans. Two-dimensional (2D) 1H-13C HETCOR experiments [39] were performed using the FSLG (Frequency Switched Lee–Goldburg) decoupling during the t1 evolution period consisting of 128 increments each made of 64–128 scans with a dwell time of 42.6 μs. Further experimental details can be found in our previous work [5]. All the variable temperature experiments were conducted between temperatures of 330 and 220 K. Frictional heating [19,40] of the spinning samples was compensated for by active cooling. The 13C CP/MAS NMR spectra were referenced to α-glycine (176.03 ppm—CO signal). The 1H scale was calibrated and scaled with the external standard—alanine low-field NH3 signal at 8.5 ppm and the high field CH3 signal at 1.2 ppm.
DFT Calculations. The PW DFT approach, which is detailed in [41,42,43], was used as implemented in the CASTEP 6.1 suite of codes [43]. The initial geometries of Forms I and III were taken from the Cambridge Crystallographic Data Centre (ref. codes EJEQAL and EJEQAL01, respectively). They were subjected to the optimization of all atomic positions, while the unit–cell parameters were kept at experimental values [4]. Ultrasoft on-the-fly generated pseudopotentials [44] and the Perdew–Burke–Erzherhof (PBE) [45] DFT functional were adopted. For the optimized crystal structures, the NMR chemical shielding tensors were predicted using the GIPAW strategy [46,47] in conjunction with the PBE functional (see reference [48] for a thorough comparison of the relevant computational techniques). In all CASTEP calculations, the settings were consistent with the “Fine” accuracy level of Materials Studio 5.0 software [49]. Specifically, the following Monkhorst–Pack grids [50] were employed in the calculations of Forms I and III, respectively: 4 × 1 × 1, 2 k points and 4 × 2 × 1, 2 k points. In all the calculations, the cut-off energy of the plane waves was set to 550 eV. Resulting MAGRES files and PDB files with atoms of asymmetric units are included in the Supplementary Materials. Similarity measures of the simulated 2D HETCOR spectrum were obtained by the previously developed procedure [51,52,53].
Supplementary Materials
The following are available online: Table S1: Listing of the 13C chemical shift, δ and shielding, σ, data of Form I; Figure S1: The fit of δ and σ data from Table S1; Table S2: Listing of the 1H chemical shift, δ (experimental values), and shielding, σ (calculated values), data of Form I.; Figure S2. The fit of δ and σ data from Table S2; Figure S3: 1H–13C FSLG HETCOR NMR spectra of the high-temperature Form I of simvastatin measured at 300 K and 100, and 900 μs of CP mixing period; Figure S4: 1H-13C FSLG HETCOR NMR spectra of the low-temperature Form III of simvastatin measured at 225 K and CP mixing periods of 700 and 1600 μs; Figure S5: Full-range and expanded 1H–13C PILGRIM NMR spectra with the signal labeling of crystalline simvastatin measured at 310 K; Figure S6: Full-range and expanded 1H–13C PILGRIM NMR spectra with the signal labeling of crystalline simvastatin measured at 257 K; Figure S7: Full-range and expanded 1H–13C PILGRIM NMR spectra with the signal labeling of crystalline simvastatin measured at 231 K; Files ‘FormI.MAGRES’, ‘FormIII.MAGRES’, and files containing atoms of the asymmetric units: ‘FormI.PDB’ and ‘FormIII.PDB’.
Author Contributions
Conceptualization, methodology, investigation, writing—original draft preparation, writing—review and editing, supervision, and funding acquisition, J.B.; investigation and data curation, M.U.; DFT calculations, J.C.; writing—review and editing, project administration, and funding acquisition, C.Č. All authors have read and agreed to the published version of the manuscript.
Funding
This research was funded by the Ministry of Education, Youth and Sports of the Czech Republic, project LTAUSA18011.
Institutional Review Board Statement
Not applicable.
Informed Consent Statement
No applicable.
Data Availability Statement
The data presented in this study are available in the article and in the Supplementary Materials.
Acknowledgments
Computational resources were supplied by the project ‘e-Infrastruktura CZ’ (e-INFRA LM2018140) provided within the program Projects of Large Research, Development and Innovations Infrastructures and by the ELIXIR-CZ project (LM2015047), part of the international ELIXIR infrastructure. We gratefully acknowledge the technical assistance with the CASTEP input file preparation provided by Michal Hušák, University of Chemistry and Technology Prague.
Conflicts of Interest
The authors have declared no conflict of interest.
Sample Availability
Samples of the compounds are not available from authors.
References
- Griesser, U.J.; Jetti, R.K.R.; Haddow, M.F.; Brehmer, T.; Apperley, D.C.; King, A.; Harris, R.K. Conformational Polymorphism in Oxybuprocaine Hydrochloride. Cryst. Growth Des. 2008, 8, 44–56. [Google Scholar] [CrossRef]
- Falls, Z.; Avery, P.; Wang, X.; Hilleke, K.P.; Zurek, E. The XtalOpt Evolutionary Algorithm for Crystal Structure Prediction. J. Phys. Chem. C 2021, 125, 1601–1620. [Google Scholar] [CrossRef]
- Piaggi, P.M.; Parrinello, M. Predicting polymorphism in molecular crystals using orientational entropy. Proc. Natl. Acad. Sci. USA 2018, 115, 10251–10256. [Google Scholar] [CrossRef] [PubMed] [Green Version]
- Hušák, M.; Kratochvíl, B.; Jegorov, A.; Brus, J.; Maixner, J.; Rohlicek, J. Simvastatin: Structure solution of two new low-temperature phases from synchrotron powder diffraction and ss-NMR. Struct. Chem. 2010, 21, 511–518. [Google Scholar] [CrossRef]
- Simões, R.G.; Bernardes, C.E.S.; Joseph, A.; Piedade, M.F.M.; Kraus, W.; Emmerling, F.; Diogo, H.P.; Minas da Piedade, M.E. Polymorphism in Simvastatin: Twinning, Disorder, and Enantiotropic Phase Transitions. Mol. Pharm. 2018, 15, 5349–5360. [Google Scholar] [CrossRef]
- Czernek, J.; Urbanova, M.; Brus, J. NMR Crystallography of the Polymorphs of Metergoline. Crystals 2018, 8, 378. [Google Scholar] [CrossRef] [Green Version]
- Hušák, M.; Jegorov, A.; Czernek, J.; Rohlíček, J.; Žižková, S.; Vraspír, P.; Kolesa, P.; Fitch, A.; Brus, J. Successful Strategy for High Degree of Freedom Crystal Structure Determination from Powder X-Ray Diffraction Data: A Case Study for Selexipag Form I with 38 DOF. Cryst. Growth Des. 2019, 19, 4625–4631. [Google Scholar] [CrossRef]
- Baias, M.; Dumez, J.N.; Svensson, P.H.; Schantz, S.; Day, G.M.; Emsley, L. De Novo Determination of the Crystal Structure of a Large Drug Molecule by Crystal Structure Prediction-Based Powder NMR Crystallography. J. Am. Chem. Soc. 2013, 135, 17501–17507. [Google Scholar] [CrossRef] [Green Version]
- Hughes, C.E.; Reddy, G.N.M.; Masiero, S.; Brown, S.P.; Williams, P.A.; Harris, K.D.M. Determination of a complex crystal structure in the absence of single crystals: Analysis of powder X-ray diffraction data, guided by solid-state NMR and periodic DFT calculations, reveals a new 20-deoxyguanosine structural motif. Chem. Sci. 2017, 8, 3971–3979. [Google Scholar] [CrossRef] [Green Version]
- Luedeker, D.; Gossmann, R.; Langer, K.; Brunklaus, G. Crystal Engineering of Pharmaceutical Co-crystals: “NMR Crystallography” of Niclosamide Co-crystals. Cryst. Growth Des. 2016, 16, 3087–3100. [Google Scholar] [CrossRef]
- Fernandes, J.A.; Sardo, M.; Mafra, L.; Choquesillo-Lazarte, D.; Masciocchi, N. X-ray and NMR Crystallography Studies of Novel Theophylline Cocrystals Prepared by Liquid Assisted Grinding. Cryst. Growth Des. 2015, 15, 3674–3683. [Google Scholar] [CrossRef]
- Husak, M.; Jegorov, A.; Rohlicek, J.; Fitch, A.; Czernek, J.; Kobera, L.; Brus, J. Determining the Crystal Structures of Peptide Analogs of Boronic Acid in the Absence of Single Crystals: Intricate Motifs of Ixazomib Citrate Revealed by XRPD Guided by ss-NMR. Cryst. Growth Des. 2018, 18, 3616–3625. [Google Scholar] [CrossRef]
- Brus, J.; Czernek, J.; Hruby, M.; Svec, P.; Kobera, L.; Abbrent, S.; Urbanova, M. Efficient Strategy for Determining the Atomic-Resolution Structure of Micro- and Nanocrystalline Solids within Polymeric Microbeads: Domain-Edited NMR Crystallography. Macromolecules 2018, 51, 5364–5374. [Google Scholar] [CrossRef]
- Hodgkinson, P. NMR Crystallography of Molecular Organics. Prog. Nucl. Mag. Res. Spectrosc. 2020, 118, 10–53. [Google Scholar] [CrossRef]
- Egorov, V.M.; Marikhin, V.A.; Myasnikova, L.P.; Nakamura, M. Specific features of phase transitions in molecular crystals of diols. Phys. Solid State 2009, 51, 2129–2134. [Google Scholar] [CrossRef]
- Szewczyk, D.; Gebbia, J.F.; Jeżowski, A.; Krivchikov, A.I.; Guidi, T.; Cazorla, C.; Tamarit, J.-L. Heat capacity anomalies of the molecular crystal 1-fluoro-adamantane at low temperatures. Sci. Rep. 2021, 11, 18640. [Google Scholar] [CrossRef]
- Nti-Gyabaah, J.; Chan, V.; Chiew, Y.C. Solubility and limiting activity coefficient of simvastatin in different organic solvents. Fluid Phase Equilib. 2009, 280, 35–41. [Google Scholar] [CrossRef]
- Brus, J.; Jegorov, A. Through-Bonds and Through-Space Solid-State NMR Correlations at Natural Isotopic Abundance: Signal Assignment and Structural Study of Simvastatin. J. Phys. Chem. A 2004, 108, 3955–3964. [Google Scholar] [CrossRef]
- Brus, J. Heating of samples induced by fast magic-angle spinning. Solid State Nucl. Magn. Reson. 2000, 16, 151–160. [Google Scholar] [CrossRef]
- Johansson, A.; Tegenfeldt, J. NMR study of crystalline and amorphous poly(ethylene oxide). Macromolecules 1992, 25, 4712–4715. [Google Scholar] [CrossRef]
- VanderHart, D.L.; Earl, W.L.; Garroway, A.N. Resolution in 13C NMR of organic solids using high-power proton decoupling and magic angle sample spinning. J. Magn. Reason. 1981, 44, 361–401. [Google Scholar] [CrossRef]
- Policianova, O.; Brus, J.; Hruby, M.; Urbanova, M.; Zhigunov, A.; Kredatusova, J.; Kobera, L. Structural Diversity of Solid Dispersions of Acetylsalicylic Acid as Seen by Solid-State NMR. Mol. Pharm. 2014, 11, 516–530. [Google Scholar] [CrossRef]
- Brus, J.; Urbanova, M.; Strachota, A. Epoxy Networks Reinforced with Polyhedral Oligomeric Silsesquioxanes: Structure and Segmental Dynamics as Studied by Solid-State NMR. Macromolecules 2008, 41, 372–386. [Google Scholar] [CrossRef]
- Njus, J.M. Solid-state NMR and 2,3-dicyano-5,7-dimethyl-6H-1,4-diazepine. Solid State Nucl. Magn. Reson. 2006, 29, 283–293. [Google Scholar] [CrossRef]
- Simões, R.G.; Bernardes, C.E.S.; Diogo, H.P.; Agapito, F.; Minas da Piedade, M.E. Energetics and Structure of Simvastatin. Mol. Pharm. 2013, 10, 2713–2722. [Google Scholar] [CrossRef]
- Hong, M.; Yao, X.L.; Jakes, K.; Huster, D. Investigation of molecular motions by Lee-Goldburg cross-polarization NMR Spectroscopy. J. Phys. Chem. B 2002, 106, 7355–7364. [Google Scholar] [CrossRef]
- Ramamoorthy, A.; Wei, Y.F.; Lee, D.K. PISEMA solid-state NMR spectroscopy. Annu. Rep. NMR Spectrosc. 2004, 52, 1–52. [Google Scholar] [CrossRef]
- Brus, J.; Urbanova, M. Selective measurement of heteronuclear 1H-13C dipolar couplings in motionally heterogeneous semicrystalline polymer systems. J. Phys. Chem. A 2005, 109, 5050–5054. [Google Scholar] [CrossRef] [PubMed]
- Brus, J.; Urbanová, M.; Kelnar, I.; Kotek, J. A solid-state NMR study of structure and segmental dynamics of semicrystalline elastomer-toughened nanocomposites. Macromolecules 2006, 39, 5400–5409. [Google Scholar] [CrossRef]
- Brus, J.; Jakeš, J. Geometry of multiple-spin systems as reflected in 13C-{1H} dipolar spectra measured at Lee-Goldburg cross-polarization. Solid State Nucl. Magn. Reson. 2005, 27, 180–191. [Google Scholar] [CrossRef] [PubMed]
- Palmer, A.G.; Williams, J.; McDermott, A. Nuclear magnetic resonance studies of biopolymer dynamics. J. Phys. Chem. 1996, 100, 13293–13310. [Google Scholar] [CrossRef]
- Lipari, G.; Szabo, A. Model-free approach to the interpretation of nuclear magnetic resonance relaxation in macromolecules. 1. Theory and range of validity. J. Am. Chem. Soc. 1982, 104, 4546–4559. [Google Scholar] [CrossRef]
- Graeser, K.A.; Strachan, C.J.; Patterson, J.E.; Gordon, K.C.; Rades, T. Physicochemical Properties and Stability of Two Differently Prepared Amorphous Forms of Simvastatin. Cryst. Growth Des. 2008, 8, 128–135. [Google Scholar] [CrossRef]
- Suzuki, M.; Maeda, Y.; Akita, M.; Teramae, H.; Kobayashi, K. Polymorphs Related by an Enantiotropic Phase Transition but Having Only Order–Disorder-Level Conformational Differences in a Spiro-Conjugated Imidazolidine Ring Compound. Cryst. Growth Des. 2014, 14, 6302–6310. [Google Scholar] [CrossRef] [Green Version]
- Červinka, C.; Fulem, M.; Štejfa, V.; Růžička, K. Analysis of Uncertainty in the Calculation of Ideal-Gas Thermodynamic Properties Using the One-Dimensional Hindered Rotor (1-DHR) Model. J. Chem. Eng. Data 2017, 62, 445–455. [Google Scholar] [CrossRef]
- Berg, W.T.; Scott, D.W.; Hubbard, W.N.; Todd, S.S.; Messerly, J.F.; Hossenlopp, I.A.; Osborn, A.; Douslin, D.R.; McCullough, J.P. The chemical thermodynamic properties of cyclopentanethiol. J. Phys. Chem. 1961, 65, 1425–1430. [Google Scholar] [CrossRef]
- Kim, Y.; Mckinley, E.J.; Christensen, K.E.; Rees, N.H.; Thompson, A.L. Toward the Understanding of Modulation in Molecular Materials: Barluenga’s Reagent and its Analogues. Cryst. Growth Des. 2014, 14, 6294–6301. [Google Scholar] [CrossRef]
- Ladizhansky, V.; Vega, S. Polarization transfer dynamics in Lee-Goldburg Cross polarization nuclear magnetic resonance experiments on rotating solids. J. Chem. Phys. 2000, 112, 7158–7168. [Google Scholar] [CrossRef]
- van Rossum, B.-J.; Förster, H.; de Groot, H.J.M. High-field and high-speed CP-MAS13C NMR heteronuclear dipolar-correlation spectroscopy of solids with frequency-switched Lee-Goldburg homonuclear decoupling. J. Magn. Reson. 1997, 124, 516–519. [Google Scholar] [CrossRef]
- Langer, B.; Schnell, I.; Spiess, H.W.; Grimmer, A.R. Temperature calibration under ultrafast MAS conditions. J. Magn. Reson. 1999, 138, 182–186. [Google Scholar] [CrossRef]
- Kresse, G.; Joubert, D. From ultrasoft pseudopotentials to the projector augmented-wave method. Phys. Rev. B 1999, 59, 1758–1775. [Google Scholar] [CrossRef]
- Segall, M.D.; Lindan, P.J.D.; Probert, M.J.; Pickard, C.J.; Hasnip, P.J.; Clark, S.J.; Payne, M.C. First principles simulation: Ideas, illustrations, and the CASTEP code. J. Phys. Condens. Matter 2002, 14, 2717–2744. [Google Scholar] [CrossRef]
- Clark, S.J.; Segall, M.D.; Pickard, C.J.; Hasnip, P.J.; Probert, M.J.; Refson, K.; Payne, M.C. First principles methods using CASTEP. Z. Kristallogr. 2005, 220, 567–570. [Google Scholar] [CrossRef] [Green Version]
- Gao, S.-P.; Pickard, C.J.; Perlov, A.; Milman, V. Core-Level Spectroscopy Calculation and the Plane Wave Pseudopotential Method. J. Phys. Condens. Matter 2009, 21, 104203. [Google Scholar] [CrossRef] [PubMed]
- Perdew, J.P.; Burke, K.; Ernzerhof, M. Generalized gradient approximation made simple. Phys. Rev. Lett. 1996, 77, 3865–3868. [Google Scholar] [CrossRef] [Green Version]
- Pickard, C.J.; Mauri, F. All-electron magnetic response with pseudopotentials: NMR chemical shifts. Phys. Rev. B 2001, 63, 245101. [Google Scholar] [CrossRef] [Green Version]
- Yates, J.R.; Pickard, C.J.; Mauri, F. Calculations of NMR chemical shifts for extended systems using ultrasoft pseudopotentials. Phys. Rev. B 2007, 76, 024401. [Google Scholar] [CrossRef]
- Czernek, J. On the solid-state NMR spectra of naproxen. Chem. Phys. Lett. 2015, 619, 230–235. [Google Scholar] [CrossRef]
- BIOVIA Materials Studio. Dassault Systèmes, Vélizy-Villacoublay: Paris, France. Available online: https://www.3ds.com/products-services/biovia/products/molecular-modeling-simulation/biovia-materials-studio/ (accessed on 20 November 2021).
- Monkhorst, H.J.; Pack, J.D. Special points for Brillouin-zone integrations. Phys. Rev. B 1976, 13, 5188–5192. [Google Scholar] [CrossRef]
- Czernek, J.; Brus, J. Theoretical predictions of the two-dimensional solid-state NMR spectra: A case study of the 13C-1H correlations in metergoline. Chem. Phys. Lett. 2013, 586, 56–60. [Google Scholar] [CrossRef]
- Czernek, J.; Brus, J. The covariance of the differences between experimental and theoretical chemical shifts as an aid for assigning two-dimensional heteronuclear correlation solid-state NMR spectra. Chem. Phys. Lett. 2014, 608, 334–339. [Google Scholar] [CrossRef]
- Czernek, J.; Brus, J. A Volumetric Analysis of the 1H NMR Chemical Shielding in Supramolecular Systems. Int. J. Mol. Sci. 2021, 22, 3333. [Google Scholar] [CrossRef] [PubMed]
Publisher’s Note: MDPI stays neutral with regard to jurisdictional claims in published maps and institutional affiliations. |
© 2022 by the authors. Licensee MDPI, Basel, Switzerland. This article is an open access article distributed under the terms and conditions of the Creative Commons Attribution (CC BY) license (https://creativecommons.org/licenses/by/4.0/).