Article

Microplastics (Polystyrene) Exposure Induces Metabolic Changes in the Liver of Rare Minnow (Gobiocypris rarus)

1
The Key Laboratory of Aquatic Biodiversity and Conservation of Chinese Academy of Sciences, Institute of Hydrobiology, Chinese Academy of Sciences, Wuhan 430072, China
2
University of Chinese Academy of Sciences, Beijing 100049, China
3
College of Fisheries, Huazhong Agricultural University, Wuhan 430070, China
*
Author to whom correspondence should be addressed.
Molecules 2022, 27(3), 584; https://doi.org/10.3390/molecules27030584
Submission received: 9 December 2021 / Revised: 8 January 2022 / Accepted: 11 January 2022 / Published: 18 January 2022

Abstract

:
Microplastics are environmental contaminants and an emergent concern. Microplastics are abundant in freshwater and can cause biochemical stress in freshwater organisms. In the current study, rare minnows (Gobiocypris rarus) were exposed to 1μm polystyrene microplastics at 200 μg/L concentration. We observed various sublethal effects after four weeks of exposure but no mortality. Numerous cellular and tissue alterations were observed in the liver. Differential metabolites and differentially expressed genes between control and exposure groups were identified and mapped to pathways in the Kyoto Encyclopedia of Genes and Genomes. The combination of transcriptomic and metabolomic analyses revealed significantly varied metabolic pathways between the two groups. These pathways were involved in glucolipid, amino acid, and nucleotide metabolism. Results demonstrated that MP exposure induced immune reaction, oxidative stress, and disturbed glycolipid and energy metabolism. The current study provided novel insights into the molecular and metabolic mechanisms of microplastic ecotoxicology in rare minnow.

1. Introduction

Plastics are widely used for industrial production and daily life because of their advantageous features, such as water resistance, durability, light weight, insulation, and corrosion resistance. In 2018, global plastic production reached approximately 360 million tons, of which 80,000 tons are estimated to seep into the aquatic environment [1]. Each year, 12.7 million tons of plastic debris enter the ocean, and plastic constitutes the world’s largest marine debris [2]. Plastics that enter the environment can be broken down into smaller particles or fragments through physical, chemical, and biological processes. The tiny plastic fragments directly discharged into the environment lead to severe microplastics (MPs) pollution [3]. Microplastics are 100 nm–5 sized plastic beads or fragments, as recognized by most authors [4,5]. MPs are ubiquitous in all ecosystems [6,7]. MPs are similar to plankton in shape and size and therefore, are eaten by fish frequently. As a result, various MPs accumulate in freshwater and marine fish species [8,9,10]. Several studies have revealed that microplastics can be ingested by many aquatic organisms, such as copepods, nematodes, brown shrimp, crabs, and mussels [11,12,13].
Microplastics, a new type of pollutants, have received significant attention from scholars and the public globally. The study of microplastics pollution has become one of the current international research hotspots [14,15,16,17,18]. Recently, research reports on the sources, types, distribution, and toxicological effects of microplastics on aquatic organisms have been increasing [1,19,20]. Microplastics can accumulate in aquatic organisms, endangering organisms through physical damage, carrier effects (plasticizer release, enrichment effect with other pollutants), bioaccumulation, and food chain transmission [21,22,23]. MPs might induce toxic effects at the individual level (grazing, reproduction, survival, growth) [24], tissue level (inflammatory response, oxidative damage, fatty vacuoles), cellular level (hepatocyte necrosis) [25], and genetic level (variety of endocrine disrupting gene expression) [26,27]. However, only a few reports about the toxic effects of microplastics on fish are present, including Danio rerio, Oryzias latipes, and Dicentrarchus labrax [25,28]. Therefore, there is a need to obtain more fish toxicology data, analyze the mechanism, and accurately evaluate the ecological risk of microplastics for the environment.
Rare minnow (Gobiocypris rarus), the most standardized model fish in China, is suitable for chemical testing and ecotoxicological research [29,30]. However, toxic effects of microplastics on rare minnows are not well discussed. Polystyrene (PS) is produced industrially and distributed in freshwater bodies in China [31]. In our previous study, we observed that MPs entered the fish body through the digestive tract and damaged the gut and liver. Additionally, several studies have reported the effects of 1 μm MPs on organisms [32,33,34]. Therefore, in the present study, rare minnows (Gobiocypris rarus) were exposed to 200 μg/L of 1 μm fluorescent polystyrene (PS) particles, for 28 days, and multiple endpoints including histopathology, transcriptome, and metabolome were analyzed.
The primary objective of the current study was to study the effects of polystyrene microplastics on rare minnow liver after exposure for 28 days, particularly in metabolic pathways, by using a combination of metabolomic, transcriptomic data, and histopathological analysis.

2. Results

2.1. Condition during This Study

During the experiment, the MPs concentration of the test solution was (3.71 ± 0.10) × 108 items/L, and the dissolved oxygen, conductivity, pH, and temperature of the control and MPs-treated groups were in the normal range (Table 1). Throughout the study, fish remained in excellent condition.

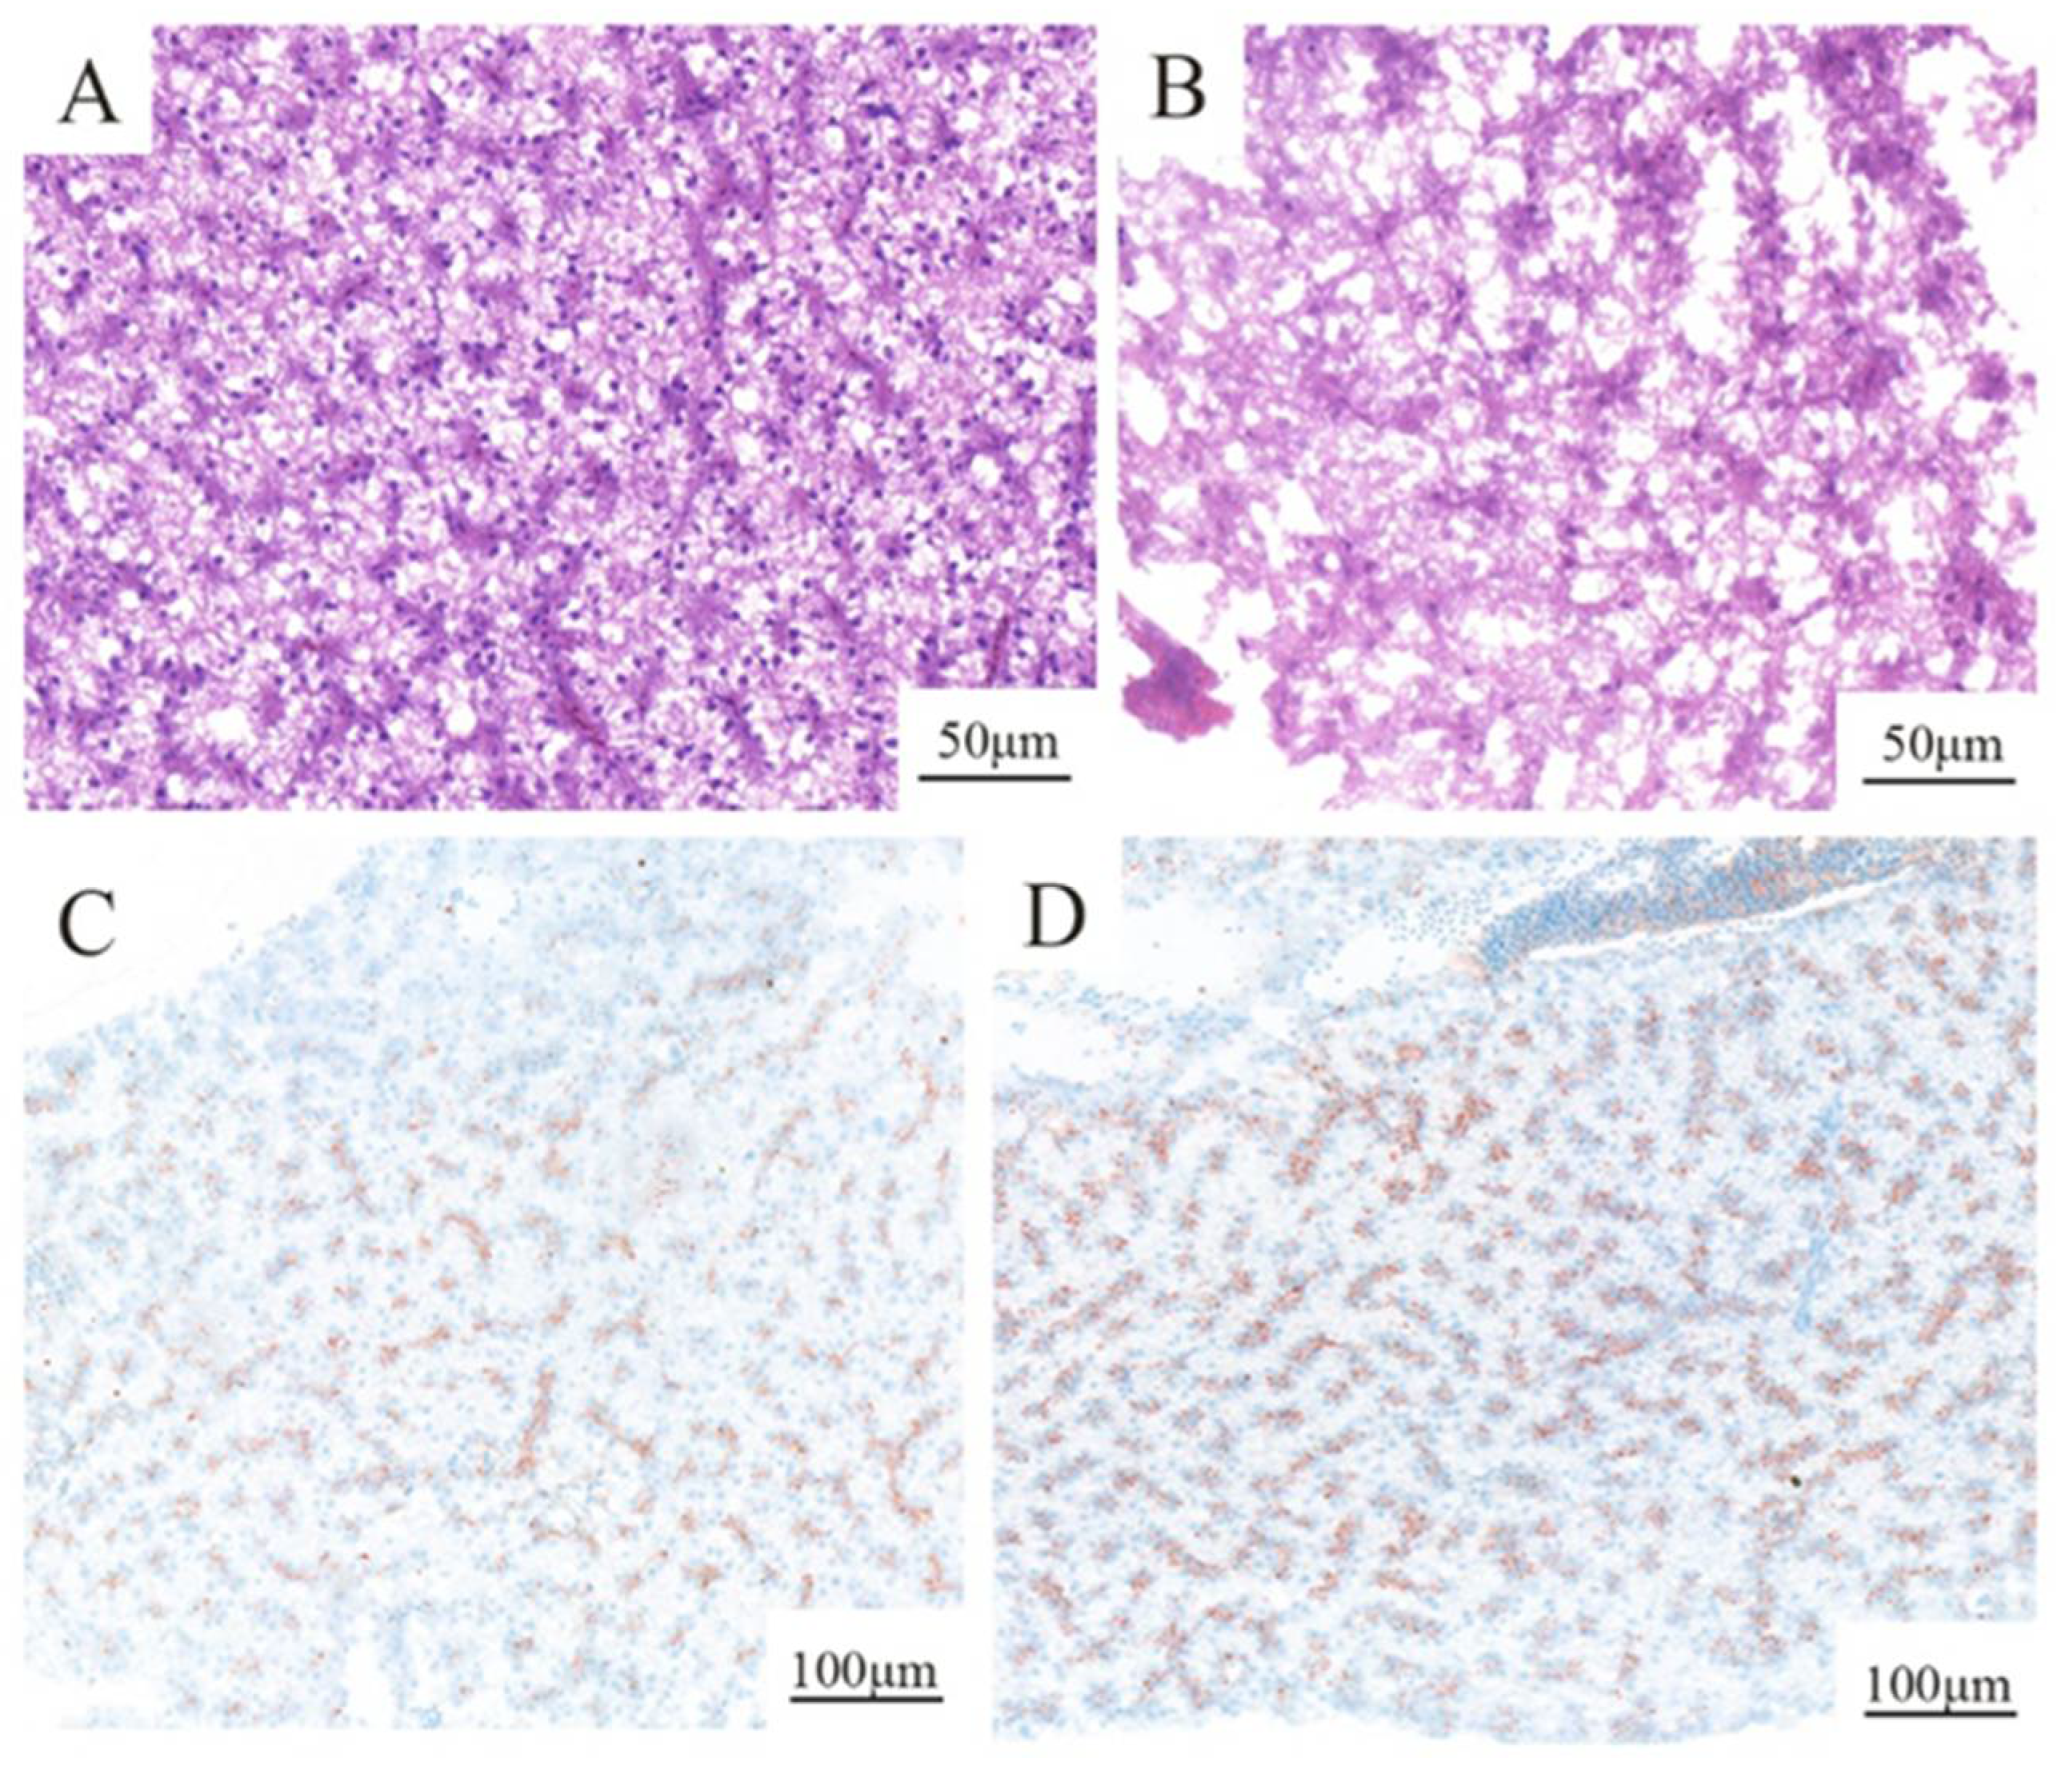
2.2. Histopathological Changes Induced by PS-MPs Treatment

Cytoplasmic vacuolization and irregularity were observed in the liver tissues of MPs-treated fish. Compared with the control (Figure 1A,C), the exposure group exhibited cell hypertrophy and increased vacuolization of hepatocytes (Figure 1B) after H&E staining. After staining with oil red O, the lipid droplets in the liver increased in the exposure group, and a larger area and darker color of the lipid droplets were easily observed (Figure 1D). However, no partials were observed in the liver in the present study (Figure S1).

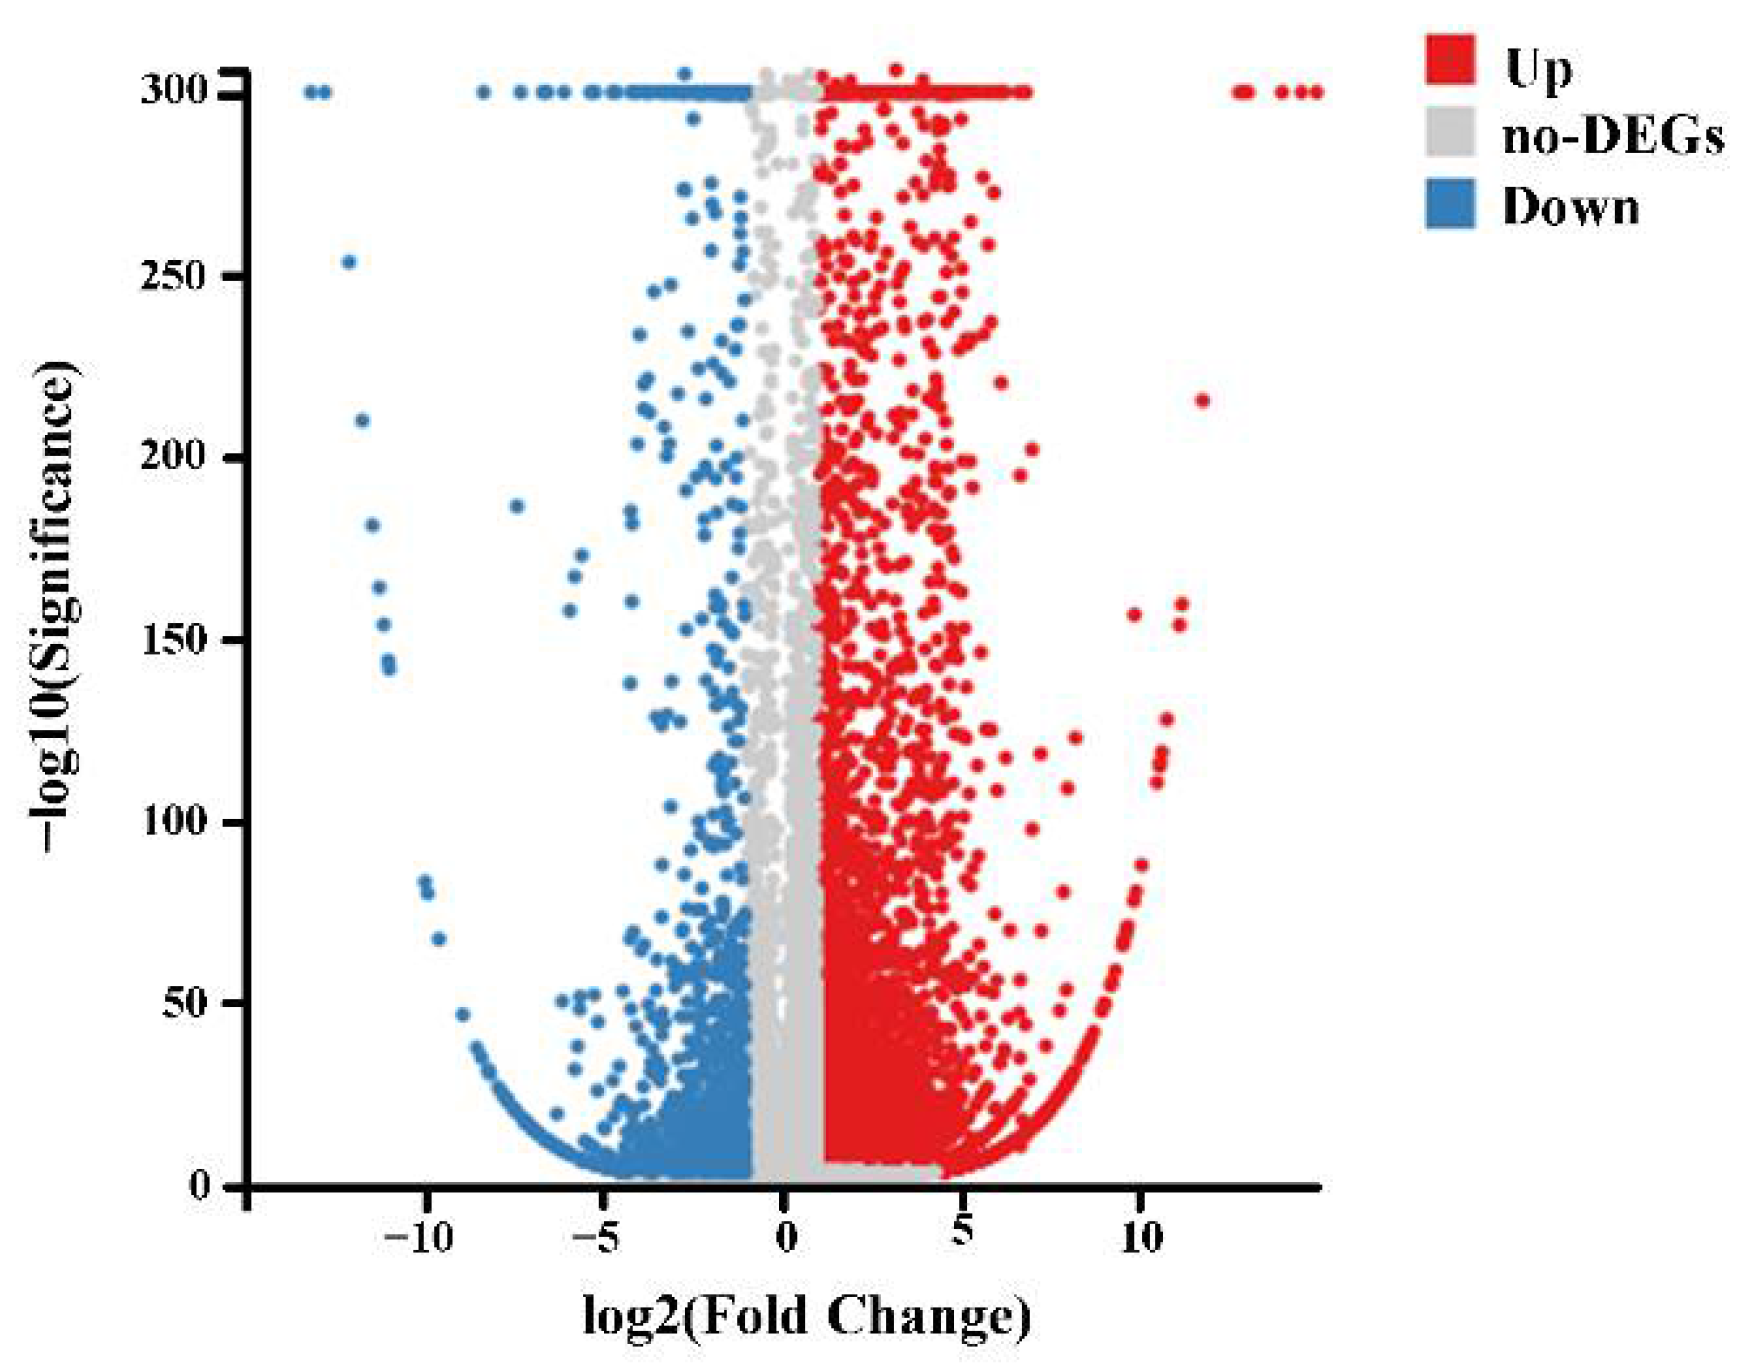
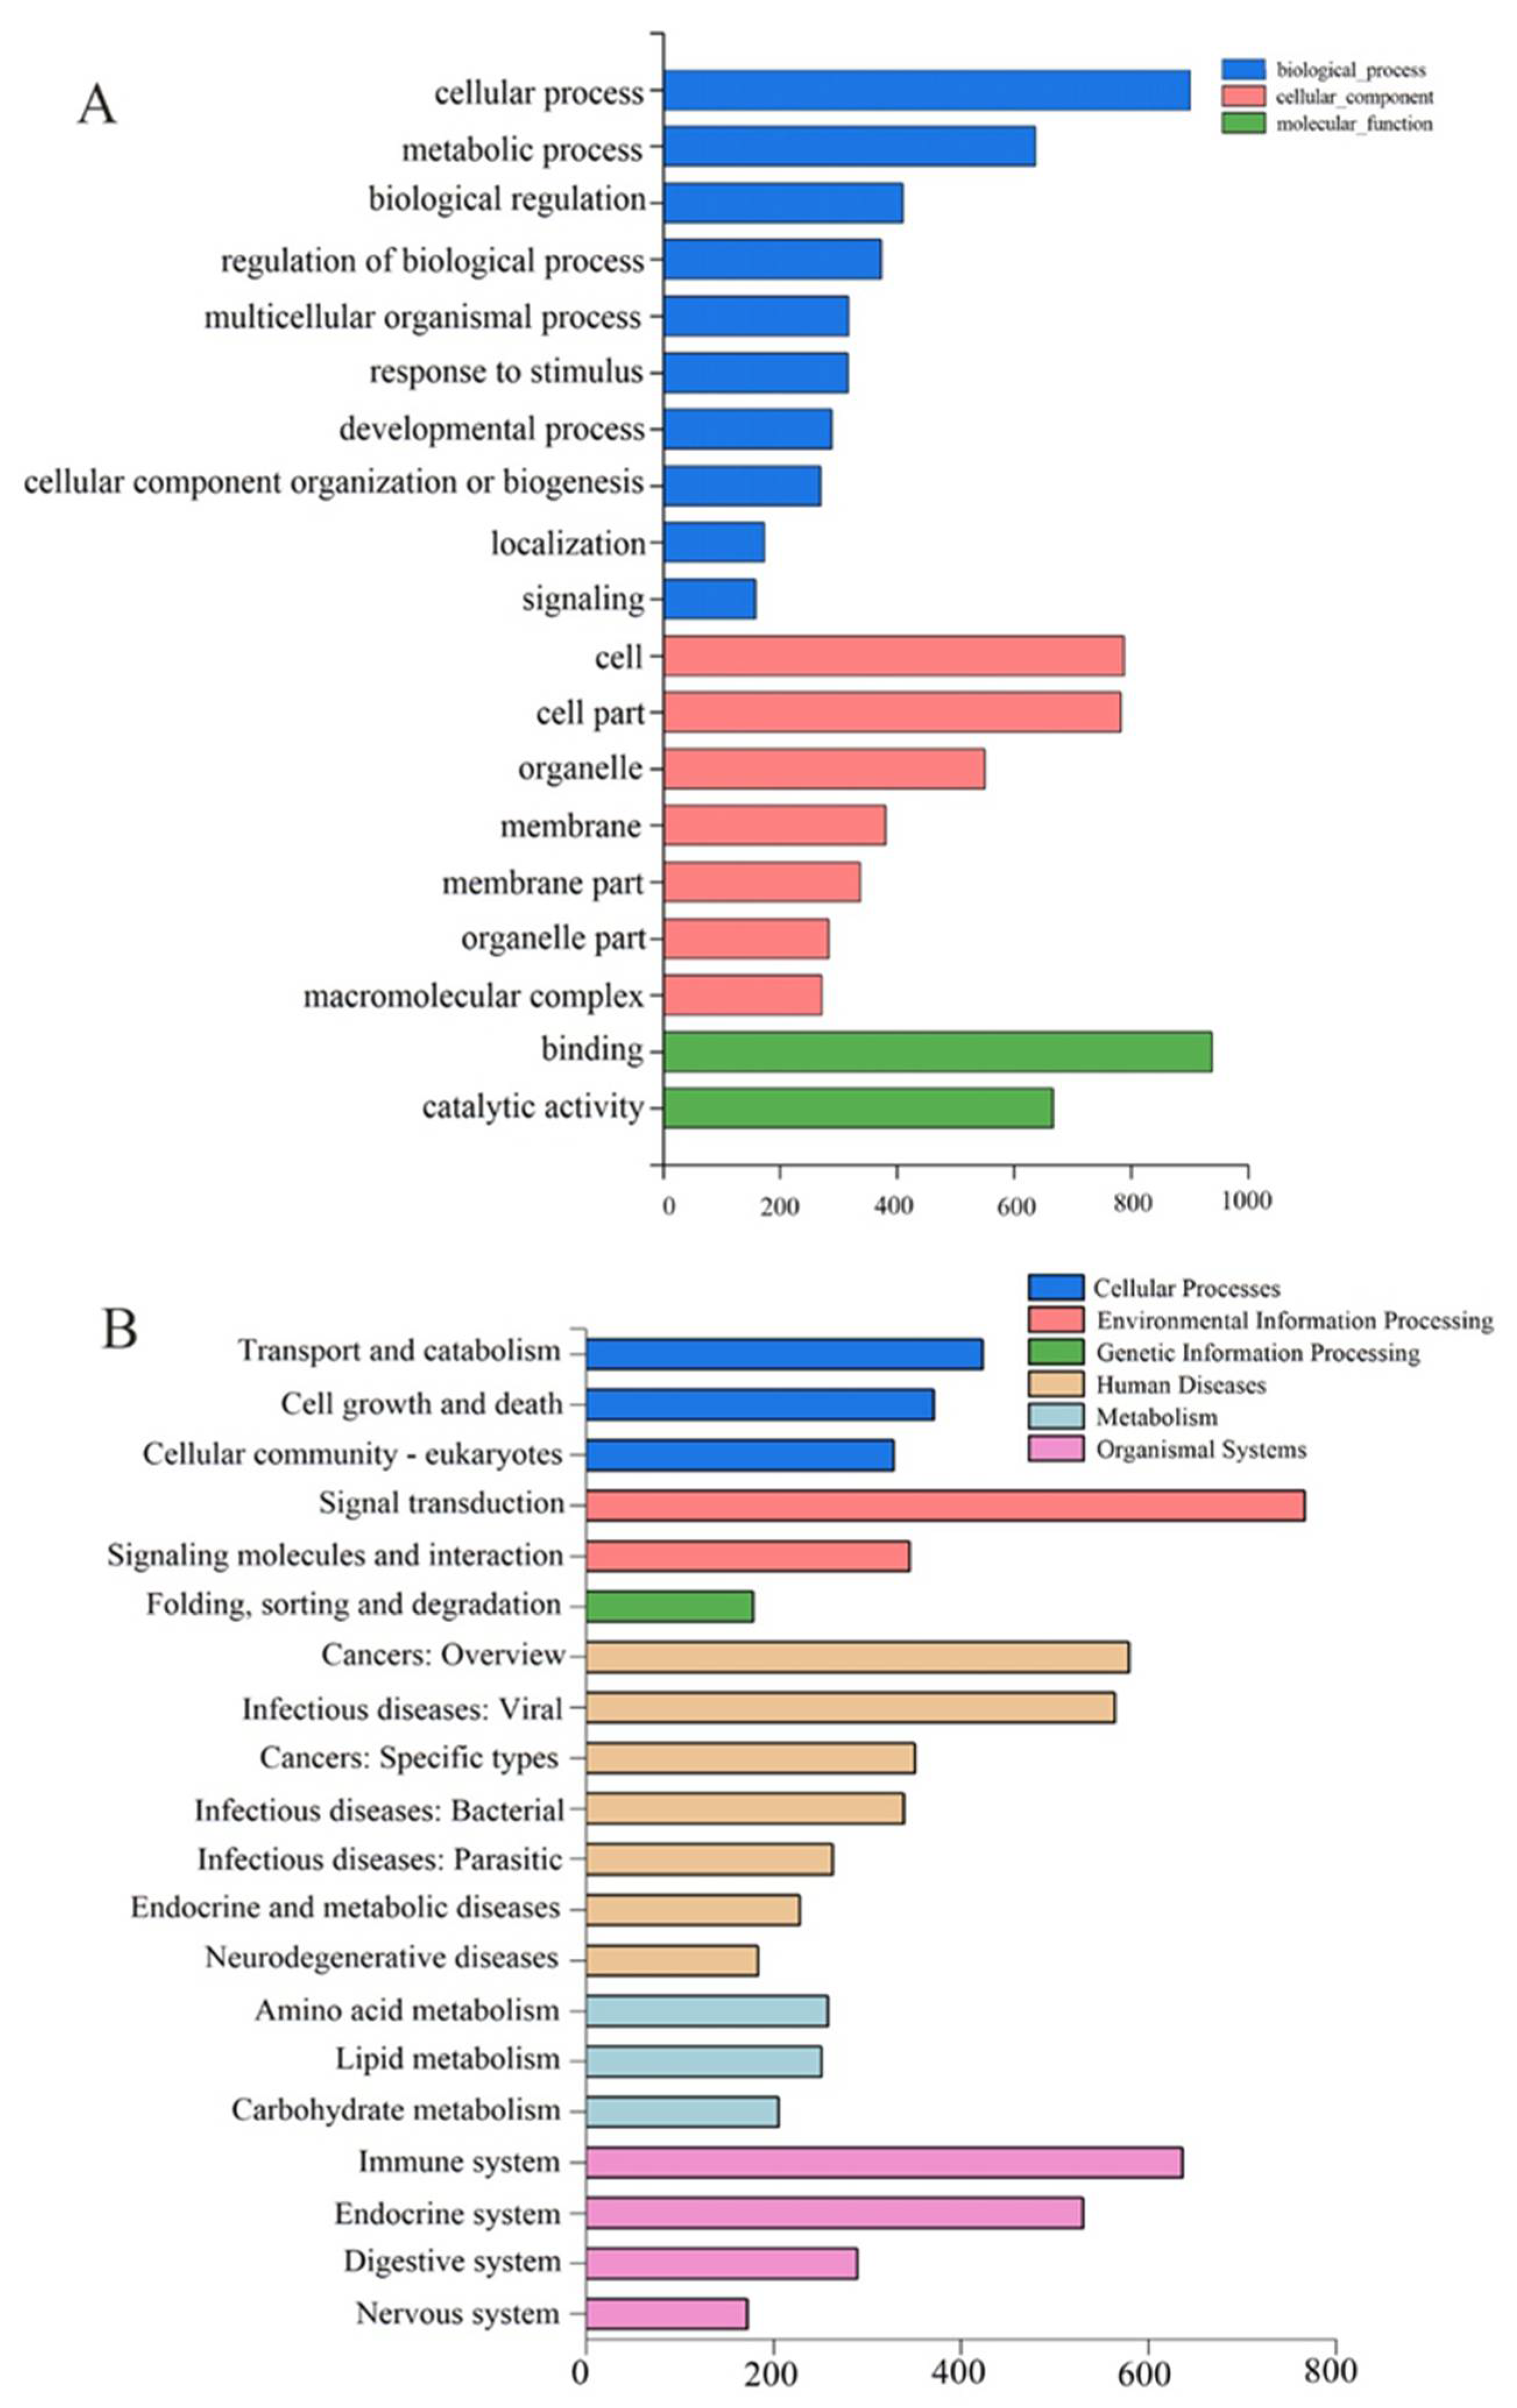
2.3. Transcriptome Analysis

We obtained 71.69, 71.7, 71.7, 71.79, 71.6, and 71.67 million 150 bp sequence reads from six samples of the control and MPs-treated groups. Among these, 6882 upregulated (red dots) and 1276 downregulated (blue dots) differentially expressed genes (DEGs) were observed between control and MPs-treated groups (change fold > 2, Q-value ≤ 0.001) (Figure 2). Gene Ontology (GO) enrichment analysis was carried out to demonstrate biological function of DEGs. Enriched GO terms comprised three categories: biological process, cellular component, and molecular function. The most significantly enriched terms were as follows: “cellular process”, “metabolic process”, “binding”, “catalytic activity”, “cell”, and “cell part” (Figure 3A). Pathway analyses were conducted using the Kyoto Encyclopedia of Genes and Genomes (KEGG) database to characterize the potential pathways involving DEGs functionally. The results revealed a diverse range of pathways, with 14,587 DEGs between control and exposure groups assigned to 341 pathways. KEGG enrichment analysis demonstrated a significant enrichment of “signal transduction”, “immune system”, “transport and catabolism”, “endocrine system”, and “infectious diseases” (Figure 3B). Moreover, genes with the highest differential expression (top 20 genes) are listed in Table 2. These top 20 genes were related to response to various biological processes including histidine metabolism, immune process, glucuronidation process, cancer tumorigenesis, cell division, inflammatory reaction, cell growth, cell death, differentiation, genetic information, environmental information process, and metabolism process.

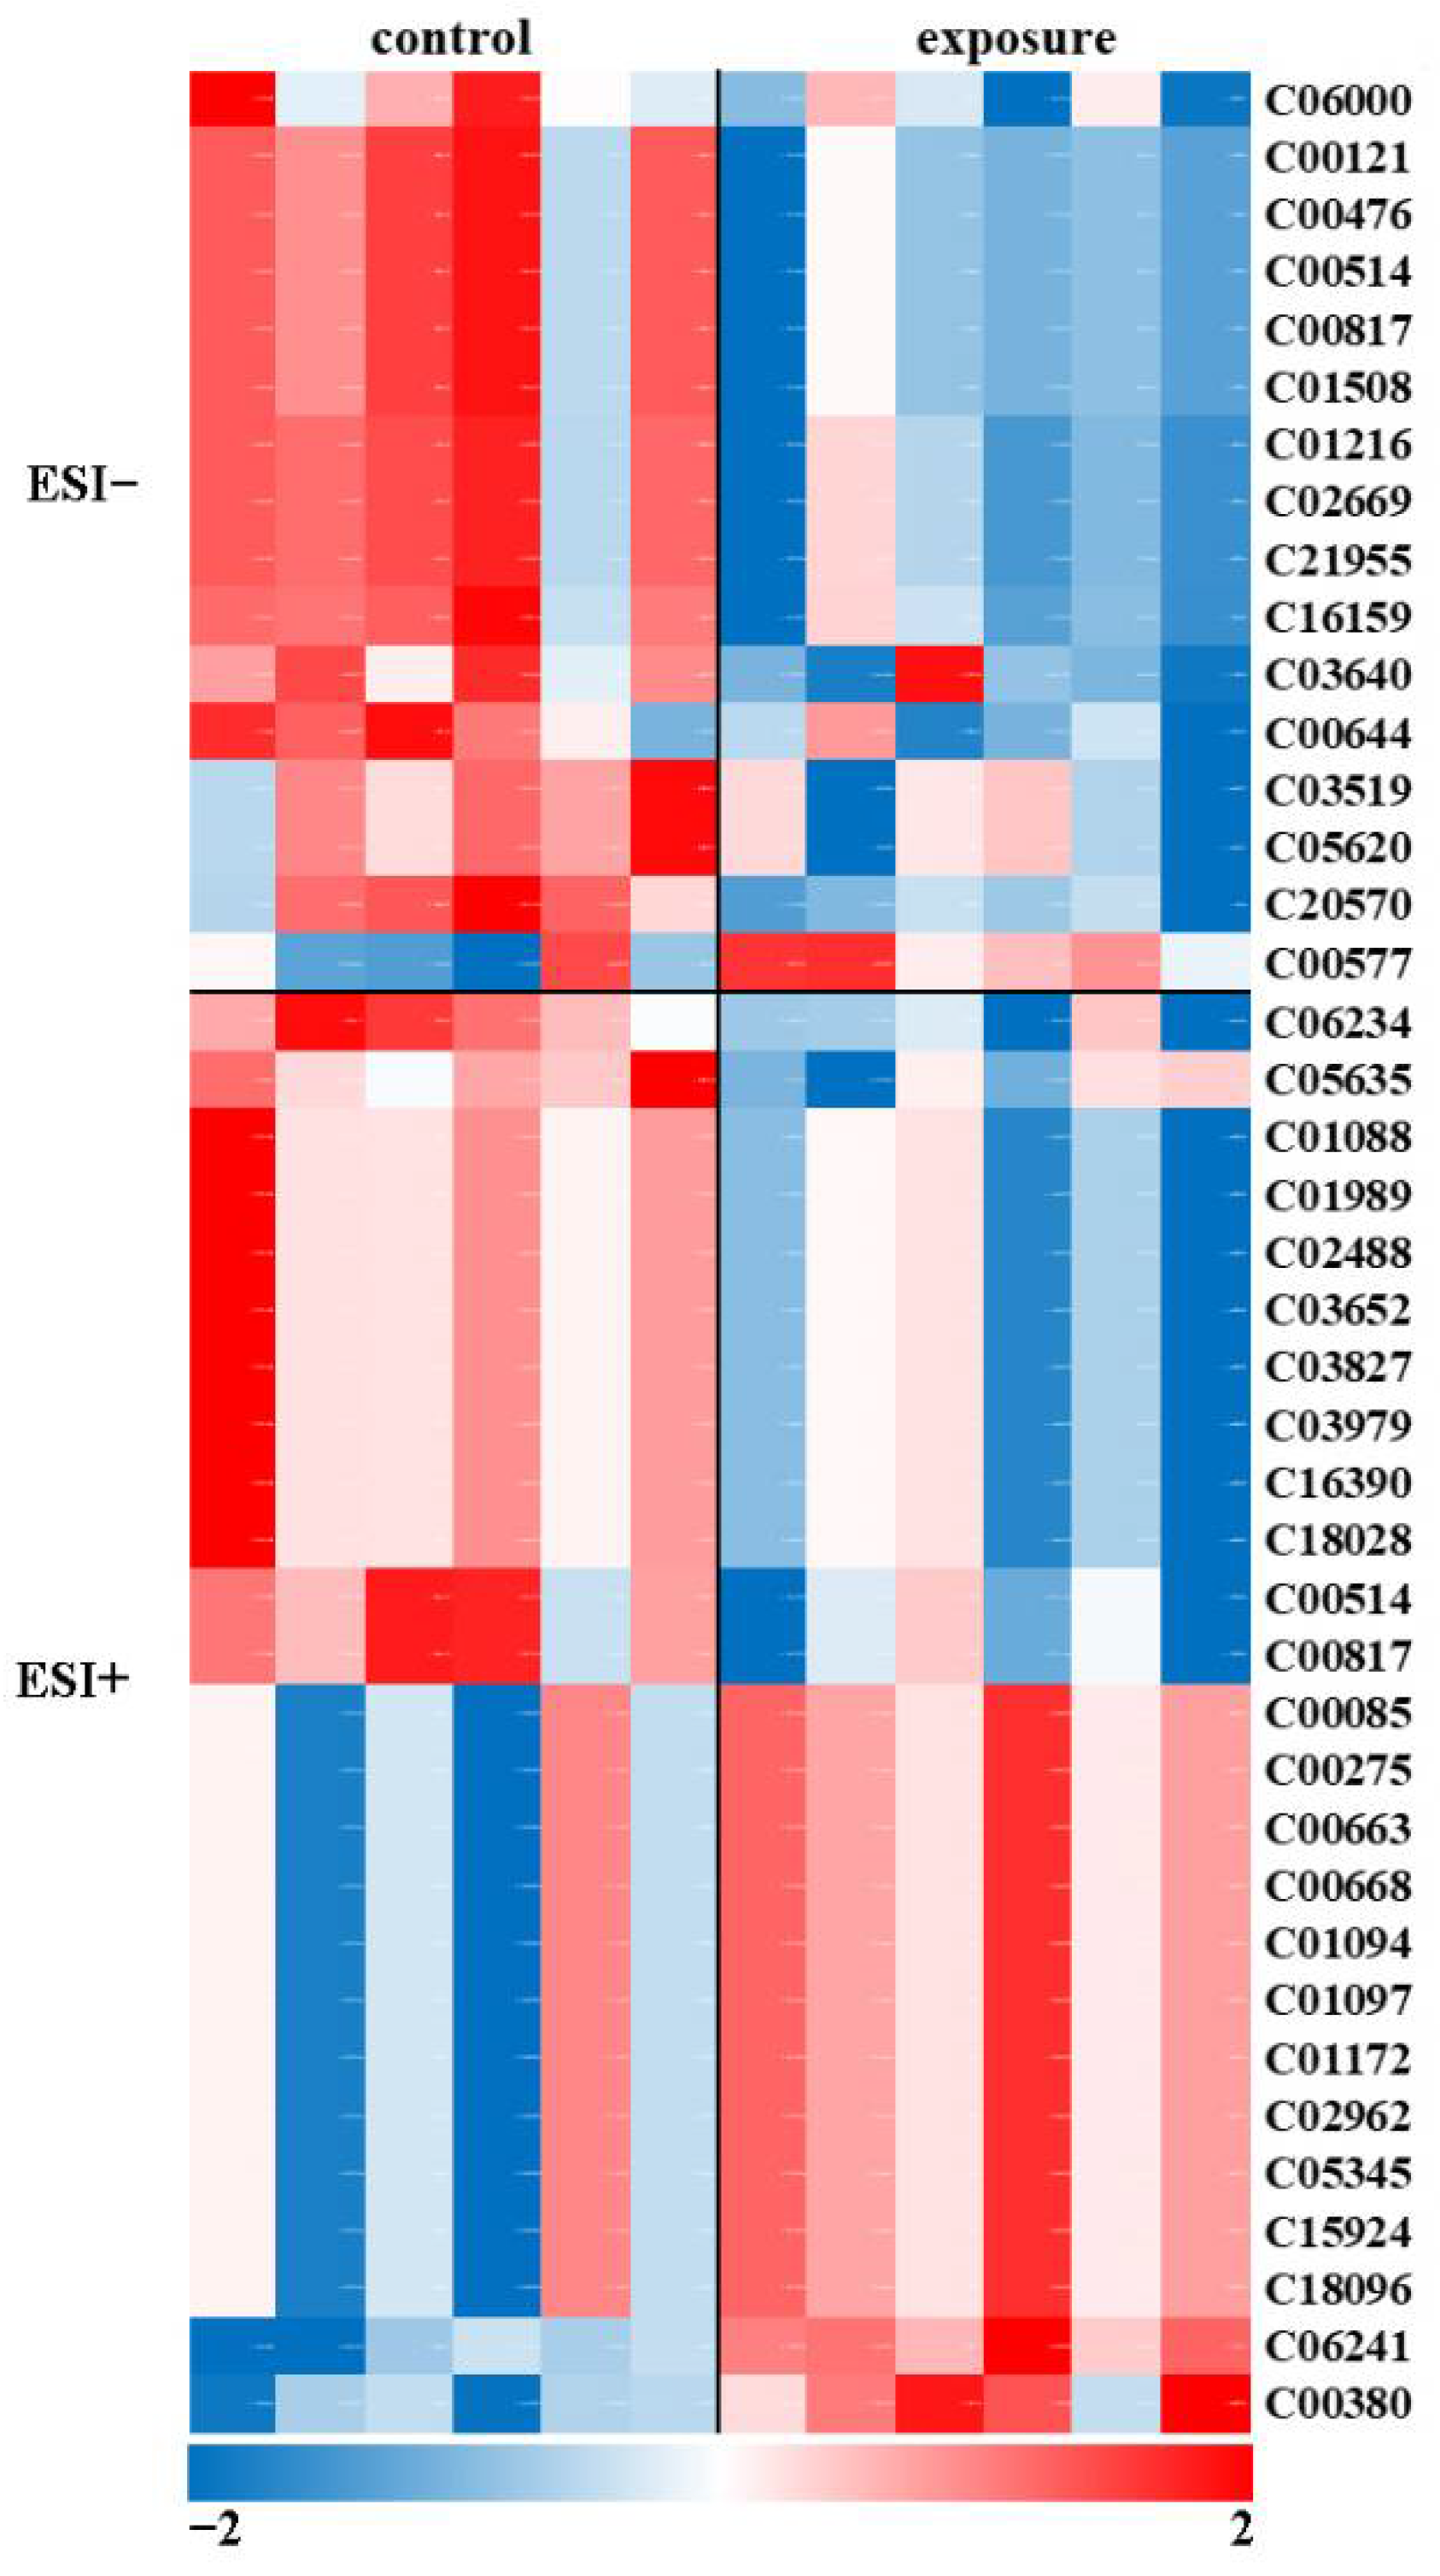
2.4. Metabolomic Analysis

The results of the principal component analysis (PCA) did not distinguish the control group from the exposure group (Figure S2a,b). Orthogonal partial least squares discriminant analysis (OPLS-DA) was also performed to evaluate group separation, and the comparison between control and exposure is shown in Figure S2c,d. The results indicated that the OPLS-DA models were reliable, which revealed a clear separation between control and exposure groups (Figure S2e,f). Then, the differential metabolites (DMs) of the liver were detected using non-targeted analyses, and the results illustrated that 41 metabolites (26 DMs in ESI+ and 15 DMs in ESI-) were dysregulated in control compared with the exposure group. These metabolites were tentatively identified based on comparing their accurate experimental molecular mass values with the corresponding molecular mass values reported in various online databases (mass error of the possible molecular formulas, 10 ppm). Table 3 shows the list of tentatively identified metabolites, differentiating between the control and MPs-exposed samples in ESI+ and ESI- mode, respectively. Metabolite identity, ions detected, molecular mass, relative mass error, p-value, fold-change, folding trend, and KEGG C-code are included in the table. several DMs were involved in glycolipid and pyrimidine metabolism.
The hierarchical clustering heat map reveals similar patterns of metabolite change in each group, revealing slight variations between biological replicates possibly due to natural biological variations. In Figure 4, the relative change in the metabolite concentrations is depicted with colors in the heatmap. Increased and decreased metabolites are represented in red and blue colors, respectively. Hierarchical clustering of metabolites revealed two primary clusters, with one including metabolites whose concentrations increased upon MPs exposure and the other including metabolites that were depleted by the treatment. Furthermore, the annotated KEGG pathways were classified according to the KEGG type (Figure S3). KEGG pathway analysis illustrated that many DMs were present in “pentose and glucuronate interconversions”, “fructose and mannose metabolism”, and “carbon metabolism” (Figure S3).

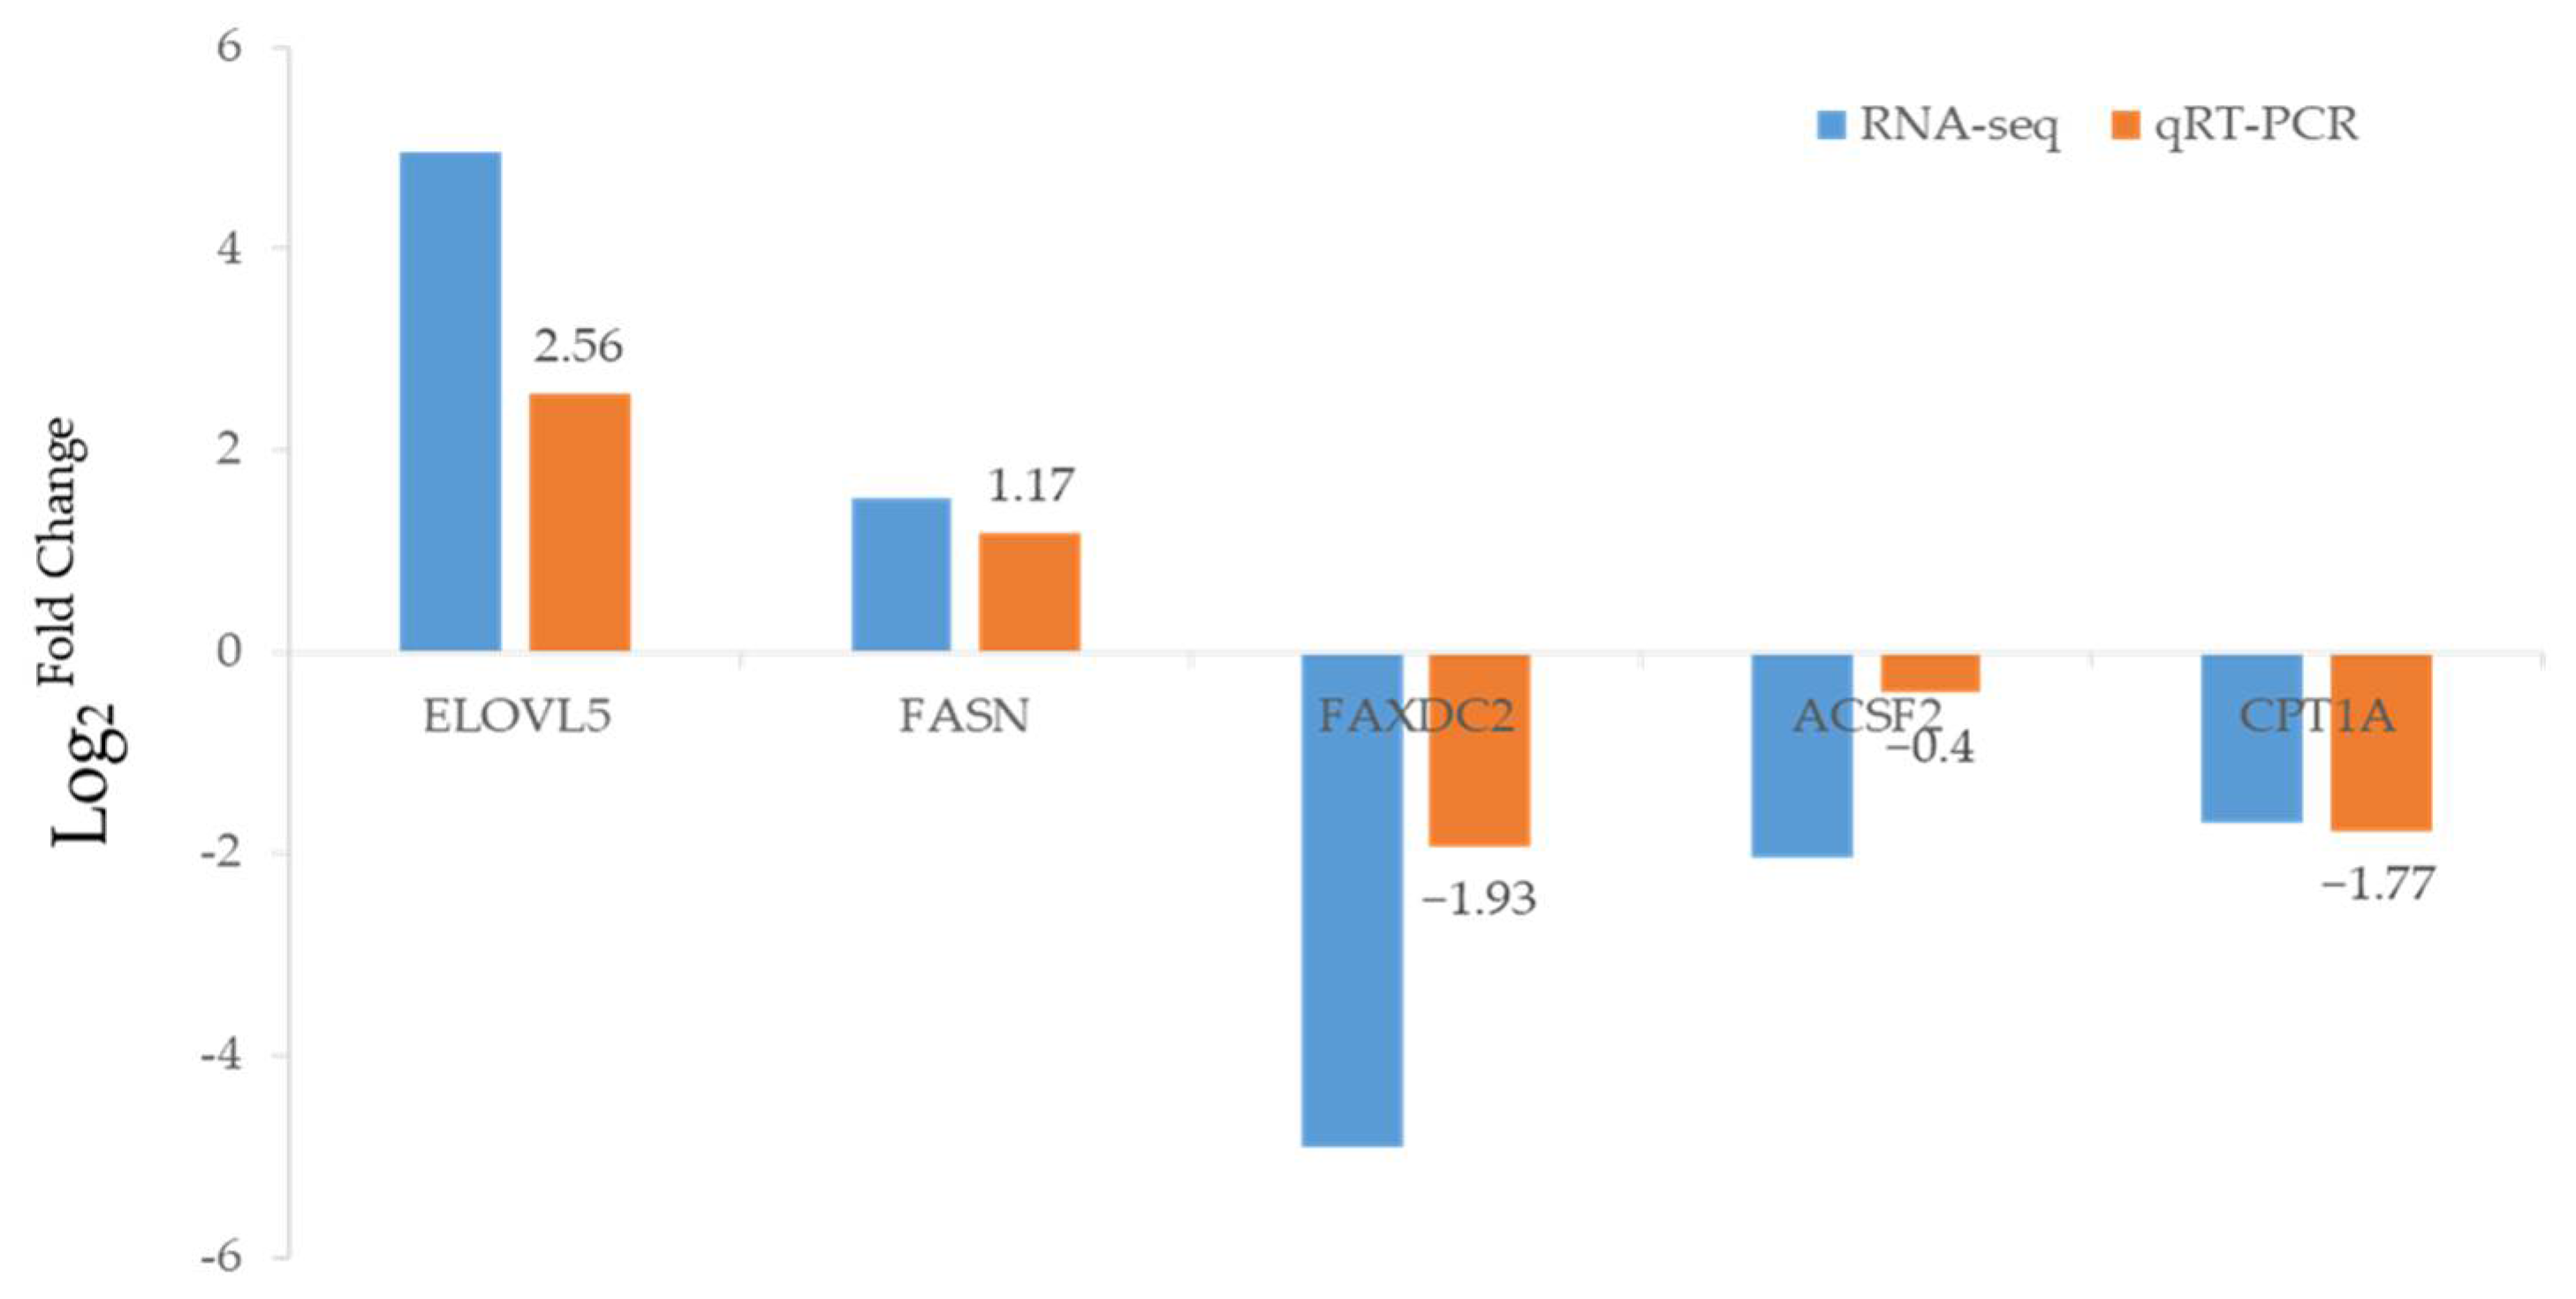
2.5. Confirmation of DEGs by qRT-PCR

To confirm the RNA-seq data, 5 DEGs involved in “lipid metabolism” were selected for qRT-PCR validation. These genes included carnitine O-palmitoyl transferase 1(CPT1A), fatty-acyl-CoA synthase (ACSF2), fatty acid hydroxylase do-main-containing protein 2 (FAXDC2), elongation of very long-chain fatty acids protein 5 (ELOVL5), and fatty acid synthase, animal type (FASN). The results revealed that gene expression patterns of the two methods were consistent (Figure 5), indicating the specificity and accuracy of the transcriptome expression analysis.

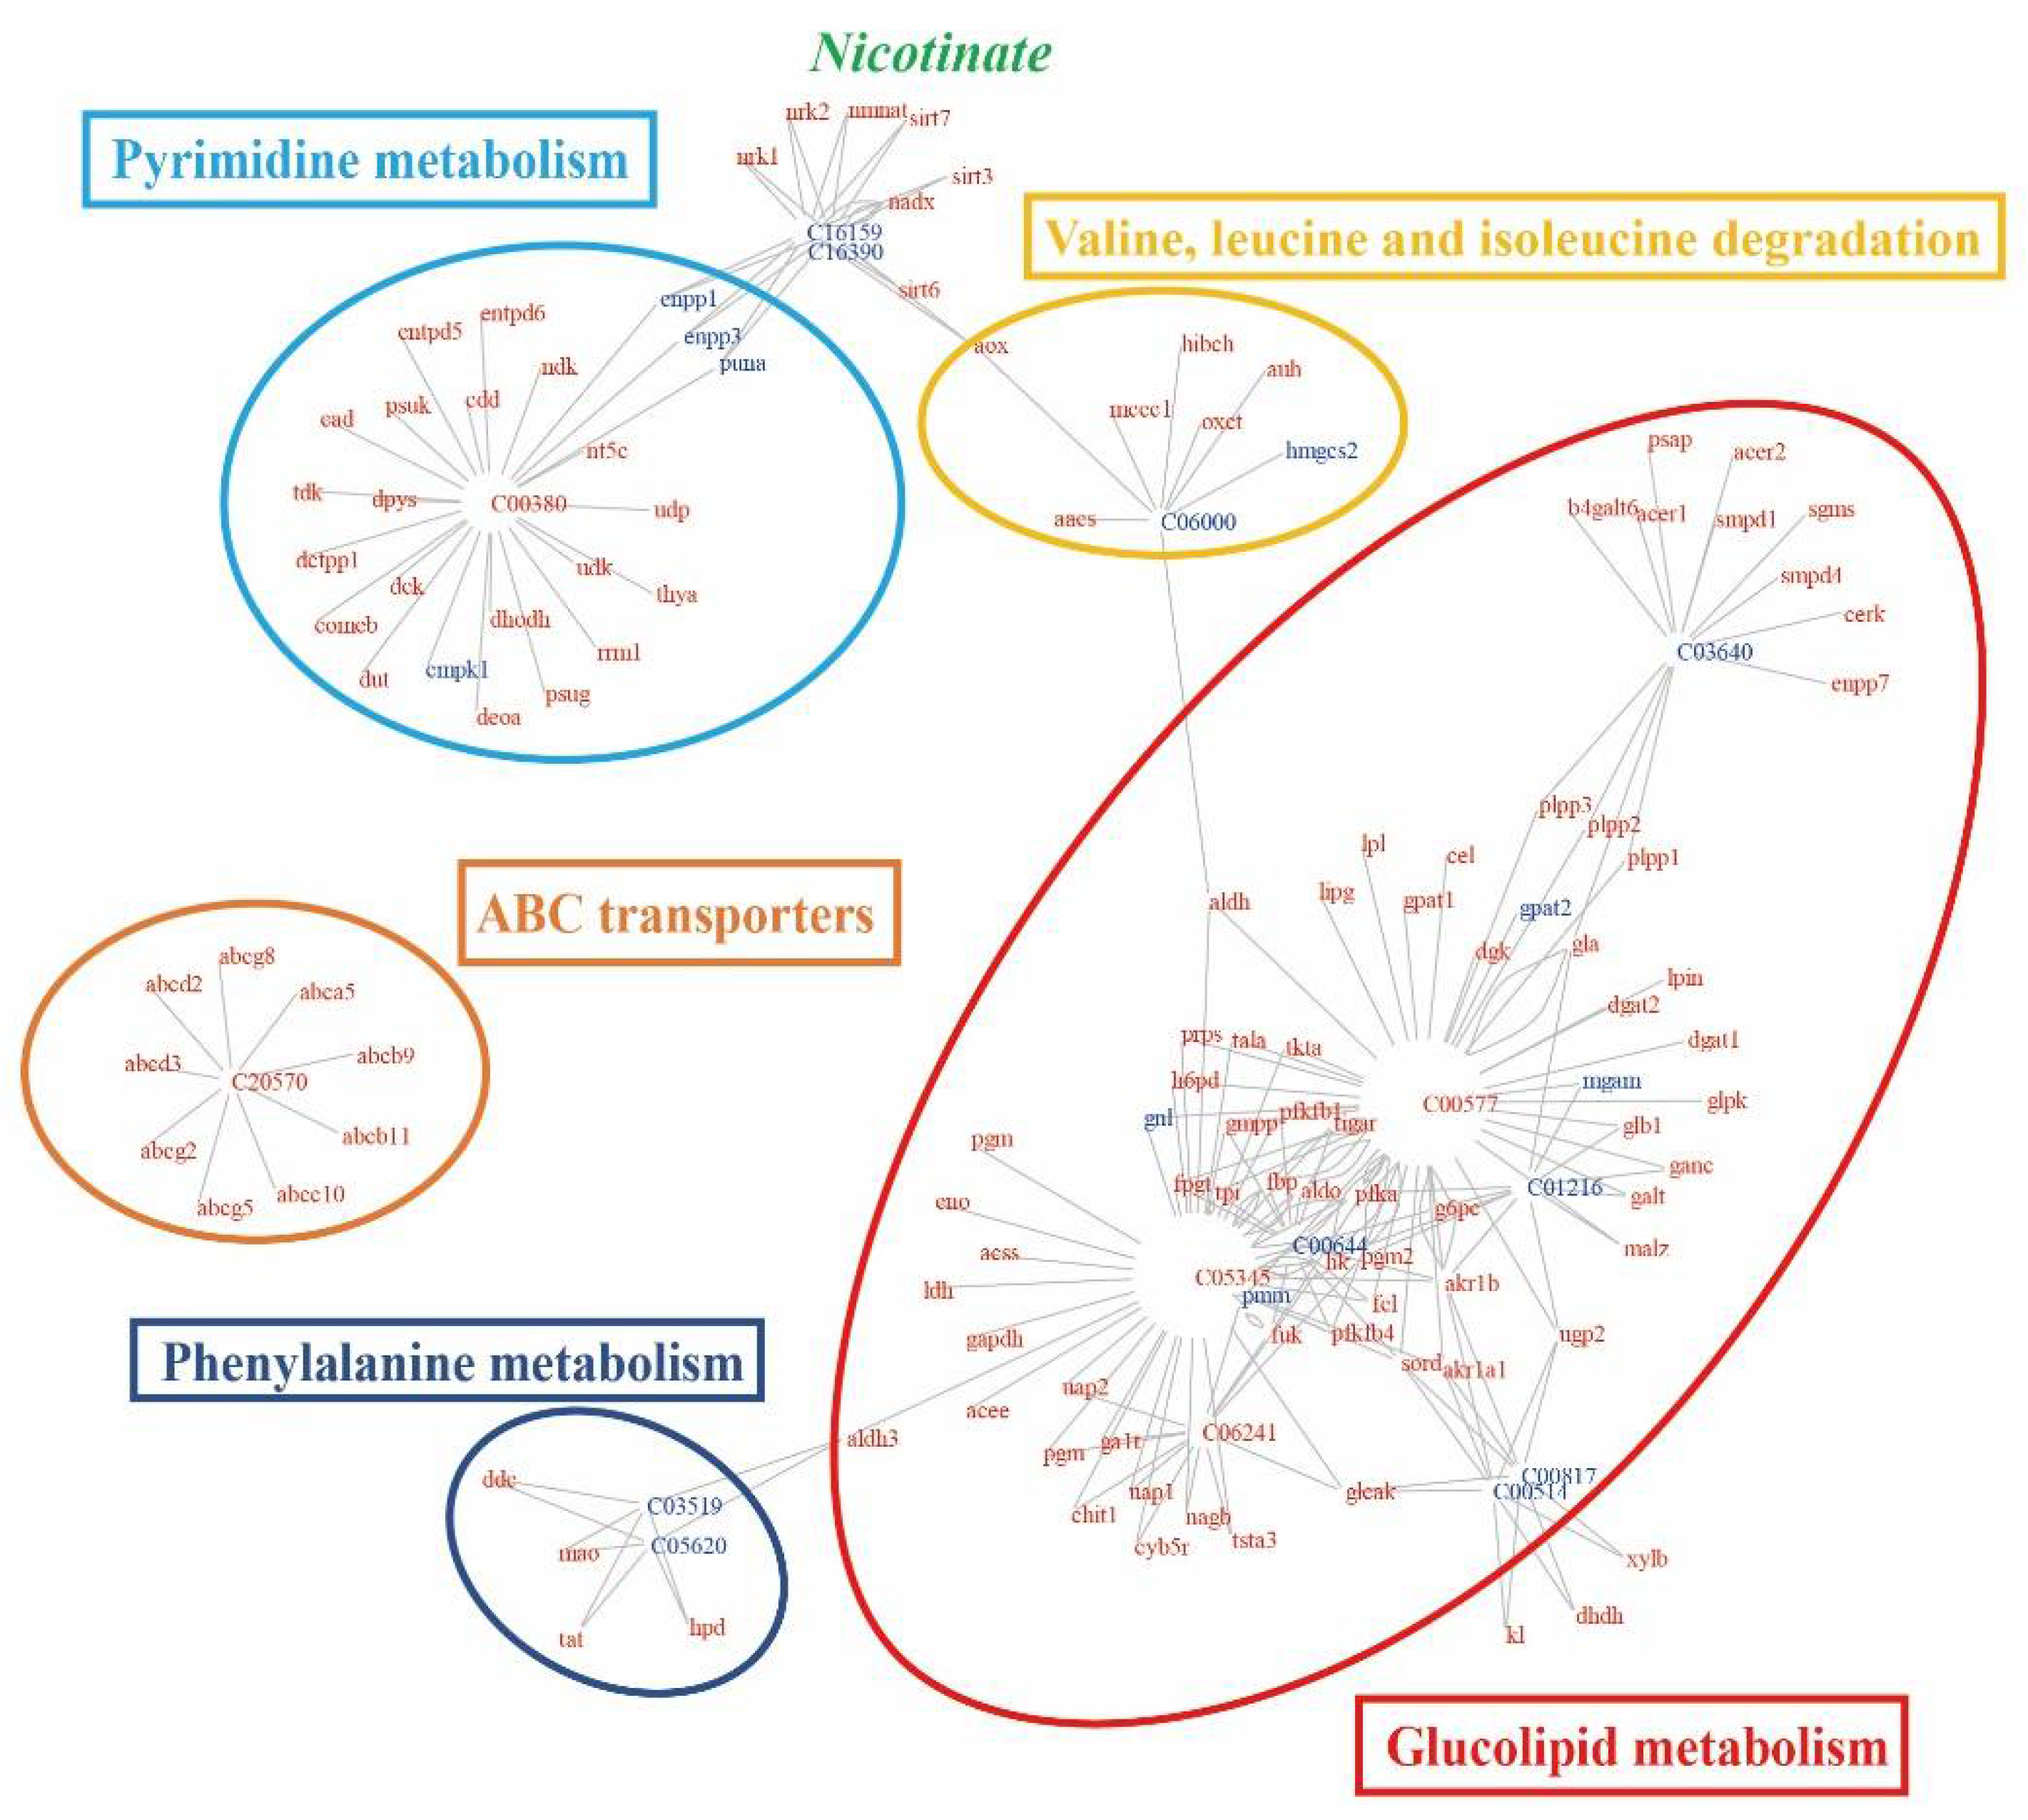
2.6. Pathway-Based Integration of Metabolomic and Transcriptomic Datasets

Integration of metabolomic and transcriptomic datasets improves the understanding of potential biological processes to gain insight into their mechanisms. Shared KEGG pathways between the control and exposure groups were identified. We chose 123 genes and 16 metabolites (Table S1) to construct the bipartite graph for visualization, shown in Figure 6. Genes and metabolites exhibited diverse colors with increased (red symbols) and decreased (blue symbols) mean. KEGG pathway analysis of the aggregated metabolite and gene biomarkers identified 14 functional modules related to metabolism, including more than three biomarkers (Table S1). All modules included at least three genes and one metabolite. Among 16 metabolites, two drew the most attention: d-Mannitol 1-phosphate (C05345) and d-Glyceraldehyde (C00577), which involved five different pathways individually. Additionally, 27 genes were involved in at least two functional modules [35].
The largest cluster of biomarkers comprised metabolites and genes related to glucolipid metabolism (red oval in Figure 6). The cluster was constructed by glycometabolism (fructose and mannose metabolism, galactose metabolism, amino sugar and nucleotide sugar metabolism, pentose and glucuronate interconversions, glycolysis/gluconeogenesis, and pentose phosphate pathway) and lipid-related metabolism (glycerolipid metabolism and sphingolipid metabolism). A second intensively populated cluster included biomarkers related to pyrimidine metabolism (blue oval in Figure 6). Additionally, valine, leucine and isoleucine degradation, ABC transporters, and phenylalanine metabolism are shown in the diagram.

3. Discussion

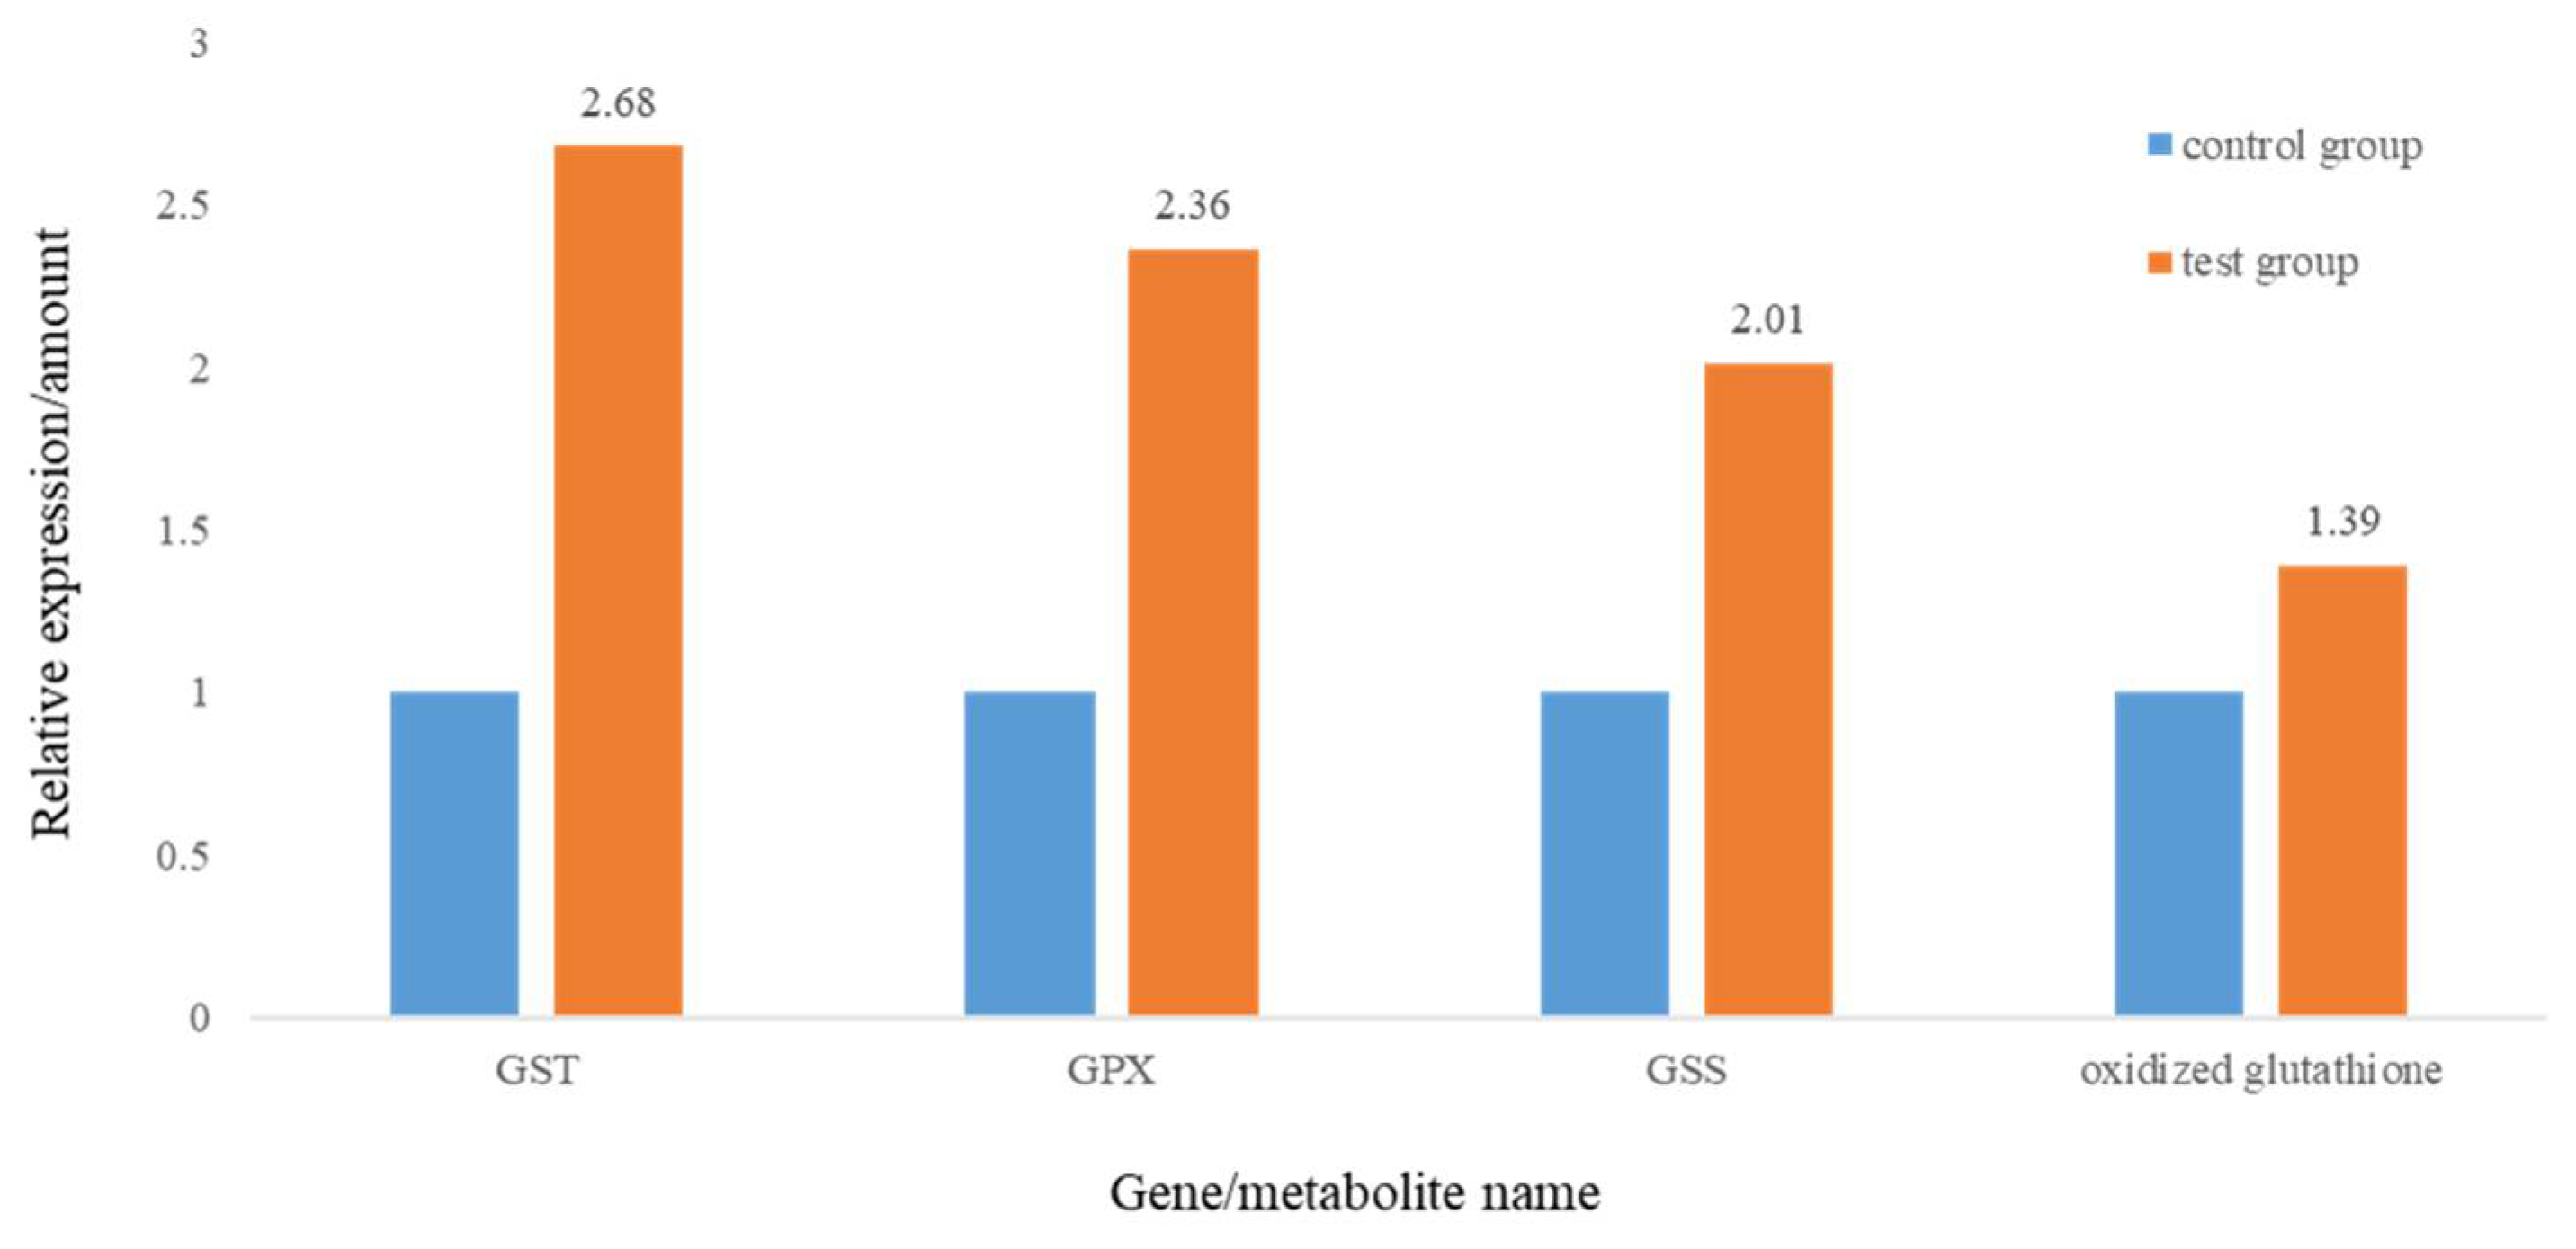
3.1. MP Exposure Induced Immune Reaction and Oxidative Stress in Rare Minnow

In the present study, transcriptomics, metabolomics, and histology results indicate early symptoms of liver damage. Cell hypertrophy and vacuolization in hepatocytes were observed in MPs-treated fish, indicating early inflammation in the liver. Moreover, similar results occurred through metabolomic and transcriptomic analysis. “Immune system” and “infectious diseases” pathways were enriched in transcriptomic analysis. Complement component 3 (C3) and component 4 (C4) were included in the top 20 changed genes. Complement was a crucial component of the innate immune system. Complement fragments play a vital role in inflammatory reactions, complex immune clearance, and antibody production. C3 and C4 expression changes indicate immune response in rare minnow. C3 and C4 exhibited different expression patterns in the present study, as complement is a highly sophisticated defense system [36]. Similar results have been reported in zebrafish. After exposure for 3 weeks to 2000 µg/L PS-MPs (5 µm and 70 nm diameter), early inflammatory responses, necrosis, and infiltration were observed in hepatocytes of zebrafish [25]. After feeding with PVC and PE for 21 days, histopathological damage was detected in the intestine and liver, with altered immune parameters in European sea bass Dicentrarchus labrax [28]. In addition, inflammatory responses were observed in mussels treated with PS and PE MPs [37]. MPs are recognized as foreign substances and stimulate or suppress fish immune responses by inducing immune-toxicity, meaning that MPs can affect fish immunity through various mechanisms [38].
In addition, oxidative stress caused by the overproduction of reactive oxygen species (ROS) is one of the most commonly measured biomarkers for environmental contaminant exposure, including MP exposure [39,40,41], consistent with our results. In our study, the relative content of oxidized glutathione (GSSG) was increased. Furthermore, the expression of glutathione S-transferase, glutathione peroxidase, and glutathione synthase was increased (Figure 7). Glutathione, a crucial cellular antioxidant, plays a crucial role in preventing oxidative damage and the toxicity of xenobiotic electrophiles in organisms [42,43]. MPs could induce intracellular ROS levels and cause inflammation and oxidative stress [23,37,44]. Exposure to MPs influences ROS production in rare minnows, stimulating antioxidant reactions and disturbing glutathione and its dependent cycle reactions [38].

3.2. MP Exposure Disturbed Glycolipid and Energy Metabolism in Rare Minnow

MPs exposure also disturbed the metabolomic profiles in fish liver, providing additional insights into the molecular mechanisms of toxicity induced by MPs. These altered metabolites were involved in carbohydrates, fatty acids, amino acids, and nucleic acid and appeared as a primary response to MPs exposure. Significant perturbation occurred in most monosaccharide metabolism pathways, including galactose metabolism, fructose and mannose metabolism, pentose phosphate pathway, pentose and glucuronate interconversions, and glycolysis/gluconeogenesis. Energy production from these metabolic pathways was also disturbed. For instance, d-glyceraldehyde (C00577) and beta-d-Fructose 6-phosphate (C05345) contents, which play a vital role in the pentose phosphate pathway, were increased in the current research. In general, pentose phosphate pathway functions include the production of sugar phosphates as intermediates for biosynthesis and NADPH, a biological reducing agent, together with several secondary function dependent metabolites [45]. Additionally, glycolysis/gluconeogenesis are the primary pathways related to energy metabolism. Hence, MP exposure triggered energy metabolism change and disturbed material supply to a wide range of biological processes, including lipid, amino acid, and carbohydrate synthesis [46].
MP exposure induced abnormal lipid metabolism in rare minnows, including glycerolipid and sphingolipid metabolism. Pathway-based integration analysis revealed that the key metabolite in lipid metabolism (C00577) concentration increased. The alteration can be correlated with the changes in gene expression in the same pathway, such as alcohol dehydrogenase, aldehyde reductase, glycerol kinase, and diacylglycerol O-acyltransferase, which confirmed the alteration in lipid metabolism. Additionally, lipid droplets, which plays a vital role in intracellular lipid storage and lipid metabolism regulation, were numerous and larger in the exposed group liver [47]. Our result was consistent with the metabonomic results. Combining expression patterns of genes related to lipid synthesis (elovl5, fasn) with lipolysis (faxdc2, acsf2, cat1a), it was determined that lipogenesis was triggered and lipolysis was inhibited during lipid accumulation.
In conclusion, MP exposure may trigger lipid synthesis and inhibit lipolysis in rare minnow. Lu et al. (2016) discovered that microplastics could alter the metabolic profile in adult zebrafish liver and disturb lipid and energy metabolism [28]. Wan et al. (2019) also demonstrated that 5/50 mm PS-MP exposure altered the genes associated with glycolysis/lipid metabolism in the larval zebrafish, which proved the effects of PS-MP on disturbing the metabolism of energy and glycolipids [39]. Additionally, microplastics induce intestinal lipid metabolism disorders in zebrafish, and six-lipid metabolism-related metabolites of propylene glycol, linoleic acid, palmitic acid, carnitine, triglycerides, and Trimethylamine N-oxide (TMAO) were significantly altered in MPs-treated zebrafish guts [48]. These results are in accordance with our study. The current study investigated the histology and metabolic changes of lipid and revealed perturbation of lipid storage and lipid metabolism in rare minnow. Lipid metabolism is an essential cellular process that converts nutrients into metabolic intermediates for membrane biosynthesis, energy storage, and signaling molecule generation [49,50]. Furthermore, lipids play a vital role in reproduction and sexual maturation, immunological responses, and environmental adaptation [51]. Therefore, MP exposure might disturb several biological processes in rare minnows.
In addition to the largest cluster, we observed changes in biochemical pathways related to amino acids and pyrimidine. Isoleucine, valine, and leucine are branched-chain amino acids (BCAAs), promoting fatty acid metabolism and preventing fat accumulation. Isoleucine, leucine, valine, and lysine can regulate energy metabolism [37], and reduction in these metabolites indicated that PS-MPs exposure induced lipid and energy metabolism disruption in rare minnow. Pyrimidines are the catabolic products of nucleotides and can be uptaken and reutilized by the cells of the other organs to support protein synthesis [52]. In rare minnow, relative metabolites and genes were increased, which may help produce a larger amount of material for subsequent biological processes.

4. Materials and Methods

4.1. Fish Maintenance

Mixed-sex rare minnows were obtained from the Institute of Hydrobiology, Chinese Academy of Science. The mean total length, body length, and wet weight (±standard deviation) of subadult fish (age, 3 months) were 31.18 ± 1.59 mm, 25.23 ± 1.20 mm, and 0.32 ± 0.07 g, respectively. The fish were acclimated in 8 L glass tanks for 7 days before the experiment and fed fresh Artemia nauplii twice daily. During the acclimation period, fish were maintained at 25 ± 1 °C and subjected to a photoperiod of 16:8 h (light/dark) [53]. The culture water in the tank was refreshed every 48 h. All experimental procedures were approved by the Animal Care and Use Committee of the Institute of Hydrobiology, Chinese Academy of Sciences (Approval Protocol No. Y913101101), and all the experiments were conducted in accordance with the guidelines of the committee.

4.2. MPs Exposure

The PS-MPs (1 μm diameter beads) labeled with green fluorescence (excitation wavelength, 488 nm; emission wavelength, 518 nm; w/v = 10 mg/mL; ρ = 1.05 g/cm3, C.V = 5–10%) were purchased from Tianjin Baseline ChromTech Research Center (Tianjin, China). The size of the particles was confirmed using a scanning electron microscope (SEM) (Figure S4). Before configuring the test solution, the PS-MPs were shaken for 30 min (40,000 Hz) with an ultrasonic instrument to produce a homogeneous mixture. Acclimated rare minnows were randomly assigned to 10 glass tanks (5 replicates each in the experiment and control group), and each tank contained 12 fish and 6 L test solution. The test solution was prepared for the treatment group by dispersing MPs in water to achieve a final MPs concentration of 200 μg/L (≈ 3.6 × 10⁸ items/L). The exposure concentration was chosen in view of the environmental concentration and other studies about the toxic effects of microplastics on aquatic organisms [54,55]. During the experiment, the test solution in each tank was refreshed every 48 h, and all tanks were continually aerated to maintain particles dispersion in water. Fish were exposed to the diluting water without MPs for the control group. All the other conditions were consistent with those in the acclimation period.
After exposure for 28 days, rare minnows were sampled on the same day, rinsed to remove the particles from the skin, and euthanized by general anesthesia. Depending on the experiment’s aim, the fish’s liver was dissected, immediately frozen in liquid nitrogen and stored at −80 °C for metabolomic analysis and transcriptomic analysis or fixed in 10% formalin for histopathological analysis.

4.3. Histopathological Analysis

Six fish from each treatment group were used to assess liver tissue damage. The tissues were fixed in 10% formalin, embedded in paraffin wax, sectioned at 4 μm thickness, and stained with eosin (H&E) and oil red O for observation of organizational form and lipid droplet precipitation, respectively. The scanned slices were histopathologically analyzed [56]. To observe the presence of fluorescent-labeled polystyrene microplastic particles in liver, one bright-field image was acquired by microscopy first, and then a dark-field image of the slide was acquired by epifluorescence microscopy [47].

4.4. RNA Extraction, Library Preparation, and Transcriptome Sequencing

We prepared six different sequencing libraries for RNA-seq as follows: Trizol Reagent (Invitrogen, Carlsbad, CA, USA) was utilized to extract total RNA from frozen samples of rare minnow according to the manufacturer’s protocol. Nine fish from each group were used for the transcriptome analysis. The livers of every three fish were pooled and used for extraction. All extracted samples were stored at −80 °C until analysis. Subsequently, total RNA was qualified and quantified using a Nano Drop and Agilent 2100 bioanalyzer (Thermo Fisher Scientific, Waltham, MA, USA) [40, 57].
Oligo(dT)-attached magnetic beads were used to purify mRNA. After addition of fragmentation buffer to generate short mRNA fragments (each of approximately 200 bp), random hexamer primers were applied to synthesize the first-strand cDNA. Buffer, dNTPs, RNase H, and DNA polymerase I were added to synthesize the second strand. The cDNA fragments were amplified by PCR, purified by Ampure XP Beads, then dissolved in EB solution. The double-stranded PCR products were heated, denatured, and circularized by the splint oligo sequence to obtain the final library. Each library was sequenced on the BGIseq500 platform (BGI-Shenzhen, China).
To gain insight to the change of phenotype, GO and KEGG enrichment analysis of annotated differentially expressed genes was performed by Phyper based on the hypergeometric test. The sequencing data were filtered with SOAPnuke (v1.5.2) [58], and clean reads were obtained and stored in FASTQ format. Essentially, differential expression analysis was performed using DESeq2 (v1.4.5) [59] with Q-value ≤ 0.05.

4.5. Metabolite Analysis

Liver samples were collected and stored at −80 °C until analysis. Metabolites were first extracted with 800 μL of pre-cooled precipitant (methanol/acetonitrile/pure water = 2:2:1). After grinding (60 Hz, for 4 min), samples were subjected to ultrasonic treatment (80 HZ, 10 min) and stored at −20 °C for 120 min. Then, the samples were centrifuged for 15 min (25,000 g, 4 °C), and the supernatant was obtained in a dryer. Then, 50 μL of each sample was mixed into a quality control sample. The raw data of the mass spectrometer were preprocessed in Xevo G2-XS QTOF (Waters, Manchester, UK), and peak extraction was performed primarily through Progenesis QI (version 2.2). Principal component analysis (PCA) and orthogonal partial least squares discriminant analysis (OPLS-DA) were performed to analyze the principal components of each group before screening the differential metabolites. Afterwards, the metabolites with VIP > 1 and p < 0.05 were selected as the differential metabolites (DMs). Finally, the DMs of positive and negative modes were combined to conduct KEGG pathway analysis.

4.6. Metabolomics and Transcriptomics Combination Analysis

To obtain a more comprehensive insight into the abnormally regulated pathways, pathway-based integration of metabolomic and transcriptomic datasets was performed with the reshape2 and igraph packages in R [60]. Additionally, the Pearson correlation coefficient (PCC) and the relevant p-value were evaluated to assess the correlation between the differential metabolites and DEGs. Any given metabolite was considered linked to a given gene if they shared at least one common KEGG pathway. Only PCC greater than 0.90 and Pearson correlation coefficient p-value (PCCP) less than 0.05 were considered significant.

4.7. Validation of DEGs by qRT-PCR

To validate the reliability of data obtained by RNA-seq, qRT-PCR was performed. Eighteen fish from each group were used, and five DEGs were randomly selected. Total RNA from the liver of each fish was isolated through an SV total RNA isolation system kit (Promega, Madison, WI, USA). Then, 4 μg of isolated total RNA was transcribed to cDNA through the RevertAid™ First Strand cDNA Synthesis Kit (Fermentas, Waltham, MA, USA) with oligo-dT primers. Next, qRT-PCR was performed using the Fast Start Universal SYBR Green Master Mix (Roche, Mannheim, Germany). Primer sequences are listed in Table S2. Three replicates were included for each sample, and the β-actin gene was used as an internal control for normalization of gene expression. Relative expression levels were measured in threshold cycle value and normalized using the equation 2−ΔΔCt method [61].

4.8. Data Analyses

Histopathological analysis was performed using CaseViewer 2.2. We tested data normality and variance homogeneity. After that, a one-way ANOVA test followed by Dunnett’s test were used to evaluate the statistical differences of gene expression between the control and treatment group in IBM SPSS Statistics 20.

5. Conclusions

Non-targeted LC-MS metabolomics, RNA-seq transcriptomic and histology analyses reflected a defined metabolic disruption in rare minnow exposure to PS-MPs. These non-targeted approaches were used to identify a complete disruption compared with the usually used targeted techniques with limited profiling capability [35]. Integration of both transcriptomic and metabolomic results at the pathway level revealed the presence of affected metabolic routes in rare minnow. MP exposure may induce immune reaction and oxidative stress and disturb glycolipid and energy metabolism in rare minnow. Studies have demonstrated that lipids are susceptible to oxidation. Oxidative stress and inflammation could impair lipid metabolism [62]. MPs exposure may stimulate lipogenesis and inhibit lipolysis in rare minnow. Further investigation requires additional efforts. Our study provided new insights into the molecular and metabolic characteristics underlying rare minnow exposure to MP on a theoretical basis. However, the potential toxic effects are primarily unclear. More efforts are required in multivariate-based integration.

Supplementary Materials

The following are available online, Figure S1: Fluorescently labeled PS-MPs of 1 µm diameter did not accumulate in liver of rare minnow, Figure S2: Multivariate statistical analysis in control and MPs exposure groups, Figure S3: KEGG pathway classification of the differential metabolites in “control vs. exposure”, Figure S4: The images for 1 μm fluorescent PS-MPs detected using a scanning electron microscope (SEM) and fluorescence microscopy, Table S1: Pathway analysis (KEGG) for metabolites and genes significantly affected by MP exposure, Table S2: Pathway analysis (KEGG) for metabolites and genes significantly affected by MP exposure.

Author Contributions

Conventionalization and experimental design: J.W. and C.W.; Manuscript preparation: C.W. and M.H.; Analysis: K.S.; writing—review and editing, J.W. and H.W. All authors have read and agreed to the published version of the manuscript.

Funding

This research was funded by National Natural Science Foundation of China (No. 31802023).

Institutional Review Board Statement

All of the experimental procedures were approved by the Animal Care and Use Committee of the Institute of Hydrobiology, Chinese Academy of Sciences (Approval Protocol No. Y913101101, 1 January 2019), and all experiments were conducted in accordance with the guidelines of the committee.

Informed Consent Statement

Not Applicable.

Data Availability Statement

No data reported.

Conflicts of Interest

The authors declare no conflict of interest.

References

  1. Zhang, C.; Wang, J.; Zhou, A.; Ye, Q.; Feng, Y.; Wang, Z.; Wang, S.; Xu, G.; Zou, J. Species-specific effect of microplastics on fish embryos and observation of toxicity kinetics in larvae. J. Hazard. Mater. 2021, 403, 123948. [Google Scholar] [CrossRef] [PubMed]
  2. Jenna, R.; Jambeck, R.G.; Chris, W.; Theodore, R.; Siegler, M.P.; Anthony, A.; Ramani, N.; Kara, L.L. Plastic waste inputs from land into the ocean. Science 2015, 347, 768–771. [Google Scholar]
  3. Frias, J.; Nash, R. Microplastics: Finding a consensus on the definition. Mar. Pollut. Bull. 2019, 138, 145–147. [Google Scholar] [CrossRef]
  4. Thompson, R.C.; Olsen, Y.; Mitchell, R.P.; Davis, A.; Rowland, S.J.; John, A.W.; McGonigle, D.; Russell, A.E. Lost at sea: Where is all the plastic? Science 2004, 304, 838. [Google Scholar] [CrossRef] [PubMed]
  5. Parker, B.W.; Beckingham, B.A.; Ingram, B.C.; Ballenger, J.C.; Weinstein, J.E.; Sancho, G. Microplastic and tire wear particle occurrence in fishes from an urban estuary: Influence of feeding characteristics on exposure risk. Mar. Pollut. Bull. 2020, 160, 111539. [Google Scholar] [CrossRef] [PubMed]
  6. Jabeen, K.; Su, L.; Li, J.; Yang, D.; Tong, C.; Mu, J.; Shi, H. Microplastics and mesoplastics in fish from coastal and fresh waters of China. Environ. Pollut. 2017, 221, 141–149. [Google Scholar] [CrossRef]
  7. McNeish, R.E.; Kim, L.H.; Barrett, H.A.; Mason, S.A.; Kelly, J.J.; Hoellein, T.J. Microplastic in riverine fish is connected to species traits. Sci. Rep. 2018, 8, 11639. [Google Scholar] [CrossRef] [PubMed] [Green Version]
  8. Assas, M.; Qiu, X.; Chen, K.; Ogawa, H.; Xu, H.; Shimasaki, Y.; Oshima, Y. Bioaccumulation and reproductive effects of fluorescent microplastics in medaka fish. Mar. Pollut. Bull. 2020, 158, 111446. [Google Scholar] [CrossRef]
  9. Wang, W.; Ge, J.; Yu, X. Bioavailability and toxicity of microplastics to fish species: A review. Ecotoxicol. Environ. Saf. 2020, 189, 109913. [Google Scholar] [CrossRef]
  10. Pang, M.; Wang, Y.; Tang, Y.; Dai, J.; Tong, J.; Jin, G. Transcriptome sequencing and metabolite analysis reveal the toxic effects of nanoplastics on tilapia after exposure to polystyrene. Environ. Pollut. 2021, 277, 116860. [Google Scholar] [CrossRef]
  11. Browne, M.A.; Dissanayake, A.; Gaiioway, T.S.; Lowe, D.M.; Thompson, R.C. Ingested microscopic plastic translocates to the circulatory system of the mussel, Mytilus edulis (L.). Environ. Sci. Technol. 2008, 42, 5026–5031. [Google Scholar] [CrossRef]
  12. Devriese, L.I.; van der Meulen, M.D.; Maes, T.; Bekaert, K.; Paul-Pont, I.; Frere, L.; Robbens, J.; Vethaak, A.D. Microplastic contamination in brown shrimp (Crangon crangon, Linnaeus 1758) from coastal waters of the Southern North Sea and channel area. Mar. Pollut. Bull. 2015, 98, 179–187. [Google Scholar] [CrossRef]
  13. Watts, A.J.; Urbina, M.A.; Corr, S.; Lewis, C.; Galloway, T.S. Ingestion of plastic Microfibers by the crab Carcinus maenas and its effect on food consumption and energy balance. Environ. Sci. Technol. 2015, 49, 14597–14604. [Google Scholar] [CrossRef]
  14. Wright, S.L.; Thompson, R.C.; Galloway, T.S. The physical impacts of microplastics on marine organisms: A review. Environ. Pollut. 2013, 178, 483–492. [Google Scholar] [CrossRef]
  15. Sussarellu, R.; Suquet, M.; Thomas, Y.; Lambert, C.; Fabioux, C.; Pernet, M.E.; Le Goic, N.; Quillien, V.; Mingant, C.; Epelboin, Y.; et al. Oyster reproduction is affected by exposure to polystyrene microplastics. Proc. Natl. Acad. Sci. USA 2016, 113, 2430–2435. [Google Scholar] [CrossRef] [PubMed] [Green Version]
  16. Wright, S.L.; Kelly, F.J. Plastic and Human Health A Micro Issue? Environ. Sci. Technol. 2017, 51, 6634–6647. [Google Scholar] [CrossRef]
  17. Ian, A.K.; Michael, A.C.; Elda, M.; Roy, W.; James, J.R.; Pierre, G.; Florian, P. Seafloor microplastic hotspots controlled by deep-sea circulation. Science 2020, 368, 1140–1145. [Google Scholar]
  18. Yang, H.; Chen, G.; Wang, J. Microplastics in the Marine Environment: Sources, Fates, Impacts and Microbial Degradation. Toxics 2021, 9, 41. [Google Scholar] [CrossRef] [PubMed]
  19. Barboza, L.G.A.; Vieira, L.R.; Branco, V.; Figueiredo, N.; Carvalho, F.; Carvalho, C.; Guilhermino, L. Microplastics cause neurotoxicity, oxidative damage and energy-related changes and interact with the bioaccumulation of mercury in the European seabass, Dicentrarchus labrax (Linnaeus, 1758). Aquat. Toxicol. 2018, 195, 49–57. [Google Scholar] [CrossRef] [PubMed]
  20. Han, Y.; Zhou, W.; Tang, Y.; Shi, W.; Shao, Y.; Ren, P.; Zhang, J.; Xiao, G.; Sun, H.; Liu, G. Microplastics aggravate the bioaccumulation of three veterinary antibiotics in the thick shell mussel Mytilus coruscus and induce synergistic immunotoxic effects. Sci. Total Environ. 2021, 770, 145273. [Google Scholar] [CrossRef]
  21. Scherer, C.; Brennholt, N.; Reifferscheid, G.; Wagner, M. Feeding Type and Development Drive the Ingestion of Microplastics by Freshwater Invertebrates. Sci. Rep. 2017, 7, 17006. [Google Scholar] [CrossRef] [Green Version]
  22. Walkinshaw, C.; Lindeque, P.K.; Thompson, R.; Tolhurst, T.; Cole, M. Microplastics and Seafood: Lower Trophic Organisms at Highest Risk of Contamination. Ecotoxicol. Environ. Saf. 2020, 190, 110066. [Google Scholar] [CrossRef]
  23. Albano, M.; Panarello, G.; Di Paola, D.; Capparucci, F.; Crupi, R.; Gugliandolo, E.; Spanò, N.; Capillo, G.; Savoca, S. The influence of polystyrene microspheres abundance on development and feeding behavior of Artemia salina (Linnaeus, 1758). Appl. Sci. 2021, 11, 3352. [Google Scholar] [CrossRef]
  24. Plee, T.A.; Pomory, C.M. Microplastics in sandy environments in the Florida Keys and the panhandle of Florida, and the ingestion by sea cucumbers (Echinodermata: Holothuroidea) and sand dollars (Echinodermata: Echinoidea). Mar. Pollut. Bull. 2020, 158, 111437. [Google Scholar] [CrossRef] [PubMed]
  25. Liu, Y.Q.; Qiu, X.C.; Xu, X.N.; Takai, Y.K.; Ogawa, H.; Shimasaki, Y. Uptake and Accumulation of Polystyrene Microplastics in Zebrafish (Danio rerio) and Toxic Effects in Liver. Environ. Sci. Technol. 2016, 50, 4054–4060. [Google Scholar] [CrossRef]
  26. Scopetani, C.; Esterhuizen, M.; Cincinelli, A.; Pflugmacher, S. Microplastics Exposure Causes Negligible Effects on the Oxidative Response Enzymes Glutathione Reductase and Peroxidase in the Oligochaete Tubifex tubifex. Toxics 2020, 8, 14. [Google Scholar] [CrossRef] [Green Version]
  27. Liu, Y.; Qiu, X.; Xu, X.; Takai, Y.; Ogawa, H.; Shimasaki, Y.; Oshima, Y. Uptake and depuration kinetics of microplastics with different polymer types and particle sizes in Japanese medaka (Oryzias latipes). Ecotoxicol. Environ. Saf. 2021, 212, 112007. [Google Scholar] [CrossRef]
  28. Espinosa, C.; Esteban, M.A.; Cuesta, A. Dietary administration of PVC and PE microplastics produces histological damage, oxidative stress and immunoregulation in European sea bass (Dicentrarchus labrax L.). Fish Shellfish Immunol. 2019, 95, 574–583. [Google Scholar] [CrossRef] [PubMed]
  29. Shi, L.X.; Wang, N.H.; Hu, X.D.; Yin, D.C.; Wu, C.X.; Liang, H.F.; Cao, W.X.; Cao, H. Acute toxic effects of lead (Pb2+) exposure to rare minnow (Gobiocypris rarus) revealed by histopathological examination and transcriptome analysis. Environ. Toxicol. Pharmacol. 2020, 78, 103385. [Google Scholar] [CrossRef] [PubMed]
  30. Gao, J.; Liu, S.; Zhang, Y.; Yang, Y.; Yuan, C.; Chen, S.; Wang, Z. Effects of 17 alpha-methyltestosterone on transcriptome, gonadal histology and sex steroid hormones in rare minnow (Gobiocypris rarus). Comp. Biochem. Physiol. D 2015, 15, 20–27. [Google Scholar]
  31. Wang, W.; Ndungu, A.W.; Li, Z.; Wang, J. Microplastics pollution in inland freshwaters of China: A case study in urban surface waters of Wuhan, China. Sci. Total Environ. 2017, 575, 1369–1374. [Google Scholar] [CrossRef]
  32. Nigamatzyanova, L.; Fakhrullin, R. Dark-field hyperspectral microscopy for label-free microplastics and nanoplastics detection and identification in vivo: A Caenorhabditis elegans study. Environ. Pollut. 2021, 271, 116337. [Google Scholar]
  33. Della Torre, C.; Bergami, E.; Salvati, A.; Faleri, C.; Cirino, P.; Dawson, K.A.; Cors, I. Accumulation and Embryotoxicity of Polystyrene Nanoparticles at Early Stage of Development of Sea Urchin Embryos Paracentrotus lividus. Environ. Sci. Technol. 2014, 48, 12302–12311. [Google Scholar]
  34. Gambardella, C.; Morgana, S.; Bramini, M.; Rotini, A.; Manfra, L.; Migliore, L.; Piazza, V.; Garaventa, F.; Faimali, M. Ecotoxicological effects of polystyrene microbeads in a battery of marine organisms belonging to different trophic levels. Mar. Environ. Res. 2018, 141, 313–321. [Google Scholar]
  35. Ortiz-Villanueva, E.; Navarro-Martin, L.; Jaumot, J.; Benavente, F.; Sanz-Nebot, V.; Pina, B.; Tauler, R. Metabolic disruption of zebrafish (Danio rerio) embryos by bisphenol A. An integrated metabolomic and transcriptomic approach. Environ. Pollut. 2017, 231, 22–36. [Google Scholar] [CrossRef]
  36. Holland, M.C.; Lambris, J.D. The complement system in teleosts. Fish Shellfish Immunol. 2002, 12, 399–420. [Google Scholar] [CrossRef] [PubMed] [Green Version]
  37. von Moos, N.; Burkhardt-Holm, P.; Kohler, A. Uptake and effects of microplastics on cells and tissue of the blue mussel Mytilus edulis L. after an experimental exposure. Environ. Sci. Technol. 2012, 46, 11327–11335. [Google Scholar] [CrossRef] [PubMed]
  38. Kim, J.H.; Yu, Y.B.; Choi, J.H. Toxic effects on bioaccumulation, hematological parameters, oxidative stress, immune responses and neurotoxicity in fish exposed to microplastics: A review. J. Hazard. Mater. 2021, 413, 125423. [Google Scholar] [CrossRef] [PubMed]
  39. Ruiz, P.; Katsumiti, A.; Nieto, J.A.; Bori, J.; Jimeno-Romero, A.; Reip, P.; Arostegui, I.; Orbea, A.; Cajaraville, M.P. Short-term effects on antioxidant enzymes and long-term genotoxic and carcinogenic potential of CuO nanoparticles compared to bulk CuO and ionic copper in mussels Mytilus galloprovincialis. Mar. Environ. Res. 2015, 111, 107–120. [Google Scholar] [CrossRef]
  40. Shi, W.; Han, Y.; Sun, S.; Tang, Y.; Zhou, W.; Du, X.; Liu, G. Immunotoxicities of microplastics and sertraline, alone and in combination, to a bivalve species: Size-dependent interaction and potential toxication mechanism. J. Hazard. Mater. 2020, 396, 122603. [Google Scholar] [CrossRef] [PubMed]
  41. Tang, Y.; Zhou, W.; Sun, S.; Du, X.; Han, Y.; Shi, W.; Liu, G. Immunotoxicity and neurotoxicity of bisphenol A and microplastics alone or in combination to a bivalve species, Tegillarca granosa. Environ. Pollut. 2020, 265, 115115. [Google Scholar] [CrossRef] [PubMed]
  42. Forman, H.J.; Zhang, H.; Rinna, A. Glutathione: Overview of its protective roles, measurement, and biosynthesis. Mol. Aspects Med. 2009, 30, 1–12. [Google Scholar] [CrossRef] [Green Version]
  43. Wang, J.G.; Hou, X.; Chen, X.W.; Zhang, K.J.; Wang, J.; Wang, C.H. Comprehensive analysis of metabolomics and transcriptomics provides insights into growth difference of juvenile Eriocheir sinensis during the molting cycle. Aquaculture 2021, 539, 736661. [Google Scholar] [CrossRef]
  44. Jeong, C.B.; Kang, H.M.; Lee, M.C.; Kim, D.H.; Han, J.; Hwang, D.S.; Souissi, S.; Lee, S.J.; Shin, K.H.; Park, H.G.; et al. Adverse effects of microplastics and oxidative stress-induced MAPK/Nrf2 pathway-mediated defense mechanisms in the marine copepod Paracyclopina nana. Sci. Rep. 2017, 7, 41323. [Google Scholar] [CrossRef] [Green Version]
  45. Wood, T. Physiological Functions of the Pentose Phosphate Pathway. Cell Biochem. Funct. 1986, 4, 241–247. [Google Scholar] [CrossRef]
  46. Riganti, C.; Gazzano, E.; Polimeni, M.; Aldieri, E.; Ghigo, D. The pentose phosphate pathway: An antioxidant defense and a crossroad in tumor cell fate. Free Radic. Biol. Med. 2012, 53, 421–436. [Google Scholar] [CrossRef]
  47. Deng, Y.F.; Zhang, Y.; Lemos, B.; Ren, H.Q. Tissue accumulation of microplastics in mice and biomarker responses suggest widespread health risks of exposure. Sci. Rep. 2017, 7, 1–10. [Google Scholar] [CrossRef] [Green Version]
  48. Wan, Z.; Wang, C.; Zhou, J.; Shen, M.; Wang, X.; Fu, Z.; Jin, Y. Effects of polystyrene microplastics on the composition of the microbiome and metabolism in larval zebrafish. Chemosphere 2019, 217, 646–658. [Google Scholar] [CrossRef] [PubMed]
  49. Teng, J.; Zhao, J.M.; Zhu, X.P.; Shan, E.; Wang, Q. Oxidative stress biomarkers, physiological responses and proteomic profiling in oyster (Crassostrea gigas) exposed to microplastics with irregular-shaped PE and PET microplastic. Sci. Total Environ. 2021, 786, 147425. [Google Scholar] [CrossRef]
  50. De Bose-Boyd, R.A. Significance and regulation of lipid metabolism. Semin. Cell Dev. Biol. 2018, 81, 97. [Google Scholar] [CrossRef]
  51. Laudicella, V.A.; Whitfield, P.D.; Carboni, S.; Doherty, M.K.; Hughes, A.D. Application of lipidomics in bivalve aquaculture, a review. Rev. Aquac. 2019, 12, 678–702. [Google Scholar] [CrossRef]
  52. Lane, A.N.; Fan, T.W. Regulation of mammalian nucleotide metabolism and biosynthesis. Nucleic Acids Res. 2015, 43, 2466–2485. [Google Scholar] [CrossRef] [PubMed] [Green Version]
  53. Wang, C.L.; Zhang, F.T.; Cao, W.X.; Wang, J.W. The identification of apolipoprotein C-I in rare minnow (Gobiocypris rarus) and its expression following cadmium exposure. Environ. Toxicol. Pharmacol. 2013, 35, 419–426. [Google Scholar] [CrossRef] [PubMed]
  54. Magni, S.; Gagne, F.; Andre, C.; Della Torre, C.; Auclair, J.; Hanana, H.; Parenti, C.C.; Bonasoro, F.; Binelli, A. Evaluation of uptake and chronic toxicity of virgin polystyrene microbeads in freshwater zebra mussel Dreissena polymorpha (Mollusca: Bivalvia). Sci. Total Environ. 2018, 631–632, 778–788. [Google Scholar] [CrossRef] [PubMed]
  55. Lei, L.; Wu, S.; Lu, S.; Liu, M.; Song, Y.; Fu, Z.; Shi, H.; Raley-Susman, K.M.; He, D. Microplastic particles cause intestinal damage and other adverse effects in zebrafish Danio rerio and nematode Caenorhabditis elegans. Sci. Total Environ. 2018, 619–620, 1–8. [Google Scholar] [CrossRef]
  56. Leng, X.Q.; Zhou, H.; Tan, Q.S.; Du, H.; Wu, J.P.; Liang, X.F.; He, S.; Wei, Q.W. Integrated metabolomic and transcriptomic analyses suggest that high dietary lipid levels facilitate ovary development through the enhanced arachidonic acid metabolism, cholesterol biosynthesis and steroid hormone synthesis in Chinese sturgeon (Acipenser sinensis). Br. J. Nutr. 2019, 122, 1230–1241. [Google Scholar]
  57. Qiao, R.; Sheng, C.; Lu, Y.; Zhang, Y.; Ren, H.; Lemos, B. Microplastics induce intestinal inflammation, oxidative stress, and disorders of metabolome and microbiome in zebrafish. Sci. Total Environ. 2019, 662, 246–253. [Google Scholar] [CrossRef]
  58. Li, R.; Li, Y.; Kristiansen, K.; Wang, J. SOAP: Short oligonucleotide alignment program. Bioinformatics 2008, 24, 713–714. [Google Scholar] [CrossRef] [Green Version]
  59. Love, M.I.; Huber, W.; Anders, S. Moderated estimation of fold change and dispersion for RNA-seq data with DESeq2. Genome Biol. 2014, 15, 550. [Google Scholar] [CrossRef] [Green Version]
  60. RCoreTeam. R: A Language and Environment for Statistical Computing; R Foundation for Statistical Computing: Vienna, Austria, 2014. [Google Scholar]
  61. Livak, K.J.; Schmittgen, T.D. Analysis of relative gene expression data using real-time quantitative PCR and the 2−ΔΔCt method. Methods 2001, 25, 402–408. [Google Scholar] [CrossRef]
  62. Cavill, R.; Jennen, D.; Kleinjans, J.; Briede, J.J. Transcriptomic and metabolomic data integration. Brief. Bioinform. 2016, 17, 891–901. [Google Scholar] [CrossRef] [PubMed] [Green Version]
Figure 1. Liver tissues of rare minnow. (A,C) Normal appearance of the control liver. (B) The liver was exposed to 200 μg/L MPs solution showing cell hypertrophy and increased vacuolization in hepatocytes compared with the control. (D) The liver exposed to 200 μg/L MPs shows a larger area and daker color of the lipid droplets than the control.
Molecules 27 00584 g001
Figure 2. Volcano plot of DEGs. Upregulated genes are shown as red dots, whereas downregulated genes are shown as blue dots.
Molecules 27 00584 g002
Figure 3. Transcriptome analysis of rare minnows exposed to 200 μg/L MPs compared with the control group. (A) GO enrichment analysis. (B) KEGG pathway analysis.
Molecules 27 00584 g003
Figure 4. Metabolomic analysis of rare minnows exposed to 200 μg/L MPs compared with the control group.
Molecules 27 00584 g004
Figure 5. Comparisons of the expression profiles of 5 DEGs obtained using RNA-seq and qRT-PCR analysis. The expression levels of selected genes were normalized to β-actin rRNA.
Molecules 27 00584 g005
Figure 6. Integrated network of functional interactions between metabolites (represented by their KEGG C-codes) and genes (represented by their abbreviation names) whose levels were affected in rare minnow by MP exposure. Metabolites and genes are connected if they share at least one common KEGG pathway. Increased or decreased metabolite or mRNA abundances (genes) in MP-exposed samples are indicated by red and blue symbols, respectively. Standard names of some relevant metabolites are shown in green.
Molecules 27 00584 g006
Figure 7. Relative changes of genes and metabolite involved in glutathione metabolism.
Molecules 27 00584 g007
Table 1. Physical and chemical characteristics of the test water.
GroupBefore/After
Refreshing Water
Dissolved
Oxygen (mg/L)
Conductivity (μs/cm)pHTemperature (°C)
Controlbefore 7.55 ± 0.36747 ± 78.03 ± 0.1726.8 ± 1.1
after7.77 ± 0.15732 ± 38.29 ± 0.0627.3 ± 0.9
MPs-treatedbefore 7.57 ± 0.46750 ± 98.04 ± 0.2226.6 ± 1.2
after7.71 ± 0.20734 ± 28.25 ± 0.0727.1 ± 1.0
Table 2. The top 20 DEGs after MP exposure.
Gene NameDescriptionLog2fcQ-ValueBiological ProcessFunction
hutUurocanate hydratase−12.085.27 × 10−254Histidine metabolismCatalyzes the conversion of urocanic acid
C3Complement
component 3
−11.712.10 × 10−210Immune processPart of the complement system
UGTglucuronosyltransferase−11.431.25 × 10−181Glucuronidation
process
Making relative enzymes
C1RComplement
component 1, r
subcomponent
−11.241.66 × 10−164Immune processPart of the complement system
MHC1major histocompatibility complex−10.963.80 × 10−142Immune processMaking proteins in certain immune system cells
FKBP4FK506-binding protein 4−9.892.23 × 10−80Immune processSignal transduction
HSD11B2corticosteroid 11-beta-dehydrogenase
isozyme 2
−9.578.38 × 10−68Immune processModulates intracellular glucocorticoid levels
FMN2formin 2−8.905.06 × 10−47Organismal SystemsDevelopment
RAP1GAPRAP1 GTPase activating protein 19.608.43 × 10−68Cancer tumorigenesisGTPase activator
NRASGTPase NRas9.671.35 × 10−70Cell divisionSignal transduction
RELAtranscription factor p659.692.28 × 10−71Inflammatory reactionSignal transduction
C4Complement
component 4
10.526.84 × 10−111Immune processPart of the complement system
TACC3transforming acidic coiled-coil-containing protein 310.592.30 × 10−115Cell growth and
differentiation
Signal transduction
CAMK1calcium/calmodulin-
dependent protein
kinase I
10.611.48 × 10−116Cell growth and deathSignal transduction
TFtransferrin10.652.84 × 10−119Environmental Information ProcessSignal transduction
A2Malpha-2-macroglobulin10.793.15 × 10−128Immune processProteinase inhibitor
PLAURplasminogen activator, urokinase receptor9.353.49 × 10−59Immune processSignal transduction
RNF19AE3 ubiquitin-protein
ligase RNF19A
9.253.81 × 10−56Genetic Information ProcessTranslation
SHOC2leucine-rich repeat
protein SHOC2
9.046.74 × 10−50Environmental
Information Process
Signal transduction
ALDHaldehyde
dehydrogenase
8.742.74 × 10−42Metabolism processProducing aldehyde
enzymes
Table 3. List of statistically significant tentatively identified metabolites to differentiate between control and MPs-exposed rare minnow liver samples.
CompoundMolecular FormulaModeMeasured
Molecular Mass (Da)
Mass Error (ppm)Fold-ChangeTrendp-ValueKegg C-Code
2-FormylglutarateC6H8O5ESI-159.0293−3.910760.64down0.002C16159
2-Dehydro-3-deoxy-d-galactonateC6H10O6ESI-177.04−2.537180.63down0.001C01216
d-Galactono-1,5-lactoneC6H10O6ESI-177.04−2.537180.63down0.001C02669
l-Galactono-1,5-lactoneC6H10O6ESI-177.04−2.537180.63down0.001C21955
d-Mannitol 1-phosphateC6H15O9PESI-307.043−2.004740.67down0.023C00644
d-AltronateC6H12O7ESI-195.0505−2.852940.61down0.001C00817
l-LyxoseC5H10O5ESI-195.0505−3.727630.61down0.001C01508
d-RiboseC5H10O5ESI-195.0505−3.727630.61down0.001C00121
d-LyxoseC5H10O5ESI-195.0505−3.727630.61down0.001C00476
d-MannonateC6H12O7ESI-195.0505−2.852940.61down0.001C00514
(S)-3-Hydroxyisobutyryl-CoAC25H42N7O18P3SESI-852.1423−2.798620.59down0.044C06000
Sphingosyl-phosphocholineC23H50N2O5P+ESI-510.34573.8885990.64down0.040C03640
N-Acetyl-d-phenylalanineC11H13NO3ESI-252.087−3.400670.68down0.048C05620
N-Acetyl-l-phenylalanineC11H13NO3ESI-252.087−3.400670.68down0.048C03519
d-MannonateC6H12O7ESI+219.0459−8.342590.67down0.010C00514
d-AltronateC6H12O7ESI+219.0459−8.342590.67down0.010C00817
5-HydroxyindoleacetateC10H9NO3ESI+192.06591.9053970.61down0.044C05635
(R)-3,3-DimethylmalateC6H10O5ESI+180.08776.4144120.66down0.016C01088
l-Fucono-1,5-lactoneC6H10O5ESI+180.08776.4144120.66down0.016C18028
(S)-2-(Hydroxymethyl)glutarateC6H10O5ESI+180.08776.4144120.66down0.016C16390
2-Dehydro-3-deoxy-l-fuconateC6H10O5ESI+180.08776.4144120.66down0.016C03827
3-EthylmalateC6H10O5ESI+180.08776.4144120.66down0.016C01989
(2R,3S)-2,3-DimethylmalateC6H10O5ESI+180.08776.4144120.66down0.016C03652
(R)-2-EthylmalateC6H10O5ESI+180.08776.4144120.66down0.016C02488
2-Dehydro-3-deoxy-l-rhamnonateC6H10O5ESI+180.08776.4144120.66down0.016C03979
4-Methyl-l-glutamateC6H11NO4ESI+144.0655-0.089170.48down0.006C06234
alpha-1,5-l-ArabinobioseC10H18O9ESI-281.08821.316990.78down0.004C20570
beta-d-Glucose 1-phosphateC6H13O9PESI+283.0190.4206691.28up0.046C00663
beta-d-Fructose 6-phosphateC6H13O9PESI+283.0190.4206691.28up0.046C05345
alpha-d-Glucose 6-phosphateC6H13O9PESI+283.0190.4206691.28up0.046C00668
d-Mannose 6-phosphateC6H13O9PESI+283.0190.4206691.28up0.046C00275
d-Tagatose 6-phosphateC6H13O9PESI+283.0190.4206691.28up0.046C01097
d-Fructose 1-phosphateC6H13O9PESI+283.0190.4206691.28up0.046C01094
d-Allulose 6-phosphateC6H13O9PESI+283.0190.4206691.28up0.046C18096
l-Gulose 1-phosphateC6H13O9PESI+283.0190.4206691.28up0.046C15924
beta-d-Glucose 6-phosphateC6H13O9PESI+283.0190.4206691.28up0.046C01172
d-Allose 6-phosphateC6H13O9PESI+283.0190.4206691.28up0.046C02962
N-Acetylneuraminate 9-phosphateC11H20NO12PESI+428.0373.9667761.57up0.000C06241
CytosineC4H5N3OESI+112.05060.6973461.76up0.002C00380
d-GlyceraldehydeC3H6O3ESI-135.03079.0844011.59up0.046C00577
d-Fructose 6-phosphateC6H13O9PESI+283.0190.4206691.28up0.046C00085
Publisher’s Note: MDPI stays neutral with regard to jurisdictional claims in published maps and institutional affiliations.

