Abstract
We have synthetized two classes of dibenzofulvene-arylamino derivatives with an H-shape design, for a total of six different molecules. The molecular structures consist of two D-A-D units connected by a thiophene or bitiophene bridge, using diarylamino substituents as donor groups anchored to the 2,7- (Group A) and 3,6- (Group B) positions of the dibenzofulvene backbone. The donor units and the thiophene or bithiophene bridges were used as chemico-structural tools to modulate electro-optical and morphological-electrical properties. A combination of experiments, such as absorption measurements (UV-Vis spectroscopy), cyclic voltammetry, ellipsometry, Raman, atomic force microscopy, TD-DFT calculation and hole-mobility measurements, were carried out on the synthesized small organic molecules to investigate the differences between the two classes and therefore understand the relevance of the molecular design of the various properties. We found that the anchoring position on dibenzofulvene plays a crucial key for fine-tuning the optical, structural, and morphological properties of molecules. In particular, molecules with substituents in 2,7 positions (Group A) showed a lower structural disorder, a larger molecular planarity, and a lower roughness.
1. Introduction
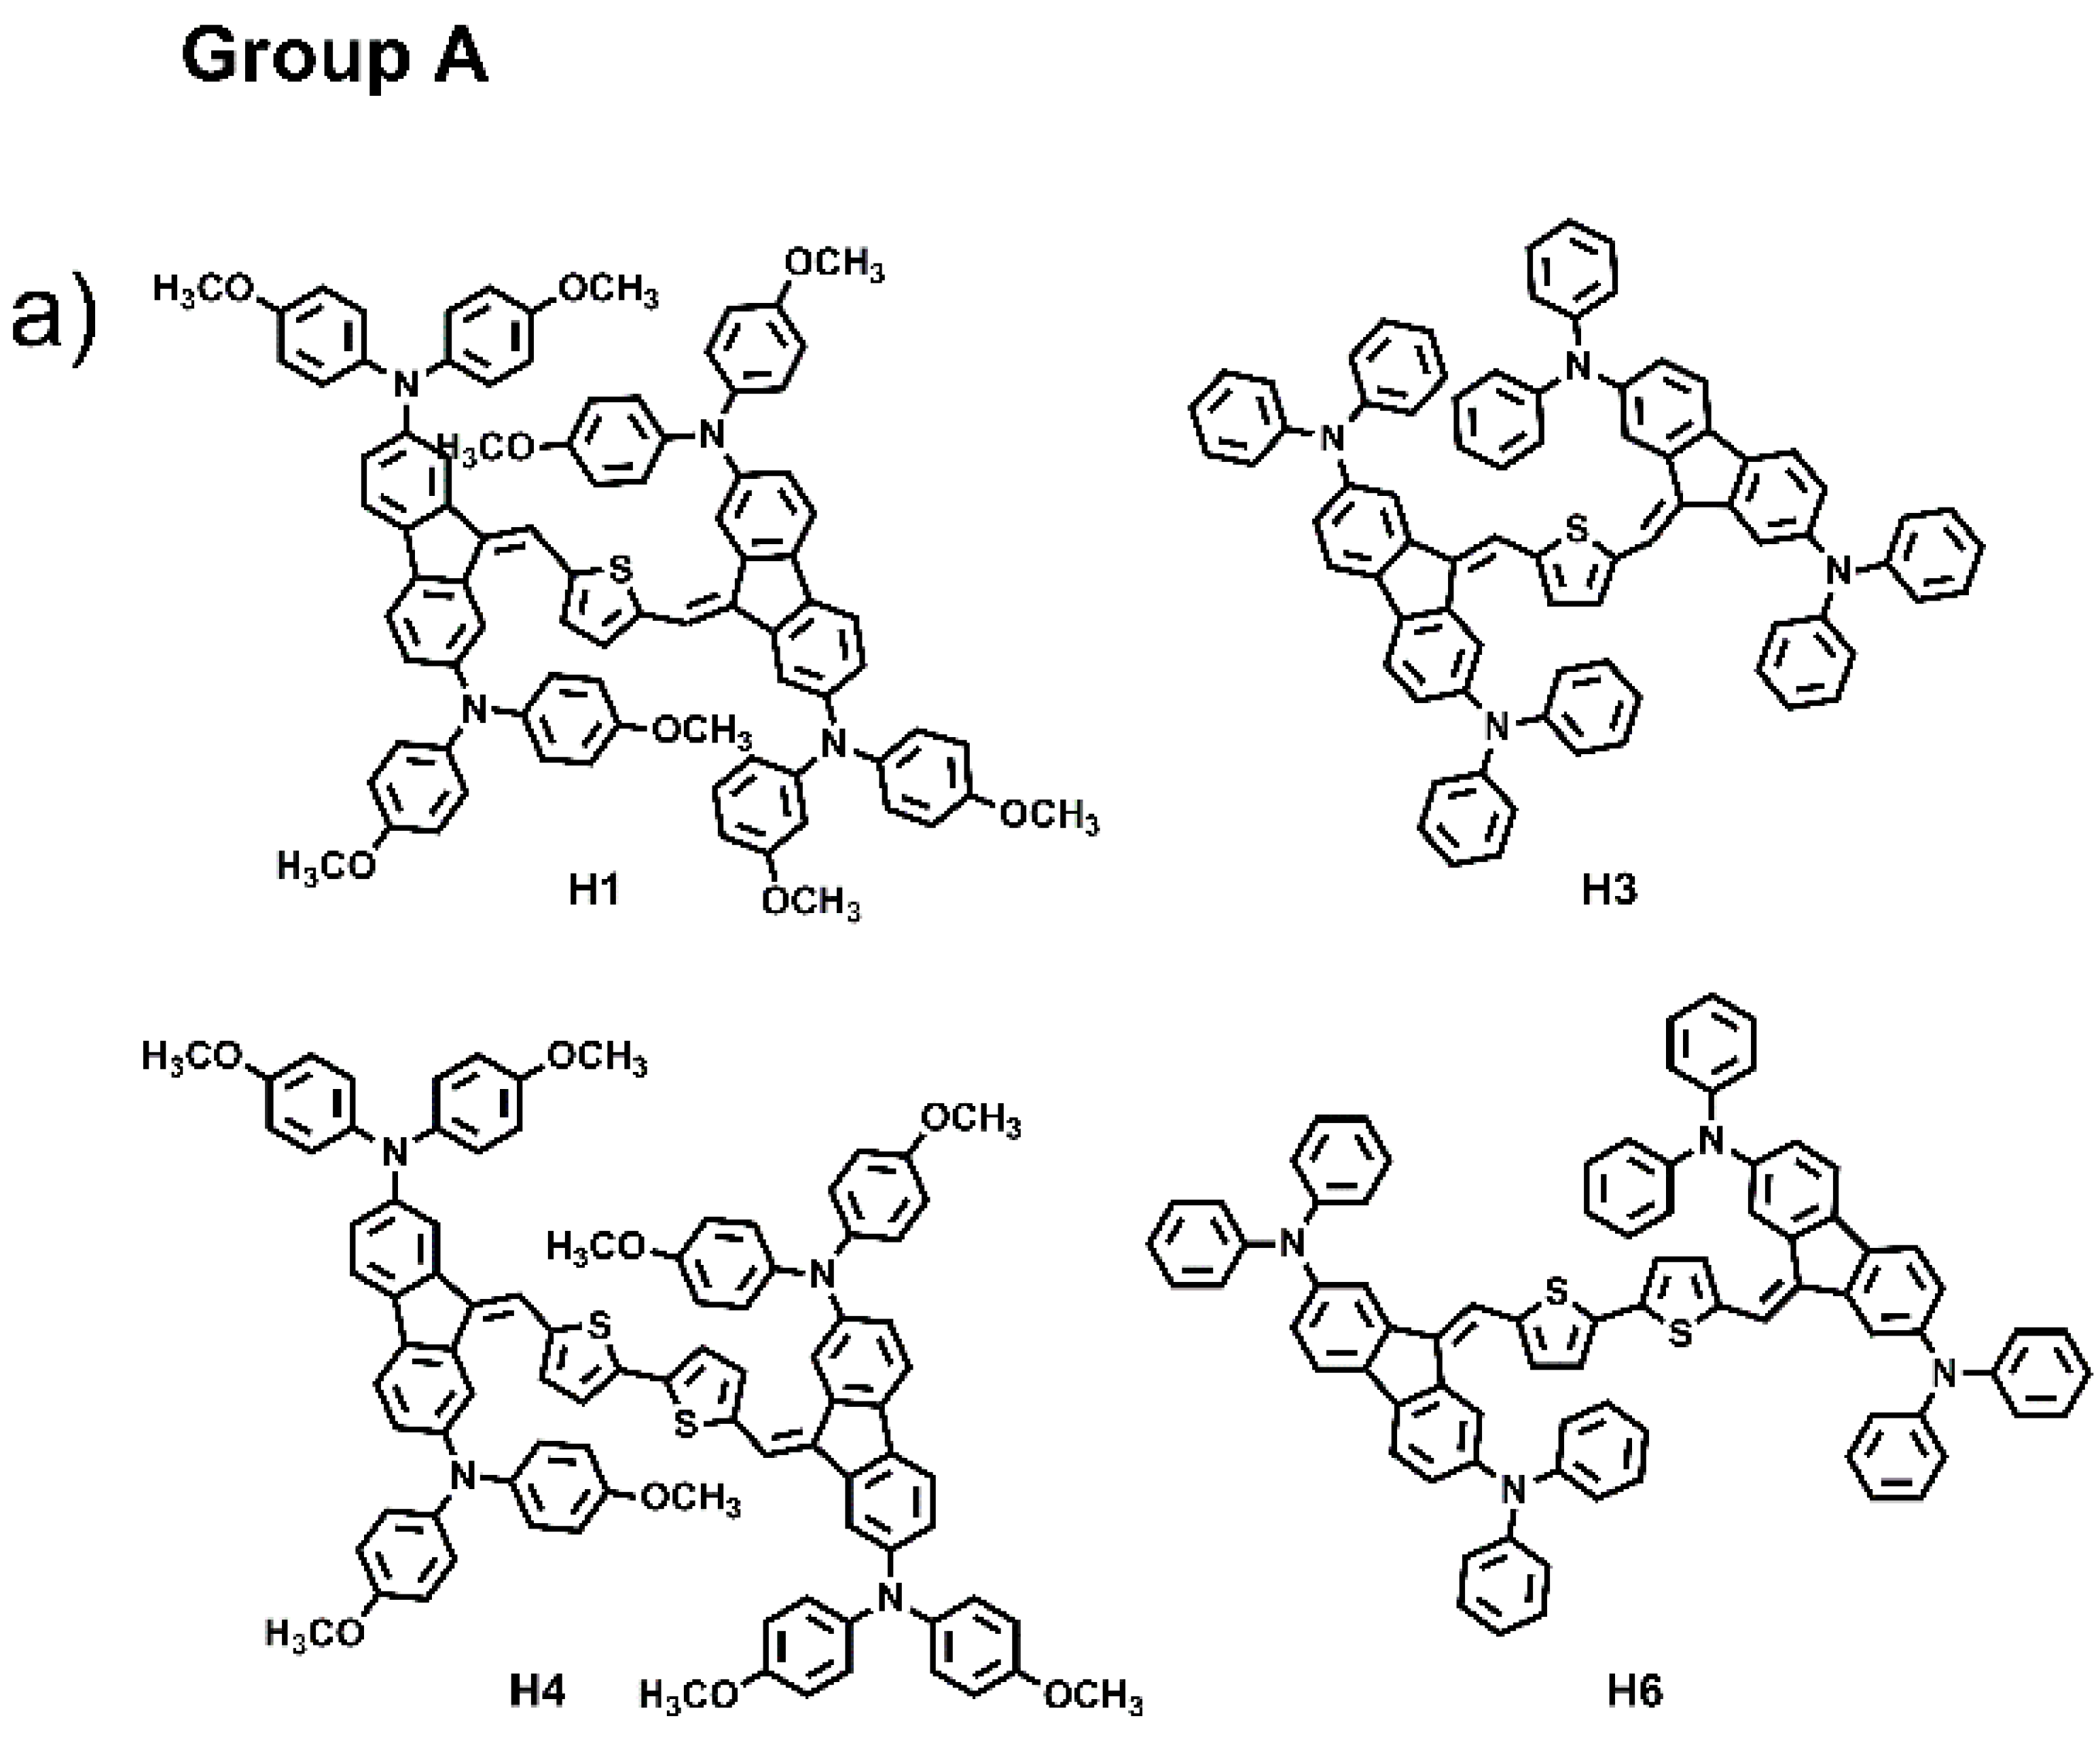
The combination of several organic structural motifs such as phenylene-vinylene, thiophene, pyrrole, triarylamines and fluorene derivates is widely studied because it gives life to a very important class of electroactive and photoactive compounds, used in several sector of optoelectronics, such as organic light-emitting diodes (OLED) [1], organic field-effect transistors (OFET) [2], electrochromic and electrofluorochromic devices (ECDs and EFCDs) [3,4,5], dye-sensitized solar cells (DSSCs) [6,7,8], as well as used as fluorescent probes in bioimaging applications [9,10,11]. In particular, in the last decade, great attention was paid to a large variety of organic molecule semiconductors with hole-transporting properties since they play a pivotal part for achieving, for example, high performances in perovskite solar cells (PSCs), ensuring efficient hole extraction and transportation, and the suppression of photogenerated carrier recombination [12,13,14]. Spirolink compounds, 3,4-ethylenedioxythiophene analogues and phthalocyanine derivatives, phenoxazine, phenothiazine, thiophene, anthracene and carbazole, are commonly used as core units to synthesize hole transport materials (HTMs). Their planar section favours strong π-π interaction leading to high hole mobility, and, at the same time, to aggregation phenomena and to the formation of films with excessively large crystalline domains, resulting in coarse surface morphology with low-quality hole-transporting layer thin film, which can be harmful for the improvement of cell performance. Thus, it is very important to design a new class of materials with molecular structures that have easy processability, are suitable to form good films, and that exhibit high charge mobility [15]. To probe the influences of molecular conformation on the electronic and charge transport properties of small molecules and to find more efficient central units, here we have designed and synthesized six small molecules, “H-shaped”, based on two units of dibenzofulvene (DBF) linked together by thiophene or bithiophene rings, and witharylaminomoieties used as electron donor groups anchored at the 2,7 and 3,6-DBF positions, as shown in Figure 1. The electronic and optical properties of all materials were investigated and combined experiments such as ellipsometry, Raman, atomic force microscopy, TD-DFT computation and hole-mobility investigations were carried out. Based on the position of the arylamino substituents linked to the DBF unit, the six molecules were divided in two groups: Group A, which includes the molecules labelled as H1, H3, H4 and H6, characterized by the arylamino substituents linked to the 2,7-positions; Group B, which includes the molecules H2, and H5, characterized by the arylamino substituents linked to the 3,6-positions. H1 and H2 have been recently synthesized and characterized by our group, of which we have studied the directionality of intramolecular electron transfer phenomena as a function of the position of the redox centers on the DBF [16].
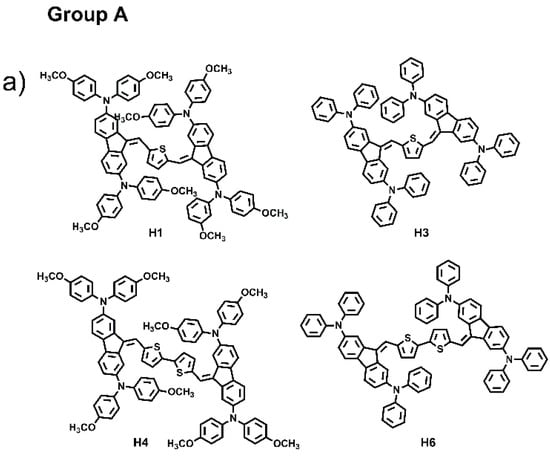
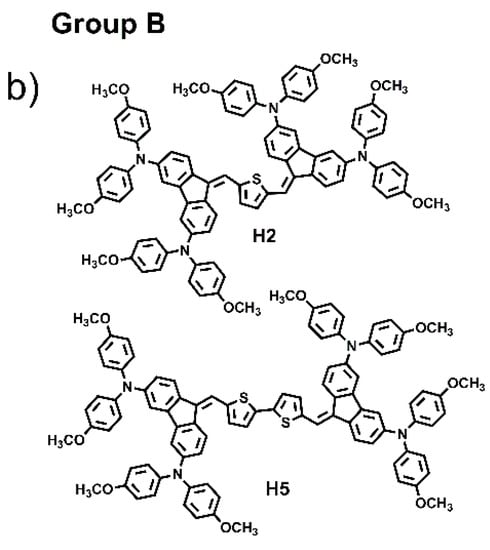
Figure 1.
Chemical structures of H1–H6.
2. Results and Discussion
2.1. Synthesis
Synthesis of HTM small molecules was carried out following the straightforward retrosynthetic approach shown in Scheme 1.

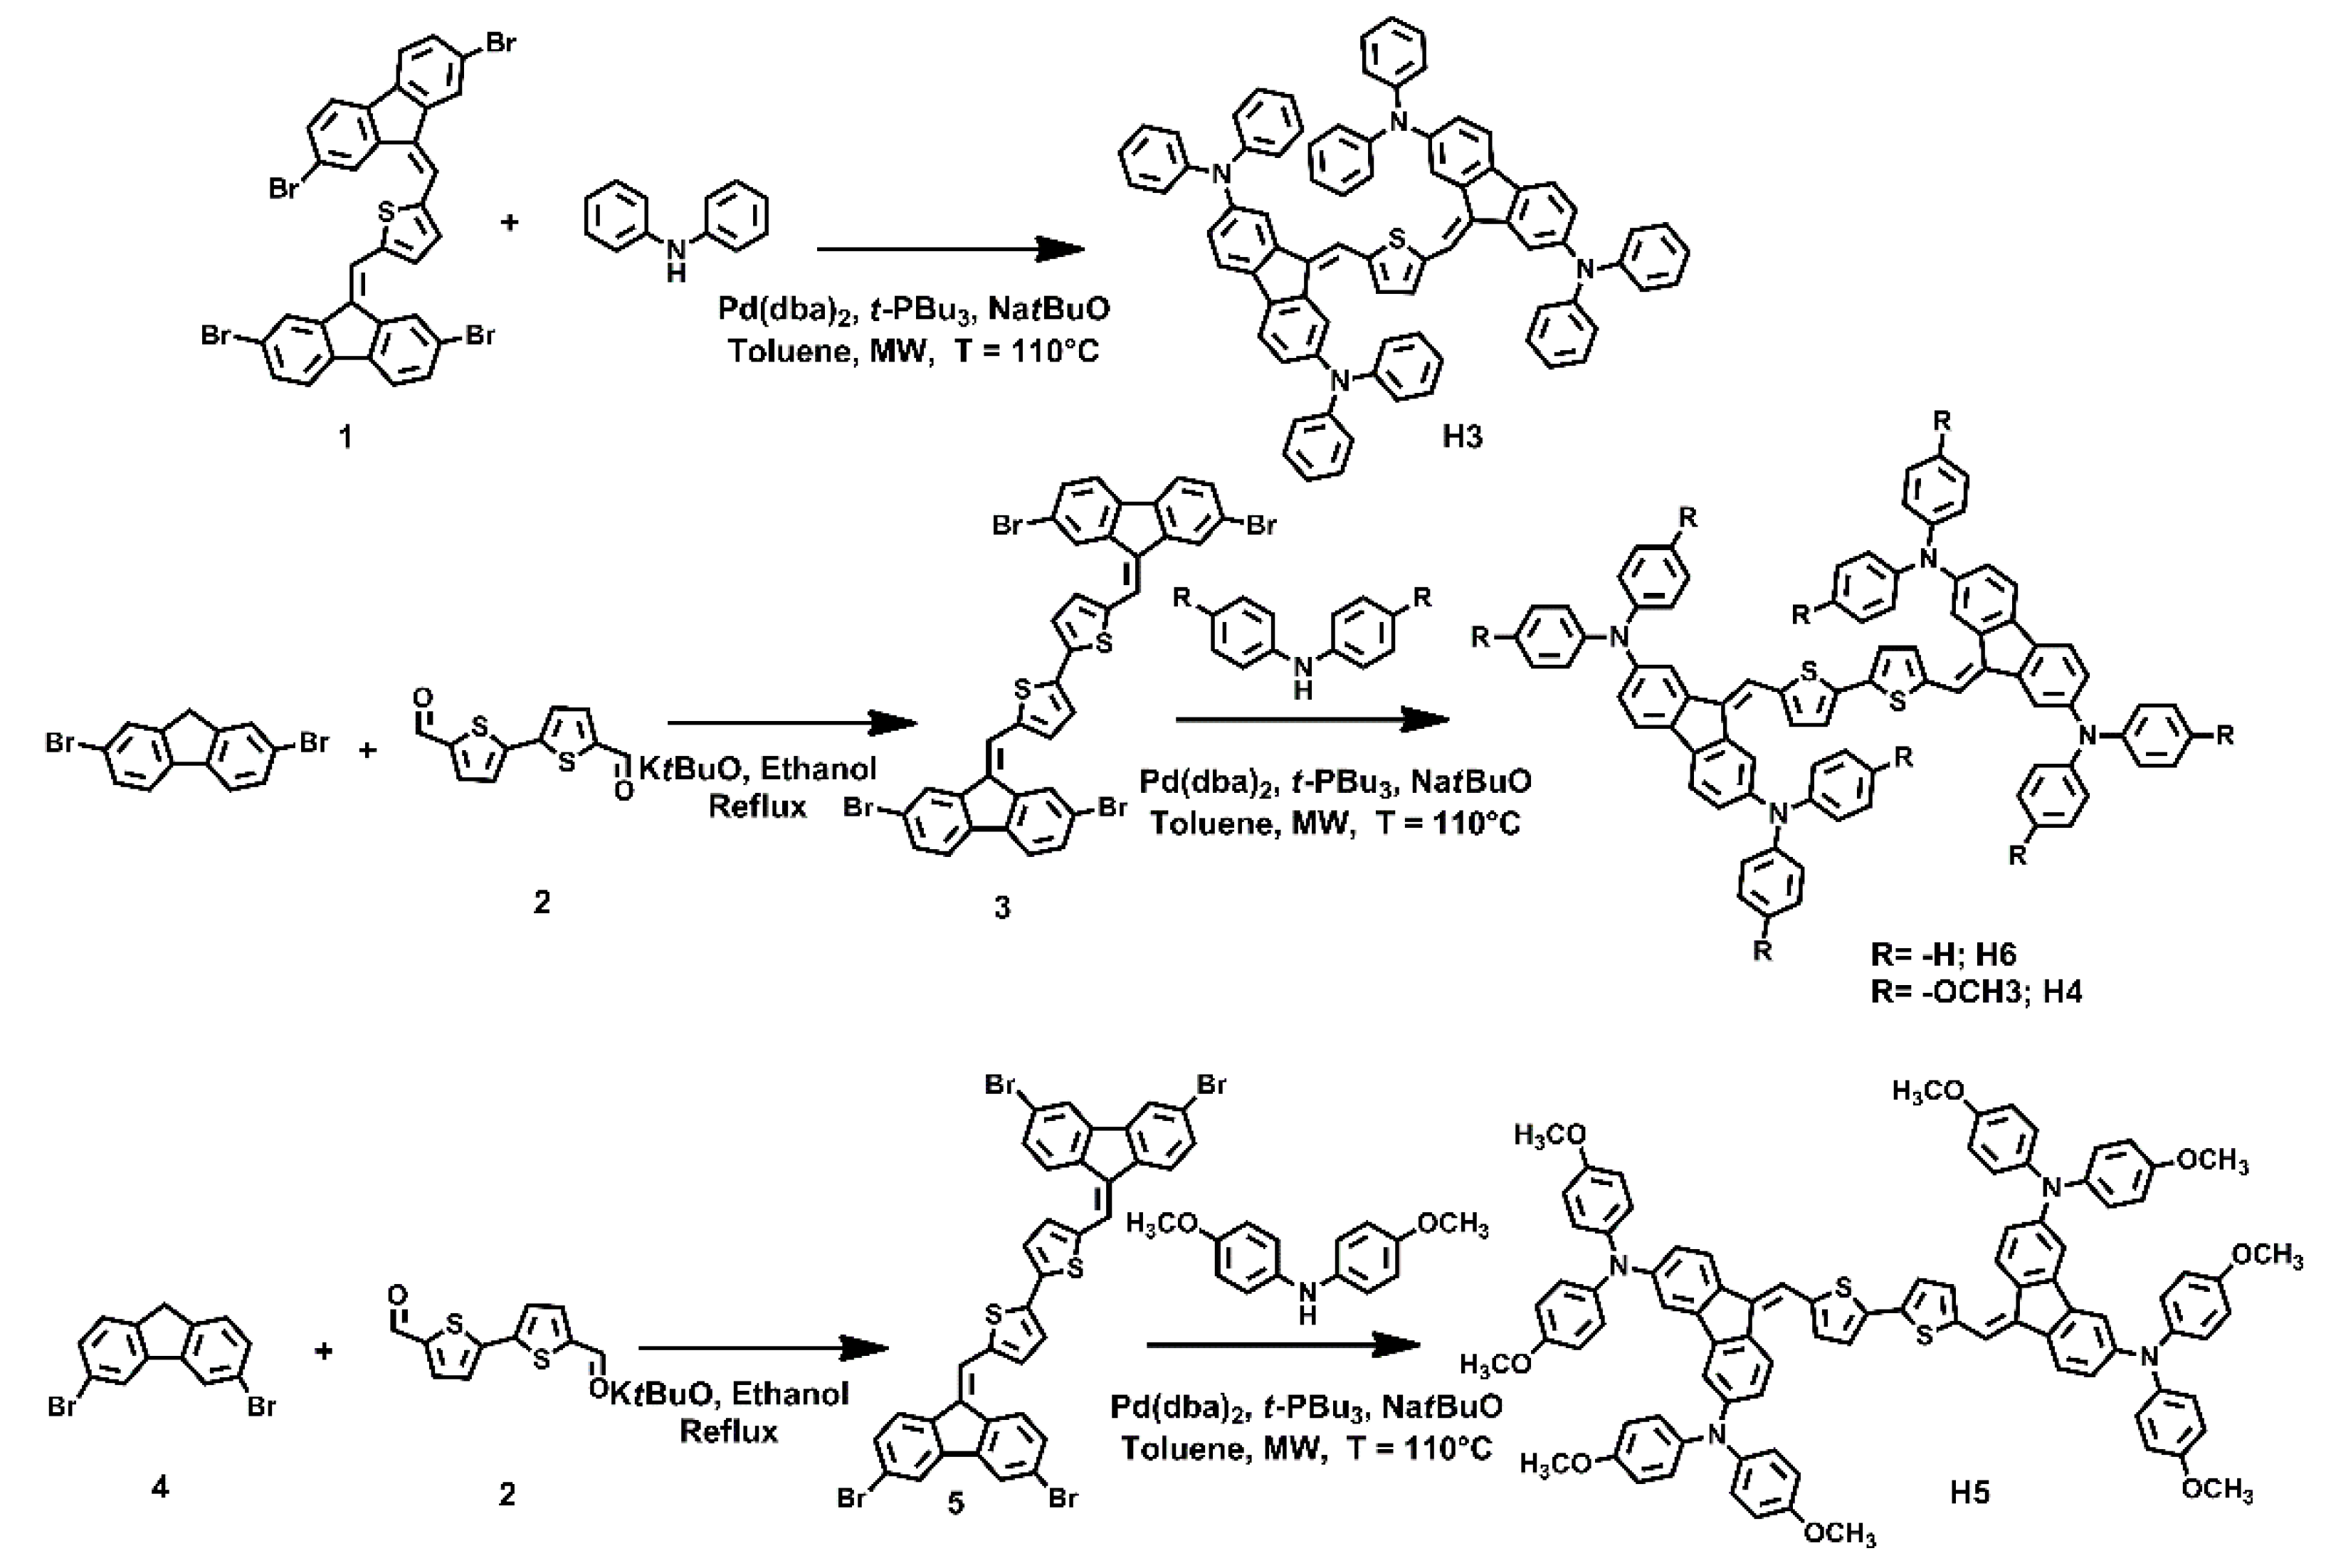
Scheme 1.
Synthetic route for H3, H4, H5 and H6.
Key steps of the synthetic strategy were the Knoevenagel condensation between fluorene intermediates and thienyl dicarbaldehydes, and the Buchwald–Hartwig cross-coupling reaction between aryl ammines and dibromoaryl derivatives. Both the reactions were carried out in a microwave reactor in very short reaction times and high yields. In detail, bithiophene-2,5-dicarbaldehyde was reacted with 2,7-dibromofluorene or 3,6-dibromofluorene, in the Knoevenagel conditions, using tert-BuOK in ethanol at reflux, to yield the corresponding dibromo-intermediates 2 and 4, respectively. Both compounds were purified by filtration and washing with ethanol. Whereupon, the intermediates 2 and 4 were reacted with diphenylamine or bis(4-methoxyphenyl)amine in the Buchwald–Hartwig conditions, using Pd(dba)2 and P(t-Bu)3 as the catalyst, tert-BuONa as the base, in toluene, to yield the final HTM molecules, H3, H4, H5 and H6, which were purified by flash chromatography on silica gel.
2.2. UV-Vis Properties
The UV-Vis spectra of H1–H6 recorded in CH2Cl2 solution are shown in Figure 2, and the photophysical data are reported in Table 1. The H1, H3,H4 and H6 spectra show three absorption bands, at 286–307 nm (4–4.3 eV), at 372–384 nm (~3.2–3.3 eV) and at 448–468 nm (~2.6–2.8 eV), while the compounds H2 and H5 exhibit only two absorption bands, at 245–307 nm (~4.25–4.3 eV) and at 503–521nm (~2.4–2.5 eV), respectively. In all compounds, the low-energy electron transition can be assigned to the amino-to-bridge charge-transfer character (NB-CT). The results show that the amino substituents contribute differently to the NB-CT depending on their anchoring position on the DBF [17,18]. In fact, in the systems H1, H3, H4 and H6, the redox centers transfer only partially the charge to the bridge, unlike for the H2 and H5 systems where a greater contribution of the amino groups to the charge transfer to the bridge is observed (Figures S2–S4).
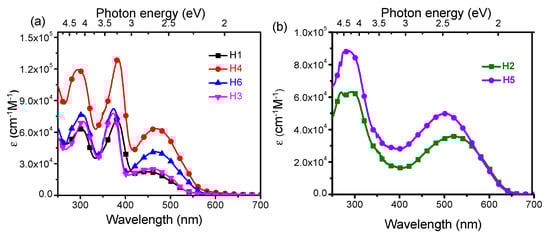
Figure 2.
Absorption spectra of (a) H1, H3, H4 and H6 and (b) H2 and H5 recorded in CH2Cl2.

Table 1.
Experimental absorption energies and molar absorption coefficients, as well as absorption energies, oscillator strengths (o.s) and transitions character from TD-DFT simulations.
The electronic transitions in the range 372–384 nm, for the 2,7-arylamino-fuctionalized, are associated to a π−π* transition of the DBF unit [19], for which the contribution of the redox centers in those specific position is relevant. Indeed, this energy transition is absent in the absorption spectra of H2 and H5. As we reported previously [18], in the latter systems, a larger coupling between the arylamino units with the DBF occurs, which enhances the delocalization of the molecular orbitals on the DBF as well as on the diphenylamine substituents. As a consequence, the DBF π−π* transition is not observed in these systems, but rather a mixed π−π*-CT transition around 265 nm, also involving the diphenylamines. All compounds display an absorption band in the range 295−306 nm assigned to a π−π* transition of the diphenylamine [20]. Peak assignment was performed using single particle transition data obtained from the TD-DFT calculation (see supporting information for more details about the transitions character, Table S1).
2.3. Electrochemical and Spectroelectrochemical Characterization
Cyclic voltammograms of the series H1–H6 compounds exhibit two distinguishable redox processes (Figure S1) between 0 and +1.4 V vs. AgCl/Ag. These correspond to the sequential removal of electrons from the diarylamine moieties and are attributed to the radical cation/neutral (N▪+/0) and dication/radical cation (N++/▪+) couples (Table 2). All compounds show a large comproportionation constant (Table 2) according to equation , indicating a good thermodynamic stability of the radical cation species against disproportionation. The coupling among the redox centers as well as the optical energy gap are influenced by the molecular structure differences, essentially determined by the anchoring position of the diarylamine centers on the DBF bridge and, slightly, by the number of thiophenes in the horizontal bridge length. Indeed, even if the potential splitting (ΔE) is large for all the compounds (Table 2), suggesting a strong coupling among the amine centers, that of the 2,7-amine substituted systems is larger than that of the 3,6-amine substituted ones. Moreover, in the systems with one thiophene ring (H1, H2, H3) the splitting is larger, on average, than that measured in the molecules with two thiophene. In particular, inspection of Table 2 shows that in the 2,7-substituted systems, the mono-thiophene bridged ones have systematically larger splitting values than their homologous with two thiophenes (compare H1 vs. H4, and H3 vs. H6); moreover, the splitting difference is highly marked in the 3,6-substituted homologous systems, H2 and H5. The HOMO–LUMO levels were also estimated (Table 2).
Table 2.
Electrochemical properties and corresponding energy levels a.
To gain further insight into the electronic structure of the compounds upon oxidation, spectroelectrochemical experiments in the UV/Vis/NIR region were performed to characterise the mono- and dications (Figure 3). The spectroelectrochemistry of the four compounds (H3–H6) clearly show that the increase of the oxidative potential causes the growing of a new band in the NIR region (4000–12,000 cm−1) and the increase of the absorption at about 22,000 cm−1, corresponding to the formation of the arylamino radical cation [21]. The broad band in the NIR region is associated with an optically induced hole transfer, IV-CT, from the oxidized arylamine moiety to the second neutral arylamine moiety belonging to the same DBF unit [16]. Compounds H3, H4, and H6, following the second oxidation, exhibit a similar behaviour, leading to the formation of absorption band centered at 11,088 cm−1, 10,914 cm−1 and 8856 cm−1, respectively, assigned to arylamino-to-bridge charge transition (NB-CT). In particular, in these systems, the IVCT band shape remains unchanged even after the completion of the second oxidation wave, except for a slight moving of the band maximum toward higher energy. On the other hand, the 3,6-substituted H5 shows different spectroscopic features. When the applied potential is increased positively from 0.6 to 0.8 V (first oxidation process), both the characteristic NIR absorption band at 8000 cm−1 and the electron transition NB-CT centered at 13,303 cm−1 grow up, due to a significant horizontal electron coupling, as already observed for the 3,6-substituted systems with one thiophene [16].

Figure 3.
Spectroelectrochemistry of H3(a), H4 (b), H5 (c) and H6(d) at c = 10−3 M in CH2Cl2/0.1 M TBAPF6, at oxidative potentials.
2.4. Interplay between Structure and Optical Properties: Ellipsometry, Raman Spectroscopy and AFM Investigation
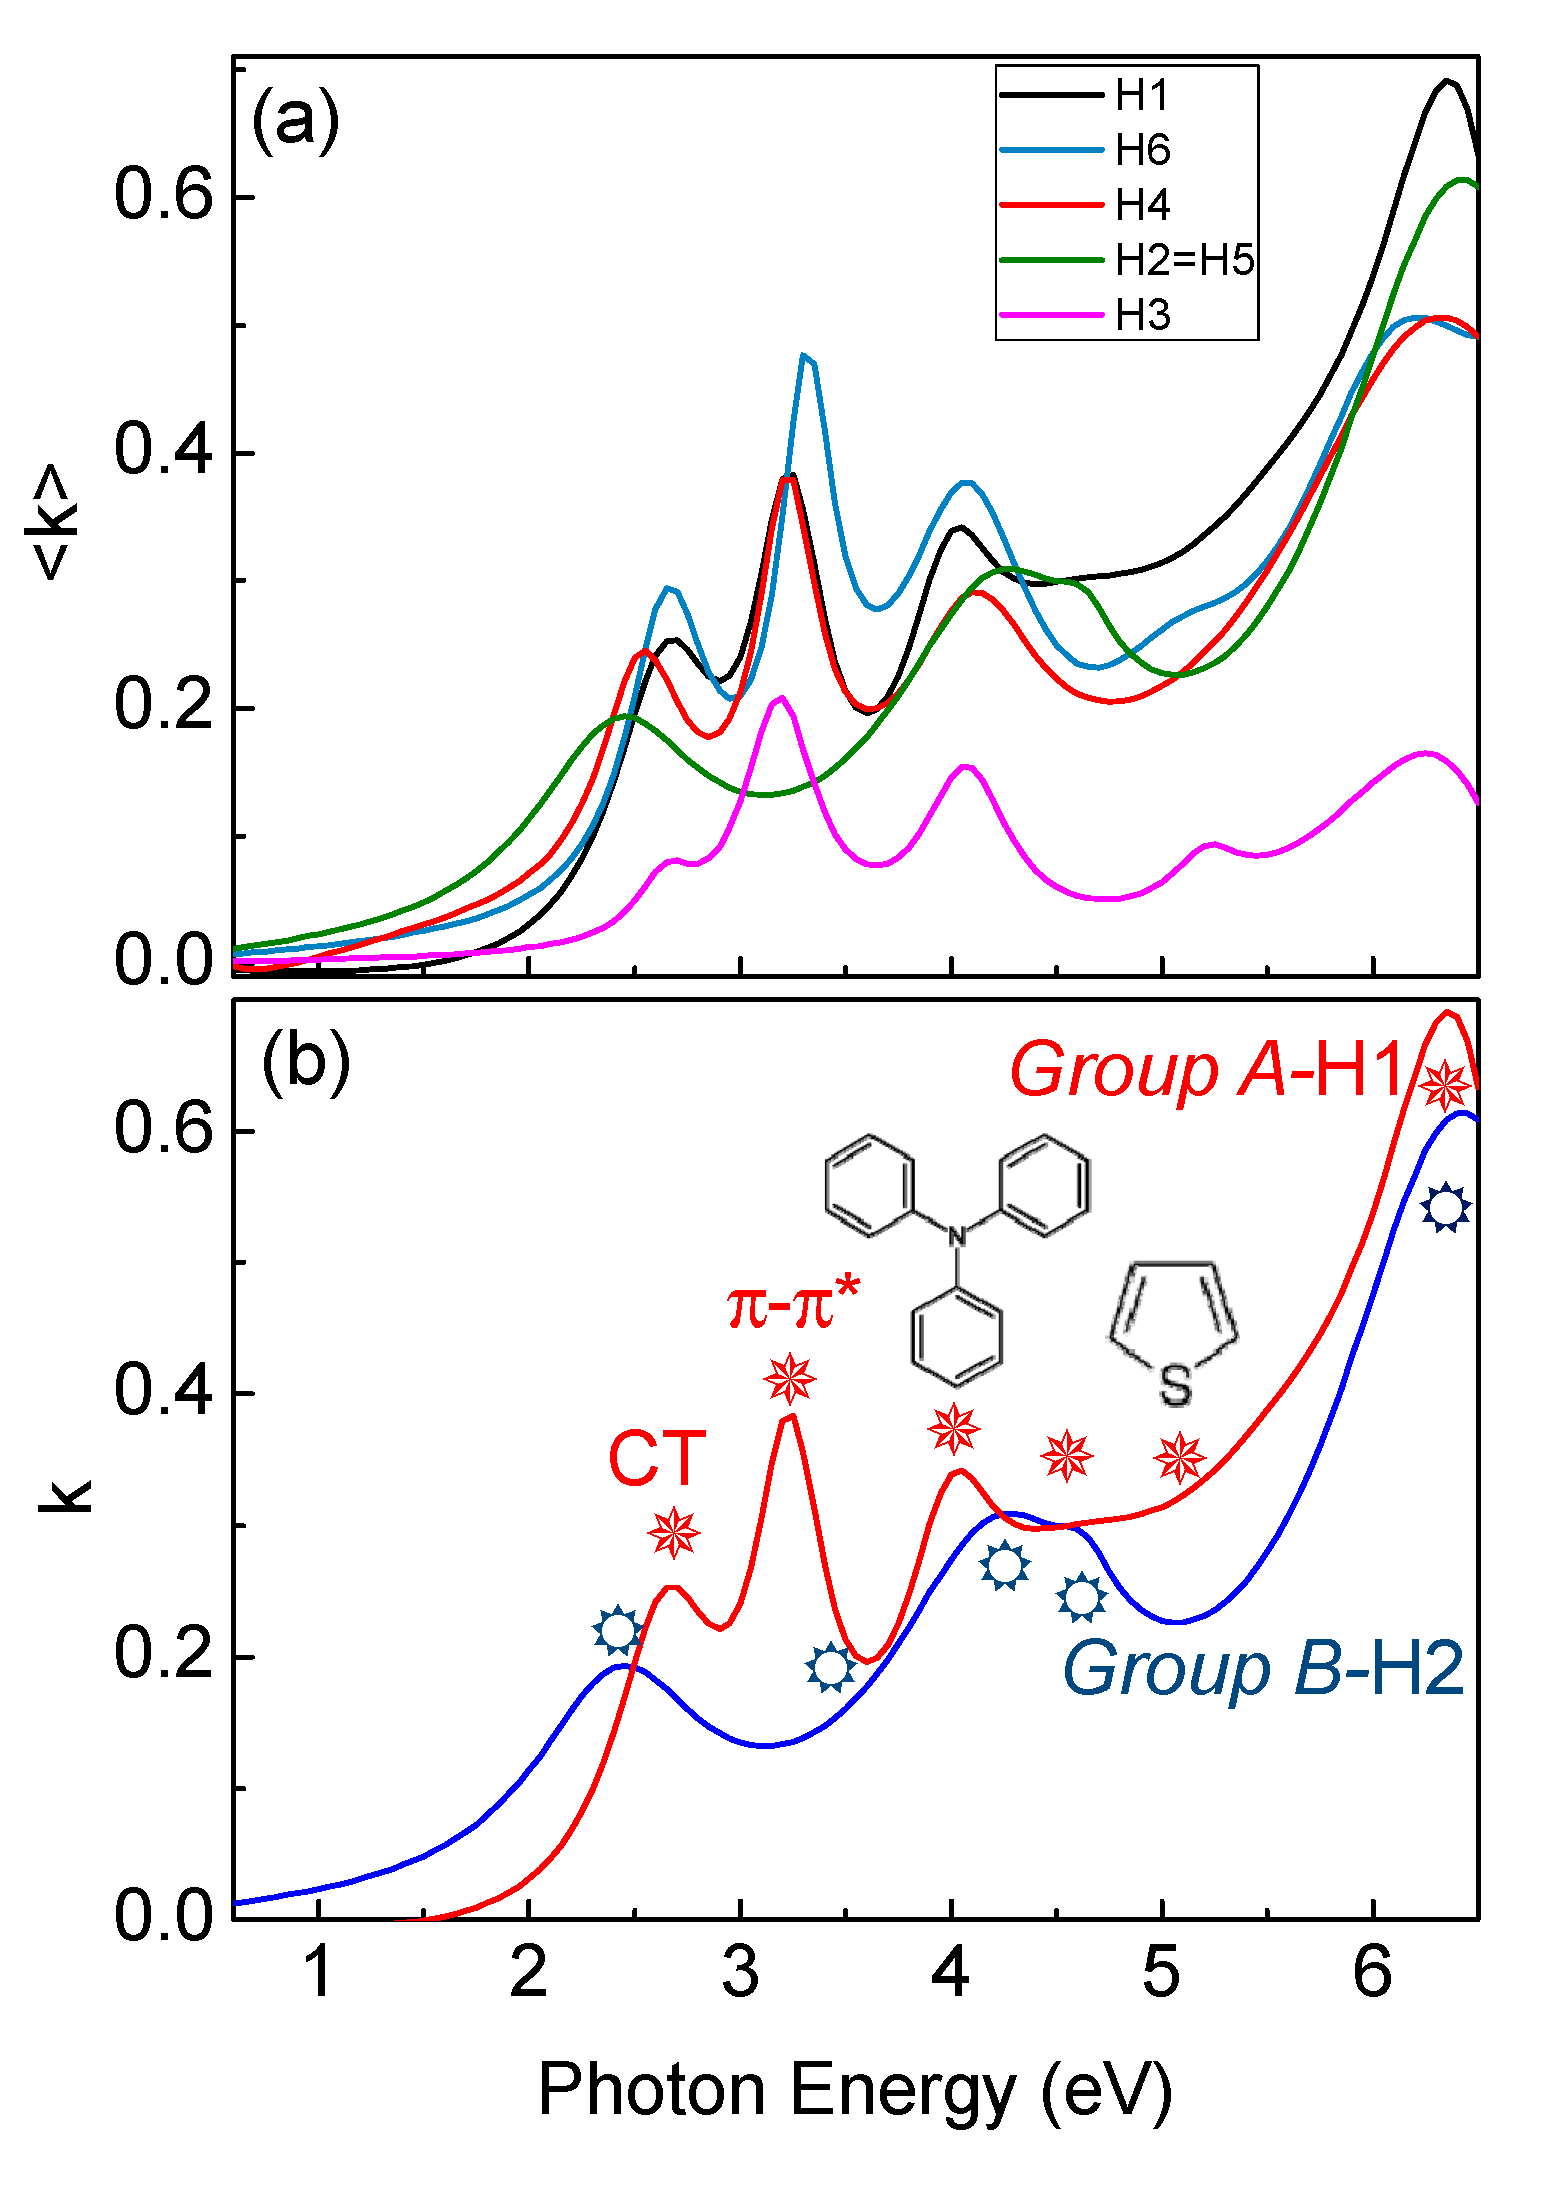
Figure 4a shows the experimental spectra of the pseudoextinction coefficient, <k>, of the various samples. Spectra of H1, H3, H4 and H6 show six main peaks, at 2.6 eV (477 nm) due to the NB-CT transitions, at 3.14 eV (395 nm) related to the π–π* transitions of the conjugated molecule backbones, at 3.99 eV (311 nm),which is characteristic of triphenylamine-derivates [21], at 4.25 eV (292 nm) due to the vinyl-thiophene-derivates, and at 5.24 eV (234 nm) and at 5.91 eV (210 nm), due to thiophene- and benzene-derivates, respectively [22,23]. Spectra of H2 and H5, on the contrary, show that the CT transition is shifted to lower energies, at 2.35 eV (528 nm), while the π–π* transitions of the conjugated molecule backbones is blue-shifted and damped. Moreover, all other transitions in the range 4–6.5 eV (191-310 nm) are also blue-shifted and/or damped.
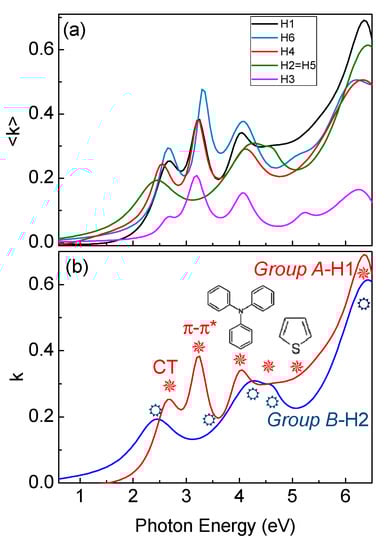
Figure 4.
(a) Experimental ellipsometric spectra of the pseudoextinction coefficient of all H1–H6. (b) Spectra of the extinction coefficient of Group A and B. Optical transitions are indicated by symbols.
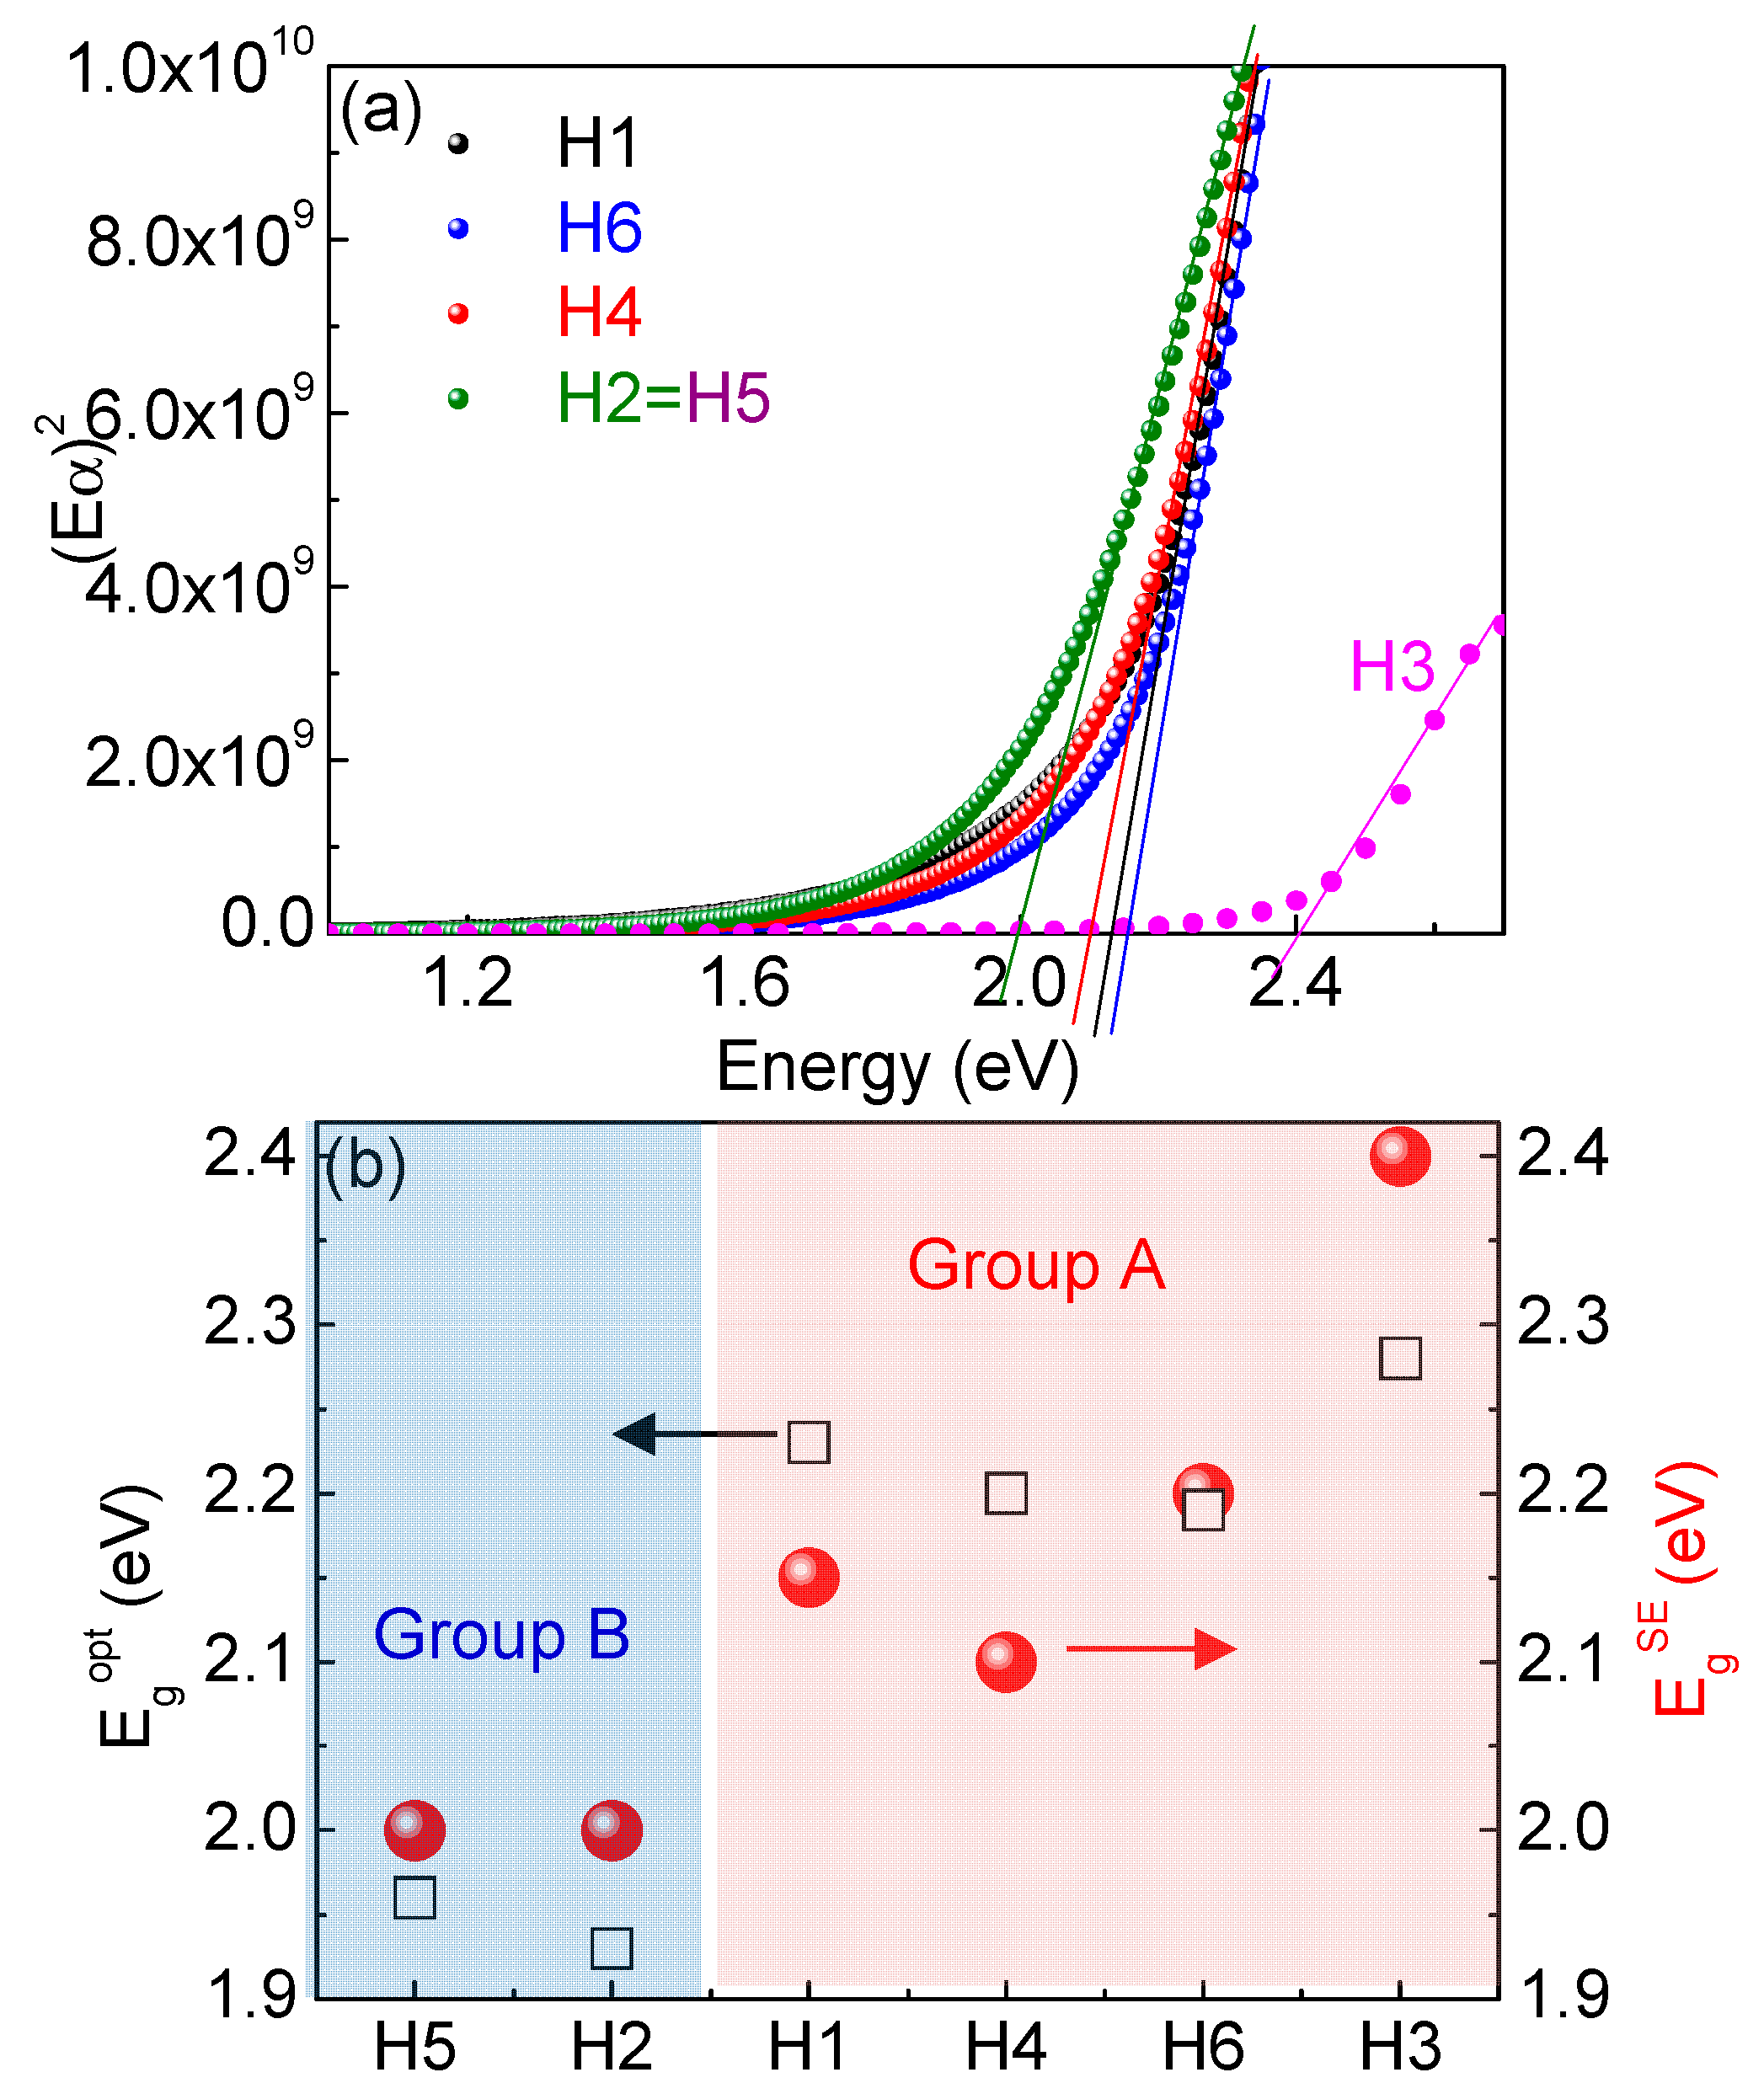
In order to determine energy gaps, we plot (Eα)2 as a function of energy, as shown in Figure 5a. We found that H1, H3, H4 and H6 samples have gaps larger than 2 eV, while H2 and H5 have gaps lower than 2 eV. Figure 5b shows that there is a good correlation between gaps determined by ellipsometry with gaps in Table 2.

Figure 5.
(a) (Eα)2 vs.energy of different molecules and (b) comparison between gaps calculated from ellipsometry ( and by absorption measurements (.
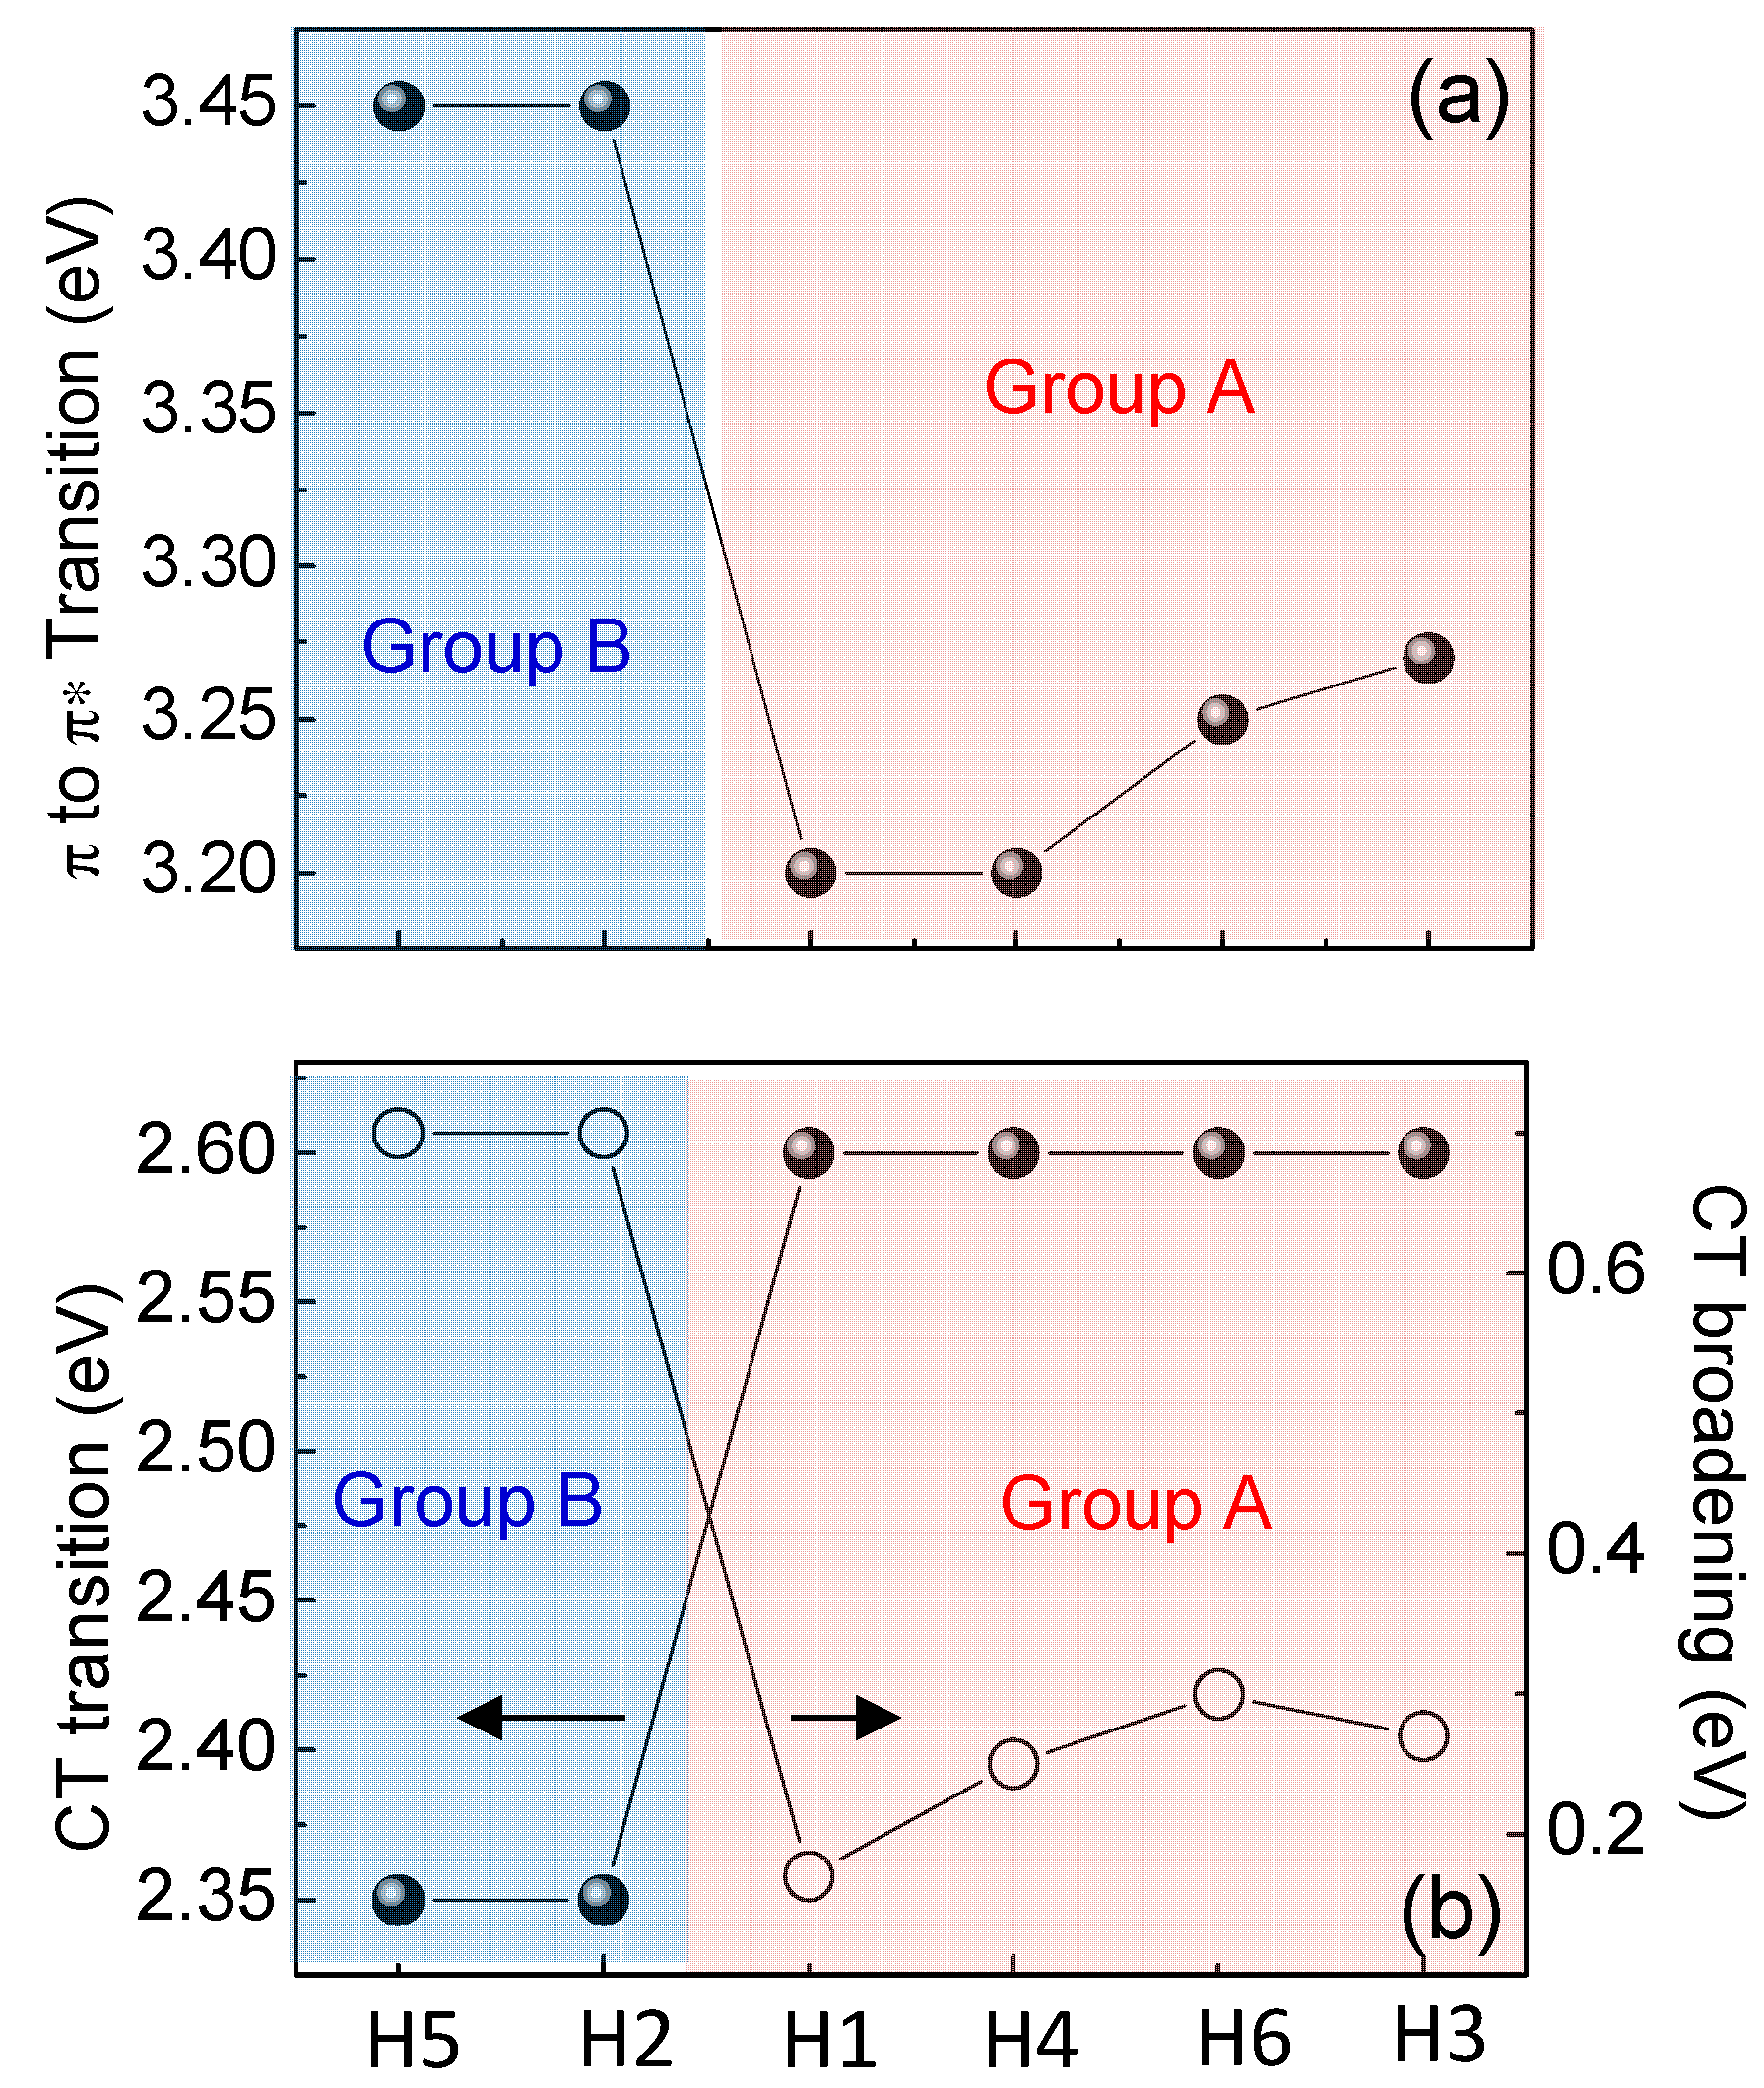
All synthesized molecules can be divided in two groups not only considering the different gaps values (Group A includes H1, H3, H4 and H6, where Group B includes H2 and H5) but also investigating the evolution of the optical transitions in Figure 4b and Figure 6. Figure 4b compares ellipsometric spectra of the extinction coefficient of H1 as representative of Group A, and H2 as representative of Group B derived by the ellipsometric fitting, while Figure 6a,b summarizes the evolution of the π–π* transition and of the CT transition in energy and broadening for all the molecules. Specifically, Group A samples (H1, H3, H4 and H6) have a more red-shifted π–π* transition than Group B molecules (H2 and H5), while Group A CT transition is more-blue shifted with a decrease of its broadening.
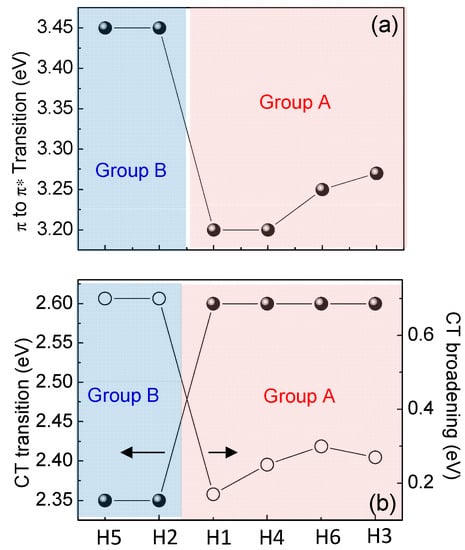
Figure 6.
Evolution of the (a) π→π* transition and (b) position and broadening of the CT transition as a function of molecule type.
The π–π* red-shift combined with the larger CT intensity and its narrower broadening for Group A samples (H1, H3, H4 and H6) is indicative of a lower molecule distortion, lower intermolecular interaction (no aggregation) and larger planarity that contribute to a decrease in the structural disorder of the material, compared to Group B compounds (H2 and H5) [24,25,26]. Ellipsometric data have been confirmed by Raman measurements, as shown in Figure 7.
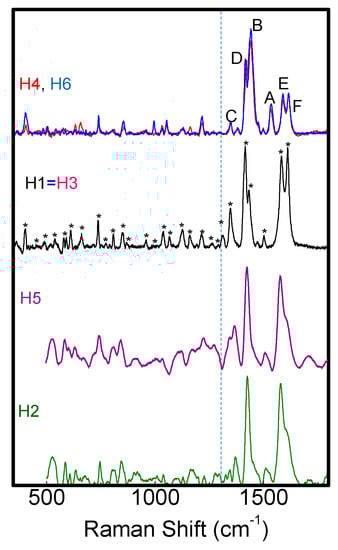
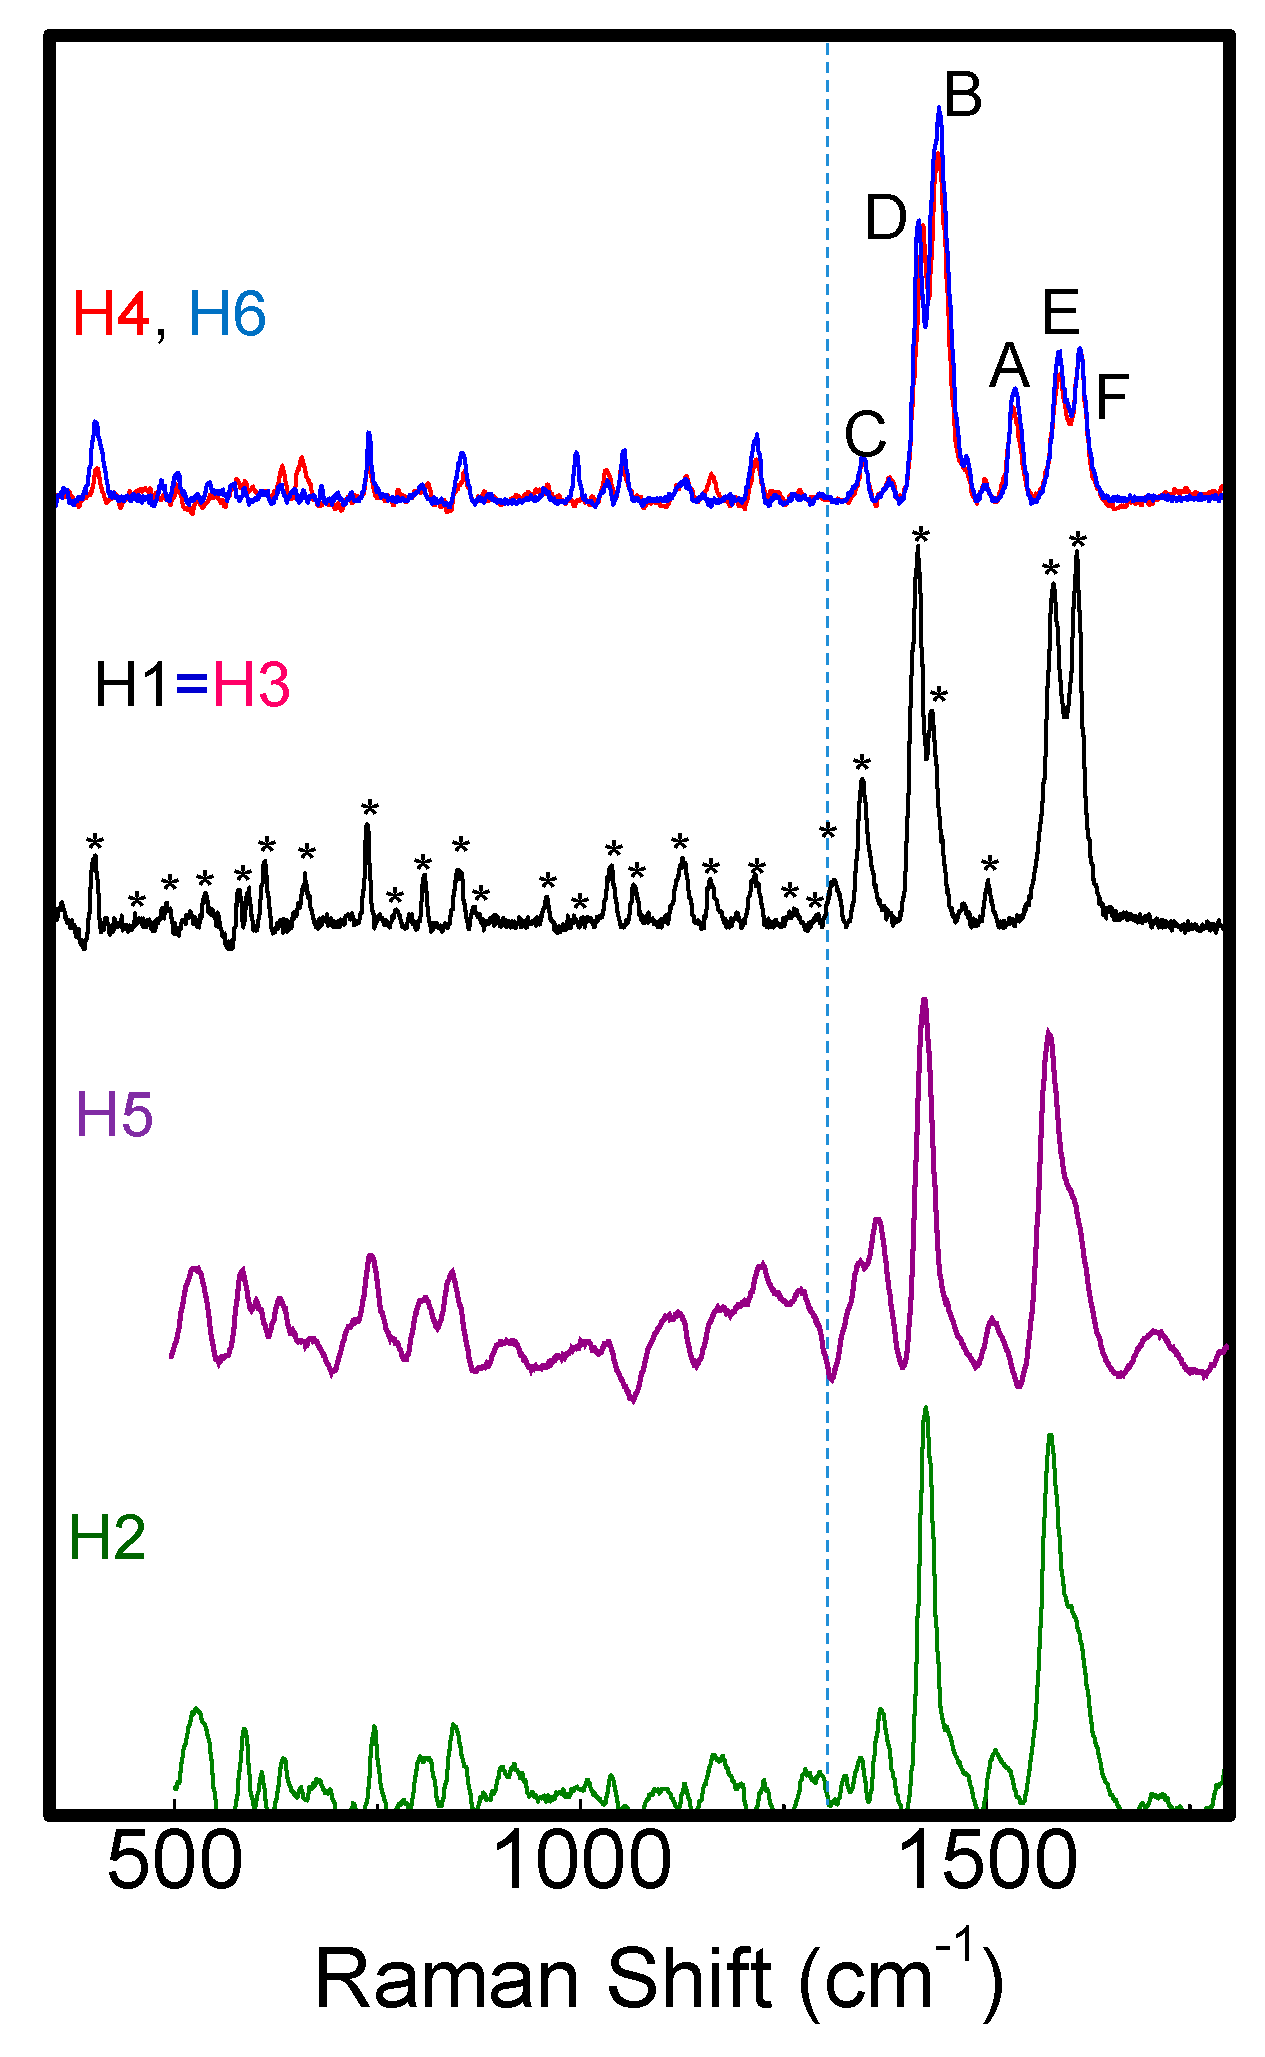
Figure 7.
Raman spectra of H1–H6 samples.
Raman spectra show typical vibrational modes of C-C, C-C-C, C-H, C-N, C-S-C and C-N-C bonds [27,28,29,30,31,32] correctly assigned in Table S2 and indicated by (*) in Figure 7. At wavenumbers lower than 1300cm−1, H1–H6 spectrado not differ significantly; this is different to those atwavenumbers larger than 1300 cm−1, as shown in Figure 8a where Raman spectra of H1–H6 in the range 1300–1700 cm−1 are compared.
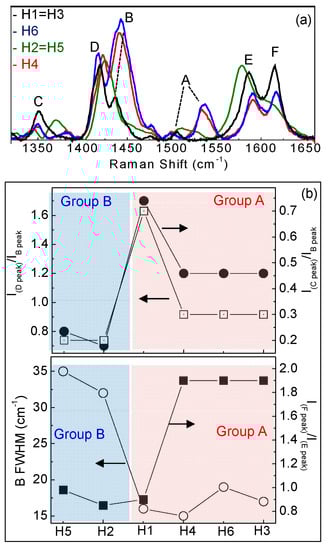
Figure 8.
(a) Raman spectra in the range 1300–1650 cm−1; (b) IDpeak/IBpeak ratio and ICpeak/IBpeak ratio and IFpeak/IEpeak ratio and full width at half maximum (FWHD) of the B band for H1–H6.
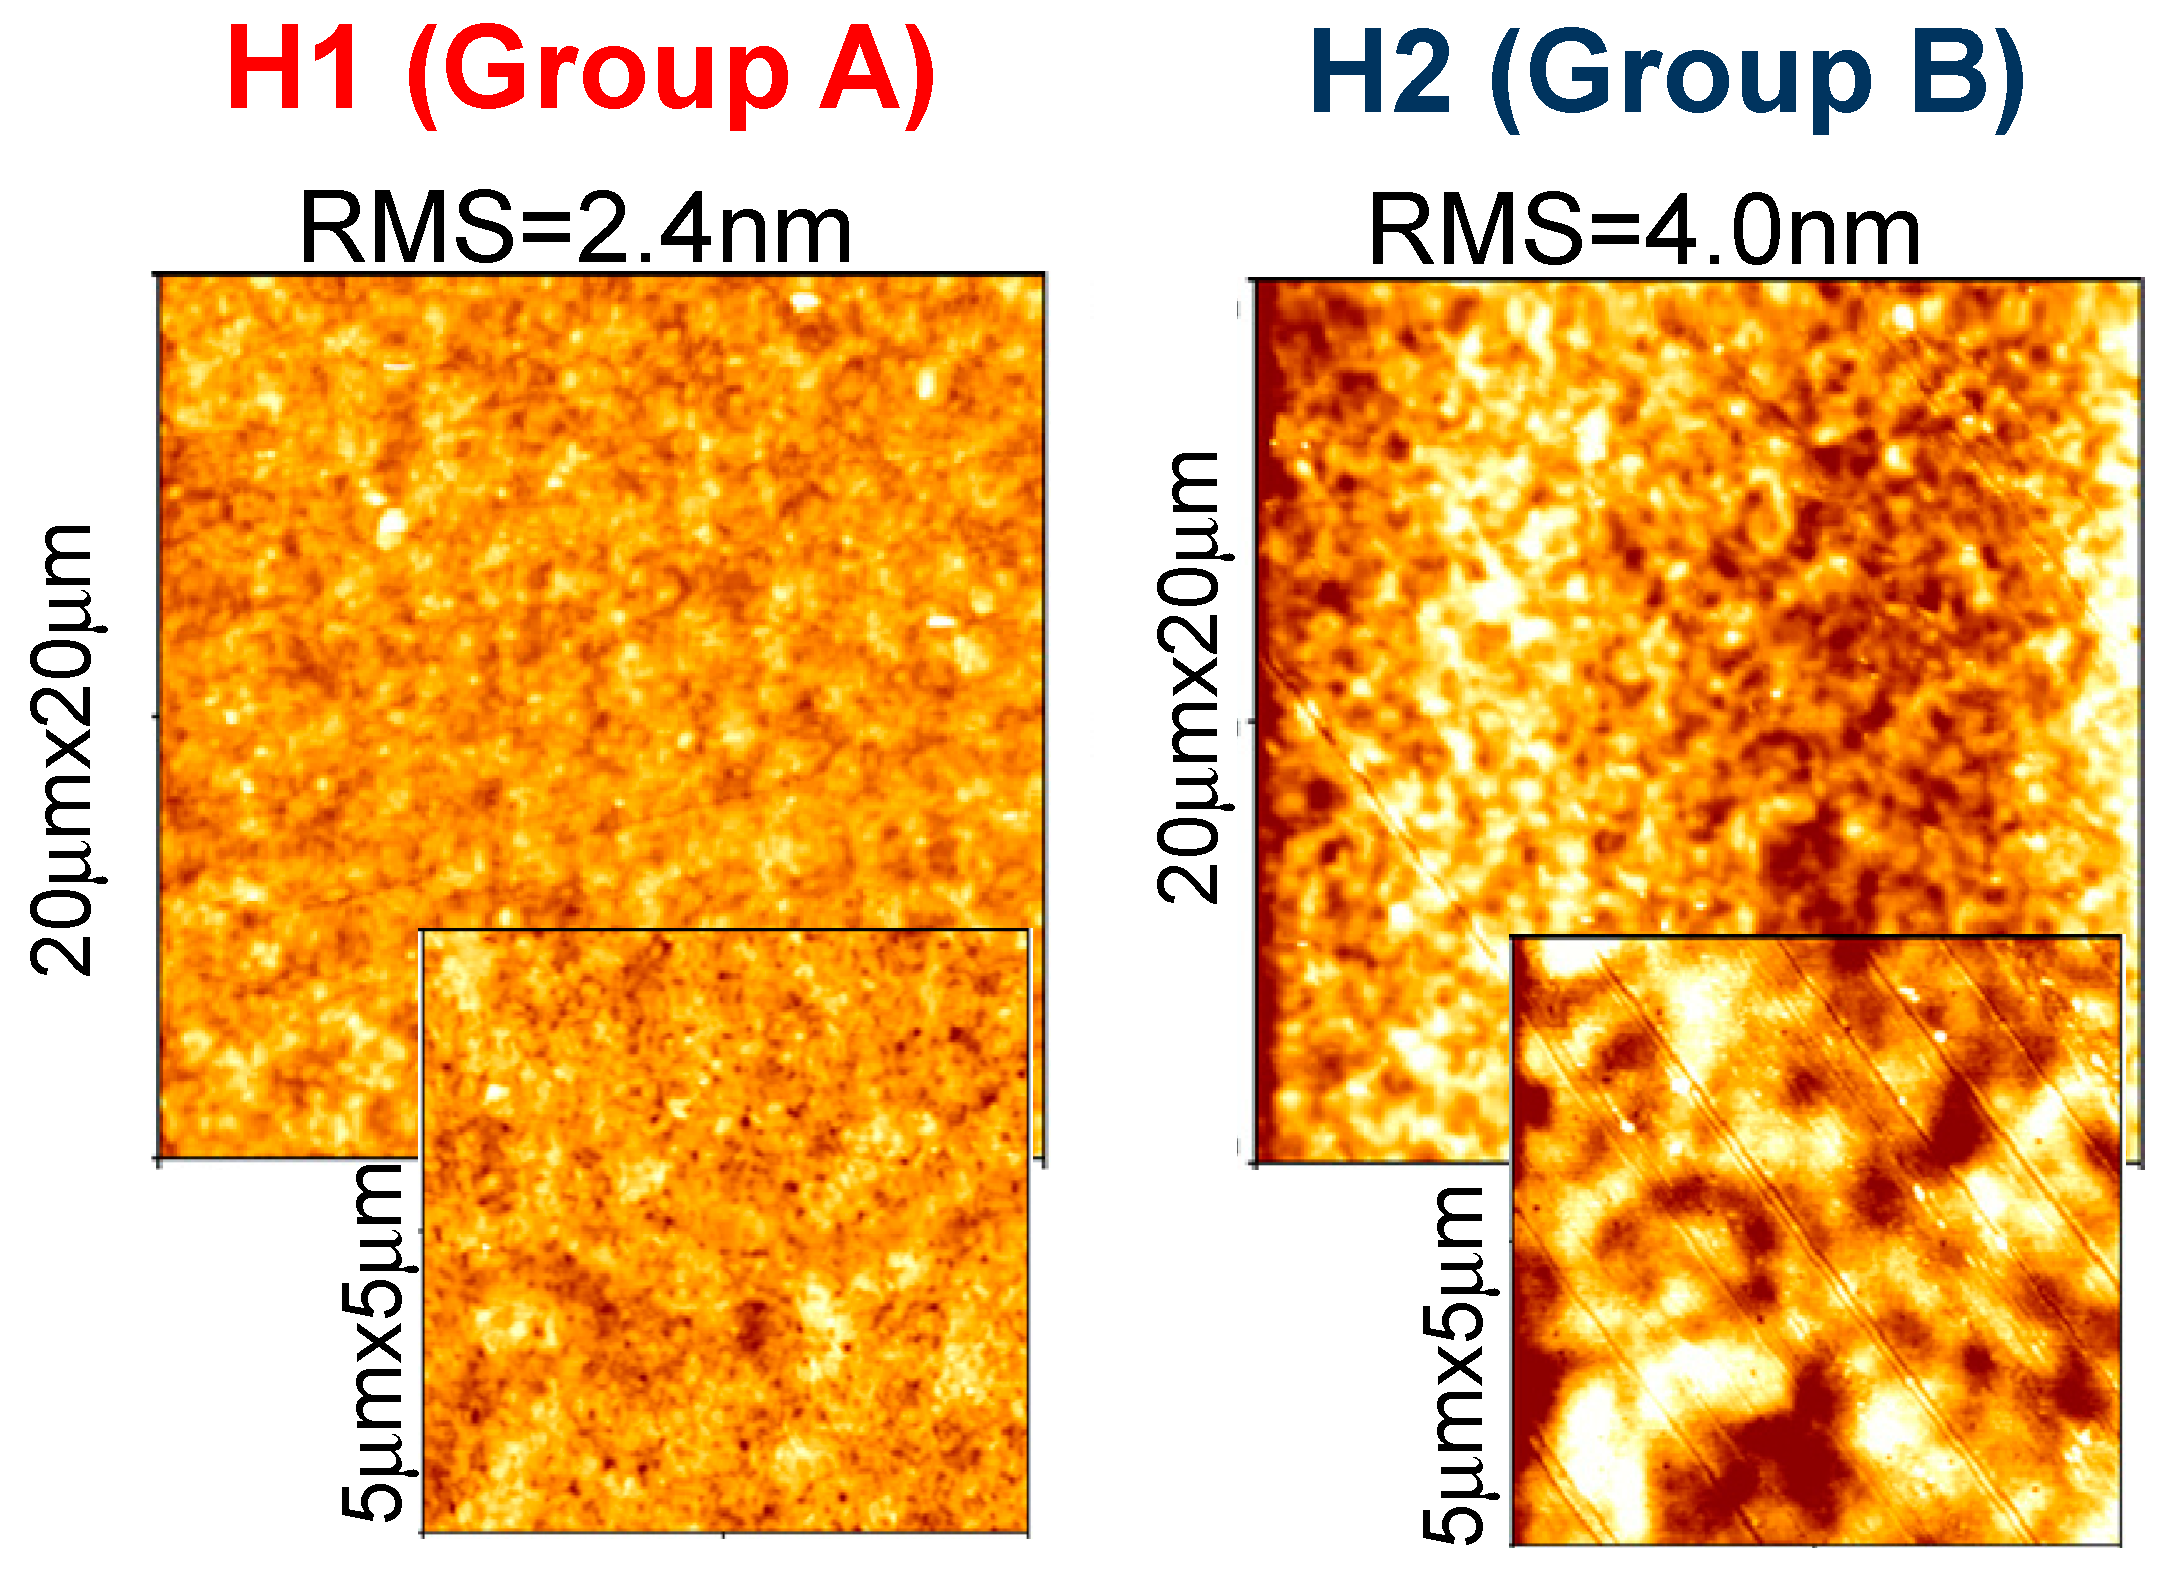
We found that the various molecules can be grouped in classes with similar Raman features, consistently with optical results. Group A (that includes molecules H1, H3, H4 and H6) is characterized by two well resolved intense lines at 1417–1422 and 1437–1443 cm−1, labeled as D and B bands in Figure 8a. An additional peak appears in the range 1506–1537 cm−1, known as A-line, and assigned to the ring vibration localized at the end rings or to the in-phase antisymmetric ν(C=C) vibration localized on the outer rings of the oligothiophene chain [33]. The region around 1600 cm−1 is dominated by two peaks at 1590 and 1615 cm−1 of similar intensity, labeled as E and F peaks in Figure 4a, and assigned to C=C vibrations largely localized onto two fluorene moieties, with some contribution from the central thiophene and bithiophene group for the low frequency peak [34]. Conversely, Group B (including H2 and H5) has one single peak at 1431 cm−1; the E-F bands are red-shifted to 1579 cm−1 and 1608 cm−1, with the E-peak being more intense than the F-band. Those differences can be related to molecular order of the solid-state layer, depending on their substituents. Specifically, the thiophene and bithiophene Raman spectra are characterized, respectively, by a single peak at 1408–1425 cm−1 [35,36], and at 1416–1443 cm−1 [37,38], due to the Cα=Cβ stretching vibration of the thienyl ring, as seen for Group B molecules. This peak splits into two peaks for Group A, one (the D-line) roughly at the same wavenumber of unsubstituted thiophens (in our case ~1420 cm−1) that can be assigned to Cα=Cβ-(H) stretching vibration, and the other one (the B-line), at larger wavenumber due to the Cα=Cβ-(substituents) deformation by substitution of the hydrogen terminal of the thiophene ring [39]. This splitting indicates the existence of a vibrational coupling of substituents to the C=C backbone for Group A [31]. Furthermore, a higher intensity of the C-band [40] and D-band [41] with respect to the B-band is indicative of a better molecular order, as seen for the H1, which possesses a more planar backbone conformation. In fact, Y. Gao et al. [40] assigned the B-band to unaggregated C=C species in chains with lower intra- and interchain order and with shorter conjugation length. Additionally, a more ordered phase and better crystallinity can also be inferred by the narrower FWHM of the B-band [41,42,43], being 15 cm−1 for H1 and 20 cm−1 for H6 and H4. Finally, the relative intensity of the E- and F-band is also useful to evaluate efficient planarity [34]. Specifically, the higher the IF/IE ratio, the higher theplanarity [35], supporting the larger planarity for the H1 and the lowest planarity for Group B sample H2 and H5. The above considerations about planarity and aggregates of the various molecules also reflect in the different morphology. Figure 9 shows topographical 20 × 20 μm images of H1 (Group A) and H2 (Group B) representative samples. Interestingly, the H1, as all compounds of Group A, has a smoother morphology with a low surface roughness, whereas the H2 and H5 (Group B) show a rougher morphology and less dense structure (the AFM characterization of all compounds are collected in Figure S5 into supporting information).

Figure 9.
20 μm × 20 μm topographical images, with corresponding zoomed 5 μm × 5 μm ones, of H1 as representative of Group A, and H2 as representative of Group B.
2.5. Space-Charge-Limited Current Hole Mobilities
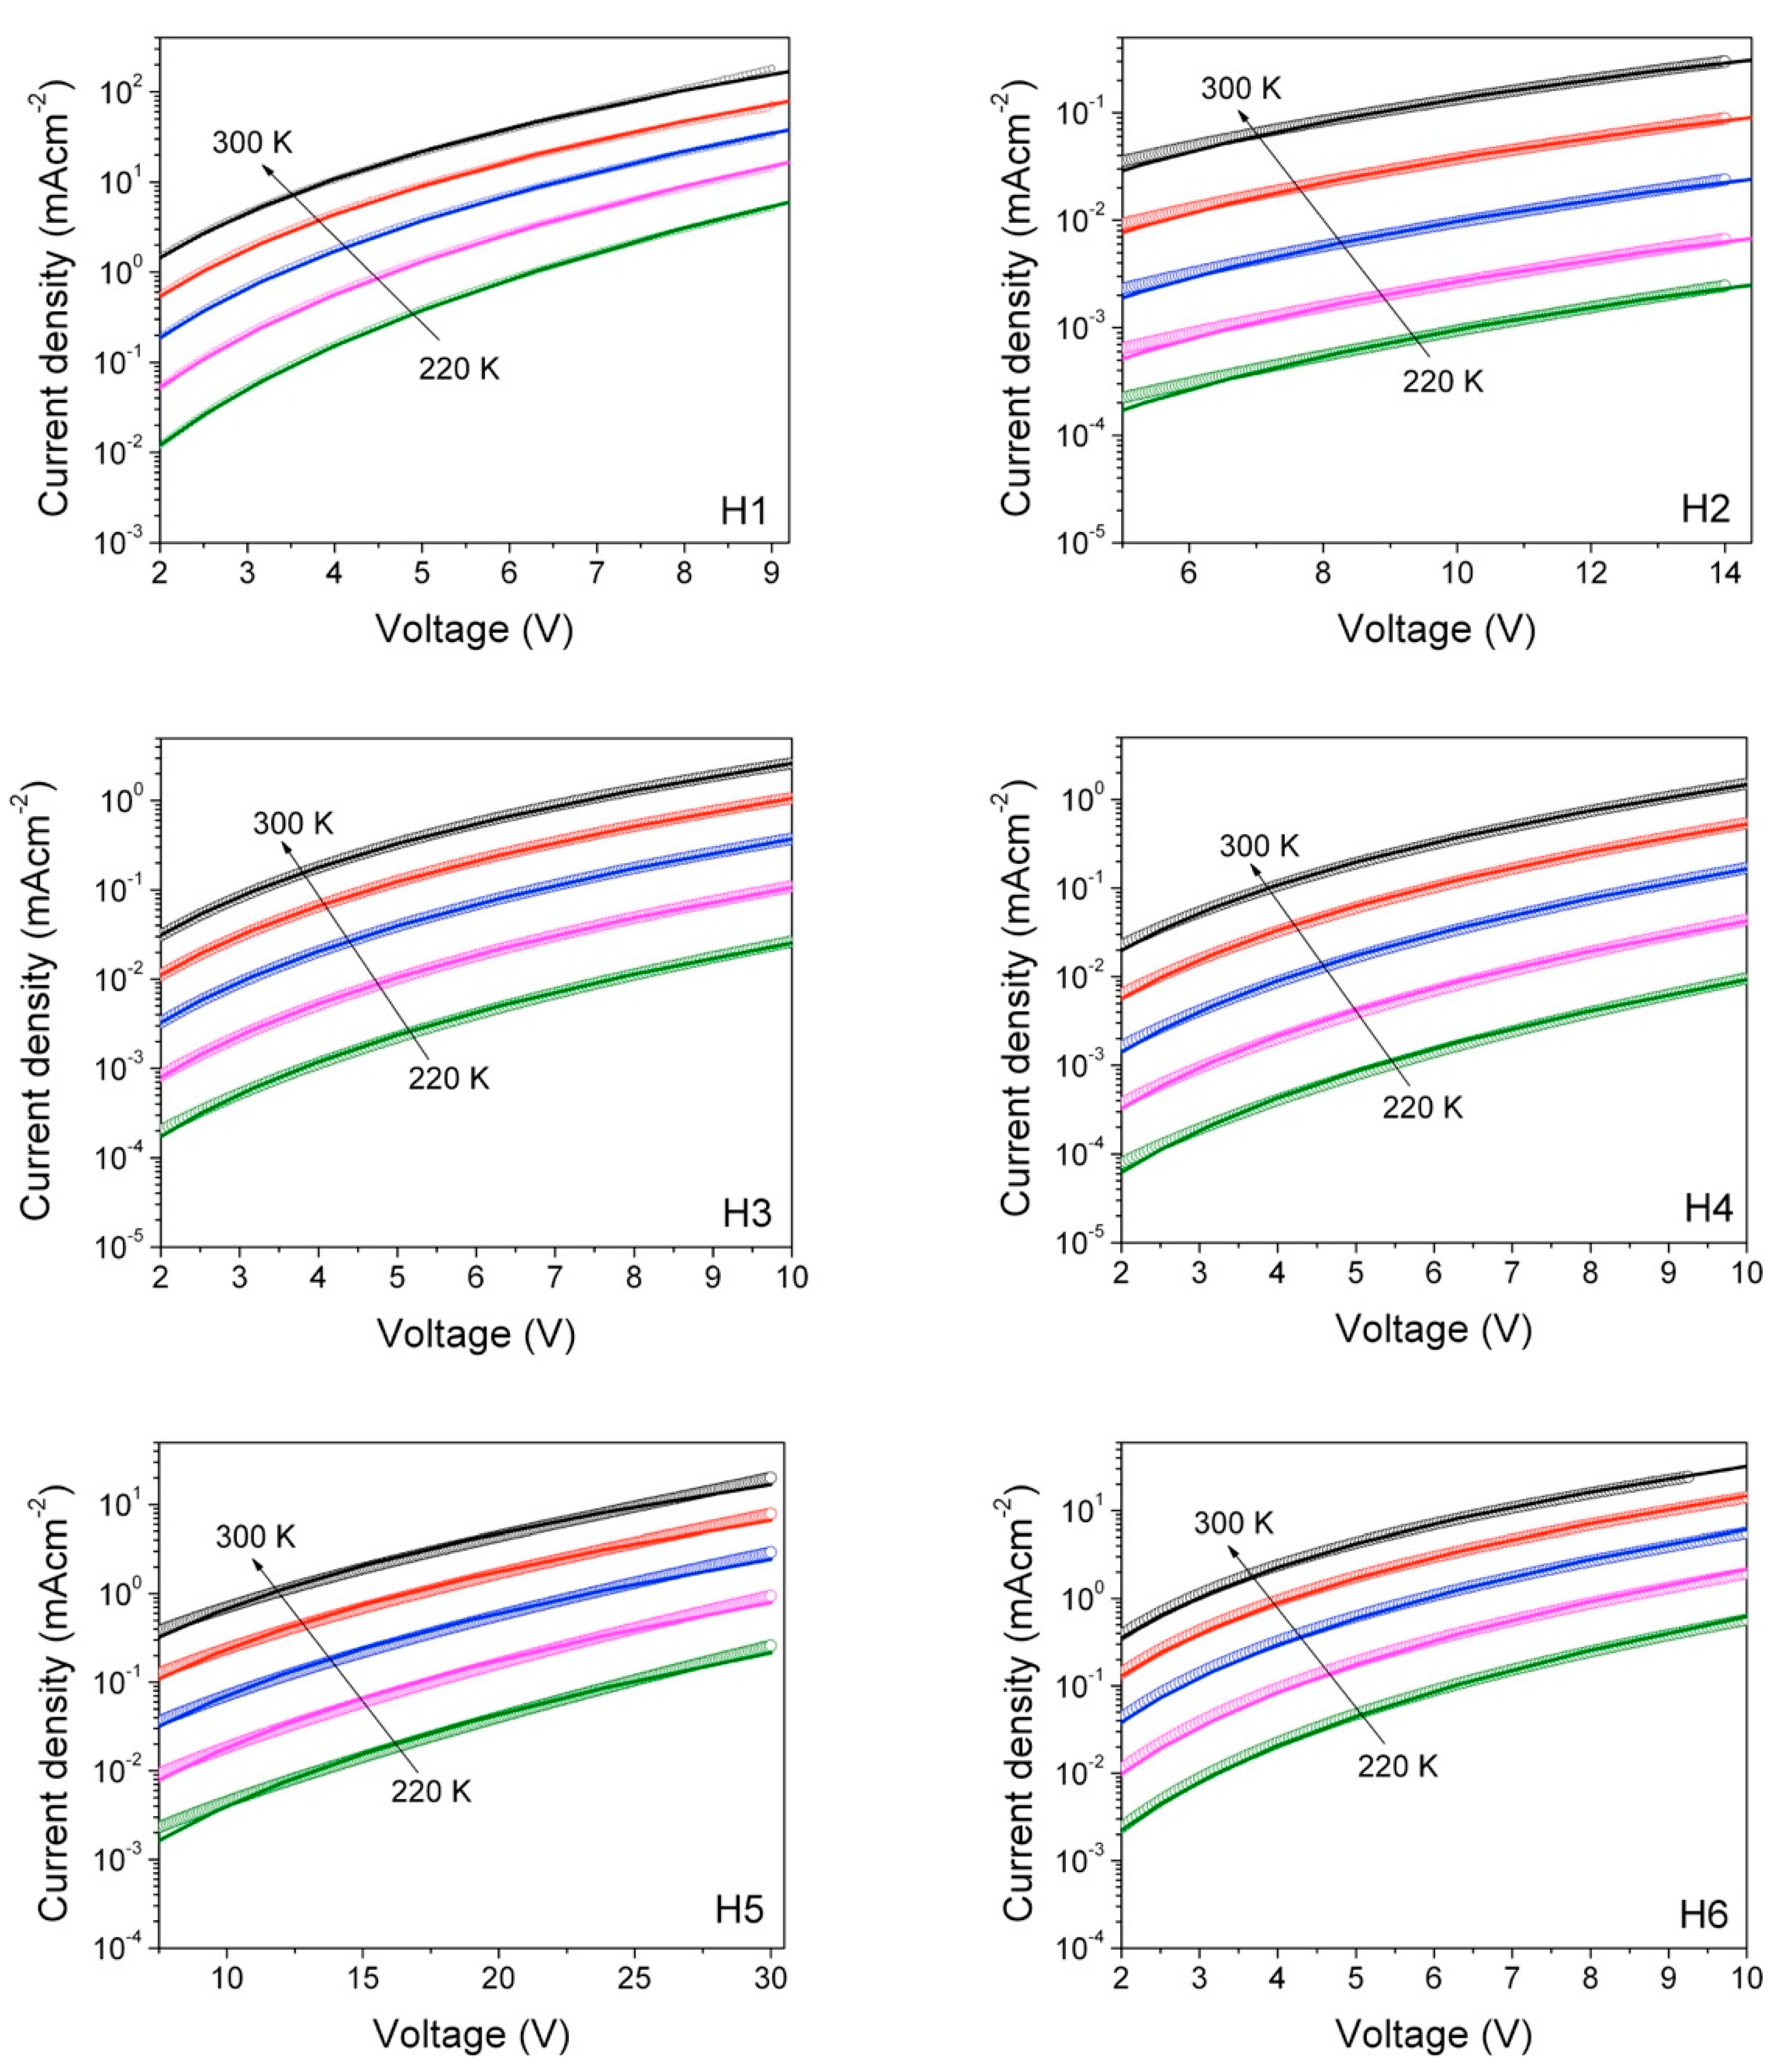
Unveiling the relationship between materials chemical structure and their charge transport properties is of fundamental importance for their application in optoelectronic devices. For this reason, hole-mobility was measured by the space-charge-limited current (SCLC) method. SCLC is one of the most widely used techniques [44,45] to measure charge mobility in the direction perpendicular to the film, which is the direction most relevant for photovoltaic applications or light emitting diodes [46,47]. Hole-only devices having the following structure: ITO/PEDOT:PSS/Hx/MoO3/Au, were realized and characterized under the same experimental conditions, such as in the dark, in a vacuum (10−3 mbar) and at a controlled temperature. Figure 10 shows the current density–voltage (J-V) curves in semi-log scale for the six materials investigated (symbols).
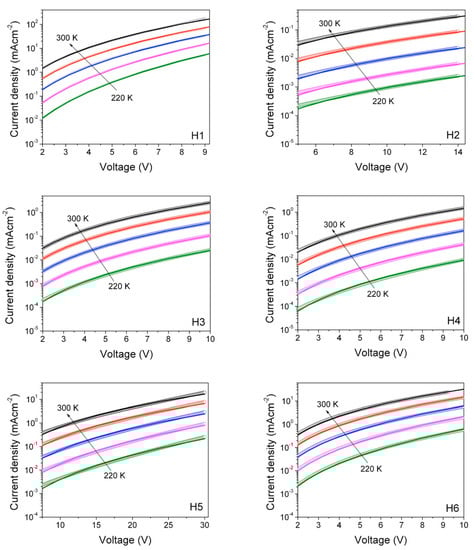
Figure 10.
Temperature dependent density current–voltage characteristics of hole-only devices based on the six materials investigated (open circles). The fits to the experimental data (solid lines) are also reported, according to the Murgatroyd-Gill equation.
In order to extract the charge carrier mobility (μ), the J-V curves were analyzed in terms of the space-charge-limited current model, according to the Murgatroyd-Gill Equation (1) (solid line in Figure 10):
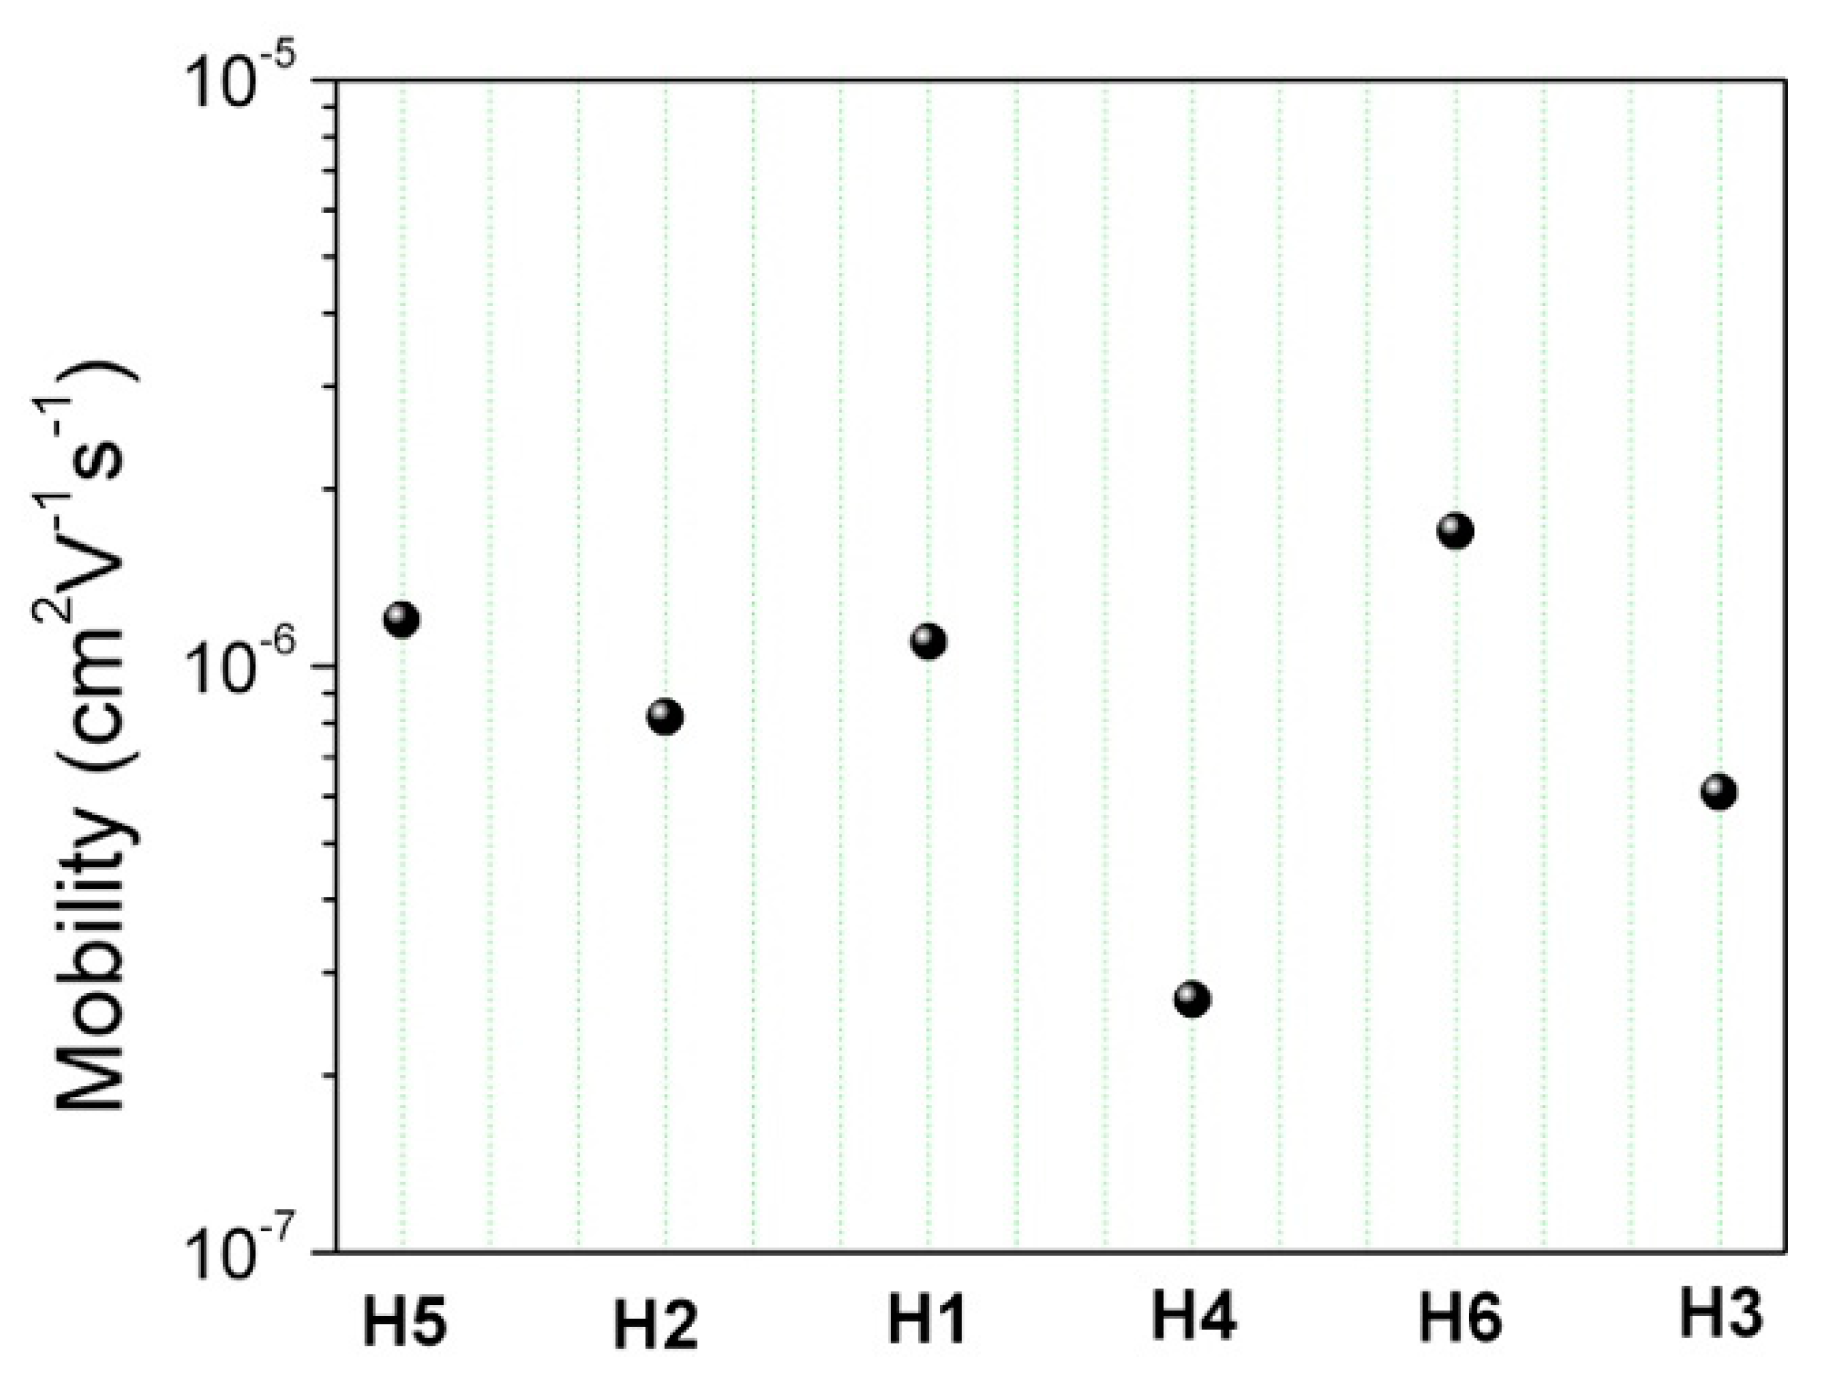
where ε0 is the permittivity of vacuum, εr is the relative dielectric constant, assumed to be 3.6, μ0 is the zero-field carrier mobility, γ is the field-dependent parameter, and L is the organic film thickness. The estimated zero field mobilities are reported in Figure 11.
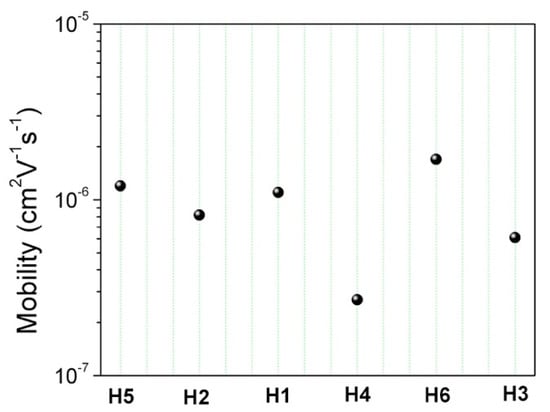
Figure 11.
SCLC hole-mobility values for the six materials investigated at zero-field (filled circles).
To deepen the understanding of charge transport within this series of organic small molecules, we performed SCLC measurements in a temperature range of 220–300 K at a step of 20 K, as seen in Figure 10. Experimental data (symbols) were fitted according to equation (1) along with the Gaussian disorder model (GDM) using the freeware automated analysis tool developed by Kemerink [44], where the only free fitting parameters were μ0 and γ, and all the other variables were known. The resulting values of γ were plotted against 1/T (data not shown), and then linearly fitted according to the following Equation (2):
where B and T0 are constant and positive parameters whose resulting values are summarized for each material in Table 3. In a similar way, by plotting μ0 against 1/T2, we were able to calculate the mobility at zero field and infinite temperature (μ∗) and the energetic disorder (σ), by fitting the data according to the following Equation (3):
Table 3.
Fitting parameters for hole-only devices of Figure 9, extracted from the MG+GDM model.
Although both groups (A and B) showed only a slight difference in terms of mobility, such feedback on the chemical structure helps to further understand the path to better molecular design.
3. Experimental Section
3.1. Materials and Methods
All starting materials were purchased from commercial sources and used without further purification. All solvents and reagents were used as received, unless otherwise claimed. 3,6-Dibromo-9H-fluorene (4), [2,2′-bithiophene]-5,5′-dicarbaldehyde (2), 2,5-bis((2,7-dibromo-9H-fluoren-9-ylidene)methyl)thiophene (1), (E)-9-((5-((2-(bis(4-methoxyphenyl)amino)-7-((3-methoxyphenyl)(4-methoxyphenyl)amino)-9H-fluoren-9-ylidene)methyl)thiophen-2-yl)methylene)-N2,N2,N7,N7-tetrakis(4-methoxyphenyl)-9H-fluorene-2,7-diamine (H1) and 9,9’-(thiophene-2,5-diylbis(methanylylidene))bis(N3,N3,N6,N6-tetrakis(4-methoxyphenyl)-9H-fluorene-3,6-diamine) (H2) were previously prepared by our group following the synthetic procedure described in the literature [3,7,16]. TLC 0.25 mm silica gel plates with a UV indicator (60F-254, Merck KGaA, Darmstadt, Germany) were used to monitor the progress of reactions. The microwave-assisted syntheses were performed with a CEM Discover Labmate reactor (CEM corporation, CEM SRL, Cologno Al Serio, Italy). 1H- and 13C NMR spectra were recorded on a Bruker AVANCE III 400 MHz instrument (Bruker Italia SRL, Milano, Italy), using chloroform-d (CDCl3), acetone-d6, and dimethylsulfoxide-d6 (DMSO-d6) as the solvents, and splitting patterns were described as singlet (s), doublet (d), triplet (t), quartet (q), or multiplet (m). Elemental analyses were done by Carlo Erba CHNS-O EA1108-Elemental Analyzer (CARLO ERBA Reagents Srl, Cornadero (Mi), Italy). LC-MS spectra were acquired with an Agilent 6300 Series Ion Trap source (APCI) (Agilent Technologies Italia Spa, Cernusco sul Naviglio MI, Italy). UV-Vis absorption spectra were recorded on a Varian Cary 3000 spectrophotometer (Agilent Technologies Italia Spa, Italy).
3.2. Computational Details
All calculations have been performed using the TURBOMOLE program (TURBOMOLE GmbH, Karlsruhe, Germany) [48,49] using the PBE0-1/3 functional [50] and a def2-TZVP [51] basis set.
3.3. Electrochemistry and Spectroelectrochemistry
Electrochemical characterization of compounds was carried out by cyclic voltammetry (CV) using an AMEL s.r.l. (AMEL s.r.l., Milano, Italy) (Mod. 7050) potentiostat. A typical three-electrode cell was assembled with a glassy carbon disk-working electrode, a Pt-wire auxiliary electrode, and an Ag/AgCl non-aqueous reference electrode [52]. Cyclic voltammograms were acquired at different scan rates, from 50 to 100 mV s−1, on 1 mM compound solutions prepared in the electrolyte solution, which consisted of 0.1 M tetrabutylammonium hexafluorophosphate (TBAPF6) in dichloromethane (CH2Cl2). All the solutions were previously degassed with N2. The CV of the ferrocenium/ferrocene (Fc+/Fc) couple (0.1 mM) was also recorded in the same condition used for the MV compounds solutions and used as external reference for potential calibration. Spectro-electrochemical experiments were performed with an electrolytic cell (BAS Inc., ALS Co., Ltd, Tokio, Japan) composed of a 1 mm path length cuvette, where a platinum gauze thin layer and a platinum wire were used as the working electrode and the auxiliary electrode, respectively. A pseudo-reference electrode consisting of an Ag wire was calibrated against the Fc+/Fc redox couple [53]. The spectro-electrochemical cell was filled with dichloromethane solutions of each compound (from 1 to 0.25 mM) and TBAPF6 (0.1 M). UV-vis-NIR spectra were recorded using a Vertex 80 (Bruker Italia SRL, Milano, Italy)) spectrophotometer. The potential was supplied by means of an Amel 2049 model potentiostat. Measurements were performed at 25 °C.
3.4. Spectroscopic Ellipsometry, Ramanand AFM Characterization
Spectroscopic ellipsometry spectra of the refractive index, n, and extinction coefficient, k, were measured in the 1.5–6.5 eV energy range by use of a phase modulated spectroscopic ellipsometer (UVISEL, Jobin Yvon, HORIBA Ltd, Palaiseau, France) at an incidence angle of 70.00.Parameterization of optical constants in the UV-Vis range is based on the combination of Lorentzian oscillators to take into account the contribution of band-to-band transitions. The number of oscillators depends on the band structure of the semiconductor. For the present molecules, six Lorentz oscillators were used. Experimental SE spectra were fitted using a two-layer model, air/molecule/substrate, where fit variables were the dispersion equation and film thickness. The total film thickness was also measured by a profilometer (alpha step). An isotropic model was assumed in the data analysis, since previous measurements on films from spin-coating with the thickness in the range investigated in the present paper did not show significant anisotropy. Films were measured with a 1.5 mm2 spot in different points of the samples and all SE measurements for a sample were fit to the same model and dispersion equation; differences were within the 95% confidence limit of fit parameters, indicating a good lateral homogeneity of samples.
Raman spectra were collected using a LabRAM HR Horiba-Jobin Yvon spectrometer with the 532 nm excitation lasers. The combination of Ellipsometric and Raman analysis was useful to correlate optical properties (spectra of extinction coefficient, energy gap and energy position of optical transitions, intensity and width of Raman bands) with structural/conformational properties, like planarity, distortion and aggregation, as a function of the molecule structure and substituents.
Atomic force microscopy (AFM), measurements were performed in non-contact mode to characterize the surface morphology by Autoprobe CP (ThermoMicroscopes, Sunnyvale, CA, USA).
3.5. Fabrication and Characterization of Hole-Only Devices
Hole-only devices were fabricated by spin-coating in air onto precleaned and O2-plasma-treated ITO patterned glass substrates, a 40 nm thin film of polystyrene sulfonate (PEDOT:PSS) at 4000 rpm for 60 s, followed by 20 min thermal annealing at 140 °C. The HTM was spin-coated in a glovebox from a chloroform solution at a concentration of 70 mg/mL and at 2000 rpm, which led to a film thickness in the range of 500 nm. A 10 nm MoO3, followed by 80 nm Au, were deposited as the top electrode by high-vacuum (10−6 mbar) thermal evaporation. The device areas were measured by an optical microscope, and they were in the range of 0.035−0.045 cm2. SCLC measurements were performed at room temperature in the dark, loading the sample into a cryostat under low dynamic vacuum (10−3 mbar). Current−voltage characteristics were recorded using a computer-controlled pico-ammeter (HP 4140B), by applying a positive bias to the bottom electrode (ITO/PEDOT). Data analysis for charge transport was performed using an automated open-source software developed by Kemerink [44].
4. Conclusions
Two classes of materials, for a total of six different molecules, were synthesized with an H-shape design, based on a molecular structure consisting of two D-A-D units connected by a thiophene or bitiophene bridge, and the diarylamino donor units anchored to the 2,7- and 3,6 positions of the dibenzofulvene backbone. Optical, electrochemical, morphological and hole-transporting properties were investigated, by UV-Vis spectroscopy, ellipsometry, Raman spectroscopy, AFM microscopy, cyclic voltammetry, TD-DFT calculations and SCLC method. In this way, we have elucidated the differences between the two classes of molecules and investigated the role of the molecular design on the various properties. All the compounds exhibited reversible redox properties and possess a low oxidation potential aiding facile removal of an electron from the HOMO, as well as the propensity to form a stable radical form. Furthermore, they showed good solubility, and chemical and environmental stability. In addition, Group A materials showed a lower structural disorder, larger planarity, and better flatness compared to Group B ones.
Although the SCLC measurements did not show high hole-mobility values for any of the studied compounds, and it was not possible to record a significant correlation between the hole-mobility measurements and the chemical structure, Group A could be identified as the one with the most promising characteristics for the development of hole-transporting materials based on the DBF structure, according to structural and morphological characterization. This study demonstrated therefore a rational tailoring of the diphenylamine-based electron donors on the dibenzofulvene backbone, in order to fine tune the optoelectronic, structural and morphological properties. The versatility of the DBF reactive sites will allow us to introduce a wide variety of arylamino groups to improve their morphological and electric properties, in order to obtain promising hole transport materials.
Supplementary Materials
The following are available online: the synthetic procedures, cyclic voltammetry, isodensity plots of the frontier molecular orbitals of H1–H6, and 1H-NMR and 13C-NMR spectra.
Author Contributions
M.M.G. and M.L. (Maria Losurdo) conducted the ellipsometry, Raman and AFM characterization. S.G., M.L. (Mauro Leonciniand), R.T. conducted SCLC characterization. G.A. and E.F. carried out the UV-Vis and TD-DFT investigation. G.A.C. and A.B. performed electrochemical and spectro-electrochemical characterization. A.C. and A.-L.C. conducted all reactions, structural-chemical characterization, wrote and supervised the manuscript. G.G. revised the manuscript. All authors have read and agreed to the published version of the manuscript.
Funding
This research was funded by the Ministry of University and Scientific Research (MIUR), project FISR- C.N.R. “Tecnopolo di Nanotecnologia e Fotonica per la Medicina di Precisione”, grant number: CUP B83B17000010001.
Data Availability Statement
Not applicable.
Acknowledgments
The authors gratefully thank Sonia Carallo for technical support.
Conflicts of Interest
The authors declare no conflict of interest.
Sample Availability
Samples of the compounds are not available from the authors.
References
- Yang, Z.; Mao, Z.; Xie, Z.; Zhang, Y.; Liu, S.; Zhao, J.; Xu, J.; Chi, Z.; Aldred, M.P. Recent advances in organic thermally activated delayed fluorescence materials. Chem. Soc. Rev. 2017, 46, 915–1016. [Google Scholar] [CrossRef]
- Varghese, M.A.; Anjali, A.; Harshini, D.; Nagarajan, S. Organic Light-Emitting Transistors: From Understanding to Molecular Design and Architecture. ACS Appl. Electron. Mater. 2021, 3, 550–573. [Google Scholar] [CrossRef]
- Corrente, G.A.; Fabiano, E.; Manni, F.; Chidichimo, G.; Gigli, G.; Beneduci, A.; Capodilupo, A.L. Colorless to All-Black Full-NIR High-Contrast Switching in Solid Electrochromic Films Prepared with Organic Mixed Valence Systems Based on Dibenzofulvene Derivatives. Chem. Mater. 2018, 30, 5610–5620. [Google Scholar] [CrossRef]
- Corrente, G.A.; Fabiano, E.; La Deda, M.; Manni, F.; Gigli, G.; Chidichimo, G.; Capodilupo, A.L.; Beneduci, A. High-Performance Electrofluorochromic Switching Devices Using a Novel Arylamine-Fluorene Redox-Active Fluorophore. ACS Appl. Mater. Interfaces 2019, 11, 12202–12208. [Google Scholar] [CrossRef] [PubMed]
- Corrente, G.A.; Cospito, S.; Capodilupo, A.L.; Beneduci, A. Mixed-Valence Compounds as a New Route for Electrochromic Devices with High Coloration Efficiency in the Whole Vis-NIR Region. Appl. Sci. 2020, 10, 8372. [Google Scholar] [CrossRef]
- Capodilupo, A.L.; De Marco, L.; Fabiano, E.; Giannuzzi, R.; Scrascia, A.; Carlucci, C.; Corrente, G.A.; Cipolla, M.P.; Gigli, G.; Ciccarella, G. New organic dyes based on a dibenzofulvene bridge for highly efficient dye-sensitized solar cells. J. Mater. Chem. A 2014, 2, 14181–14188. [Google Scholar] [CrossRef]
- Capodilupo, A.L.; De Marco, L.; Corrente, G.A.; Giannuzzi, R.; Fabiano, E.; Cardone, A.; Gigli, G.; Ciccarella, G. Synthesis and characterization of a new series of dibenzofulvene based organic dyes for DSSCs. Dye. Pigm. 2016, 130, 79–89. [Google Scholar] [CrossRef]
- Capodilupo, A.L.; Fabiano, E.; De Marco, L.; Ciccarella, G.; Gigli, G.; Martinelli, C.; Cardone, A. [1]Benzothieno[3,2-b]benzothiophene-Based Organic Dyes for Dye-Sensitized Solar Cells. J. Org. Chem. 2016, 81, 3235–3245. [Google Scholar] [CrossRef] [PubMed]
- Capodilupo, A.L.; Vergaro, V.; Fabiano, E.; De Giorgi, M.; Baldassarre, F.; Cardone, A.; Maggiore, A.; Maiorano, V.; Sanvitto, D.; Gigli, G.; et al. Design and synthesis of fluorenone-based dyes: Two-photon excited fluorescent probes for imaging of lysosomes and mitochondria in living cells. J. Mater. Chem. B 2015, 3, 3315–3323. [Google Scholar] [CrossRef]
- Kaur, P.; Singh, K. Recent advances in the application of BODIPY in bioimaging and chemosensing. J. Mater. Chem. C 2019, 7, 11361. [Google Scholar] [CrossRef]
- Jiang, C.; Huang, H.; Kang, X.; Yang, L.; Xi, Z.; Sun, H.; Pluth, M.D.; Yi, L. NBD-based synthetic probes for sensing small molecules and proteins: Design, sensing mechanisms and biological applications. Chem. Soc. Rev. 2021, 50, 7436. [Google Scholar] [CrossRef] [PubMed]
- Zhang, M.; Wang, G.; Zhao, D.; Huang, C.; Cao, H.; Chen, M. 3D hole-transporting materials based on coplanar quinolizino acridine for highly efficient perovskite solar cells. Chem. Sci. 2017, 8, 7807–7814. [Google Scholar] [CrossRef] [PubMed] [Green Version]
- Xu, Y.L.; Ding, W.L.; Sun, Z.Z. How to design more efficient hole-transporting materials for perovskite solar cells? Rational tailoring of the triphenylamine-based electron donor. Nanoscale 2018, 10, 20329–20338. [Google Scholar] [CrossRef]
- Sun, X.; Wu, F.; Zhong, C.; Zhu, L.; Li, Z. A structure-property study of fluoranthene-cored hole-transporting materials enables 19.3% efficiency in dopant-free perovskite solar cells. Chem. Sci. 2019, 10, 6899–6907. [Google Scholar] [CrossRef] [Green Version]
- Yin, X.; Song, Z.; Li, Z.; Tang, W. Toward ideal hole transport materials: A review on recent progress in dopant-free hole transport materials for fabricating efficient and stable perovskite solar cells. Energy Environ. Sci. 2020, 13, 4057–4086. [Google Scholar] [CrossRef]
- Beneduci, A.; Corrente, G.A.; Fabiano, E.; Maltese, V.; Cospito, S.; Ciccarella, G.; Chidichimo, G.; Gigli, G.; Capodilupo, A.L. Orthogonal electronic coupling in multicentre arylamine mixed-valence compounds based on a dibenzofulvene-thiophene conjugated bridge. Chem. Commun. 2017, 53, 8960–8963. [Google Scholar] [CrossRef] [PubMed]
- Corrente, G.A.; Fabiano, E.; De Marco, L.; Accorsi, G.; Giannuzzi, R.; Cardone, A.; Gigli, G.; Ciccarella, G.; Capodilupo, A.L. Effects of donor position on dibenzofulvene-based organic dyes for photovoltaics. J. Mater. Sci. Mater. Electron. 2017, 28, 8694–8707. [Google Scholar] [CrossRef]
- Capodilupo, A.L.; Fabiano, E.; Franco, L.; Gambino, S.; Leoncini, M.; Accorsi, G.; Gigli, G. Control of Electron Transfer Processes in Multidimensional Arylamine-Based Mixed-Valence Compounds by Molecular Backbone Design. J. Phys. Chem. A 2021, 125, 7840–7851. [Google Scholar] [CrossRef]
- Lukeš, V.; Matis, M.; Végh, D.; Štefko, M.; Hrdlovič, P.; Laurinc, V. Structure, electronic and optical characterization of oligothiophenes terminated with (9H-fluoren-9-ylidene)methyl chromophores. Synth. Met. 2007, 157, 770–778. [Google Scholar] [CrossRef]
- Amthor, S.; Noller, B.; Lambert, C. UV/Vis/NIR spectral properties of triarylamines and their corresponding radical cations. Chem. Phys. 2005, 316, 141–152. [Google Scholar] [CrossRef]
- Capodilupo, A.-L.; Manni, F.; Corrente, G.A.; Accorsi, G.; Fabiano, E.; Cardone, A.; Giannuzzi, R.; Beneduci, A.; Gigli, G. Arylamino-fluorene derivatives: Optically induced electron transfer investigation, redox-controlled modulation of absorption and fluorescence. Dye. Pigm. 2020, 177, 108325. [Google Scholar] [CrossRef]
- Krishnamoorthy, T.; Kunwu, F.; Boix, P.P.; Li, H.; Koh, T.M.; Leong, W.L.; Powar, S.; Grimsdale, A.; Grätzel, M.; Mathews, N.; et al. A swivel-cruciform thiophene based hole-transporting material for efficient perovskite solar cells. J. Mater. Chem. A 2014, 2, 6305–6309. [Google Scholar] [CrossRef]
- Shin, W.S.; Joo, M.K.; Kim, S.C.; Park, S.M.; Jin, S.H.; Shim, J.M.; Lee, J.K.; Lee, J.W.; Gal, Y.S.; Jenekhe, S.A. Synthesis and electro-optical properties of spiro-bifluorenylvinylene-based polymers for light-emitting diodes applications. J. Mater. Chem. 2006, 16, 4123–4132. [Google Scholar] [CrossRef]
- Liu, Y.; Liu, Z.; Luo, H.; Xie, X.; Ai, L.; Ge, Z.; Yu, G.; Liu, Y. Benzothieno[2,3-b]thiophene semiconductors: Synthesis, characterization and applications in organic field-effect transistors. J. Mater. Chem. C 2014, 2, 8804–8810. [Google Scholar] [CrossRef]
- Sánchez, C.O.; Sobarzo, P.; Gatica, N. Electronic and structural properties of polymers based on phenylene vinylene and thiophene units. Control of the gap by gradual increases of thiophene moieties. New J. Chem. 2015, 39, 7979–7987. [Google Scholar] [CrossRef]
- Zhang, X.; Johnson, J.P.; Kampf, J.W.; Matzger, A.J. Ring fusion effects on the solid-state properties of α- oligothiophenes. Chem. Mater. 2006, 18, 3470–3476. [Google Scholar] [CrossRef]
- Boo, B.H.; Park, J.; Yeo, H.G.; Lee, S.Y.; Park, C.J.; Kim, J.H. Infrared and Raman Spectroscopy of 9,9′-Spirobifluorene, Bis(2,2′-biphenylene)silane, and Bis(2,2′-biphenylene)germane. Vibrational Assignment by Depolarization Measurement and HF and Density Functional Theory Studies. J. Phys. Chem. A 1998, 102, 1139–1145. [Google Scholar] [CrossRef]
- Sett, P.; De, A.K.; Chattopadhyay, S.; Mallick, P.K. Raman excitation profile of diphenylamine. Chem. Phys. 2002, 276, 211–224. [Google Scholar] [CrossRef]
- Serrano, J.; Casado, J.; Hernández, V.; Favaretto, L.; Distefano, G.; López Navarrete, J.T. Vibrational and theoretical DFT study of two regioregular methyl-disubstituted bithiophenes. J. Mol. Struct. 2001, 563–564, 539–544. [Google Scholar] [CrossRef]
- Hernandez, V.; Ramirez, F.J.; Otero, T.F.; Lopez Navarrete, J.T. An interpretation of the vibrational spectra of insulating and electrically conducting poly(3-methylthiophene) aided by a theoretical dynamical model. J. Chem. Phys. 1998, 100, 114. [Google Scholar] [CrossRef] [Green Version]
- Hernández, V.; Casado, J.; Ramírez, F.J.; Zotti, G.; Hotta, S.; López Navarrete, J.T. Efficient π electrons delocalization in α,α′-dimethyl end-capped oligothiophenes: A vibrational spectroscopic study. J. Chem. Phys. 1998, 104, 9271. [Google Scholar] [CrossRef]
- Ip, J.; Nguyen, T.P.; Le Rendu, P.; Tran, V.H. Study of 4,4′-bis(4-dimethylaminostyryl) benzene based diodes. Synth. Met. 2001, 122, 45–47. [Google Scholar] [CrossRef]
- Castro, C.M.; Delgado, M.C.R.; Hernández, V.; Hotta, S.; Casado, J.; López Navarrete, J.T. Efficiency of the pi conjugation in a novel family of alpha,alpha′-bisphenyl end-capped oligothiophenes by means of Raman spectroscopy. J. Chem. Phys. 2002, 116, 10419–10427. [Google Scholar] [CrossRef]
- Zafra, J.L.; Casado, J.; Perepichka, I.I.; Perepichka, I.F.; Bryce, M.R.; Ramírez, F.J.; Navarrete, J.T.L. π-conjugation and charge polarization in fluorene-dibenzothiophene- S,S -dioxide co-oligomers by Raman spectroscopy and quantum chemistry. J. Chem. Phys. 2011, 134, 044520. [Google Scholar] [CrossRef] [Green Version]
- Cuff, L.; Kertesz, M. Evidence of quinonoid structures in the vibrational spectra of thiophene based conducting polymers: Poly(thiophene), poly(thieno[3,4-b]benzene), and poly(thieno[3,4-b]pyrazine). J. Chem. Phys. 1998, 106, 5541. [Google Scholar] [CrossRef]
- Louarn, G.; Buisson, J.P.; Lefrant, S.; Fichou, D. Vibrational Studies of a Series of-Oligothiophenes as Model Systems of Polythiophene. J. Phys. Chem. 1995, 99, 11399–11404. [Google Scholar] [CrossRef]
- Bukowska, J. Surface-enhanced Raman scattering spectra as a probe of adsorbate-surface interaction. J. Mol. Struct. 1992, 275, 151–157. [Google Scholar] [CrossRef]
- Louarn, G.; Mevellec, J.Y.; Buisson, J.P.; Lefrant, S. Comparison of the vibrational properties of polythiophene and polyalkylthiophenes. Synth. Met. 1993, 55, 587–592. [Google Scholar] [CrossRef]
- Pron, A.; Louarn, G.; Lapkowski, M.; Zagorska, M.; Glowczyk-Zubek, J.; Lefrant, S. “In Situ” Raman Spectroelectrochemical Studies of Poly(3,3′-dibutoxy-2,2′-bithiophene). Macromolecules 2002, 28, 4644–4649. [Google Scholar] [CrossRef]
- Gao, Y.; Grey, J.K. Resonance chemical imaging of polythiophene/fullerene photovoltaic thin films: Mapping morphology-dependent aggregated and unaggregated C=C species. J. Am. Chem. Soc. 2009, 131, 9654–9662. [Google Scholar] [CrossRef]
- Tsoi, W.C.; James, D.T.; Kim, J.S.; Nicholson, P.G.; Murphy, C.E.; Bradley, D.D.C.; Nelson, J.; Kim, J.S. The nature of in-plane skeleton Raman modes of P3HT and their correlation to the degree of molecular order in P3HT:PCBM blend thin films. J. Am. Chem. Soc. 2011, 133, 9834–9843. [Google Scholar] [CrossRef] [PubMed]
- Yun, J.J.; Peet, J.; Cho, N.S.; Bazan, G.C.; Lee, S.J.; Moskovits, M. Insight into the Raman shifts and optical absorption changes upon annealing polymer/fullerene solar cells. Appl. Phys. Lett. 2008, 92, 251912. [Google Scholar] [CrossRef]
- Miller, S.; Fanchini, G.; Lin, Y.Y.; Li, C.; Chen, C.W.; Su, W.F.; Chhowalla, M. Investigation of nanoscale morphological changes in organic photovoltaics during solvent vapor annealing. J. Mater. Chem. 2008, 18, 306–312. [Google Scholar] [CrossRef]
- Felekidis, N.; Melianas, A.; Kemerink, M. Automated open-source software for charge transport analysis in single-carrier organic semiconductor diodes. Org. Electron. 2018, 61, 318–328. [Google Scholar] [CrossRef]
- Nikolka, M.; Broch, K.; Armitage, J.; Hanifi, D.; Nowack, P.J.; Venkateshvaran, D.; Sadhanala, A.; Saska, J.; Mascal, M.; Jung, S.H.; et al. High-mobility, trap-free charge transport in conjugated polymer diodes. Nat. Commun. 2019, 10, 2122. [Google Scholar] [CrossRef] [Green Version]
- Wright, I.A.; Skabara, P.J.; Forgie, J.C.; Kanibolotsky, A.L.; González, B.; Coles, S.J.; Gambino, S.; Samuel, I.D.W. Electronic, redox and charge transport properties of an unusual hybrid structure: A bis(septithiophene) bridged by a fused tetrathiafulvalene (TTF). J. Mater. Chem. 2011, 21, 1462–1469. [Google Scholar] [CrossRef]
- Gambino, S.; Lo, S.C.; Liu, Z.; Burn, P.L.; Samuel, I.D.W. Charge Transport in a Highly Phosphorescent Iridium(III) Complex-Cored Dendrimer with Double Dendrons. Adv. Funct. Mater. 2012, 22, 157–165. [Google Scholar] [CrossRef]
- A development of University of Karlsruhe and Forschungszentrum Karlsruhe GmbH, 1989–2007, TURBOMOLE V7.1. 2012. Available online: http://www.turbomole.com (accessed on 1 November 2021).
- Furche, F.; Ahlrichs, R.; Hättig, C.; Klopper, W.; Sierka, M.; Weigend, F. Turbomole. Wiley Interdiscip. Rev. Comput. Mol. Sci. 2014, 4, 91–100. [Google Scholar] [CrossRef]
- Weigend, F.; Häser, M.; Patzelt, H.; Ahlrichs, R. RI-MP2: Optimized auxiliary basis sets and demonstration of efficiency. Chem. Phys. Lett. 1998, 294, 143–152. [Google Scholar] [CrossRef]
- Guido, C.A.; Brémond, E.; Adamo, C.; Cortona, P. Communication: One third: A new recipe for the PBE0 paradigm. J. Chem. Phys. 2013, 138, 021104. [Google Scholar] [CrossRef] [Green Version]
- Maltese, V.; Cospito, S.; Beneduci, A.; De Simone, B.C.; Russo, N.; Chidichimo, G.; Janssen, R.A.J. Electro-optical Properties of Neutral and Radical Ion Thienosquaraines. Chem. Eur. J. 2016, 22, 10179–10186. [Google Scholar] [CrossRef] [PubMed]
- Chidichimo, G.; De Simone, B.C.; Imbardelli, D.; De Benedittis, M.; Barberio, M.; Ricciardi, L.; Beneduci, A. Influence of oxygen impurities on the electrochromic response of viologen-based plastic films. J. Phys. Chem. C 2014, 118, 13484–13492. [Google Scholar] [CrossRef]


Publisher’s Note: MDPI stays neutral with regard to jurisdictional claims in published maps and institutional affiliations. |
© 2022 by the authors. Licensee MDPI, Basel, Switzerland. This article is an open access article distributed under the terms and conditions of the Creative Commons Attribution (CC BY) license (https://creativecommons.org/licenses/by/4.0/).