Article

Copper(II) Complexes of 5–Fluoro–Salicylaldehyde: Synthesis, Characterization, Antioxidant Properties, Interaction with DNA and Serum Albumins

by
Zisis Papadopoulos
,
Efstratia Doulopoulou
,
Ariadni Zianna
,
Antonios G. Hatzidimitriou
and
George Psomas
*
Laboratory of Inorganic Chemistry, Department of Chemistry, Aristotle University of Thessaloniki, GR-54124 Thessaloniki, Greece
*
Author to whom correspondence should be addressed.
These authors contributed equally to this work.
Molecules 2022, 27(24), 8929; https://doi.org/10.3390/molecules27248929
Submission received: 13 November 2022 / Revised: 10 December 2022 / Accepted: 12 December 2022 / Published: 15 December 2022
(This article belongs to the Special Issue Metal-Based Complex: Preparation and Medicinal Characteristics)

Abstract

:
The synthesis, characterization and biological profile (antioxidant capacity, interaction with calf-thymus DNA and serum albumins) of five neutral copper(II) complexes of 5–fluoro–salicylaldehyde in the absence or presence of the N,N’–donor co–ligands 2,2′–bipyridylamine, 2,9–dimethyl–1,10–phenanthroline, 1,10–phenanthroline and 2,2′–bipyridine are presented herein. The compounds were characterized by physicochemical and spectroscopic techniques. The crystal structures of four complexes were determined by single-crystal X-ray crystallography. The ability of the complexes to scavenge 1,1–diphenyl–picrylhydrazyl and 2,2′–azinobis(3–ethylbenzothiazoline–6–sulfonic acid) radicals and to reduce H2O2 was investigated in order to evaluate their antioxidant activity. The interaction of the compounds with calf-thymus DNA possibly takes place via intercalation as suggested by UV–vis spectroscopy and DNA–viscosity titration studies and via competitive studies with ethidium bromide. The affinity of the complexes with bovine and human serum albumins was examined by fluorescence emission spectroscopy revealing the tight and reversible binding of the complexes with the albumins.

1. Introduction

Nowadays, there is no doubt that we need new drugs to counter viral pandemics, like Covid–19, super-resistant bacteria and drug-resistance for diseases like cancer [1]. After the FDA approved the medicinal administration of cisplatin in 1978, the scientific community has shown great interest in the study of bioactive metal compounds. In the literature, the main interest is focused on the study of compounds with precious and non–endogenous metals, such as platinum, gold and ruthenium. This approach has some disadvantages like the high cost at the production of the drugs and the severe side–effects of their use. A suggestion to overcome these problems is to try using less expensive endogenous metals like copper [1].
Copper is the third most abundant transition metal in the human body. It is also present in every aerobic organism. Copper is found in significant concentrations in ceruloplasmin and superoxide dismutase, which provides organisms with protection against free radicals and inflammation [2,3,4]. Inspired by nature, researchers have focused on copper complexes such as SOD-mimics, radical scavengers and anti-inflammatory agents [5,6]. On the other hand, because of the low redox potential between Cu(I) and Cu(II), copper complexes can induce cell death via the generation of reactive oxygen species (ROS) and act as artificial nucleases. This behavior is very useful to create compounds with antimicrobial [7], antiviral [8], anti-Alzheimer [9] and anticancer activity [10,11]. A good example of a copper compound is the anticancer drug Casiopeinas®, which is at the stage of clinical trials. Casiopeinas® contains a mixture of copper complexes with (O–O) and (N–N) ligands and is believed to induce apoptosis via binding and oxidative damage to DNA [12].
Salicylaldehyde (saloH) is a natural product with oily pale–yellow color, bitter almond odor and is an ingredient of defensive secretions of some leaf beetle species [13]. Salicylaldehyde and its derivatives present interesting antimicrobial properties [14,15]. Coordination of substituted salicylaldehydes (X–saloH) on a metal may provide a wide range of biological activities to these compounds, such as DNA interaction, albumin binding, cytotoxicity, antimicrobial activity and radical scavenging ability [16,17,18,19,20,21,22,23,24,25,26]. The current research is focused on the characterization and the evaluation of the biological activity of a series of copper(II) complexes of 5–fluoro–salicylaldehyde (5–F–saloH, Figure 1A). Recent studies showed that the palladium(II) complex of 5–fluoro–salicylaldehyde presented interesting biological activity [21]. Furthermore, the choice of copper(II) was based on its versatile biological role and recent reports concerning Cu(II) with substituted salicylaldehydes, which exhibited enhanced biological profiles [15,25,26].
In the context of our ongoing research regarding metal complexes with substituted salicylaldehydes [17,18,19,20,21,22,23,24,25,26], five novel neutral copper(II) complexes of 5–F–saloH were synthesized in the absence or presence of the N,N’–donor co-ligands 2,2′–bipyridylamine (bipyam), 2,9–dimethyl–1,10–phenanthroline (neoc), 1,10–phenanthroline (phen) and 2,2′–bipyridine (bipy) (Figure 1). The complexes are formulated as [Cu(5–F–salo)2] (complex 1), [Cu(5–F–salo)(bipyam)Cl] (complex 2), [Cu(5–F–salo)(neoc)Cl].CH3OH (complex 3), [Cu(5–F–salo)(phen)(NO3)] (complex 4) and [Cu(5–F–salo)(bipy)(NO3)] (complex 5), and were characterized by physicochemical and spectroscopic techniques, and single–crystal X-ray crystallography (the crystal structures of complexes 14 were determined). The evaluation of the biological properties of the compounds involves: (i) the potential antioxidant activity focused on the ability to scavenge 1,1–diphenyl–picrylhydrazyl (DPPH), 2,2′–azinobis(3–ethylbenzothiazoline–6–sulfonic acid) (ABTS) free radicals and to reduce H2O2, (ii) the interaction with calf-thymus (CT) DNA investigated in vitro by UV–vis spectroscopy, by viscosity measurements and via evaluating their ability to displace ethidium bromide (EB) from the DNA–EB conjugate, and (iii) the in vitro affinity for human serum albumin (HSA) and bovine serum albumin (BSA) was monitored by fluorescence emission spectroscopy.

2. Results and Discussion

2.1. Synthesis and Characterization

All complexes were prepared in high yields in methanolic solutions. Complex 1 was prepared from the reaction of Cu(NO3)2∙3H2O with deprotonated 5–fluoro–salicylaldehyde in a 1:2 ratio. The reaction of methanolic solutions of Cu(II) salts with deprotonated 5–fluoro–salicylaldehyde in the presence of the a–diimines bipyam, neoc, phen or bipy in a 1:1:1 ratio led to the formation of complexes 25, respectively. Evidence of the coordination mode of the ligands in the complexes has also arisen from the interpretation of their IR and UV–vis spectra. The crystal structures of complexes 14 were further verified by single–crystal X-ray diffraction analysis.
All complexes are soluble in DMF and DMSO, but insoluble in most organic solvents and H2O. Molar conductivity measurements have shown that complexes 15 are non–electrolytes in DMSO solution, since the values of the ΛM of the complexes in 1 mM DMSO solution were found in the range 8–12 mho∙cm2∙mol−1 [27].
The coordination of the ligands to the copper(II) ion may be confirmed by IR spectroscopy. More specifically, the broad band at 3227 cm−1 and the sharp one at 1381 cm−1, originating from the stretching and the bending vibration, respectively, of the O–H group of free 5–F–saloH, did not appear in the IR spectra of all complexes (Figure S1), confirming the successful deprotonation of the phenolate group. In addition, the shift of the band at 1271 cm−1 assigned to v(Car–Ohydroxo) in the spectra of complexes may indicate the binding via the phenolato oxygen to Cu(II). The coordination of the aldehydo oxygen can be confirmed by the shift of the band at 1663 cm−1 to lower wavenumbers. These features reveal the bidentate coordination of the 5–F–salo ligands to Cu(II) ion. The coexistence and the coordination of the N,N’–donors bipyam, neoc, phen and bipy may be detected by the bands at 755 cm−1, 732 cm−1, 722 cm−1 and 767 cm−1, respectively, which may be attributed to the out-of-plane vibration ρ(Car–H) that is characteristic for each co-ligand [28]. For complexes 4 and 5, the coordination of the NO3 ligand is denoted by the presence of two characteristic vibrations at 1315 cm−1 and 1422–1428 cm−1 which are attributed to the symmetric (vs) and the asymmetric (va) stretching vibration, respectively. The magnitude of the splitting parameter Δ (Δ = va − vs) is ~110 cm−1 and is typical of monodentate coordination (M–O–NO2) of nitrato ligands [29]. The suggestions from the IR spectroscopy are in good agreement with the structures determined by X-ray crystallography.
The UV–vis spectra of the complexes were recorded as nujol mull (corresponding to the solid state) and in DMSO (Figure S2) or buffer solutions used in biological experiments (150 mM NaCl and 15 mM trisodium citrate at pH values regulated in the range 6–8 by HCl solution). The spectra in nujol and DMSO did not show any appreciable differences, suggesting that the complexes keep their structure in solution [17]. In the visible region, one band appeared with λmax in the range 625–750 nm which is typical for geometries expected for tetra- and penta-coordinated copper(II) complexes [30,31].

2.2. Structures of the Complexes

Single–crystals of complexes 14 suitable for determination of the structure by X-ray crystallography were obtained. X-ray crystallography details for complexes 14 are summarized in Table 1. For complex 5, where single–crystals were not isolated, the structure is proposed on the basis of spectroscopic data and in comparison with the literature.

2.2.1. Description of the Structure of Complex 1

The molecular structure of complex 1 is illustrated in Figure 2 and selected bond lengths and bond angles are given in Table 2. Complex 1 crystallized in an orthorhombic system and Pca21 space group.
Complex 1 is a neutral mononuclear complex containing two deprotonated 5–F–salo ligands which are bound in a chelating bidentate mode to Cu(II) ion via the phenolato and the carbonyl oxygen atoms lying in trans positions. A square planar geometry around the four-coordinate copper(II) ion may be suggested based on the value of 1.71° calculated for tetrahedrality (i.e., the dihedral angle of planes formed by atoms O1, Cu1, O2 and O3, Cu1, O4, respectively; it is 0°, for strictly square planar complexes with D4h symmetry, and 90° for tetrahedral complexes with D2d symmetry [32]) and the values of the tetrahedral indices τ4 = (360° − (α + β))/(360° − 2 × 109.5°) = 0.02 [33] and τ’4 = ((β − α)/(360° − 109.5°)) + ((180° − β)/(180° − 109.5°)) = 0.03 [34], where β > α are the largest angles of the coordination sphere. The deviation of Cu(II) ion from the mean O4-plane is found to be 0.008 Å.
As expected, the Cu–Ophenolato lengths (1.897 (9)–1.902 (9) Å) are shorter than the Cu–Oaldehyde (1.928 (5)−1.932 (4) Å) lengths [17,25,26]. Complex 1 is similar to analogous square planar copper(II) complexes with X–salo ligands found in the literature [17,35,36].

2.2.2. Description of the Structures of Complexes 24

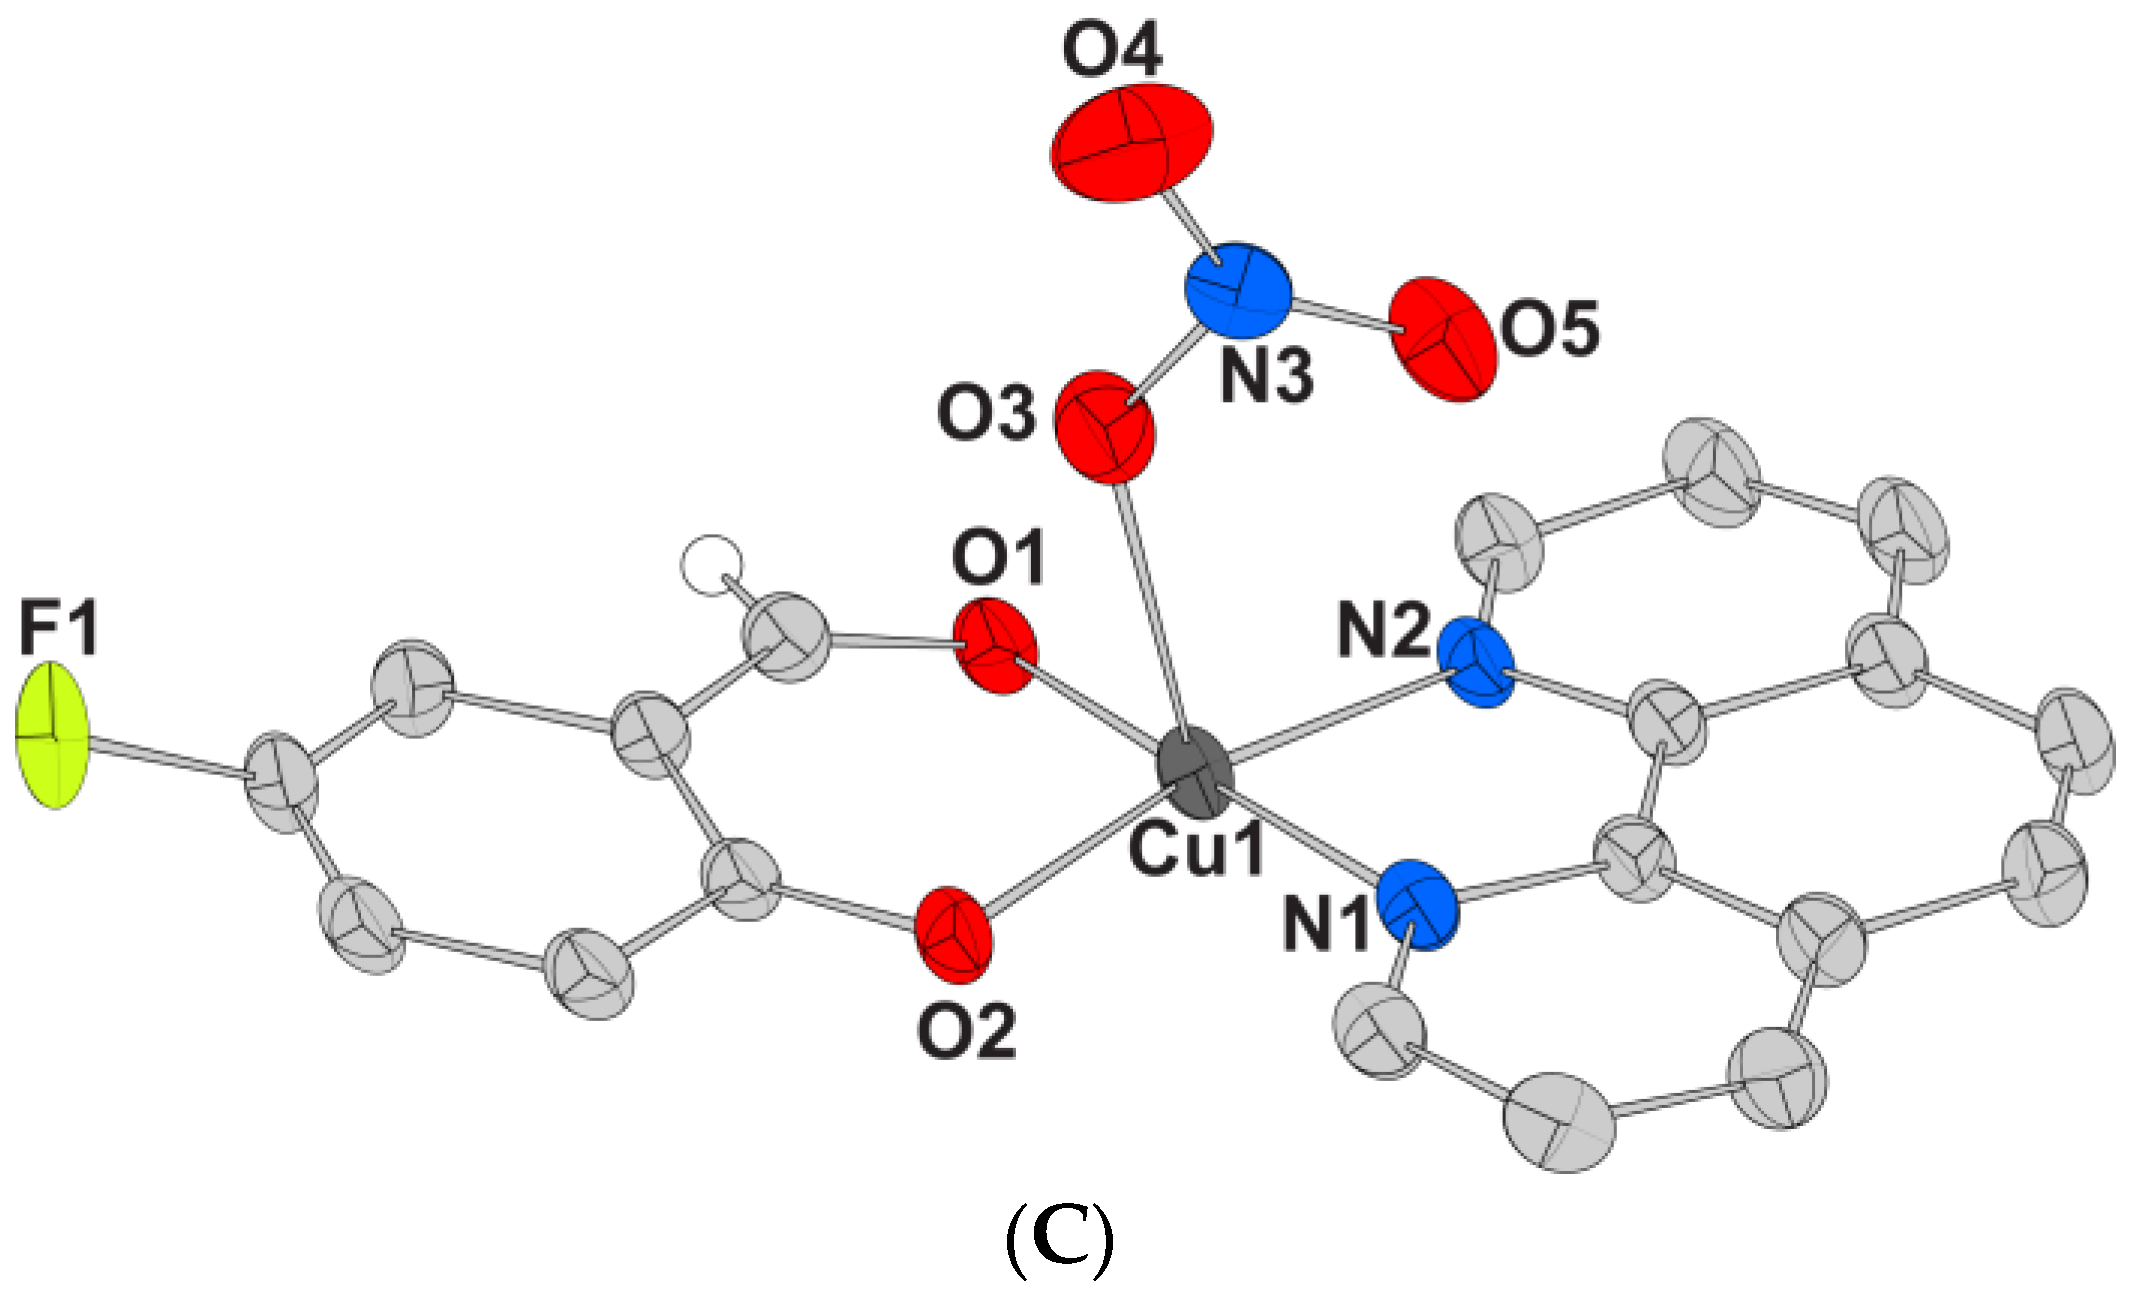
The structures of complexes 24 present similarities and differences and will be discussed together. The molecular structures of the complexes are illustrated in Figure 3 and selected bond lengths and bond angles are summarized in Table 3. Complexes 2 and 3 crystallized in a monoclinic system and P21/n space group and complex 4 crystallized in a triclinic system and P–1 space group.
Complexes 24 are all neutral mononuclear Cu(II) complexes, having a deprotonated bidentate chelating 5–F–salo ligand coordinated to Cu(II) ion via its two oxygen atoms, a bidentate α–diimine (bipyam, neoc or phen) ligand coordinated via its two nitrogen atoms and a chlorido (in complexes 2 and 3) or nitrato ligand (in complex 4) completing the coordination sphere. A distorted square pyramidal geometry around the five–coordinated Cu(I) ions in complexes 24 may be derived via the values of 0.11–0.27 (Table 3) for the trigonality index τ5 [37], and the values of 0.79–0.92 (Table 3) for the tetragonality T5 [38]. The arrangement of the ligand atoms around Cu1 is not similar for all complexes: in complexes 2 and 4, O1, O2, N1 and N2 form the basal plane and Cl1 and O3(nitrato), respectively, are lying in the apical position, while in complex 3, O1, O2, N1 and Cl1 atoms constitute the vertices of the base and N2 is on the apex.
In addition, hydrogen-bonding interactions were observed in complex 3 between the solvate methanol and O2 atom (O3—H52 = 0.82 Å, H52···O2iv = 2.54 Å, O3···O2iv = 3.346(10) Å, O—H52···O2iv = 170° and O4—H241 = 0.82 Å, H241···O2iv = 2.23 Å, O4···O2iv = 3.052(10) Å, O4—H241···O2iv = 180°, symmetry code: (iv) = x + 1/2, − y + 1/2, z − 1/2).

2.2.3. Proposed Structure for Complex 5

According to the findings of the IR and UV–vis spectroscopic data, elemental analysis and molar conductivity measurements, and after the comparison with the crystal structures of complexes 24 and with those of similar mixed-ligand copper(II) complexes found in the literature [17,39,40], we suggest that complex 5 is a mononuclear and neutral complex presenting distorted square pyramidal geometry around the penta-coordinated copper(II) ion. The 5–F–salo ligand is expected to bind in a bidentate manner to Cu(II) through the carbonyl and phenolato oxygen atoms, bipy is coordinated to Cu(II) ion through its nitrogen atoms while an oxygen atom of the monodentate nitrato ligand completes the coordination sphere.

2.3. Study of the Antioxidant Activity

Generally, antioxidants found mainly in food are rich in organic compounds (phenolic, hydroxyphenolic and hydroxycinnamic acids, flavones and flavonoids, etc.). The carboxylic groups in these acids or a near hydroxyl group and an oxo group for flavonoids and flavones enable them to coordinate to metal ions through their oxygen atoms leading to the formation of stable complexes. The combination of the redox properties of metal ions with such ligands is an interesting method to develop antioxidant compounds [41].
For the above reasons, the antioxidant ability of 5–F–saloH and Cu(II) complexes 1–5 has been evaluated via their scavenging activity towards DPPH and ABTS radicals, as well as the ability to reduce H2O2, and in comparison with that of well-known antioxidant agents such as nordihydroguaiaretic acid (NDGA), butylated hydroxytoluene (ΒHΤ), 6–hydroxy–2,5,7,8–tetramethylchromane–2–carboxylic acid (trolox) and L–ascorbic acid (these are the most commonly used standard reference antioxidant agents [42,43,44]). The results are summarized in Table 4. The DPPH-radical assay was developed in the 1950s [45] and this method has been used to assess the antioxidant capacity of several metal complexes [41]. The DPPH–scavenging ability of compounds has often been related to their ability to prevent ageing, cancer and inflammation [46]. The ability of a compound to scavenge the cationic ABTS radicals (ABTS+●) has been considered a measure of its total antioxidant activity [46]. Further, hydrogen peroxide has the ability to penetrate biological membranes and, although it is not very reactive itself, it can sometimes be toxic since it may give rise to hydroxyl radicals in cells. For this reason, the removal of H2O2 is very important for the protection of living systems [47]. When a compound is incubated with H2O2 using a peroxidase assay system, the loss of H2O2 can be measured [48].
Complexes 15 presented a low ability to scavenge DPPH and were found significantly less active than the reference compounds NDGA and BHT. The DPPH–scavenging ability of most complexes was found similar when incubated for 30 and for 60 min, so time did not seem to improve their action, except for complex 3 which presented enhanced DPPH–scavenging activity over time. Almost all complexes 15 can scavenge ABTS radicals more effectively than 5–F–saloH, but they are significantly less active than the reference compound trolox. Complex 1 was proved to be a much more active ABTS–scavenger (ABTS = 78.89 ± 0.18%) than the other complexes. Most complexes presented higher ability to reduce H2O2 than the reference compound L–ascorbic acid with complex 2 being the most active compound (H2O2% = 99.69 ± 0.29%). On average, complexes 1–5 presented similar or lower antioxidant activity when compared to other metal complexes with substituted salicylaldehydes as ligands [19,20,21,22].

2.4. Interaction of the Complexes with CT DNA

The interaction of the complexes with CT DNA was studied by UV–vis spectroscopy, viscosity measurements and via competitive studies with ethidium bromide. UV–vis spectroscopy may be considered a preliminary method for the study of the complexes with CT DNA, while viscosity measurements and competitive studies with EB were used to give more insight about the mode of interaction of the complexes with CT DNA, as metal complexes may interact by more than one way with DNA. In covalent binding, DNA–base nitrogen may be coordinated to metal ions after displacing at least one labile ligand of the complex. In the case of non-covalent interactions, the metal complexes interact with DNA via weak interactions: (i) π–π stacking interactions of the complexes between DNA base pairs (resulting in intercalation), (ii) Coulomb forces leading to electrostatic interaction outside of the helix, and (iii) van der Waals forces (hydrogen bonding, hydrophobic interactions) upon groove-binding [49].
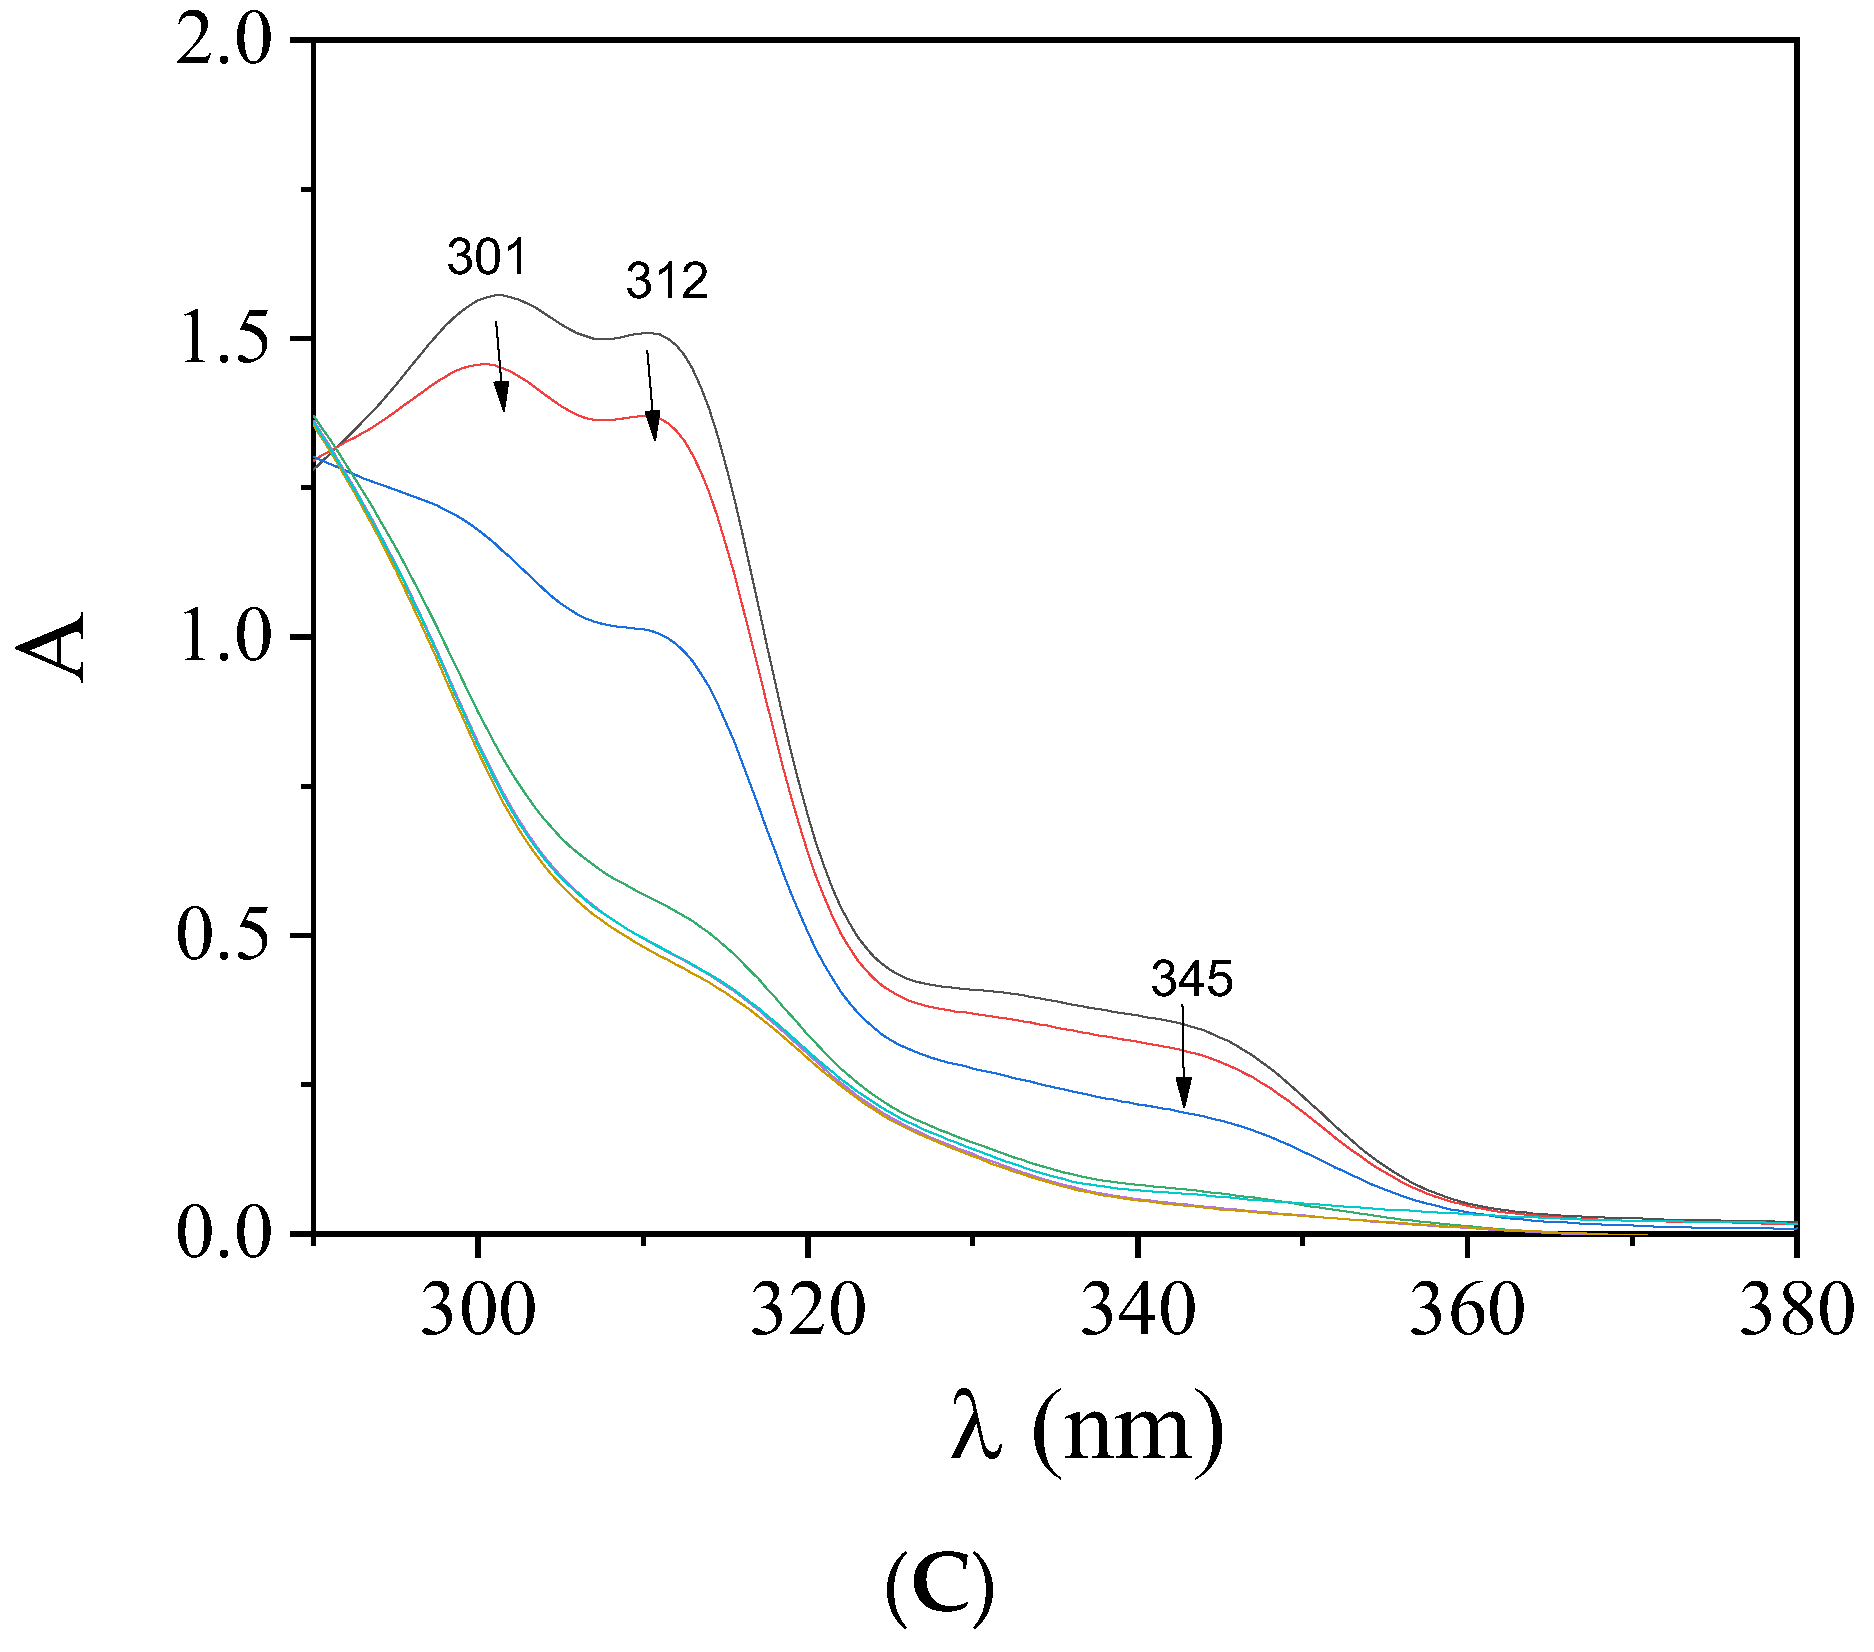
Initially, the UV–vis spectra of complexes 15 (2.5 × 10⁻⁵ – 1 × 10⁻⁴ M) were recorded in the presence of incremental amounts of CT DNA (Figure 4), and the changes of the λmax of the bands observed in the spectra of the complexes were monitored as a means to study the interaction between complexes and CT DNA [50] and to calculate the corresponding DNA-binding constants (Kb). As observed, in the UV–vis spectra of the complexes, at least two bands were observed: band I in the range 314–339 nm and band II in the region 380–428 nm. Upon addition of the CT DNA solution, band I exhibited a significant hypochromism, and band II a rather intense hyperchromism which was mainly accompanied by a red-shift (Table 5). These features indicate the interaction of the complexes with CT DNA [51], but may not provide sufficient information to reveal the possible interaction mode. Therefore, for the elucidation of the CT DNA interaction mode, further experiments involving DNA-viscosity measurements and competitive studies with EB were performed.
The Kb values of compounds were calculated with the Wolfe–Shimer equation (Equation (S1)) [52] and the respective plots [DNA]/(εA − εf) versus [DNA] revealed a tight interaction with CT DNA. The Kb values of complexes 15 (Table 5) were relatively high (in the order of 105–106 M−1), with complex 1 showing the highest Kb constant (=2.37 (±0.07) × 106 M−1) among them and, in most cases, they are higher than the Kb value of the typical intercalator EB (=1.23 (±0.07) × 105 M−1) [53]. The Kb values of the compounds under study are lying in the range found for analogous metal complexes of X–saloH [17,18,19,20,21,22,23,24,25,26].
The viscosity of DNA is related to the length changes occurring when interacting with a compound [54]. For this study, the viscosity of a CT DNA solution (0.1 mM) was monitored in the presence of increasing amounts (up to r = [compound]/[DNA] = 0.36) of the compounds at room temperature. All complexes 15 induced an increase in the relative DNA viscosity (Figure 5), which was higher in the case of complex 5. This increase is considered evidence of an intercalative binding mode to DNA, since the DNA viscosity increases because of an increase in the separation distances between DNA bases in order to provide the necessary space for the accommodation of the intercalating compound [54].
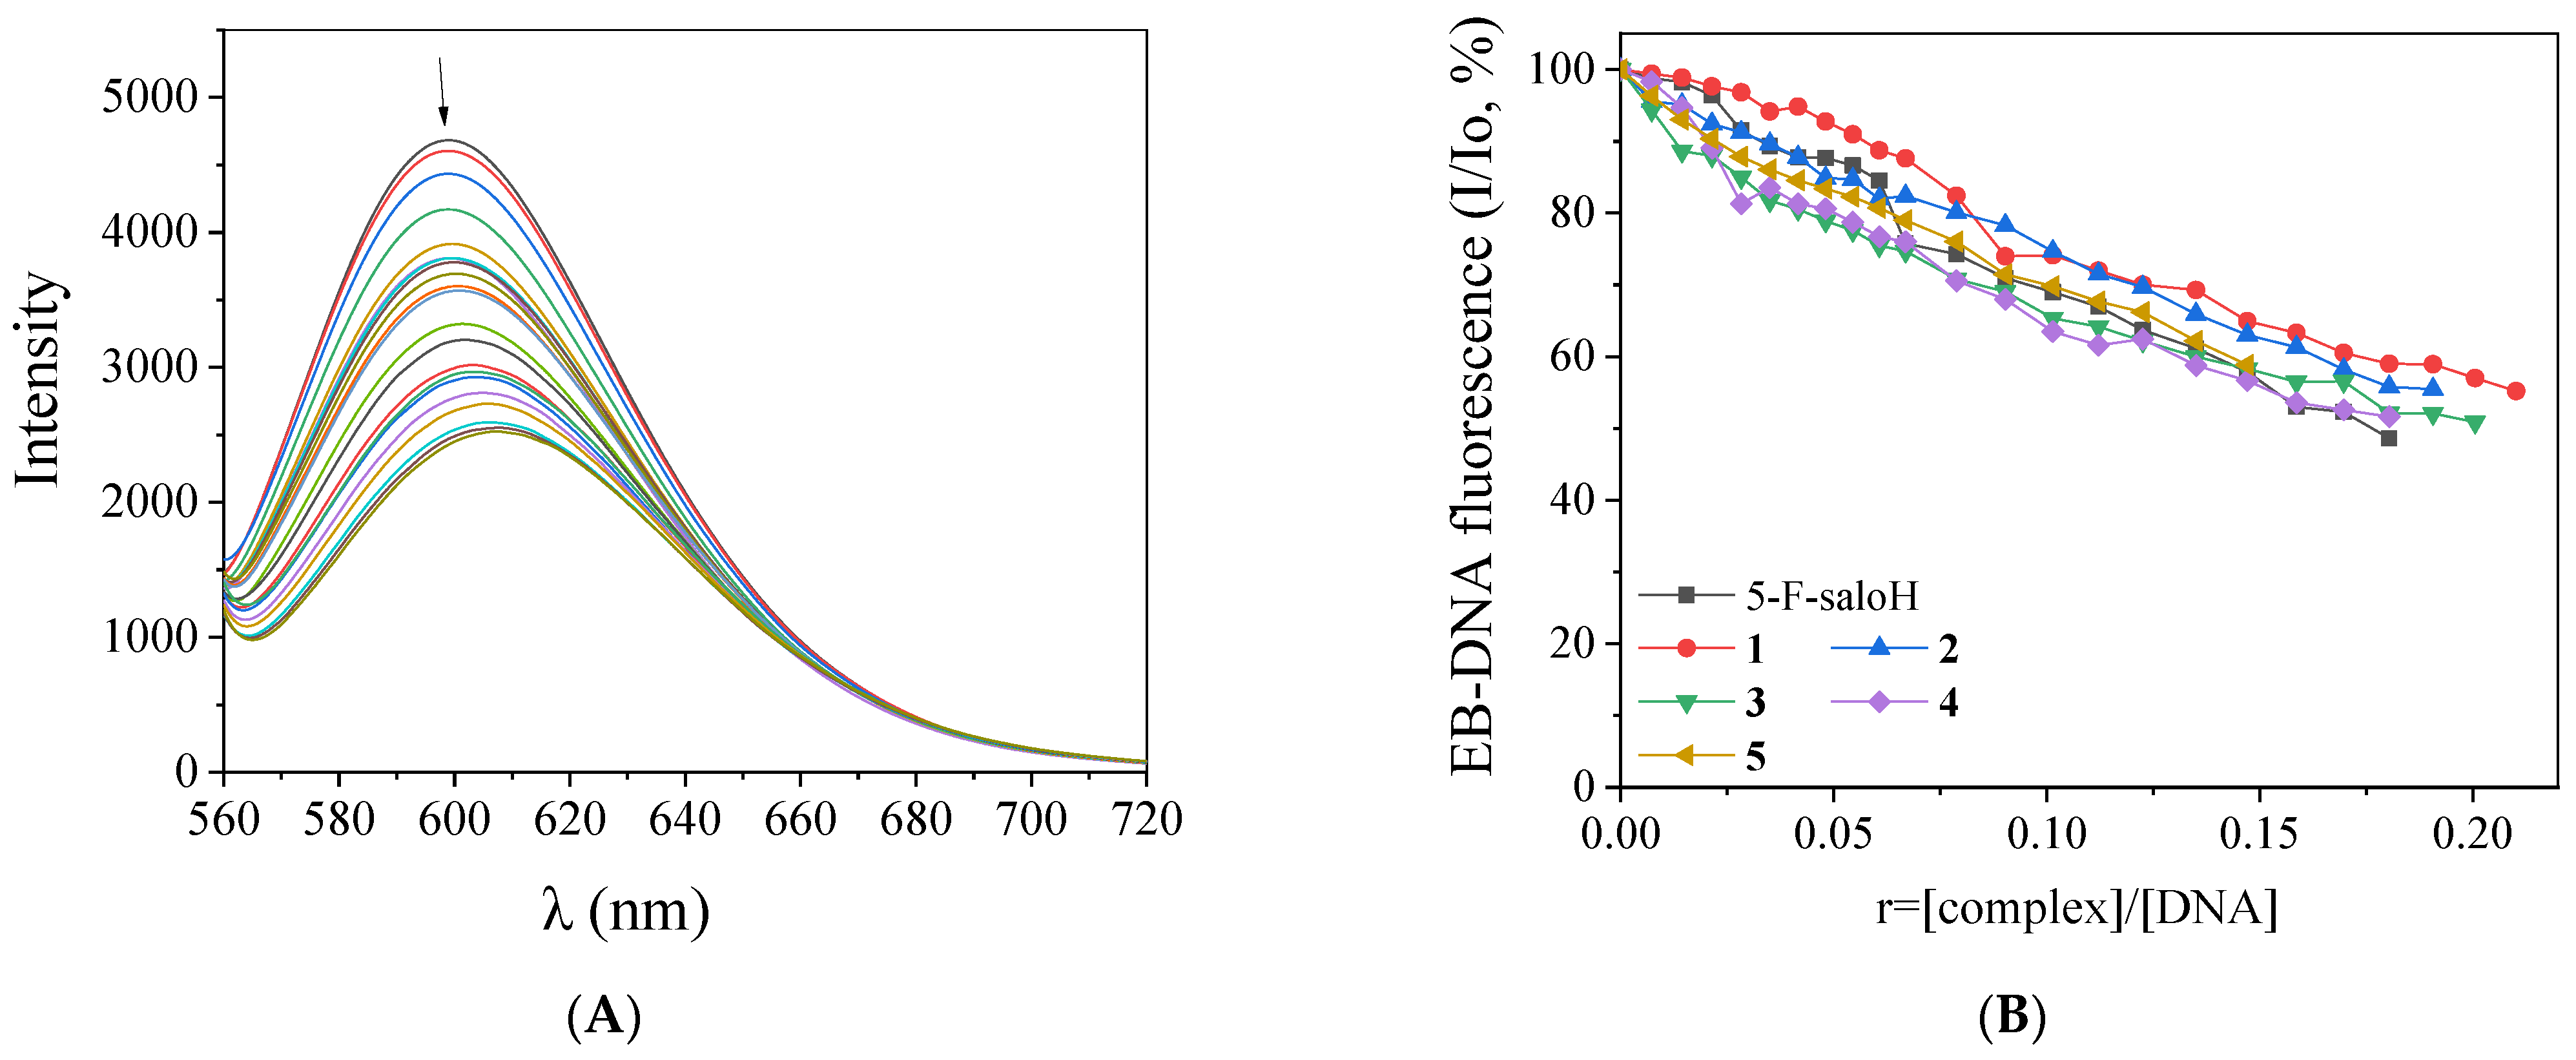
EB is a well-known indicator of DNA intercalation, since its insertion in-between adjacent DNA base pairs may lead to the development of effective π–π stacking interactions. A solution containing the EB–DNA adduct presents an intense fluorescence emission band at 592 nm when excited at λex = 540 nm [55]. The addition of a compound intercalating to DNA equally or more tightly than EB into this solution may induce changes to the emission band which are monitored, in order to gain insight into its competition with EB for the DNA intercalation site. The compounds under study do not present any fluorescence emission bands at RT in solution or in the presence of CT DNA or EB under the same experimental conditions; so, any changes observed in the fluorescence emission spectra of the EB–DNA solution, when the compounds are added, are useful to examine the EB–displacing ability of the complexes, as indirect evidence of their intercalating ability [55,56].
The fluorescence emission spectra of pretreated EB–DNA ([EB] = 20 µM, [DNA] = 26 µM) were recorded in the presence of increasing amounts of the complexes (representatively shown for complex 1 in Figure 6A). The addition of the complexes resulted in a significant decrease in the intensity of fluorescence emission band of the DNA–EB compound at 592 nm (Figure 6B), with complex 5 inducing the highest quenching (Table 6). The complexes present significant ability to displace EB from the EB–DNA adduct, as it can be deducted from the observed quenching, and it can be indirectly suggested that the complexes interact with CT DNA via intercalation [56].
The Stern–Volmer (KSV) constants (Table 6) of the complexes were calculated with the Stern–Volmer equation (Equation (S2)) and Stern–Volmer plots. The KSV values are relatively high (of the 10−4–10−5 M−1 magnitude), indicating a tight binding to CT DNA. Among the complexes, complex 1 exhibits the highest KSV constant (=1.56 (±0.02) × 105 M−1). The EB–DNA quenching constants (kq) of the compounds (Table 6) were calculated with Equation (S3) (considering τo = 23 ns as the EB–DNA fluorescence lifetime [57]); the kq values are higher than 1010 M−1 s−1 [56], proposing the existence of a static quenching mechanism [21], which may confirm the interaction with the fluorophore and the displacement of EB.

2.5. Study of the Interaction with Serum Albumins

Serum albumins are among the important proteins of the circulatory system. Their main role is to carry drugs and other bioactive small molecules through the bloodstream [58,59]. BSA and HSA are structurally homologous albumins, having two and one tryptophan residues, respectively [60]. The tryptophan residues of both albumins are responsible for the intense fluorescence emission band with λem,max = 342 nm for BSA and 350 nm for HSA, respectively, when their solutions are excited at 295 nm [55]. The solutions of the complexes exhibited a maximum emission in the region 395–415 nm under the same experimental conditions and the SA-fluorescence emission spectra were corrected before the calculation processing. The inner-filter effect was calculated with Equation (S4) [61] and it was found too low to affect the measurements.
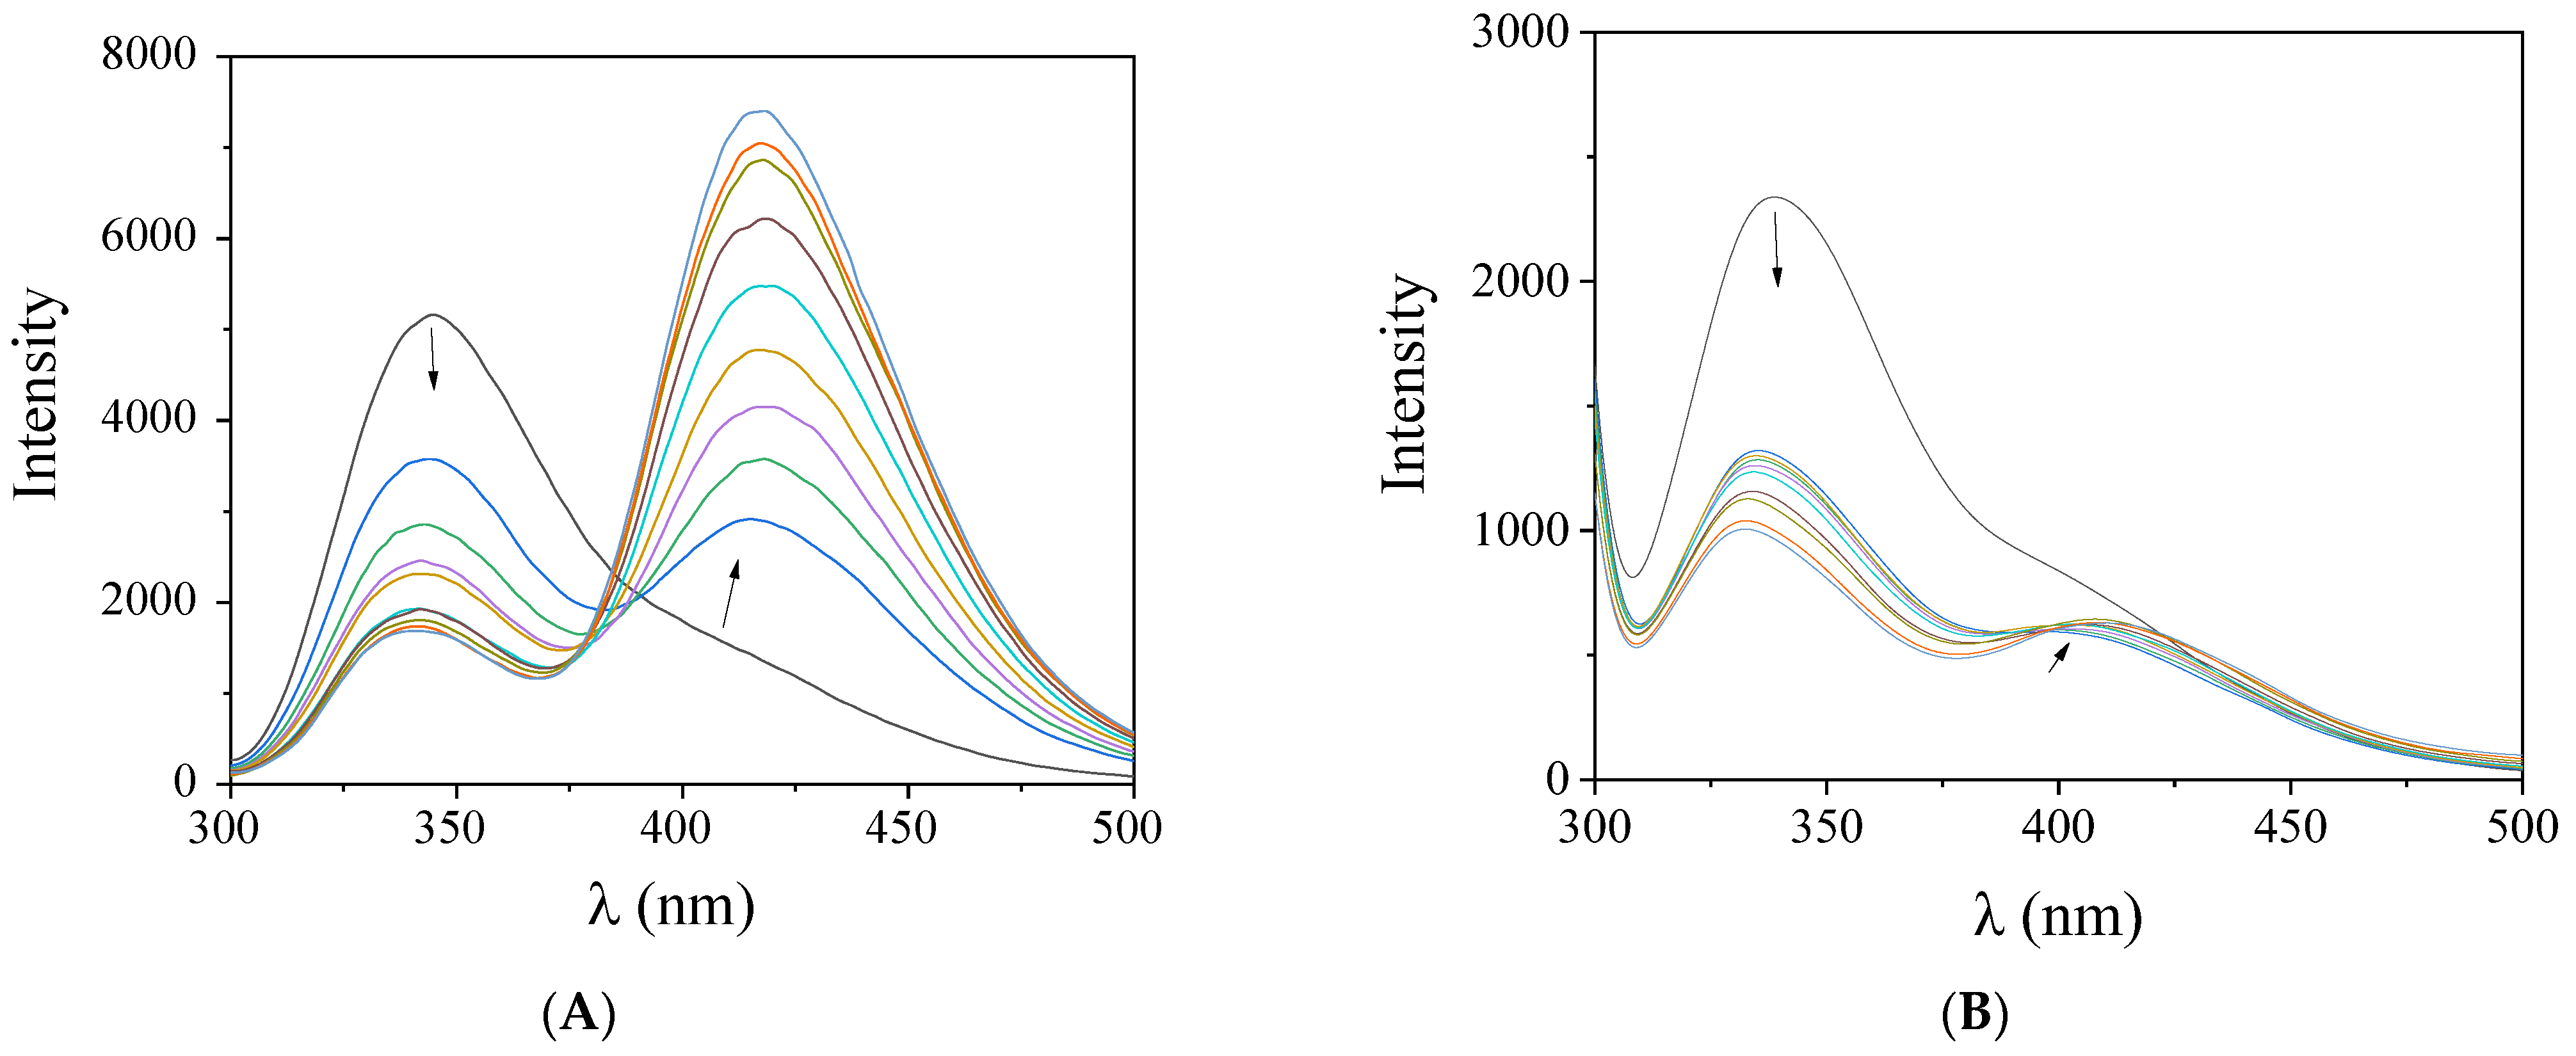
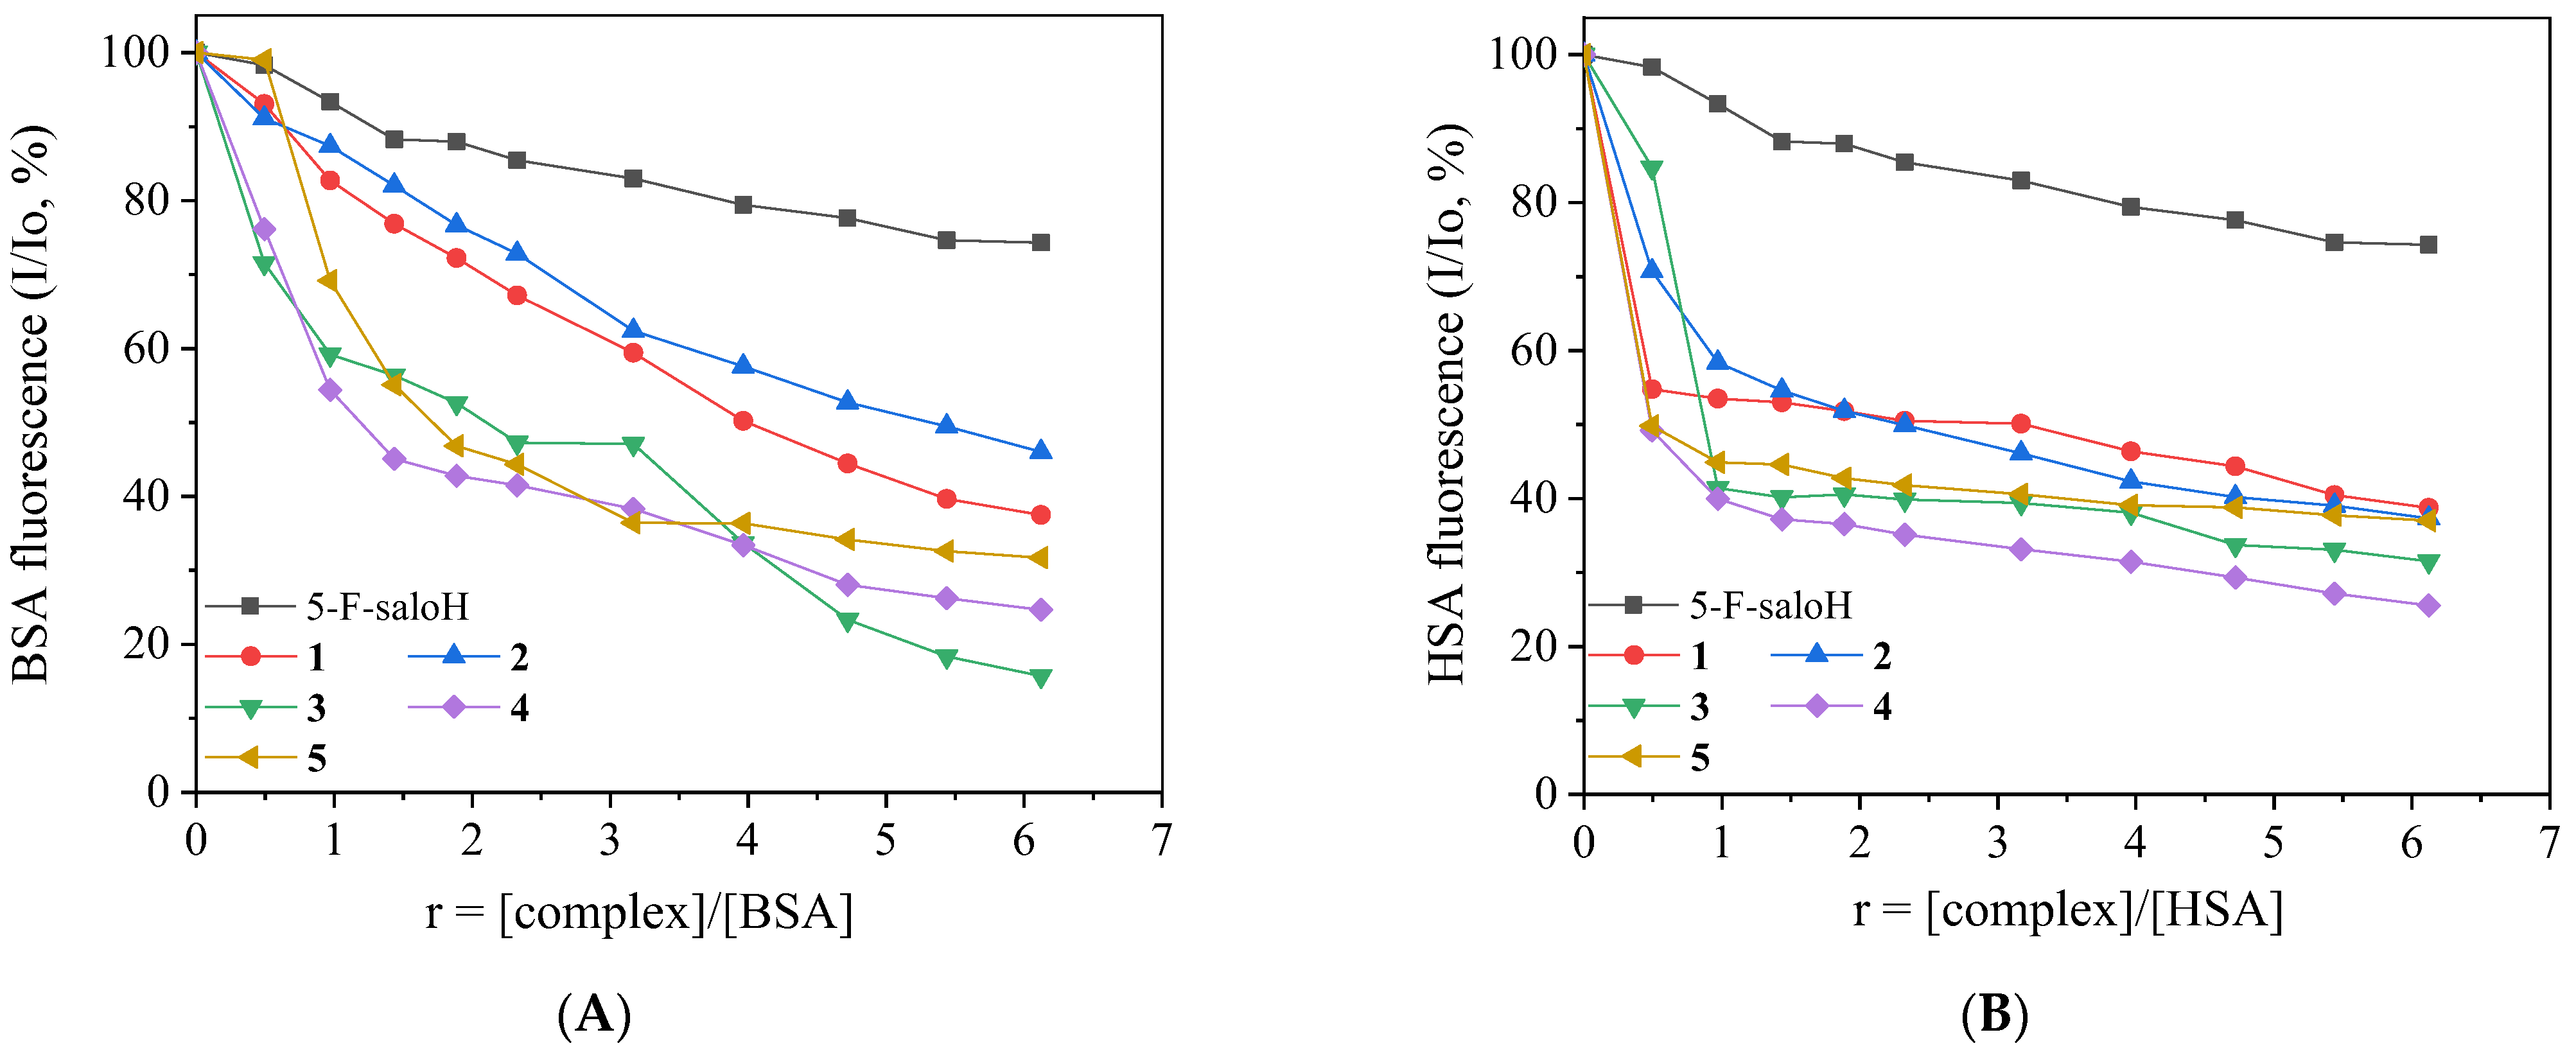
When the compounds were added to a solution of the albumins (3 μM), a significant quenching of the BSA (λem = 342 nm) and HSA (λem = 350 nm) fluorescence emission bands was observed (Figure 7) which was more pronounced in the case of BSA (Table 7 and Figure 8). The appearance of a second emission with band λmax,em in the region 395–415 nm was attributed to the compound and, in many cases, resulted in the existence of an iso-emissive point at ~385–390 nm (Figure 7). The observed quenching may be ascribed to changes in the tryptophan environment of SA resulting from possible denaturation of their secondary structure, induced by the binding of the complexes to the albumins [62].
The SA-quenching constants (kq) for complexes 15 (Table 7) (calculated from the corresponding Stern–Volmer plots with the Stern–Volmer quenching equation (Equation (S2) and (S3)) are much higher than 1010 M−1 s−1, indicating the existence of a static quenching mechanism [56] which may indirectly verify the interaction of the compounds with the albumins. The kq constants of complexes 15 are similar to those reported for similar Pd(II) and other metal complexes with substituted salicylaldehydes as ligands [12,13,20,21,22,23,24,25,26,27].
The SA-binding constants (K) of the complexes (calculated from the corresponding Scatchard plots with the Scatchard equation (Equation (S5)) (Table 7) are relatively high suggesting a tight interaction of the compounds with the albumins in order to be transported towards their potential biological targets. Furthermore, the K values are significantly lower than the value of 1015 M−1 (which is the binding constant with avidin and it is considered as the limit between reversible and irreversible interactions), suggesting a rather reversible interaction of the compounds with the albumins and revealing their ability to get released when they approach their desired destinations [63].

3. Materials and Methods

3.1. Materials—Instrumentation—Physical Measurements

All chemicals and solvents were reagent grade and were used as purchased from commercial sources: 5–F–saloH, Cu(NO3)2∙3H2O, CuCl2∙2H2O, CH3ONa, trisodium citrate, NaCl, BSA, HSA, CT DNA, EB, ABTS, K2S2O8, NaH2PO4, NDGA and ΒHΤ were purchased from Sigma–Aldrich Co; trolox from J&K; DPPH from TCI; L–ascorbic acid and all solvents from Chemlab.
Infrared (IR) spectra (400–4000 cm−1) were recorded on a Nicolet FT–IR 6700 spectrometer with samples prepared as KBr pellets (abbreviations used: s = strong, sm = strong-to-medium, and m = medium). UV–visible (UV–vis) spectra were recorded as nujol mulls and in DMSO solutions at concentrations in the range 2 × 10⁻⁵–5 × 10⁻³ M on a Hitachi U-2001 dual-beam spectrophotometer. C, H and N elemental analyses were performed on a PerkinElmer 240B elemental microanalyzer. Molecular conductivity measurements of 1 mM DMSO solutions of the complexes were carried out with a Crison Basic 30 conductometer. Fluorescence spectra were recorded in solution on a Hitachi F-7000 fluorescence spectrophotometer. Viscosity experiments were carried out using an ALPHA L Fungilab rotational viscometer equipped with an 18 mL LCP spindle and the measurements were performed at 100 rpm.
DNA stock solution was prepared by dilution of CT DNA with buffer (containing 150 mM NaCl and 15 mM trisodium citrate at pH 7.0) and kept at 4 °C for no longer than a week. The stock solution of CT DNA gave a ratio of UV absorbance at 260 and 280 nm (A260/A280) of 1.88, indicating that the DNA was sufficiently free of protein contamination [64]. The DNA concentration per nucleotide was determined by the UV absorbance at 260 nm after 1:20 dilution using ε = 6600 M−1 cm−1 [65].

3.2. Synthesis of the Complexes

3.2.1. Synthesis of Complex [Cu(5–F–salo)2], 1

Complex 1 was prepared according to the previously published procedure [66]. More specifically, the complex was synthesized by the addition of a methanolic solution (5 mL) of 5–F–saloH (1 mmol, 140 mg), deprotonated by CH3ONa (1 mmol, 54 mg) into a methanolic solution (5 mL) of Cu(NO3)2∙3H2O (0.5 mmol, 121 mg) at room temperature (RT). The reaction mixture was stirred for 1 h, filtered off and left to slowly evaporate. After a few days, green yellow single-crystals of complex 1 (100 mg, yield: 58%), suitable for X-ray determination were obtained. Elemental analysis: calculated for [Cu(5–F–salo)2], (C14H8CuF2O4) (MW = 341.76): C, 49.20; H, 2.36%; found: C, 49.15; H, 2.42%. IR spectrum (KBr), selected peaks (in cm−1): 1641(s), v(C=O); 1318 (sm), v(C–O → Cu); UV–vis: as nujol mull, λ/nm: 398, 695; in DMSO, λ/nm (ε/Μ−1 cm−1): 320 (7000), 398 (8500), 690 (85). ΛM (in 1 mM DMSO solution) = 8 mho∙cm2∙mol−1. The complex was soluble in DMSO and DMF.

3.2.2. Synthesis of Complexes 25

The reaction of a methanolic solution of a copper(II) salt (CuCl2∙2H2O or Cu(NO3)2∙3H2O) (0.5 mmol) with 5–F–saloH (0.5 mmol, deprotonated by CH3ONa) in the presence of a methanolic solution (5 mL) of an α–diimine (bipyam, bipy, neoc or phen) (0.5 mmol) yielded complexes 25. The procedure was completed by filtration and slow evaporation and afforded single-crystals for complexes 24 and microcrystalline product for complex 5.
[Cu(5–F–salo)(bipyam)Cl], 2: For the preparation of complex 2, CuCl2∙2H2O (0.5 mmol, 85 mg) was the Cu(II) salt used and bipyam (0.5 mmol, 85 mg) was the corresponding α–diimine. Dark green single-crystals of complex 2 (105 mg, yield: 52%) suitable for X-ray determination were obtained after a week and analyzed as [Cu(5–F–salo)(bipyam)Cl], (C17H13ClCuFN3O2) (MW = 409.31): C, 49.89; H, 3.20; N, 10.27%; found: C, 49.72; H, 3.11; N, 10.15%. IR spectrum (KBr), selected peaks (in cm−1): 1625(s), v(C=O); 1327(m), v(C–O → Cu); 755(m), ρ(C–H)bipyam. UV–vis: as nujol mull, λ/nm: 405, 675 (shoulder (sh)); in DMSO, λ/nm (ε/Μ−1 cm−1): 319 (24460), 401 (3700), 680 (85). ΛM (in 1 mM DMSO solution) = 10 mho∙cm2∙mol−1. The complex is soluble in DMSO and DMF and partially soluble in MeOH.
[Cu(5–F–salo)(neoc)Cl]·CH3OH, 3: For the preparation of complex 3, CuCl2∙2H2O (0.5 mmol, 85 mg) was the Cu(II) salt used and neoc (0.5 mmol, 104 mg) was the corresponding α–diimine. Dark green single-crystals of complex 3 (120 mg, yield: 50%) suitable for X-ray determination were obtained after ten days and analyzed as [Cu(5–F–salo)(neoc)Cl]·CH3OH, (C22H20ClCuFN2O3) (MW = 478.41): C, 55.23; H, 4.21; N, 5.86%; found: C, 55.11; H, 4.13; N, 5.69%. IR spectrum (KBr), selected peaks (in cm−1): 1610(s), v(C=O); 1315(m), v(C–O → Cu); 732(m), ρ(C–H)neoc. UV–vis: as nujol mull, λ/nm: 745; in DMSO, λ/nm (ε/Μ−1 cm−1): 330 (6600), 400 (4000), 750 (85). ΛM (in 1 mM DMSO solution) = 12 mho∙cm2∙mol−1. The complex was soluble in DMSO and DMF and partially soluble in MeOH.
[Cu(5–F–salo)(phen)(NO3)], 4: For the preparation of complex 4, Cu(NO3)2∙3H2O (0.5 mmol, 121 mg) was the Cu(II) salt used and phen (0.5 mmol, 90 mg) was the corresponding α–diimine. Dark green single-crystals of complex 4 (115 mg, yield: 52%) suitable for X-ray determination were obtained after a fortnight and analyzed as [Cu(5–F–salo)(phen)(NO3)], (C19H12CuFN3O5) (MW = 444.87): C, 51.30; H, 2.72; N, 9.45%; found: C, 51.05; H, 2.59; N, 9.33%. IR spectrum (KBr), selected peaks (in cm−1): 1610 (s), v(C=O); 1428 (sm), va(NO3); 1321(m), v(C–O → Cu); 1315 (sm), vs(NO3); 722 (m), ρ(C–H)phen. UV–vis: as nujol mull, λ/nm: 400, 655; in DMSO, λ/nm (ε/Μ−1 cm−1): 295 (sh) (5000), 330 (8700), 403 (3000), 660 (65). ΛM (in 1 mM DMSO solution) = 10 mho∙cm2∙mol−1. The complex was soluble in DMSO and DMF.
[Cu(5–F–salo)(bipy)(NO3)], 5: For the preparation of complex 5, Cu(NO3)2∙3H2O (0.5 mmol, 121 mg) was the Cu(II) salt used and bipy (0.5 mmol, 78 mg) was the corresponding α–diimine. Green microcrystalline product (115 mg, yield: 55%) was precipitated after a few days and analyzed as [Cu(5–F–salo)(bipy)(NO3)], (C17H12CuFN3O5) (MW = 420.84): C, 48.52; H, 2.87; N, 9.98%; found: C, 48.19; H, 2.80; N, 9.73%. IR spectrum (KBr), selected peaks (in cm−1): 1602(s), v(C=O); 1422(s), va(NO3); 1347(m), v(C–O → Cu); 1315 (sm), vs(NO3); 767(m), ρ(C–H)bipy. UV–vis: as nujol mull, λ/nm: 615; in DMSO, λ/nm (ε/Μ−1 cm−1): 312 (15000), 345 (3300), 625 (50). ΛM (in 1 mM DMSO solution) = 12 mho∙cm2∙mol−1. The complex was soluble in DMSO and DMF and partially soluble in MeOH.

3.3. X-ray Crystal Structure Determination

Single-crystals of complexes 14 suitable for crystal structure analysis were obtained by slow evaporation of their mother liquids at RT. They were mounted at room temperature on a Bruker Kappa APEX2 diffractometer equipped with a triumph monochromator using Mo Kα (λ = 0.71073 Å, source operating at 50 kV and 30 mA) radiation. Unit cell dimensions were determined and refined by using the angular settings of at least 200 high intensity reflections (>10σ(I)) in the range 11 < 2 θ < 36°. Intensity data were recorded using φ and ω–scans. All crystals presented no decay during the data collection. The frames collected for each crystal were integrated with the Bruker SAINT Software package [67], using a narrow frame algorithm. Data were corrected for absorption using the numerical method (SADABS) based on crystal dimensions [68]. The structure was solved using the SUPERFLIP package [69], incorporated in Crystals. Data refinement (full-matrix least-squares methods on F2) and all subsequent calculations were carried out using the Crystals version 14.61 build 6236 program package [70]. All non-hydrogen non-disordered atoms were refined anisotropically. For the disordered atoms, their occupation factors under fixed (an)isotropic displacement parameters were first detected. For 3, the methanol solvent molecule is disordered over two positions with site occupation factors of 0.5 each. The same holds for the non-coordinating nitrate oxygen atoms in complex 4. The disordered atom positions in 3 were refined isotropically, but anisotropically in the case of 4.
Hydrogen atoms riding on non-disordered parent atoms were located from difference Fourier maps and refined at idealized positions riding on the parent atoms with isotropic displacement parameters Uiso(H) = 1.2 Ueq(C) or 1.5 Ueq(methyl, -NH and -OH hydrogens) and at distances C--H 0.95 Å, N--H 0.83 Å and O-H 0.82 Å. All methyl, amine and OH hydrogen atoms were allowed to rotate but not to tip. Hydrogen atoms riding on disordered oxygen atoms of methanol solvent molecules were positioned geometrically to fulfill hydrogen bonding demands. The rest of the methyl hydrogen atoms were positioned geometrically to their parent atoms. Illustrations with 50% ellipsoids probability were drawn by CAMERON [71]. Crystallographic data for complexes 14 are presented in Table 1.

3.4. Study of the Biological Profile of the Compounds

The biological activity of the compounds (interaction with CT DNA and albumins, antioxidant activity) was evaluated in vitro after the compounds were dissolved in DMSO (1 mM), due to their low solubility in water. The studies were conducted in the presence of aqueous buffer solutions, where mixing of each solution never exceeded 5% DMSO (v/v) in the final solution. Control experiments were undertaken to assess the effect of DMSO on the data. Minimum or no changes were observed in the spectra of the SAs or CT DNA and appropriate corrections were performed, when needed.
All the protocols and relevant equations regarding the in vitro study of the biological activity (antioxidant activity, interaction with CT DNA, HSA and BSA) of the compounds can be found in the Supporting Information File (Sections S1–S3).

4. Conclusions

A total of five novel Cu(II) complexes of 5–fluoro–salicylaldehyde were synthesized and characterized by diverse techniques. The crystal structures of complexes 14 were determined by single crystal X-ray diffraction analysis, with complex 1 presenting square planar geometry and complexes 24 distorted square pyramidal arrangement of the ligands around Cu(II). 5–fluoro–salicylaldehyde ligands are bound in a bidentate manner to the Cu(II) ion in all complexes, via the carbonyl and phenolato oxygen atoms.
Complexes 15 presented a low ability to scavenge DPPH radicals, moderate ability (with the exception of complex 2) to reduce H2O2, and had significantly high scavenging activity toward ABTS radicals, which was close to that of the reference compound trolox. The interaction of the compounds with CT DNA probably takes place via intercalation, as deduced by UV–vis spectroscopic, viscosity measurements and EB displacement studies, leading to a rather tight DNA binding. Furthermore, the complexes have the ability to interact strongly and reversibly with serum albumins, as well as to get released upon reaching their biotarget(s).
The herein reported results concerning the antioxidant capacity and interaction of the complexes with biomacromolecules are interesting and may lead to more specific biological studies, which could reveal pathways for further biological applications of these types of compounds.

Supplementary Materials

The following supporting information can be downloaded at: https://www.mdpi.com/article/10.3390/molecules27248929/s1. CCDC 2219048–2219051 contain the supplementary crystallographic data for this paper. These data can be obtained free of charge via www.ccdc.cam.ac.uk/conts/retrieving.html (or from the Cambridge Crystallographic Data Centre, 12 Union Road, Cambridge CB21EZ, UK; fax: (+44) 1223–336–033; or [email protected]). Cif and checkcif files for compounds 14. Protocols and equations regarding antioxidant activity assay (S1), binding studies with CT-DNA (S2) and albumin binding studies (S3) [72,73].

Author Contributions

Z.P.: synthesis, characterization, interaction with DNA and albumins, manuscript preparation; E.D.: synthesis, characterization, interaction with DNA and albumins, manuscript preparation; A.Z.: antioxidant activity studies, interaction with DNA and albumins, manuscript preparation; A.G.H.: X-ray structural determination, manuscript preparation; G.P.: supervisor of Z.P., E.D. and A.Z., manuscript preparation and editing, corresponding author, supervisor of the project. All authors have read and agreed to the published version of the manuscript.

Funding

This research received no external funding.

Institutional Review Board Statement

Not applicable.

Informed Consent Statement

Not applicable.

Data Availability Statement

Not applicable.

Conflicts of Interest

The authors declare no conflict of interest.

Sample Availability

Samples of the compounds are available from the authors.

Abbreviations

5–F–saloH = 5–fluoro–salicylaldehyde; ABTS = 2,2′–azinobis(3–ethylbenzothiazoline–6–sulfonic acid; BHT = butylated hydroxytoluene; BSA = bovine serum albumin; CT = calf–thymus; DPPH = 1,1–diphenyl–picrylhydrazyl; EB = ethidium bromide, 3,8–diamino–5–ethyl–6phenyl–phenanthridinium bromide; HSA = human serum albumin; K = SA-binding constant; Kb = DNA-binding constant; kq = quenching constant; KSV = Stern–Volmer constant; NDGA = nordihydroguaiaretic acid; R = [compound]/[DNA] ratio, or [compound]/[SA] ratio; RT = room temperature; SA = serum albumin; saloH = salicylaldehyde; trolox = 6–hydroxy–2,5,7,8–tetramethylchromane–2–carboxylic acid; X–saloH = substituted salicylaldehyde.

References

  1. Romano, S.; Guerreiro, J.P.; Rodrigues, A.T. Drug shortages in community pharmacies: Impact on patients and on the health system. J. Am. Pharm. Assoc. 2022, 62, 791–799. [Google Scholar] [CrossRef] [PubMed]
  2. Balsano, C.; Porcu, C.; Sideri, S. Is copper a new target to counteract the progression of chronic diseases? Metallomics 2018, 10, 1712–1722. [Google Scholar] [CrossRef] [PubMed] [Green Version]
  3. Uauy, R.; Olivares, M.; Gonzalez, M. Essentiality of copper in humans. Am. J. Clin. Nutr. 1998, 67, 952S–959S. [Google Scholar] [CrossRef] [Green Version]
  4. Milanino, R.; Buchner, V. Copper: Role of the ‘Endogenous’ and ‘Exogenous’ Metal on the Development and Control of Inflammatory Processes. Rev. Environ. Health 2006, 21, 153–215. [Google Scholar] [CrossRef] [PubMed]
  5. Psomas, G. Copper(II) and zinc(II) coordination compounds of non-steroidal anti-inflammatory drugs: Structural features and antioxidant activity. Coord. Chem. Rev. 2020, 412, 213259. [Google Scholar] [CrossRef]
  6. Khalid, H.; Hanif, M.; Hashmi, M.; Mahmood, T.; Ayub, K.; Monim-ul-Mehboob, M. Copper Complexes of Bioactive Ligands with Superoxide Dismutase Activity. Mini-Rev. Med. Chem. 2013, 13, 1944–1956. [Google Scholar] [CrossRef] [PubMed]
  7. Zalevskaya, O.A.; Gur’eva, Y.A. Recent Studies on the Antimicrobial Activity of Copper Complexes. Russ. J. Coord. Chem. 2021, 47, 861–880. [Google Scholar] [CrossRef]
  8. McGuire, K.L.; Smit, P.; Ess, D.H.; Hill, J.T.; Harrison, R.G.; Busath, D.D. Mechanism and Kinetics of Copper Complexes Binding to the Influenza A M2 S31N and S31N/G34E Channels. Biophys. J. 2021, 120, 168–177. [Google Scholar] [CrossRef]
  9. Zhang, W.; Huang, D.; Huang, M.; Huang, J.; Wang, D.; Liu, X.; Nguyen, M.; Vendier, L.; Mazères, S.; Robert, A.; et al. Preparation of Tetradentate Copper Chelators as Potential Anti-Alzheimer Agents. ChemMedChem 2018, 13, 684–704. [Google Scholar] [CrossRef]
  10. Leuthauser, S.W.C.; Oberley, L.W.; Oberley, T.D.; Sorenson, J.R.J.; Ramakrishna, K. Antitumor Effect of a Copper Coordination Compound With Superoxide Dismutase-Like Activity. J. Nat. Cancer Inst. 1981, 66, 1077–1081. [Google Scholar] [CrossRef]
  11. Denoyer, D.; Masaldan, S.; La Fontaine, S.; Cater, M.A. Targeting copper in cancer therapy: ‘Copper That Cancer’. Metallomics 2015, 7, 1459. [Google Scholar] [CrossRef] [PubMed]
  12. Rivero-Muller, A.; Vizcaya-Ruiz, A.; Plant, N.; Ruiz, L.; Dobrota, M. Mixed chelate copper complex, Casiopeina IIgly®, binds and degrades nucleic acids: A mechanism of cytotoxicity. Chem.Biol. Interact. 2007, 165, 189–199. [Google Scholar] [CrossRef] [PubMed]
  13. Pauls, G.; Becker, T.; Rahfeld, P.; Gretscher, R.R.; Paetz, C.; Pasteels, J.; von Reuss, S.H.; Burse, A.; Boland, W. Two Defensive Lines in Juvenile Leaf Beetles; Esters of 3-nitropropionic Acid in the Hemolymph and Aposematic Warning. J. Chem. Ecol. 2016, 42, 240–248. [Google Scholar] [CrossRef] [PubMed] [Green Version]
  14. Pelttari, E.; Karhumaki, E.; Langshaw, J.; Perakyla, H.; Elo, H. Antimicrobial Properties of Substituted Salicylaldehydes and Related Compounds. Z. Nat. C 2007, 62, 487–497. [Google Scholar] [CrossRef] [PubMed]
  15. Pelttari, E.; Lehtinen, M.; Elo, H. Substituted Salicylaldehydes as Potential Antimicrobial Drugs: Minimal Inhibitory and Microbicidal Concentrations. Z. Nat. C 2011, 66, 571–580. [Google Scholar]
  16. Kordestani, N.; Rudbari, H.A.; Fernandes, A.R.; Raposo, L.R.; Baptista, P.V.; Ferreira, D.; Bruno, G.; Bella, G.; Scopelliti, R.; Braun, J.D.; et al. Antiproliferative Activities of Diimine–Based Mixed Ligand Copper(II) Complexes. ACS Comb. Sci. 2020, 22, 89–99. [Google Scholar] [CrossRef]
  17. Zianna, A.; Psomas, G.; Hatzidimitriou, A.; Lalia-Kantouri, M. Copper(II) complexes of salicylaldehydes and benzophenones: Synthesis, Structure, Thermal decomposition study and Interaction with calf-thymus DNA and albumins. RSC Adv. 2015, 5, 37495–37511. [Google Scholar] [CrossRef]
  18. Zianna, A.; Psomas, G.; Hatzidimitriou, A.; Lalia-Kantouri, M. Ni(II) complexes with 2,2′-dipyridylamine and salicylaldehydes: Synthesis, crystal structure and interaction with calf-thymus DNA and albumins. J. Inorg. Biochem. 2016, 163, 131–142. [Google Scholar] [CrossRef]
  19. Ntanatsidis, S.; Perontsis, S.; Konstantopoulou, S.; Kalogiannis, S.; Hatzidimitriou, A.G.; Papadopoulos, A.N.; Psomas, G. Manganese(II) complexes of substituted salicylaldehydes and α-diimines: Synthesis, characterization and biological activity. J. Inorg. Biochem. 2022, 227, 111693. [Google Scholar] [CrossRef]
  20. Zianna, A.; Geromichalou, E.; Geromichalos, G.; Fiotaki, A.-M.; Hatzidimitriou, A.G.; Kalogiannis, S.; Psomas, G. Zinc(II) complexes of 3,5-dibromo-salicylaldehyde and α-diimines: Synthesis, characterization and in vitro and in silico biological profile. J. Inorg. Biochem. 2022, 226, 111659. [Google Scholar] [CrossRef]
  21. Zianna, A.; Geromichalos, G.; Fiotaki, A.-M.; Hatzidimitriou, A.G.; Kalogiannis, S.; Psomas, G. Palladium(II) complexes of substituted salicylaldehydes: Synthesis, characterization and investigation of their biological profile. Pharmaceuticals 2022, 15, 886. [Google Scholar] [CrossRef] [PubMed]
  22. Zianna, A.; Vradi, E.; Hatzidimitriou, A.G.; Kalogiannis, S.; Psomas, G. Zinc(II) complexes of 3-bromo-5-chloro-salicylaldehyde: Characterization and biological activity. Dalton Trans. 2022, 51, 17629–17641. [Google Scholar] [CrossRef] [PubMed]
  23. Stamou, P.; Hatzidimitriou, A.G.; Psomas, G. Manganese(II) complexes with 5-nitro-2-hydroxy-benzaldehyde or substituted 2-hydroxy-phenones: Structure and interaction with bovine serum albumin and calf-thymus DNA. J. Inorg. Biochem. 2022, 235, 111923. [Google Scholar] [CrossRef] [PubMed]
  24. Zianna, A.; Geromichalos, G.; Psoma, E.; Kalogiannis, S.; Hatzidimitriou, A.G.; Psomas, G. Structure and in vitro and in silico biological activity of zinc(II) complexes with 3,5-dichloro-salicylaldehyde. J. Inorg. Biochem. 2022, 229, 111727. [Google Scholar] [CrossRef]
  25. Christidou, A.; Zavalani, K.; Hatzidimitriou, A.G.; Psomas, G. Copper(II) complexes with 3,5-dihalogeno-salicylaldehydes: Synthesis, structure and interaction with DNA and albumins. J. Inorg. Biochem. 2023, 238, 112049. [Google Scholar] [CrossRef]
  26. Vitomirov, T.; Dimiza, F.; Matić, I.Z.; Stanojković, T.; Pirković, A.; Živković, L.; Spremo-Potparević, B.; Novaković, I.; Anđelković, K.; Milčić, M.; et al. Copper(II) complexes with 4-(diethylamino)salicylaldehyde and α-diimines: Anticancer, antioxidant, antigenotoxic effects and interaction with DNA and albumins. J. Inorg. Biochem. 2022, 235, 111942. [Google Scholar] [CrossRef]
  27. Geary, W.J. The use of conductivity measurements in organic solvents for the characterisation of coordination compounds. Coord. Chem. Rev. 1971, 7, 81–122. [Google Scholar] [CrossRef]
  28. Nakamoto, K. Infrared and Raman Spectra of Inorganic and Coordination Compounds, Part B: Applications in Coordination, Organometallic, and Bioinorganic Chemistry, 6th ed.; Wiley: Hoboken, NJ, USA, 2009. [Google Scholar]
  29. Nakamoto, Κ. Infrared and Raman Spectra of Inorganic and Coordination Compounds, 4th ed.; Wiley–Interscience: New York, NY, USA, 1986; pp. 254–257. [Google Scholar]
  30. Hathaway, B.J. Comprehensive Coordination Chemistry; Wilkinson, G., Ed.; Pergamon Press: Oxford, UK, 1987; Volume 5, pp. 533–773. [Google Scholar]
  31. Jageja, R.N.; Vyas, K.M.; Gupta, V.K.; Joshi, R.G.; Prabha, C.R. Syntheses, characterization and molecular structures of calcium(II) and copper(II) complexes bearing O2-chelate ligands: DNA binding, DNA cleavage and anti-microbial study. Polyhedron 2012, 31, 767–778. [Google Scholar]
  32. Battaglia, L.P.; Bonamartini-Corradi, A.; Marcotrigiano, G.; Menabue, L.; Pellacani, G.C. Halocuprates(II) of the N-phenylpiperazinium mono- and dications: Crystal and molecular structure of N-phenylpiperazinium tetrachloro cuprate(II). Correlation of the electronic spectrum vs. distortion of the CuCl42– anions from tetrahedral symmetry. Inorg. Chem. 1979, 18, 148–152. [Google Scholar] [CrossRef]
  33. Yang, L.; Powell, D.R.; Houser, R.P. Structural variation in copper(I) complexes with pyridylmethylamide ligands: Structural analysis with a new four-coordinate geometry index, τ4. Dalton Trans. 2007, 955–964. [Google Scholar] [CrossRef]
  34. Okuniewski, A.; Rosiak, D.; Chojnacki, J.; Becker, B. Coordination polymers and molecular structures among complexes of mercury(II) halides with selected 1-benzoylthioureas. Polyhedron 2015, 90, 47–57. [Google Scholar] [CrossRef]
  35. Li, G.Z.; Zhang, S.H.; Liu, Z. Bis (2, 4-dibromo-6-formylphenolato-κ2O, O′) copper (II). Acta Cryst. 2008, E64, m52. [Google Scholar] [CrossRef] [PubMed]
  36. Wu, Q. Synthesis and crystal structure of bis(5-methyl-2-aldehyde-phenolato-κ2O1, O2)copper(II), C16H14CuO4. Z. Kristallogr. NCS 2020, 235, 1359–1360. [Google Scholar]
  37. Hathaway, B.J. The evidence for “out-of-the-plane” bonding in axial complexes of the copper(II) ion. Struct. Bond. 1973, 14, 49–67. [Google Scholar]
  38. Addison, A.W.; Rao, T.N.; Reedijk, J.; van Rijn, J.; Verchoor, G.C. Synthesis, structure, and spectroscopic properties of copper(II) compounds containing nitrogen-sulphur donor ligands; the crystal and molecular structure of aqua[1,7-bis(N-methylbenzimidazol-2′-yl)-2,6-dithiaheptane]copper(II) perchlorate. J. Chem. Soc. Dalton Trans. 1984, 1349–1356. [Google Scholar] [CrossRef]
  39. Wu, H.; Feng, Y.; Wang, S.; Huang, W. (4-Bromo-2-formylphenolato)perchlorato(1,10-phenanthroline)copper(II). Acta Crystallogr. Sect. C Cryst. Struct. Commun. 2006, 62, m358–m359. [Google Scholar] [CrossRef] [Green Version]
  40. Chen, L.; Zhao, G.; Wang, X.; Peng, Q.; Pan, Z. (2-Acetylphenolato)(2,2′-bipyridine)nitratocopper(II). Acta Crystallogr. Sect. E Struct. Rep. Online 2009, 65, m1427. [Google Scholar] [CrossRef] [Green Version]
  41. Marchi, R.C.; Campos, I.A.S.; Santana, V.T.; Carlos, R.M. Chemical implications and considerations on techniques used to assess the in vitro antioxidant activity of coordination compounds. Coord. Chem. Rev. 2022, 451, 2142752. [Google Scholar] [CrossRef]
  42. Dairi, S.; Carbonneau, M.; Galeano-Diaz, T.; Remini, H.; Dahmoune, F.; Aoun, O.; Belbahi, A.; Lauret, C.; Cristol, J.; Madani, K. Antioxidant effects of extra virgin olive oil enriched by myrtle phenolic extracts on iron-mediated lipid peroxidation under intestinal conditions model. Food Chem. 2017, 237, 297–304. [Google Scholar] [CrossRef]
  43. Slavova–Kazakova, A.; Karamac, M.; Kancheva, V.; Amarowicz, R. Antioxidant Activity of Flaxseed Extracts in Lipid Systems. Molecules 2016, 21, 17. [Google Scholar] [CrossRef] [Green Version]
  44. Kontogiorgis, C.; Ntella, M.; Mpompou, L.; Karallaki, F.; Papadopoulos, A.; Hadjipavlou-Litina, D.; Lazari, D. Study of the antioxidant activity of Thymus sibthorpii Bentham (Lamiaceae). J. Enz. Inhib. Med. Chem. 2016, 31, 154–159. [Google Scholar] [CrossRef] [PubMed] [Green Version]
  45. Blois, M.S. Antioxidant Determinations by the Use of a Stable Free Radical. Nature 1958, 181, 1199–1200. [Google Scholar] [CrossRef]
  46. Kontogiorgis, C.; Hadjipavlou-Litina, D. Biological Evaluation of Several Coumarin Derivatives Designed as Possible Anti–inflammatory/Antioxidant Agents. J. Enzym. Inhib. Med. Chem. 2003, 180, 63–69. [Google Scholar] [CrossRef] [PubMed]
  47. Gulcin, I.; Beydemır, S.; Alici, H.A.; Elmasta, M.; Buyukokuroglu, M.E. In vitro antioxidant properties of morphine. Pharmacol. Res. 2004, 49, 59–66. [Google Scholar] [CrossRef] [PubMed]
  48. Jayaprakasha, G.K.; Rao, L.; Sakariah, K. Antioxidant activities of flavidin in different in vitro model systems. Bioorg. Med. Chem. 2004, 12, 5141–5146. [Google Scholar] [CrossRef]
  49. Zeglis, B.M.; Pierre, V.C.; Barton, J.K. Metallo-intercalators and metallo-insertors. Chem. Commun. 2007, 44, 4565–4576. [Google Scholar] [CrossRef] [Green Version]
  50. Pratviel, G.; Bernadou, J.; Meunier, B. DNA And RNA Cleavage by Metal Complexes. Adv. Inorg. Chem. 1998, 45, 251–262. [Google Scholar]
  51. Pyle, A.M.; Rehmann, J.P.; Meshoyrer, R.; Kumar, C.V.; Turro, N.J.; Barton, J.K. Mixed-ligand complexes of ruthenium(II): Factors governing binding to DNA. J. Am. Chem. Soc. 1989, 111, 3053–3063. [Google Scholar] [CrossRef]
  52. Wolfe, A.; Shimer, G.; Meehan, T. Polycyclic Aromatic Hydrocarbons Physically Intercalate into Duplex Regions of Denatured DNA. Biochemistry 1987, 26, 6392–6396. [Google Scholar] [CrossRef]
  53. Dimitrakopoulou, A.; Dendrinou-Samara, C.; Pantazaki, A.A.; Alexiou, M.; Nordlander, E.; Kessissoglou, D.P. Synthesis, structure and interactions with DNA of novel tetranuclear, [Mn4(II/II/II/IV)] mixed valence complexes. J. Inorg. Biochem. 2008, 102, 618–628. [Google Scholar] [CrossRef]
  54. Garcia-Gimenez, J.L.; Gonzalez-Alvarez, M.; Liu-Gonzalez, M.; Macias, B.; Borras, J.; Alzuet, G. Toward the development of metal-based synthetic nucleases: DNA binding and oxidative DNA cleavage of a mixed copper(II) complex with N-(9H-purin-6-yl)benzenesulfonamide and 1,10-phenantroline. Antitumor activity in human Caco-2 cells and Jurkat T lymphocytes. Evaluation of p53 and Bcl-2 proteins in the apoptotic mechanism. J. Inorg. Biochem. 2009, 103, 923–934. [Google Scholar] [PubMed]
  55. Lakowicz, J.R. Principles of Fluorescence Spectroscopy, 3rd ed.; Plenum Press: New York, NY, USA, 2006. [Google Scholar]
  56. Zhao, G.; Lin, H.; Zhu, S.; Sun, H.; Chen, Y. Dinuclear palladium (II) complexes containing two monofunctional [Pd(en)(pyridine) Cl]+ units bridged by Se or S. Synthesis, characterization, cytotoxicity and kinetic studies of DNA-binding. J. Inorg. Biochem. 1998, 70, 219–226. [Google Scholar] [CrossRef] [PubMed]
  57. Heller, D.P.; Greenstock, C.L. Fluorescence lifetime analysis of DNA intercalated ethidium bromide and quenching by free dye. Biophys. Chem. 1994, 50, 305–312. [Google Scholar] [CrossRef] [PubMed]
  58. He, X.M.; Carter, D.C. Atomic structure and chemistry of human serum albumin. Nature 1992, 358, 209–215. [Google Scholar] [CrossRef] [Green Version]
  59. Olson, R.E.; Christ, D.D. Chapter 33. Plasma Protein Binding of Drugs. Ann. Rep. Med. Chem. 1996, 31, 327–336. [Google Scholar]
  60. Tan, C.; Liu, J.; Li, H.; Zheng, W.; Shi, S.; Chen, L.; Ji, L. Differences in structure, physiological stability, electrochemistry, cytotoxicity, DNA and protein binding properties between two Ru(III) complexes. J. Inorg. Biochem. 2008, 102, 347–358. [Google Scholar] [CrossRef]
  61. Stella, L.; Capodilupo, A.L.; Bietti, M. A reassessment of the association between azulene and [60]fullerene. Possible pitfalls in the determination of binding constants through fluorescence spectroscopy. Chem. Commun. 2008, 39, 4744–4746. [Google Scholar] [CrossRef]
  62. Rajendiran, V.; Karthik, R.; Palaniandavar, M.; Stoeckli-Evans, H.; Periasamy, V.S.; Akbarsha, M.A.; Srinag, B.S.; Krishnamurthy, H. Mixed-Ligand Copper(II)-phenolate Complexes:  Effect of Coligand on Enhanced DNA and Protein Binding, DNA Cleavage, and Anticancer Activity. Inorg. Chem. 2007, 46, 8208–8221. [Google Scholar] [CrossRef]
  63. Laitinen, O.H.; Hytönen, V.P.; Nordlund, H.R.; Kulomaa, M.S. Genetically engineered avidins and streptavidins. Cell. Mol. Life Sci. 2006, 63, 2992–3017. [Google Scholar] [CrossRef]
  64. Marmur, J. A procedure for the isolation of deoxyribonucleic acid from micro-organisms. J. Mol. Biol. 1961, 3, 208–211. [Google Scholar] [CrossRef]
  65. Reichmann, M.F.; Rice, S.A.; Thomas, C.A.; Doty, P. A Further Examination of the Molecular Weight and Size of Desoxypentose Nucleic Acid. J. Am. Chem. Soc. 1954, 76, 3047–3053. [Google Scholar] [CrossRef]
  66. Zianna, A.; Psomas, G.; Hatzidimitriou, A.; Coutouli-Argyropoulou, E.; Lalia-Kantouri, M. Zinc complexes of salicylaldehydes: Synthesis, characterization and DNA-binding properties. J. Inorg. Biochem. 2013, 127, 116–126. [Google Scholar] [CrossRef] [PubMed]
  67. Bruker Analytical X-ray Systems, Inc. Apex2, Version 2 User Manual, M86-E01078; Madison, WI, USA, 2006. [Google Scholar]
  68. Siemens Industrial Automation, Inc. SADABS: Area-Detector Absorption Correction; Madison, WI, USA, 1996. [Google Scholar]
  69. Palatinus, L.; Chapuis, G. SUPERFLIP—A computer program for the solution of crystal structures by charge flipping in arbitrary dimensions. J. Appl. Cryst. 2007, 40, 786–790. [Google Scholar] [CrossRef] [Green Version]
  70. Betteridge, P.W.; Carruthers, J.R.; Cooper, R.I.; Prout, K.; Watkin, D.J. CRYSTALS version 12: Software for guided crystal structure analysis. J. Appl. Cryst. 2003, 36, 1487. [Google Scholar] [CrossRef]
  71. Watkin, D.J.; Prout, C.K.; Pearce, L.J. CAMERON Program; Chemical Crystallographic Laboratory, Oxford University: Oxford, UK, 1996. [Google Scholar]
  72. Ruch, R.J.; Cheng, C.; Klaunig, J.E. Prevention of cytotoxicity and inhibition of intercellular communication by antioxidant catechins isolated from Chinese green tea. Carcinogenesis 1989, 10, 1003–1008. [Google Scholar] [CrossRef] [PubMed]
  73. Wang, Y.; Zhang, H.; Zhang, G.; Tao, W.; Tang, S. Interaction of the flavonoid hesperidin with bovine serum albumin: A fluorescence quenching study. J. Lumin. 2007, 126, 211–218. [Google Scholar] [CrossRef]
Figure 1. Syntax formula for (A) 5–fluoro–salicylaldehyde (5–F–saloH), (B) 2,2′–bipyridylamine (bipyam), (C) 2,9–dimethyl–1,10–phenanthroline (neoc), (D) 1,10–phenanthroline (phen) and (E) 2,2′–bipyridine (bipy).
Molecules 27 08929 g001
Figure 2. Molecular structure of complex [Cu(5–F–salo)2] (1). Aromatic hydrogen atoms are omitted for clarity.
Molecules 27 08929 g002
Figure 3. Molecular structures of (A) complex [Cu(5–F–salo)(bipyam)Cl] (2), (B) complex [Cu(5–F–salo)(neoc)Cl]·CH3OH (3), and (C) complex [Cu(5–F–salo)(phen)(NO3)] (4). For compounds 3 and 4, only one position for each of disordered parts is shown. Aromatic and methyl hydrogen atoms and solvate molecules are omitted for clarity.
Molecules 27 08929 g003aMolecules 27 08929 g003b
Figure 4. UV–vis spectra of a DMSO solution of (A) complex 1 (10−4 M), (B) complex 2 (5 × 10⁻⁵ M), and (C) complex 5 (10−4 M) in the presence of increasing amounts of CT DNA. The arrows show the changes upon increasing amounts of CT DNA.
Molecules 27 08929 g004aMolecules 27 08929 g004b
Figure 5. Relative viscosity (η/η0)1/3 of CT DNA (0.1 mM) in buffer solution (150 mM NaCl and 15 mM trisodium citrate at pH 7.0) in the presence of 5–F–saloH and complexes 15, at increasing amounts (r = [compound]/[DNA] = 0–0.36).
Molecules 27 08929 g005
Figure 6. (A) Fluorescence emission spectra (λexcitation = 540 nm) for EB–DNA conjugate ([EB] = 20 μM, [DNA] = 26 μM) in buffer solution (150 mM NaCl and 15 mM trisodium citrate at pH = 7.0) in the absence and presence of increasing amounts of complex 1 (up to r = 0.36). The arrow shows the changes in intensity upon increasing amounts of 1. (B) Plot of EB–DNA relative fluorescence emission intensity at λemission = 592 nm (I/Io, %) versus r (r = [complex]/[DNA]) in the presence of 5–F–saloH and complexes 15 (up to 48.7% of the initial EB–DNA fluorescence emission intensity for 5–F–saloH, 55.2% for 1, 55.5% for 2, 50.9% for 3, 51.6% for 4 and 58.8% for 5).
Molecules 27 08929 g006
Figure 7. Fluorescence emission spectra (λexcitation = 295 nm) of a buffer solution (150 mM NaCl and 15 mM trisodium citrate at pH 7.0) containing (A) BSA (3 μM) upon addition of increasing amounts of complex 5, and (B) HSA (3 μM) upon addition of increasing amounts of complex 1. The arrows show the changes in intensity upon increasing amounts of the complex.
Molecules 27 08929 g007
Figure 8. (A) Plot of % relative BSA fluorescence emission intensity at λem = 350 nm (I/Io, %) versus r (r = [complex]/[BSA]) for 5–F–saloH and complexes 15 (up to 74.3% of the initial BSA fluorescence for 5–F–saloH, 37.5% of 1, 46.0% for 2, 15.7% for 3, 24.7% for 4, and 31.7% for 5) in buffer solution (150 mM NaCl and 15 mM trisodium citrate at pH 7.0). (B) Plot of % relative HSA fluorescence emission intensity at λem = 342 nm (I/Io, %) versus r (r = [complex]/[HSA]) for 5–F–saloH and complexes 15 (up to 74.3% of the initial HSA fluorescence for up 5–F–saloH, 38.7% for 1, 37.3 for 2, 31.5% for 3, 25.5% for 4, and 37.0% for 5) in buffer solution (150 mM NaCl and 15 mM trisodium citrate at pH 7.0).
Molecules 27 08929 g008
Table 1. Experimental X-ray crystallography details for complexes 14.
1234
Crystal Data
Chemical formulaC14H8CuF2O4C17H13ClCuFN3O2C22H20ClCuFN2O3C19H12CuFN3O5
Moiety formula C21H16ClCuFN2O2·CH4O
Mr341.76409.31478.41444.87
Crystal systemOrthorhombicMonoclinicMonoclinicTriclinic
Space groupPca21P21/nP21/nP–1
Temperature (K)295295295295
a (Å)12.5045 (17)10.3584 (4)9.0506 (11)7.6719 (9)
b (Å)3.8457 (6)15.4548 (8)17.2678 (16)9.4646 (11)
c (Å)25.277 (3)10.3842 (5)13.4078 (15)13.1039 (15)
α (°)90909092.412 (3)
β (°)90105.4055 (16)95.523 (3)106.764 (4)
γ (°)909090106.721 (4)
V3)1215.5 (3)1602.65 (13)2085.7 (4)864.38 (18)
Z4442
µ (mm−1)1.841.561.211.31
Crystal size (mm)0.21 × 0.02 × 0.020.18 × 0.10 × 0.090.19 × 0.15 × 0.120.17 × 0.15 × 0.14
Data Collection
DiffractometerBruker Kappa Apex2
Radiation typeMo Kα (λ = 0.71073 Å, source operating at 50 kV and 30 mA)
Absorption correctionNumerical, Analytical Absorption (De Meulenaer and Tompa, 1965)
Tmin, Tmax0.95, 0.960.86, 0.870.85, 0.860.81, 0.83
Measured reflections9456126751872810790
Independent reflections3671304839683284
Observed reflections with [I > 2.0σ(I)]2454249630292964
Rint0.0300.0260.0180.024
(sin θ/λ)max−1)0.7250.6120.6110.616
Refinement
R[F2 > 2σ(F2)] 0.0330.0260.0300.034
wR(F2)0.0660.0520.0560.054
S1.001.001.001.00
No. of reflections2454249630292964
No. of parameters191226269280
No. of restraints1-235
Δρmax, Δρmin (e Å−3)0.47, −0.510.21, −0.290.51, −0.370.43, −0.43
Absolute structureFlack (1983),
1725 Friedel–pairs
Absolute structure parameter0.19 (2)
Table 2. Selected bond lengths (Å) and angles (°) for complex 1.
BondLength (Å)BondLength (Å)
Cu1—O11.934 (2)Cu1—O31.925 (2)
Cu1—O21.893 (4)Cu1—O41.902 (4)
BondsAngle (°)BondAngle (°)
O1—Cu1—O292.50 (13)O1—Cu1—O486.56 (14)
O1—Cu1—O3178.72 (14)O2—Cu1—O4177.6 (2)
O2—Cu1—O387.60 (13)O3—Cu1—O493.39 (13)
Table 3. Selected bond lengths (Å) and angles (°) and structural parameters for complexes 24.
Complex 2Complex 3Complex 4
BondLength (Å)Length (Å)Length (Å)
Cu1—O11.9901 (17)2.0471 (18)1.9708 (16)
Cu1—O21.9225 (17)1.910 (2)1.8980 (15)
Cu1—N12.0151 (19)2.247 (2)2.007 (2)
Cu1—N22.0244 (19)2.011 (2)1.9915 (17)
Cu1—X 12.5531 (7)2.3055 (7)2.3672 (19)
BondsAngles (°)Angles (°)Angles (°)
Ν1—Cu1—N290.04 (8)79.59 (9)82.82 (8)
N1—Cu1—O188.56 (7)95.80 (8)175.29 (7)
N1—Cu1—O2161.04 (8)106.24 (9)90.87 (7)
N1—Cu1—X 1100.25 (6)106.51 (6)100.23 (7)
N2—Cu1—O1176.00 (8)85.45 (8)93.12 (7)
N2—Cu1—O290.15 (7)172.93 (9)168.61 (8)
N2—Cu1—X 191.35 (6)92.15 (6)96.66 (7)
O1—Cu1—O289.95 (7)89.92 (8)92.65(12)
O1—Cu1—X 192.59 (6)156.77 (6)82.57 (7)
O2—Cu1—X 198.70 (6)90.00 (6)93.78 (7)
Trigonality index τ50.250.270.11
Tetragonality, T50.790.920.83
1 X = Cl1 for complexes 2 and 3; X = O3 for complex 4.
Table 4. % DPPH–scavenging ability (DPPH%), % ABTS–scavenging activity (ABTS%), and H2O2–reducing activity (H2O2 %) for 5–F–saloH and complexes 1–5.
ComplexDPPH% (30 min)DPPH% (60 min)ABTS%H2O2%
5–F–saloH [21]3.96 ± 1.165.56 ± 1.0619.57 ± 0.5871.84 ± 0.95
[Cu(5–F–salo)2], 19.05 ± 0.5410.79 ± 0.2078.89 ± 0.1871.61 ± 0.35
[Cu(5–F–salo)(bipyam)Cl], 27.54 ± 0.207.42 ± 0.5048.89 ± 0.3899.69 ± 0.29
[Cu(5–F–salo)(neoc)Cl], 37.42 ± 0.5414.15 ± 0.1346.03 ± 0.6026.10 ± 0.66
[Cu(5–F–salo)(phen)(NO3)], 46.15 ± 0.334.64 ± 0.1048.14 ± 0.3525.90 ± 0.76
[Cu(5–F–salo)(bipy)(NO3)], 57.19 ± 0.264.06 ± 0.207.36 ± 0.0869.21 ± 1.10
NDGA87.08 ± 0.1287.47 ± 0.12Not testedNot tested
BHT61.30 ± 1.1679.78 ± 1.12Not testedNot tested
TroloxNot testedNot tested98.10 ± 0.48Not tested
L–ascorbic acidNot testedNot testedNot tested60.80 ± 0.20
Table 5. Spectral features of the UV–vis spectra of 5–F–saloH and its complexes 15 upon addition of CT DNA. UV–band (λmax, in nm) (percentage of hyper-/hypo-chromism (ΔA/A0, %), blue-/red-shift of the λmax (Δλ, in nm) and the corresponding DNA-binding constants (Kb, M−1).
Compoundλ (nm) (ΔA/Aο (%) a, Δλ (nm) b)Kb−1)
5–F–saloH [21]334 (−30, +1); 421 (>+50,c 0)8.37 (±0.47) × 104
[Cu(5–F–salo)2], 1320 (−34, +16); 398 (−20, +20)2.37 (±0.07) × 106
[Cu(5–F–salo)(bipyam)Cl], 2319 (−12, −3); 401 (>+50, +20)6.35 (±0.30) × 105
[Cu(5–F–salo)(neoc)Cl], 3334 (−41, +5); 421 (+34, +4)2.69 (±0.45) × 105
[Cu(5–F–salo)(phen)(NO3)], 4295 (−38, +4); 330 (−29, −4), 405 (+44, +19)1.09 (±0.14) × 106
[Cu(5–F–salo)(bipy)(NO3)], 5312 (−72, +3); 345 (−28, 0)9.32 (±0.29) × 105
a “+” denotes hyperchromism and “−” denotes hypochromism. b “+” denotes red-shift and “−” denotes blue-shift. c “>+50” denotes intense hyperchromism.
Table 6. Percentage of EB–DNA fluorescence quenching (ΔI/I0, %), Stern–Volmer constant (KSV in M−1) and EB–DNA quenching constant (kq, M−1 s−1) for 5–F–saloH and complexes 15.
CompoundΔΙ/Ιο (%)Ksv (M−1)kq (M−1 s−1)
5–F–saloH [21]51.33.79 (±0.11) × 1041.73 (±0.05) × 1012
[Cu(5–F–salo)2], 144.81.56 (±0.02) × 1056.78 (±0.09) × 1012
[Cu(5–F–salo)(bipyam)Cl], 244.56.23 (±0.11) × 1042.71 (±0.05) × 1012
[Cu(5–F–salo)(neoc)Cl], 349.13.35 (±0.05) × 1041.46 (±0.02) × 1012
[Cu(5–F–salo)(phen)(NO3)], 448.46.77 (±0.07) × 1042.94 (±0.03) × 1012
[Cu(5–F–salo)(bipy)(NO3)], 542.23.14 (±0.06) × 1041.36 (±0.03) × 1012
Table 7. The quenching of the SA-fluorescence (ΔΙ/Ιο, %), the albumin-quenching (kq, in M−1 s−1) and albumin-binding (K, in M−1) constants for 5–F–saloH and complexes 15.
CompoundΔΙ/Ιο (%)kq (M−1 s−1)K (M−1)
BSA
5–F–saloH [21]25.71.98 (±0.08) × 10124.31 (±0.31) × 104
[Cu(5–F–salo)2], 162.59.38 (±0.28) × 10124.05 (±0.02) × 104
[Cu(5–F–salo)(bipyam)Cl], 254.06.49 (±0.14) × 10123.15 (±0.18) × 104
[Cu(5–F–salo)(neoc)Cl], 384.32.75 (±0.10) × 10132.51 (±0.10) × 105
[Cu(5–F–salo)(phen)(NO3)], 475.31.62 (±0.06) × 10132.35 (±0.10) × 105
[Cu(5–F–salo)(bipy)(NO3)], 568.31.87 (±0.09) × 10133.23 (±0.12) × 105
HSA
5–F–saloH [21]25.71.96 (±0.07) × 10124.65 (±0.35) × 104
[Cu(5–F–salo)2], 161.34.37 (±0.18) × 10121.58 (±0.09) × 105
[Cu(5–F–salo)(bipyam)Cl], 262.76.27 (±0.21) × 10125.09 (±0.29) × 105
[Cu(5–F–salo)(neoc)Cl], 368.51.25 (±0.05) × 10137.16 (±0.40) × 105
[Cu(5–F–salo)(phen)(NO3)], 474.68.63 (±0.33) × 10121.70 (±0.09) × 106
[Cu(5–F–salo)(bipy)(NO3)], 563.03.01 (±0.10) × 10121.31 (±0.05) × 106
Publisher’s Note: MDPI stays neutral with regard to jurisdictional claims in published maps and institutional affiliations.