Article

Multiscale Spectral Analysis on Lysozyme Aqueous Solutions in the Presence of PolyEthyleneGlycol

by
Maria Teresa Caccamo
1,2,* and
Salvatore Magazù
1,2,*
1
Dipartimento di Scienze Matematiche e Informatiche, Scienze Fisiche e Scienze Della Terra, Università degli Studi di Messina, Viale Ferdinando Stagno D’Alcontres 31, 98166 Messina, Italy
2
Consorzio Interuniversitario Scienze Fisiche Applicate (CISFA), Viale Ferdinando Stagno d’Alcontres 31, 98166 Messina, Italy
*
Authors to whom correspondence should be addressed.
Molecules 2022, 27(24), 8760; https://doi.org/10.3390/molecules27248760
Submission received: 31 October 2022 / Revised: 23 November 2022 / Accepted: 6 December 2022 / Published: 10 December 2022
(This article belongs to the Special Issue Materials for Healthcare)

Abstract

:
Infrared spectroscopy measurements were performed on Lysozyme aqueous solutions also in the presence of PolyEthylene Glycol (PEG 400) as a function of an increasing temperature from T = 27 °C to 90 °C, and, successively in sequence, by decreasing temperatures from T = 90 °C to 27 °C. Data were analyzed by evaluating the spectral difference with respect to the initial spectrum collected at 27 °C. This procedure allows to quantitatively evaluate the thermal restraint related to the thermal scan from T = 27 °C to 90 °C, as well as to introduce a spectral resilience concerning the entire increasing and decreasing thermal paths which allow to highlight the bioprotectant effectiveness of low molecular weight PEG. In particular, the main purpose of the present work is to highlight the effects of a thermal treatment on a mixture of Lysozyme/water and of Lysozyme/water/PEG 400 during an increasing temperature scan, and then after a successive decreasing temperature scan, in order to highlight the bioprotectant role of PEG 400. On that score, an evaluation of the spectral distances of the registered spectra as a function of increasing and decreasing temperatures has been performed and analyzed.

1. Introduction

It is well known that PolyEthylene Glycols (PEGs) are formed by repeating the unit of ethylene glycol, also called oxyethylene, whose chemical structure is H-(O-CH2-CH2)m-OH, m being the polymerization degree. They include both hydrophobic ethylene units (CH2-CH2) and hydrophilic oxygens. Due to the simplicity of their structure, this class of polymers is considered to be a good model for studying more complex systems, such as biostructures, proteins, and hydrophilic surfaces. For these reasons it has been investigated both from the theoretical and experimental point of view [1,2,3,4].
In particular, PEGs are cryo-protective for cells by limiting the increase in volume of water when it turns into ice; on the other hand, PEGs allow to lower the freezing temperature and, above certain concentrations, it is difficult to freeze the water contained in the capillaries. By way of example, for wood, PEG with Molecular weight Mw = 400, i.e., PEG 400, has the merits of combining good wettability, a powerful cryo-protective effect and good mechanical resistance to drying without the excessively shiny or sticky appearance that can have the lower Mw PEGs [5,6,7].
Even today, PEGs remain the most widely used products for the conservation of waterlogged organic materials such as wood, leather, and fibers. Their advantages are multiple: simultaneously consolidating, surfactant and cryo-protective, good penetration, ease of use, and safety for the operator. Their constraints and side effects—corrosive environment for metals, hygroscopicity, especially for low Mw PEGs, environment favorable to the development of microorganisms—are sufficiently well known and documented to adapt treatments, working and storage environments, as well as for monitoring tools [8,9,10,11].
In the present study we used PEG 400, which is a clear, simple, somewhat viscous, colorless, and odorless liquid. PEG 400 is one of the shortest polymers and corresponds to a chain length of 8 repetitive units. Its low toxicity and exceptional ability to solubilize polar active pharmaceutical ingredients make it highly valued in pharmaceutical applications [12,13,14,15,16,17]. PEG 400 is generally considered stable, non-reactive, soluble in all proportions with water, but also soluble in acetone, alcohols, benzene, glycerin, glycols, and aromatic hydrocarbons. This versatile excipient is used in topical, ophthalmic, oral, and parenteral pharmaceutical formulations [18,19,20,21,22].
In the present study, PEG 400 was added to aqueous solutions of a protein, i.e., Lysozyme, in order to investigate its effectiveness as bioprotectant during an increasing temperature ramp followed by a decreasing temperature ramp [23,24,25,26,27].
Lysozyme, discovered by Alexander Fleming in 1922, is a protein synthesized by white blood cells participating in the defense of the body through its proteolytic activity (it is a protease, protein degradation enzyme), which allows it to attack bacterial walls. In the form of a globular protein of 129 amino acids, Lysozyme is found in a certain number of secretions, in the secretions of granulocytes and monocytes, and in egg white [28,29,30,31,32].
The determination of the level of lysozyme in the blood, although very rarely practiced, makes it possible to control the effectiveness of the treatment of certain leukaemias; similarly, this measurement is useful in the diagnosis of certain kidney diseases or in monitoring organ transplant rejection [33,34,35,36,37].
Figure 1 shows the molecular structures of the three solution components, i.e., H2O, PEG 400 and Lysozyme; concerning the PEG 400 structure it is important to highlight the hydrophilic character of PEG which interacts with water through its terminal groups, H and OH, and through its internal Oxygens.
The focus of our investigation is the characterization of the thermal response of these systems, and, on this purpose, the Infrared (IR) Spectroscopy technique has been employed. It useful to stress that molecular vibrations are what cause matter to absorb IR radiation, as molecular vibrational energy levels are separated by energies that fall into the infrared region of the electromagnetic spectrum. The infrared part of electromagnetic radiation is usually divided into three areas: the near infrared (the most energetic) which extends from 14.000 to 4.000 cm−1 (0.7–2.5 μ m wavelength); the mid-infrared, which ranges from 4.000 to 400 cm−1 (2.5–25 μ m); and, finally, the far-infrared, which covers the spectral range from 400 to 10 cm−1 (25–1000 μ m). Due to its highly selective character, this spectroscopic technique is commonly used for the identification of compounds, but it also makes possible to obtain important information on inter- and/or intra-molecular interactions, on the conformation of molecules and on the organization of matter [38,39,40,41,42].
In order to analyze the thermal response of spectra obtained by means of IR technique an approach based on the Spectral Distance (SD) evaluation has been employed to compare spectra collected at different temperatures and hence to characterize sample changes with temperature.
Then, starting from the obtained SD values, we introduce the concept of spectral resilience for characterizing the ability of a material system to return to the initial state after suffering a thermal stress [43,44,45].

2. Results and Discussion

The investigation of the variations of the investigated spectra, by changing of temperature, has been performed by means of the Spectral Distance (SD) that is expressed by the following formula:
S D = I ( ω , T i ) I ( ω , T )   ·   Δ ω
where I ( ω , T )   is the IR absorbance at frequency ω and at temperature T ; T i is the initial or reference temperature; in our case, it is equal to 27 °C; and, finally, Δ ω represents the instrumental frequency resolution. Such an approach allows comparison of the profile of each spectrum for both the investigated systems, at different temperature values, with the reference spectra, taken at 27 °C [46,47].
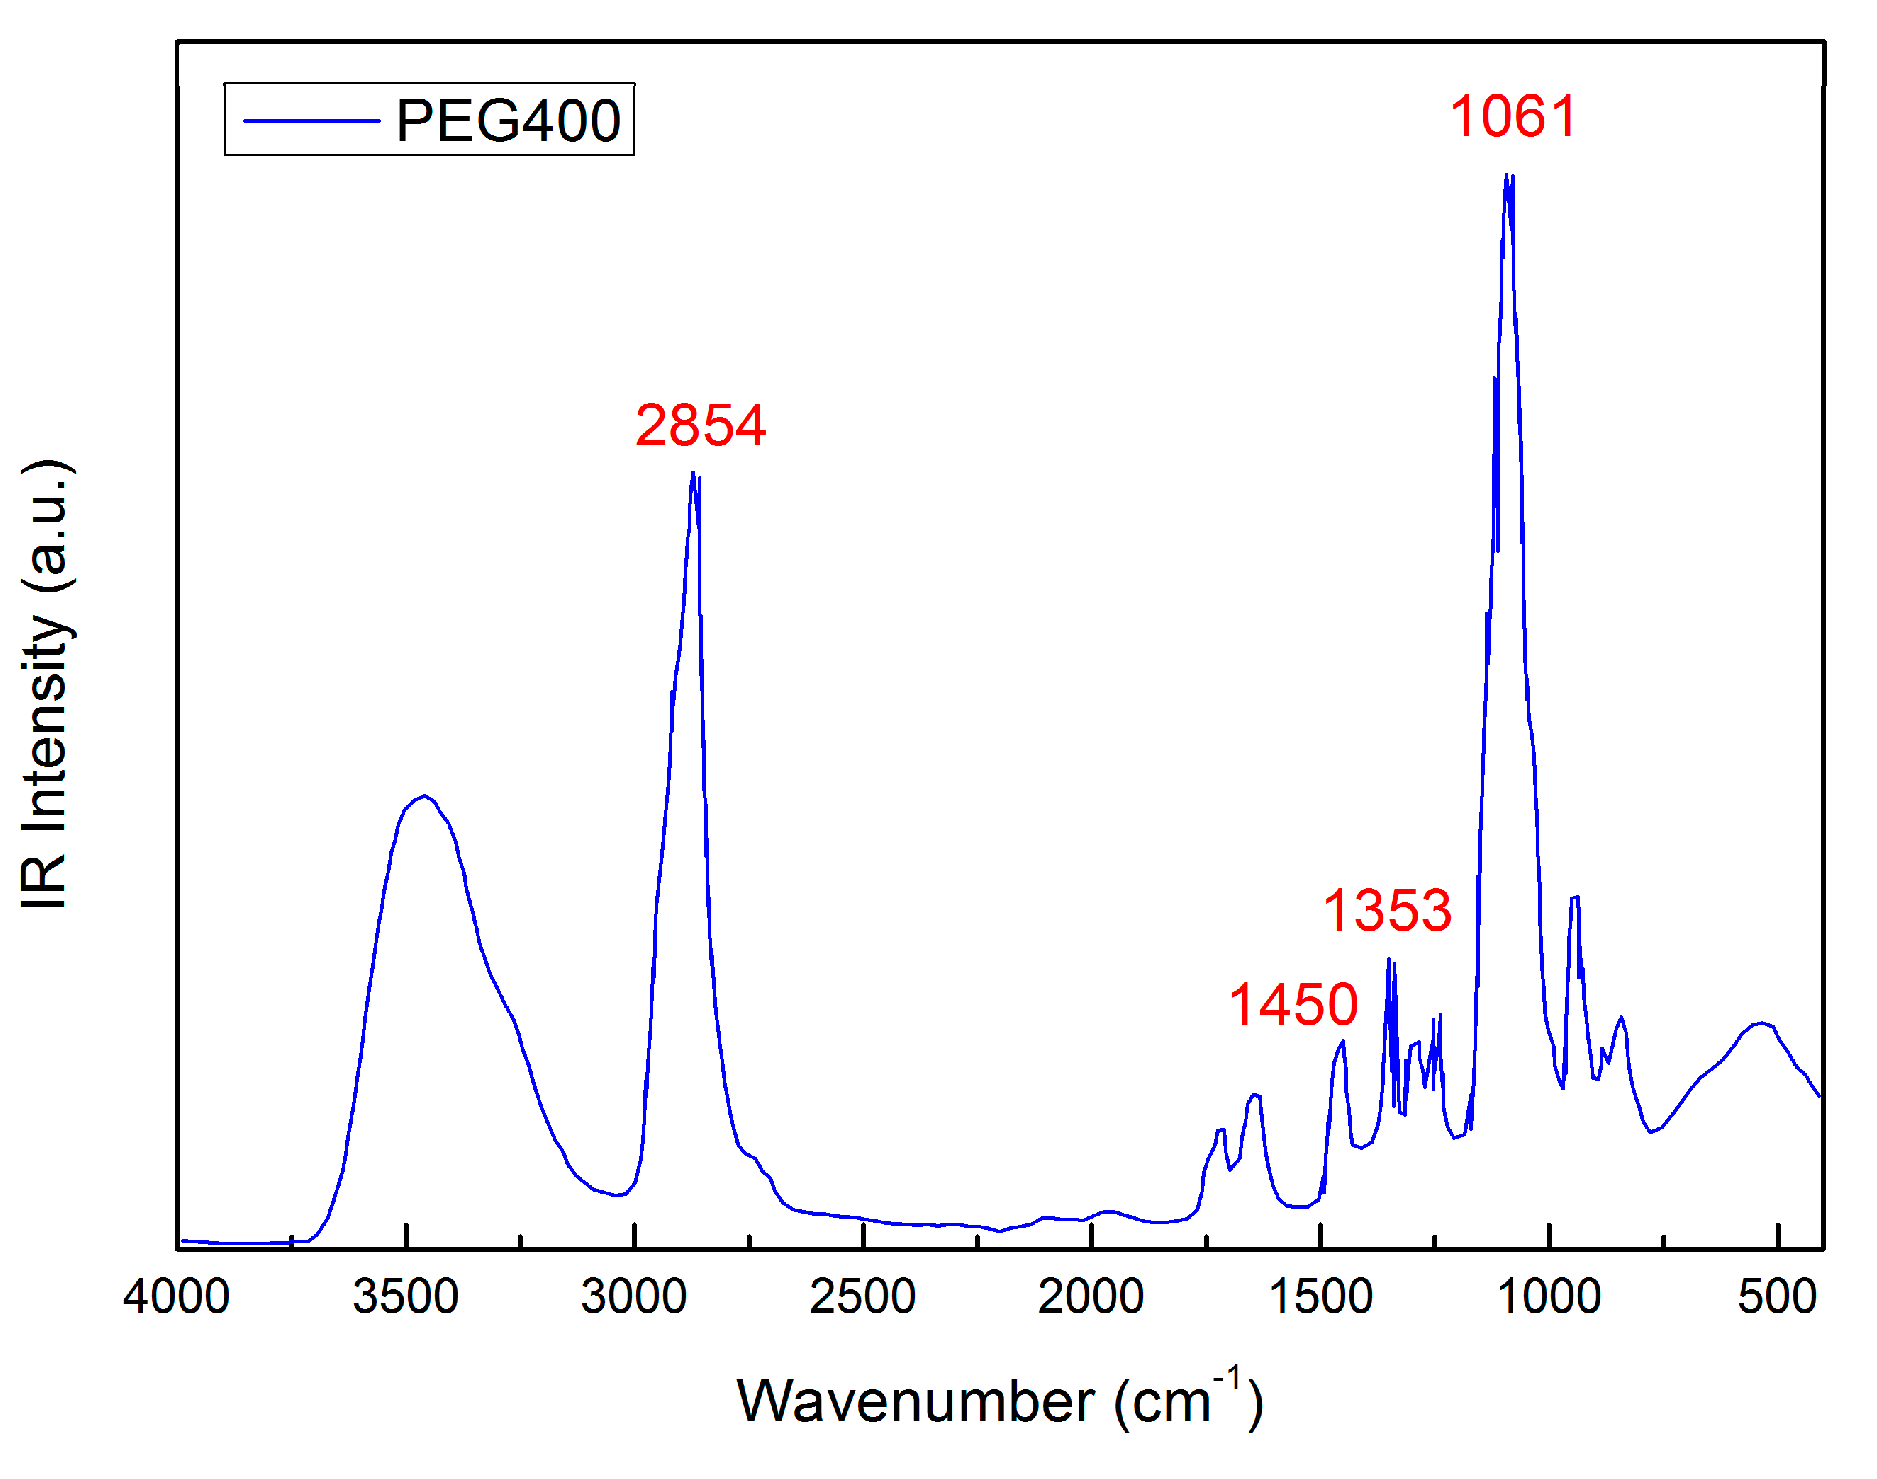
Figure 2 reports the IR spectrum of PEG400 with band assignation; in particular, the peak at ~ 2869 cm−1 is attributed to -CH stretching, ~ 1456 cm−1 and ~ 1353 cm−1 is attributed to C-H bending, and ~ 1061 cm−1 is attributed to C-O stretching [48,49].
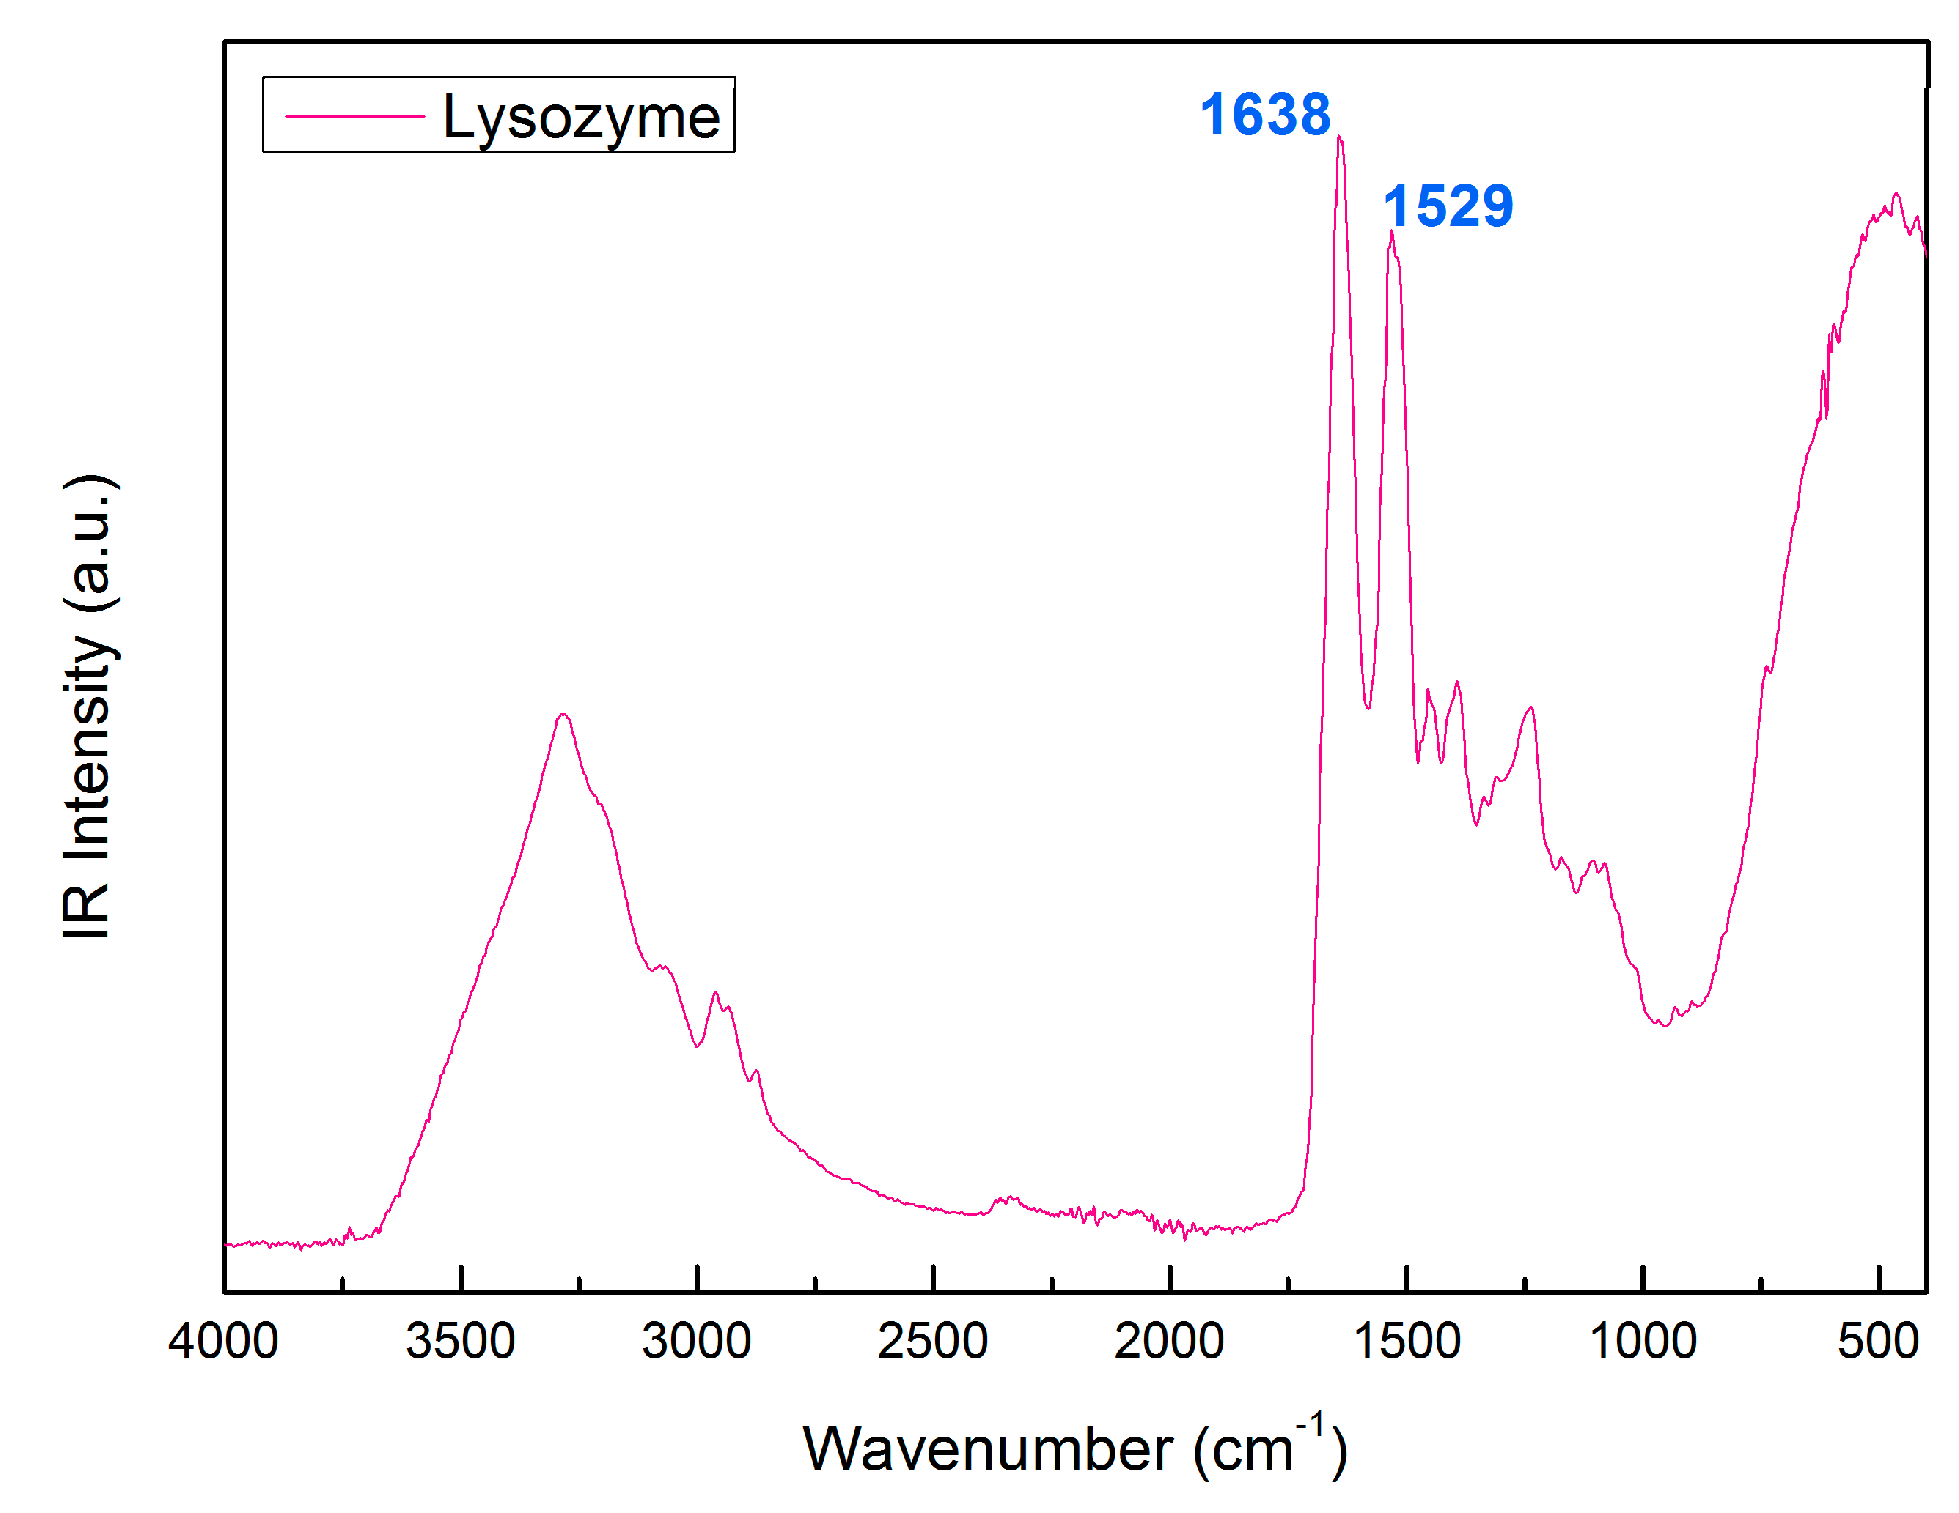
Figure 3 shows the IR spectrum of PEG 400 with the assignation of Amide I and Amide II, at 1638 cm−1, and 1529 cm−1, respectively [50,51,52].
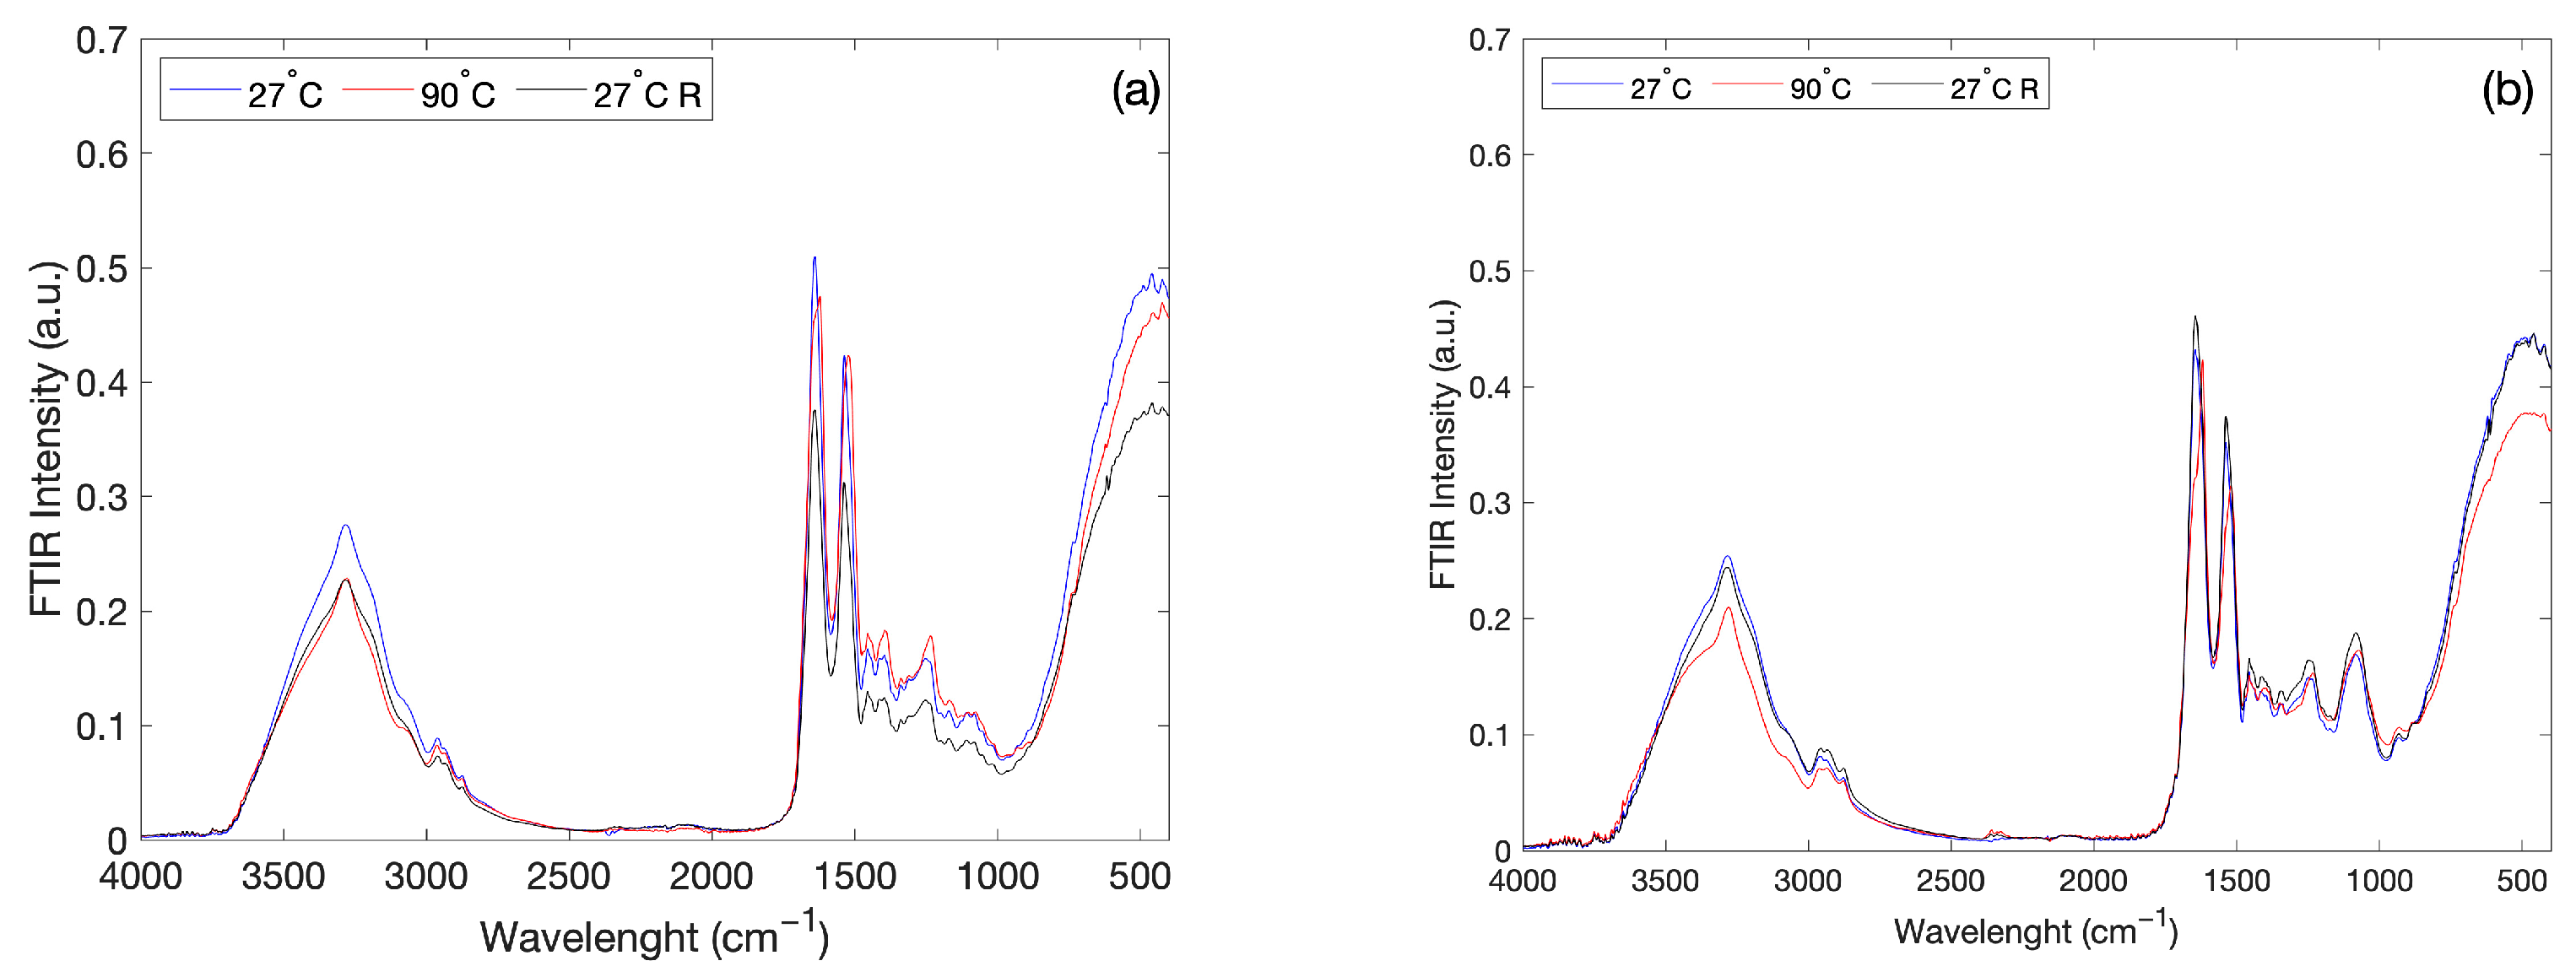
Figure 4a shows the FTIR spectra, in the 400 < Δ ω < 4000 cm−1 spectral range, of the aqueous solution of Lysozyme (binary system) at T = 27 °C, at T = 90 °C, i.e., at the lowest and highest values of the increasing temperature ramp, and again at T = 27 °C after that the system was brought to a temperature value of 90 °C; Figure 4b reports the same FTIR spectra for the aqueous solution of Lysozyme in presence of PEG 400 (ternary system).
As it can be seen, starting from the spectra collected at the lowest temperature value, i.e., T = 27 °C, after having heated both the binary and the ternary systems up to 90 °C, turning back to the temperature value of 27 °C, the spectra are different from the spectra initially acquired at 27 °C. On the other hand, the addition of PEG 400 to the aqueous solution of Lysozyme reduces the SD variations as a function of temperature.
It is useful to stress that Raman scattering on Lysozyme/water/bioprotectant systems have evidenced a similar behavior of the Amide I center frequencies [53].
In order to extract quantitative information on the system thermal response, we have evaluated the SD values for both the investigated systems taking into account the spectra collected within the increasing temperature ramp. The obtained SD values as a function of temperature fulfil an increasing sigmoid curve whose behavior is properly fitted by the following formula:
S D ( T ) = A ( 1 1 1 + e B ( T T 0 ) )
where A represents the sigmoid amplitude, that is connected to the value of thermal restraint [41,50]; in particular, the thermal restraint value is the inverse of the sigmoid amplitude; B is the sigmoid steepness while T 0 is the relaxational temperature corresponding to the abscissa of the sigmoid inflection point [54,55].
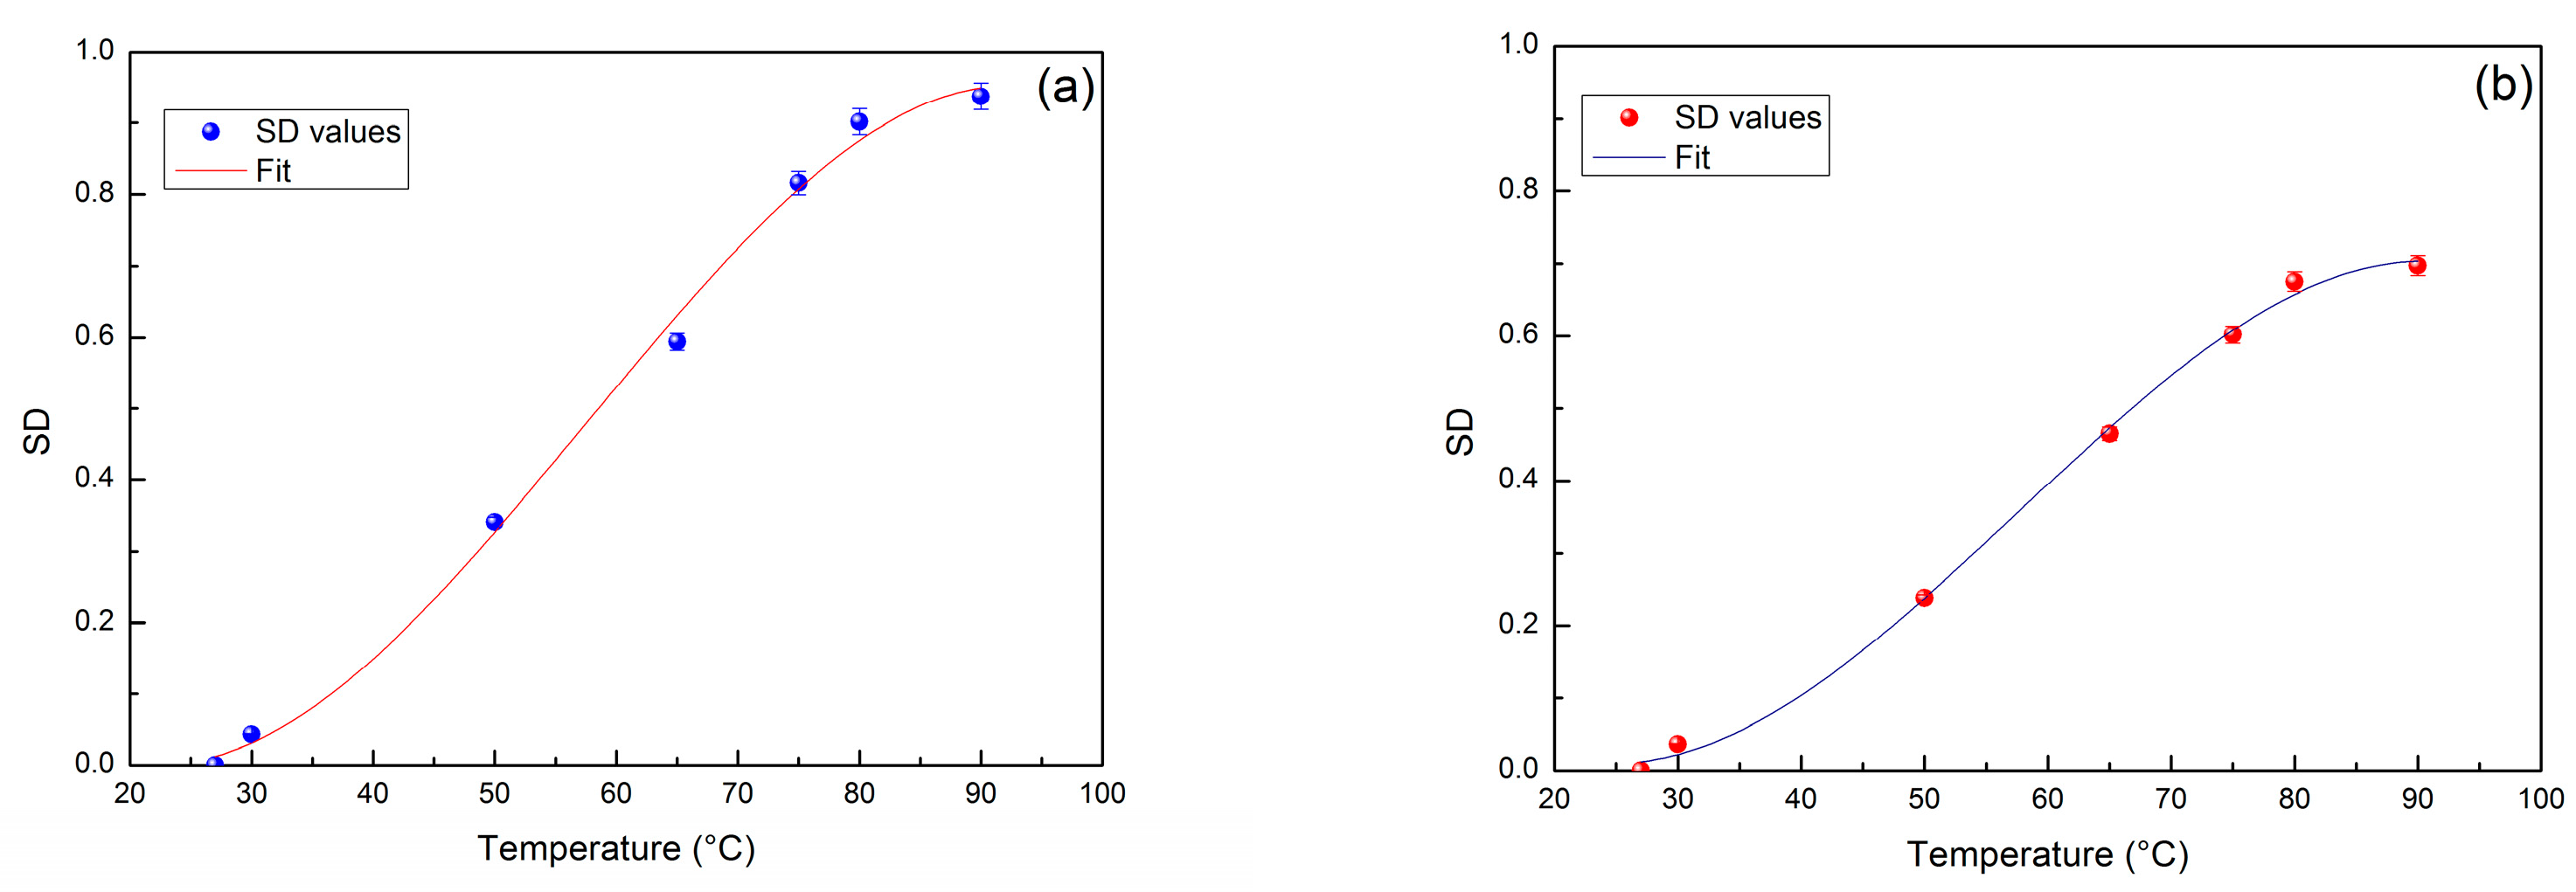
Figure 5a reports the values of SD for the increasing temperature ramp, i.e., from 27 °C   to   90 °C, for the binary system while Figure 5b reports the values of SD for the increasing temperature ramp for the ternary system; both the data are represented with their error bars.
What emerges from this analysis is that for the binary system, that value of amplitude A is 0.975 and the value of temperature T 0 is 55.32 °C. For the ternary system, the value of amplitude A is 0.697 and the value of temperature T 0 is 58.55 °C. Table 1 summarizes the values of A , B , and T 0 for the two investigated systems.
The obtained result shows that the addition of a small percentage of PEG 400 to Lysozyme gives rise to smaller changes in the features of the registered spectra, suggesting that the aqueous solution of Lysozyme in the presence of PEG 400 are more resistant to the temperature changes.
Previous experiments performed by Raman scattering on Lysozyme/water/bioprotectant systems have evidenced a similar behavior for the protein Amide I center frequencies.
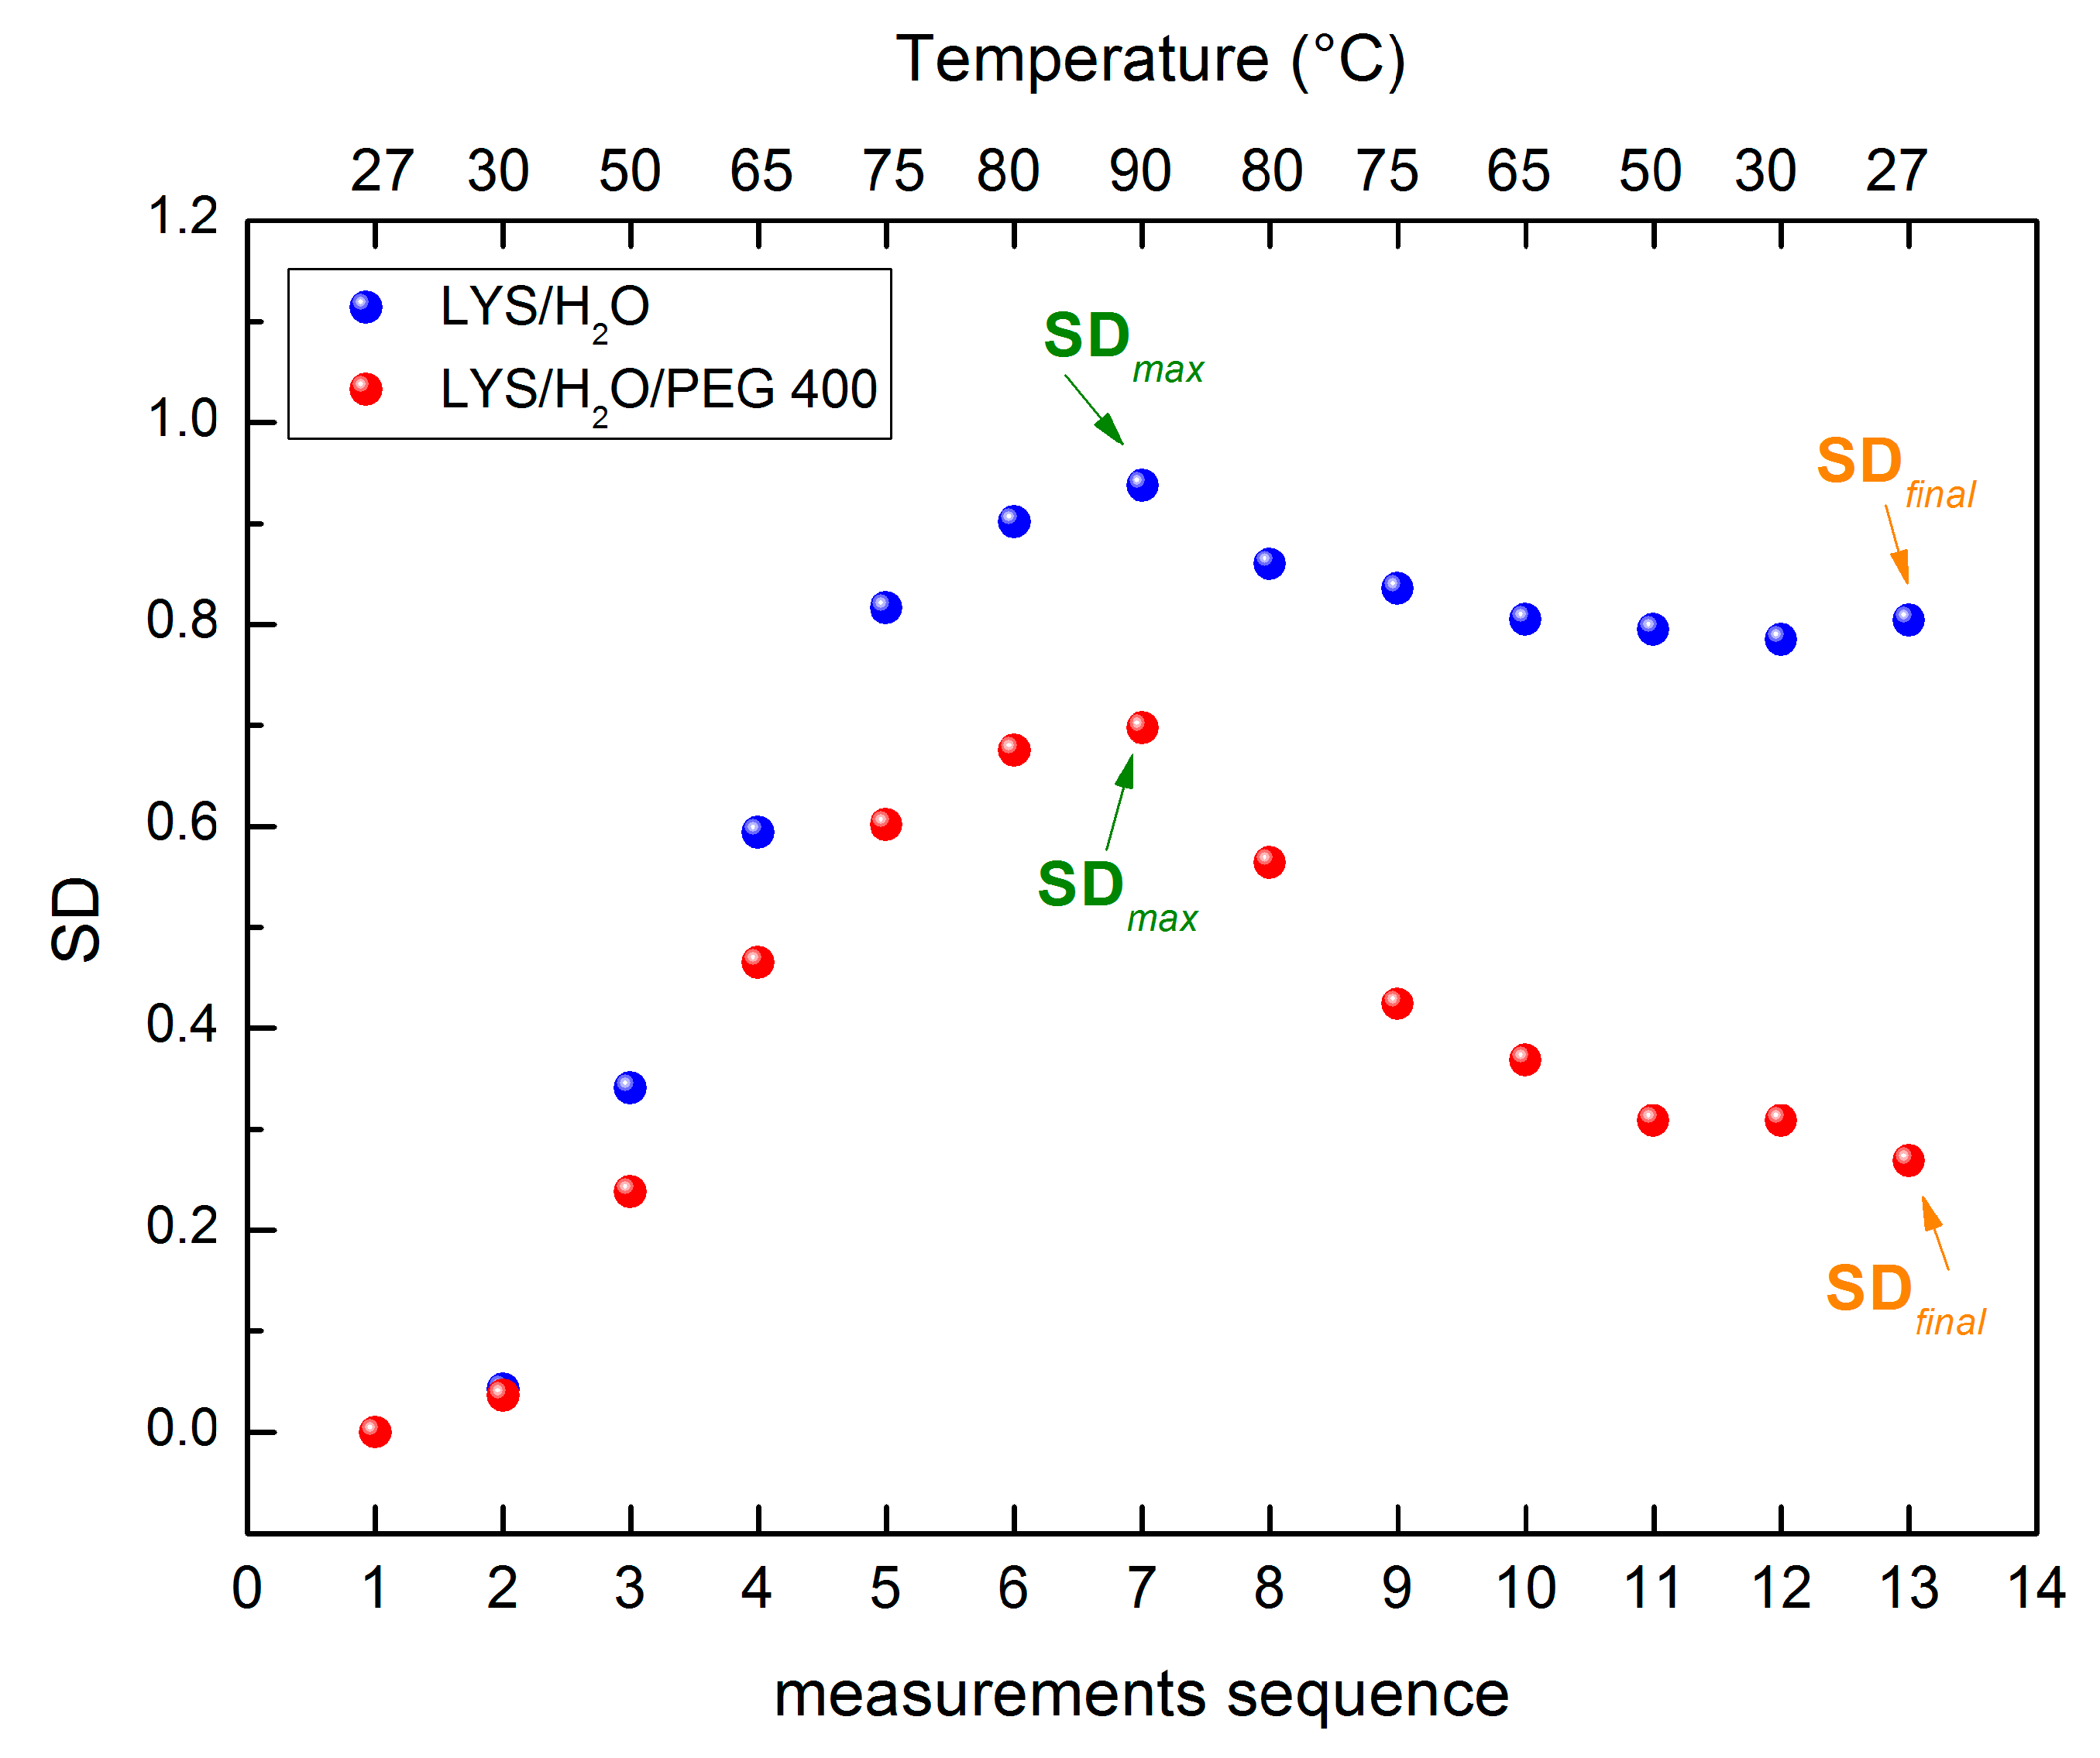
In order to characterize the thermal effects of our systems we have performed measurements not only following an increasing temperature ramp, but also during a further decreasing temperature ramp. On that score we introduce a new quantity that we call spectral thermal resilience, which is connected to the capability to recover the original spectral features after a thermal stress cycle. Therefore, the SD values for the two investigated systems have been calculated both for the increasing and the decreasing temperature ramps.
Figure 6 reports the behavior of the calculated SD values during the full temperature cycle. The blue full circles represent the SD values obtained for the Lysozyme aqueous solution while the magenta full circles represent the SD values of Lysozyme aqueous solution in the presence of PEG 400. The label from 1 to 13 in the y-axes represents the sequence of the performed measurements from 27 °C to 90 °C, and then from 90 °C to 27 °C.
By indicating with S D m a x the maximum value of SD and with S D f i n a l the final value of SD, we can define a spectral thermal resilience parameter by means of the following formula:
S R = S D m a x S D f i n a l S D m a x
For our systems, the value of the spectral thermal resilience is 0.19 for the aqueous solution of Lysozyme while it is 0.61 for the Lysozyme aqueous solution in presence of PEG 400. Such a result confirms what it emerges from the thermal restraint parameter i.e., that the addition of PEG 400 to aqueous solution of Lysozyme increases the system capability to afford temperature stress, as well as indicates a higher capability to recover the original properties [56,57,58,59,60].

3. Experimental Setup and Sample Preparation

Lysozyme, PEG with Mw of 400 corresponding to values of the polymerization degree m = 8, and distilled water were purchased from Aldrich-Chemie. FT-IR data were collected both increasing and decreasing temperature in the 20 °C ÷ 90 °C range.
The investigated concentration values are expressed in percentage by weight; for the binary system, 70% of Lysozyme and 30% of water, while for the ternary system, 70% of Lysozyme and 30% of (50% water + 50% PEG 400).
To collect the IR spectra a FTIR-Vertex 70 V (Bruker Optics, Germany) spectrometer by Bruker Optics using a Platinum diamond ATR has been employed. Previously, to interpretate the spectra, some data preprocessing has been applied by means of Bruker OPUS/Mentor software (Bruker Optics, Germany) and MATLAB environment. More precisely, in order to reduce the variations between spectra due to baseline shift, a baseline treatment has been performed; to decrease the instrumental noise, a smoothing treatment has been applied; and, finally, in order to correct the path length variation and to decrease the variations among each measurement, a normalization of spectra has been taken into account. To confirm the caliber and accuracy of spectral data, a performance qualification (PQ) test using the fully automated validation program of OPUS 7.5 software (furnished by Bruker Optics) was carried out. The ATR diamond crystal’s surface was in direct contact with the deparaffinized breast tissue slices (2 mm × 2 mm), and the mid-IR range of 4000 cm−1 to 400 cm−1 was transmitted to and from the ATR accessory. To acquire a suitable signal-to-noise ratio, spectra were created at a spatial resolution of 0.4 cm−1, and an average of 48 scans was collected [61,62,63]. Each sample’s background spectrum was collected before it was scanned, and the software used this spectrum to routinely remove ambient effects. More precisely, we have performed 48 scans for each of the 13 measurements by means of the Vertex 70v Bruker IR spectrometer; thanks to the temperature sensor set in the instrument and by means of OPUS software we have been able to change the values of temperature from 27 °C to 90 °C and from 90 °C to 27 °C. In particular, at first, we increase the temperature from the first spectrum at 27 °C, then the second at 30 °C, the third at 50 °C, the forth at 65 °C, the fifth at 75 °C, the sixth at 80 °C and the seventh at 90 °C, then, we decrease the values temperature, obtaining the eighth at 80 °C, the nineth at 75 °C, the tenth at 65 °C, the eleventh at 65 °C, the twelfth at 50 °C and the thirteenth, the last, at 27 °C.

4. Conclusions

IR absorption data collected on Lysozyme aqueous solutions also in the presence of PEG 400 as a function of temperature have been analyzed by evaluating the SD.
Concerning the increasing temperature ramp, to extract quantitative information on the system thermal response, the SD values as a function of temperature have been fitted by means of sigmoid curve which allowed to extract the sigmoid amplitude, which is connected to the value of thermal restraint, the sigmoid steepness, and T 0 the relaxational temperature. Such an analysis shows that for the binary system, that value of amplitude is higher, whereas the value of temperature is   lower   for the binary system in respect to the ternary system. The obtained result shows that the addition of PEG 400 to Lysozyme, gives rise to smaller changes in the features of the registered spectra suggesting that the aqueous solution of Lysozyme in the presence of PEG 400 are more resistant to the temperature changes. The obtained results are in line with previous experiments performed by Raman scattering on Lysozyme/water/bioprotectant systems that have evidenced a similar sigmoid behavior for the protein Amide I center frequencies.
Furthermore, we have introduced a spectral thermal resilience parameter which has been connected to the capability to recover the original spectral features after a thermal stress cycle. The value obtained for the spectral thermal resilience parameter indicates that the addition of PEG 400 to aqueous solution of Lysozyme increases the system capability to afford temperature stress, as well as indicating a higher capability to recover the original properties.

Author Contributions

Conceptualization, M.T.C. and S.M.; methodology, M.T.C. and S.M.; validation, M.T.C. and S.M.; formal analysis, M.T.C. and S.M.; investigation, M.T.C. and S.M.; data curation, M.T.C. and S.M.; writing—original draft preparation, M.T.C. and S.M.; writing—review and editing, M.T.C. and S.M. All authors have read and agreed to the published version of the manuscript.

Funding

This research received no external funding.

Institutional Review Board Statement

Not applicable.

Informed Consent Statement

Not applicable.

Data Availability Statement

The data presented in this study are available on request from the corresponding author.

Conflicts of Interest

The authors declare no conflict of interest.

Sample Availability

Samples of the compounds are not available from the authors.

References

  1. Zhang, Y.; Lane, M.E.; Moore, D.J. An Investigation of the Influence of PEG 400 and PEG-6-Caprylic/Capric Glycerides on Dermal Delivery of Niacinamide. Polymers 2020, 12, 2907. [Google Scholar] [CrossRef] [PubMed]
  2. Almásy, L.; Artykulnyi, O.P.; Petrenko, V.I.; Ivankov, O.I.; Bulavin, L.A.; Yan, M.; Haramus, V.M. Structure and Intermolecular Interactions in Aqueous Solutions of Polyethylene Glycol. Molecules 2022, 27, 2573. [Google Scholar] [CrossRef] [PubMed]
  3. Ali, M.E.; Lamprecht, A. Polyethylene glycol as an alternative polymer solvent for nanoparticle preparation. Int. J. Pharm. 2013, 45, 135–142. [Google Scholar] [CrossRef] [PubMed]
  4. Kumar, A.; Kulkarni, P.S.; Samui, A.B. Polyethylene glycol grafted cotton as phase change polymer. Cellulose 2014, 21, 685–696. [Google Scholar] [CrossRef]
  5. Caccamo, M.T.; Cannuli, A. PEG Acoustic Levitation Treatment for Historic Wood Preservation investigated by means of FTIR spectroscopy. Curr. Chem. Biol. 2019, 13, 60–72. [Google Scholar] [CrossRef]
  6. Caccamo, M.T.; Cannuli, A.; Calabrò, E.; Magazù, S. Acoustic Levitator Power Device: Study of Ethylene-Glycol Water Mixtures. IOP Conf. Ser. Mater. Sci. Eng. ACPEE 2017, 199, 012119. [Google Scholar] [CrossRef] [Green Version]
  7. Maitz, M.F. Applications of synthetic polymers in clinical medicine. Biosurf. Biotrib. 2015, 1, 161–176. [Google Scholar] [CrossRef] [Green Version]
  8. Yamaguchi, Y.; Li, Z.; Zhu, X.; Liu, C.; Zhang, D.; Dou, X. Polyethylene Oxide (PEO) and Polyethylene Glycol (PEG) Polymer Sieving Matrix for RNA Capillary Electrophoresis. PLoS ONE 2015, 10, e0123406. [Google Scholar]
  9. Herzberger, J.; Niederer, K.; Pohlit, H.; Seiwert, J.; Worm, M.; Wurm, F.R.; Frey, H. Polymerization of Ethylene Oxide, Propylene Oxide, and Other Alkylene Oxides: Synthesis, Novel Polymer Architectures, and Bioconjugation. Chem. Rev. 2016, 116, 2170–2243. [Google Scholar] [CrossRef] [Green Version]
  10. Faraone, A.; Magazù, S.; Maisano, G.; Ponterio, R.; Villari, V. Experimental Evidence of Slow Dynamics in Semidilute Polymer Solutions. Macromolecules 1999, 32, 1128–1133. [Google Scholar] [CrossRef]
  11. Caccamo, M.T.; Magazù, S. Tagging the oligomer-to-polymer crossover on EG and PEGs by infrared and Raman spectroscopies and by wavelet cross-correlation spectral analysis. Vib. Spectr. 2016, 85, 222–227. [Google Scholar] [CrossRef]
  12. Temenoff, J.S.; Athanasiou, K.A.; Le Baron, R.G.; Mikos, A.G. Effect of poly(ethylene glycol) molecular weight on tensile and swelling properties of oligo(poly(ethylene glycol) fumarate) hydrogels for cartilage tissue engineering. J. Biomed. Mater. Res. 2002, 59, 429–437. [Google Scholar] [CrossRef] [PubMed]
  13. D’souza, A.A.; Shegokar, R. Polyethylene glycol (PEG): A versatile polymer for pharmaceutical applications. Expert Opin. Drug Deliv. 2016, 13, 1257–1275. [Google Scholar] [CrossRef] [PubMed]
  14. Irving, C.S.; Lifschitz, C.H.; Marks, L.M.; Nichols, B.L.; Klein, P.; Lisa, M.; Buford, L. Peter, D. Polyethylene glycol polymers of low molecular weight as probes of intestinal permeability. I. Innovations in analysis and quantitation. J. Lab. Clin. Med. 1986, 107, 290–298. [Google Scholar] [PubMed]
  15. Caccamo, M.T.; Mavilia, G.; Mavilia, L.; Lombardo, D.; Magazù, S. Self-assembly Processes in Hydrated Montmorillonite by FTIR Investigations. Materials 2020, 13, 1100. [Google Scholar] [CrossRef] [PubMed] [Green Version]
  16. Arshad, M.; Zubair, M.; Rahman, S.S.; Ullah, A. Chapter 14-Polymers for advanced applications. In Polymer Science and Nanotechnology; Narain, R., Ed.; Elsevier: Amsterdam, The Netherlands, 2020; pp. 325–340. [Google Scholar]
  17. Wu, W.; Wang, W.; Li, J. Star polymers: Advances in biomedical applications. Progress Polym. Sci. 2015, 46, 55–85. [Google Scholar] [CrossRef]
  18. Ma, T.Y.; Hollander, D.; Krugliak, P.; Katz, K. PEG 400, a hydrophilic molecular probe for measuring intestinal permeability. Gastroent 1990, 98, 39–46. [Google Scholar] [CrossRef] [PubMed]
  19. Hermansky, S.J.; Neptun, D.A.; Loughran, K.A.; Leung, H.W. Effects of polyethylene glycol 400 (PEG 400) following 13 weeks of gavage treatment in fischer-344 rats. Food Chem. Toxic. 1995, 33, 139–149. [Google Scholar] [CrossRef]
  20. Chadwich, V.S.; Phillips, S.F.; Hoffman, A.F. Measurements of intestinal permeability using low molecular weight polyethylene glycols (PEG 400). I. Chemical analysis and biological properties of PEG 400. Gastroent 1977, 73, 241–246. [Google Scholar] [CrossRef]
  21. Cho, C.H.; Hui, W.M.; Liao, N.X.; Liu, X.G.; Lam, S.K.; Ogle, C.W. Polyethylene glycol: Its adverse gastric effects in rats. J. Pharm. Pharmacol. 1992, 44, 518–520. [Google Scholar] [CrossRef]
  22. Bončina, M.; Reščič, J.; Vlachy, V. Solubility of lysozyme in polyethylene glycol-electrolyte mixtures: The depletion interaction and ion-specific effects. Biophys. J. 2008, 95, 1285–1294. [Google Scholar] [CrossRef] [PubMed]
  23. Morgenstern, J.; Baumann, P.; Brunner, C.; Hubbuch, J. Effect of PEG molecular weight and PEGylation degree on the physical stability of PEGylated lysozyme. Int. J. Pharm. 2017, 519, 408–417. [Google Scholar] [CrossRef] [PubMed]
  24. Malzert, A.; Boury, F.; Renard, D.; Robert, P.; Lavenant, L.; Benoît, J.P.; Proust, J.E. Spectroscopic studies on poly(ethylene glycol)-lysozyme interactions. Int. J. Pharm. 2003, 260, 175–186. [Google Scholar] [CrossRef] [PubMed]
  25. Hamsa Priya, M.; Pratt, L.R.; Paulaitis, M.E. Effect of PEG End-Group Hydrophobicity on Lysozyme Interactions in Solution Characterized by Light Scattering. Langmuir 2011, 27, 13713–13718. [Google Scholar] [CrossRef]
  26. Wu, J.; Wang, Z.; Lin, W.; Chen, S. Investigation of the interaction between poly(ethylene glycol) and protein molecules using low field nuclear magnetic resonance. Acta Biomat. 2013, 9, 6414–6420. [Google Scholar] [CrossRef]
  27. Fenimore, P.W.; Frauenfelder, H.; Magazù, S.; McMahon, B.H.; Mezei, F.; Migliardo, F.; Young, R.D.; Stroe, I. Concepts and problems in protein dynamics. Chem. Phys. 2013, 424, 2–6. [Google Scholar] [CrossRef]
  28. Jollès, P.; Jollès, J. What’s new in lysozyme research? Mol. Cell. Biochem. 1984, 63, 165–189. [Google Scholar] [CrossRef]
  29. Wang, Z.; Hu, S.; Gao, Y.; Ye, C.; Wang, H. Effect of collagen-lysozyme coating on fresh-salmon fillets preservation. LWT 2017, 75, 59–64. [Google Scholar] [CrossRef]
  30. Boikova, A.S.; D’yakova, Y.A.; Il’ina, K.B.; Konarev, P.V.; Kryukova, A.E.; Marchenkova, M.A.; Blagov, A.E.; Pisarevskii, Y.V.; Koval’chuk, M.V. Small-angle X-ray scattering study of the influence of solvent replacement (from H2O to D2O) on the initial crystallization stage of tetragonal lysozyme. Crystallogr. Rep. 2017, 62, 837–842. [Google Scholar] [CrossRef]
  31. Phillips, D.C. The three-dimensional structure of an enzyme molecule. Sci. Am. 1966, 215, 78–90. [Google Scholar] [CrossRef]
  32. Wu, T.; Jiang, Q.; Wu, D.; Hu, Y.; Chen, S.; Ding, T.; Ye, X.; Liu, D.; Chen, J. What is new in lysozyme research and its application in food industry? A review. Food Chem. 2019, 274, 698–709. [Google Scholar] [CrossRef] [PubMed]
  33. Leśnierowski, G. Lysozyme and its modified forms: Properties, potential for its production and application. In Handbook of Eggs in Human Function; Wageningen Academic Publishers: Wageningen, The Netherlands, 2005; pp. 624–630. [Google Scholar]
  34. Silvetti, T.; Brasca, M.; Lodi, R.; Vanoni, L.; Chiolerio, F.; De Groot, M.; Bravi, A. Effects of lysozyme on the microbiological stability and organoleptic properties of unpasteurized beer. J. Inst. Brew. 2010, 116, 33–40. [Google Scholar] [CrossRef]
  35. Caccamo, M.T.; Magazù, S. Intramolecular OH stretching analysis of hydrated lysozyme in presence of trehalose by IR spectroscopy. Atti Accad. Pelor. Peric. 2019, S1, A2. [Google Scholar]
  36. Bloustine, J.; Virmani, T.; Thurston, G.M.; Fraden, S. Light scattering and phase behavior of lysozyme-poly (ethylene glycol) mixtures. Phys. Rev. Lett. 2006, 96, 087803. [Google Scholar] [CrossRef] [Green Version]
  37. Tan, H.; Jin, D.; Qu, X.; Liu, H.; Chen, X.; Yin, M.; Liu, C. A PEG-Lysozyme hydrogel harvests multiple functions as a fit-to-shape tissue sealant for internal-use of body. Biomaterials 2019, 192, 392–404. [Google Scholar] [CrossRef]
  38. Stuart, B.H. Infrared Spectroscopy: Fundamentals and Applications; John Wiley & Sons: Hoboken, NJ, USA, 2004. [Google Scholar]
  39. Migliardo, F.; Magazù, S.; Caccamo, M.T. Infrared, Raman and INS Studies of Poly-Ethylene Oxide Oligomers. J. Mol. Struc. 2013, 1048, 261–266. [Google Scholar] [CrossRef]
  40. Ferrari, M.; Mottola, L.; Quaresima, V. Principles, techniques, and limitations of near infrared spectroscopy. Can. J. Appl. Phys. 2004, 29, 463–487. [Google Scholar] [CrossRef] [Green Version]
  41. Magazù, S.; Calabrò, E.; Caccamo, M.T. Experimental study of thermal restraint in bio-protectant disaccharides by FTIR spectroscopy. Open Biotech. 2018, 12, 123–133. [Google Scholar] [CrossRef]
  42. Shi, Z.; Cogdill, R.P.; Short, S.M.; Anderson, C.A. Process characterization of powder blending by near-infrared spectroscopy: Blend end-points and beyond. J. Pharm. Biom. Anal. 2008, 47, 738–745. [Google Scholar] [CrossRef]
  43. Lavine, B.; Almirall, J.; Muehlethaler, C.; Neumann, C.; Workman, J. Criteria for comparing infrared spectra—A review of the forensic and analytical chemistry literature. Foren. Chem. 2020, 18, 100224. [Google Scholar] [CrossRef]
  44. Caccamo, M.T.; Magazù, S. A Conic Pendulum of Variable Length Analysed by wavelets. In New Trends in Physics Education Research; Nova Science Publishers, Inc.: Hauppauge, NY, USA, 2018; pp. 117–131. ISBN 978-1-53613-893-1. [Google Scholar]
  45. Shah, N.K.; Gemperline, P.J. Combination of the Mahalanobis distance and residual variance pattern recognition techniques for classification of near-infrared reflectance spectra. Analyt. Chem. 1990, 62, 465–470. [Google Scholar] [CrossRef]
  46. Caccamo, M.T.; Gugliandolo, C.; Zammuto, V.; Magazù, S. Thermal properties of an exopolysaccharide produced by a marine thermotolerant Bacillus licheniformis by ATR-FTIR spectroscopy. Int. J. Biol. Macromol. 2020, 145, 77–83. [Google Scholar] [CrossRef] [PubMed]
  47. Caccamo, M.T.; Magazù, S. Thermal restraint on PEG-EG mixtures by FTIR investigations and wavelet cross-correlation analysis. Pol. Test. 2017, 62, 311–318. [Google Scholar] [CrossRef]
  48. Abhinandan, B.; Blasiak, B.; Pasquier, E.; Boguslaw, T.; Trudel, S. Synthesis, characterization, and evaluation of PEGylated first-row transition metal ferrite nanoparticles as T2 contrast agents for high-field MRI. RSC Adv. 2017, 7, 38125–38134. [Google Scholar]
  49. Kamyar, S.; Mansor, A.; Jazayeri, S.D.; Sedaghat, S.; Shabanzadeh, P.; Jahangirian, H.; Shahri, M.M.; Abdollahi, Y. Synthesis and Characterization of Polyethylene Glycol Mediated Silver Nanoparticles by the Green Method. Int. J. Mol. Sci. 2012, 13, 6639–6650. [Google Scholar]
  50. Kun, D.; Sun, J.; Song, X.; Chen, H.; Wei, A.F.; Peijun, J. Interaction of Ionic Liquid [bmin][CF3SO3] with Lysozyme Investigated by Two-Dimensional Fourier Transform Infrared Spectroscopy. ACS Sust. Chem. Eng. 2014, 2, 1420–1428. [Google Scholar]
  51. Carlucio, A.C.; Pimenta, M.G.R.; Vieira, R.H.S.F.; Furtado, R.; Guedes, M.I.F.; Rui, S.; Odilio, B.G.A. Practical use of immobilized lysozyme for the remediation process of Escherichia coli in aqueous solution. Electron. J. Biotechnol. 2007, 10. [Google Scholar]
  52. Lawrence, G.; Baskar, A.V.; El-Newehy, M.H.; Cha, W.S.; Al-Deyab, S.S.; Ajayan, V. Quick high-temperature hydrothermal synthesis of mesoporous materials with 3D cubic structure for the adsorption of lysozyme. Sci. Technol. Adv. Mater. 2015, 16, 024806. [Google Scholar] [CrossRef]
  53. Hédoux, A.; Willart, J.F.; Ionov, R.; Affouard, F.; Guinet, Y.; Paccou, L.; Lerbret, A.; Descamps, M. Analysis of sugar bioprotective mechanisms on the thermal denaturation of lysozyme from Raman scattering and differential scanning calorimetry investigations. J. Phys. Chem. B 2006, 110, 22886–22893. [Google Scholar] [CrossRef]
  54. Lombardo, D.; Calandra, P.; Caccamo, M.T.; Magazù, S.; Pasqua, L.; Kiselev, M.A. Interdisciplinary approaches to the study of biological membranes. AIMS Biophys. 2020, 7, 267–290. [Google Scholar] [CrossRef]
  55. Caccamo, M.T.; Magazù, S. Multiscaling Wavelet Analysis of Infrared and Raman Data on Polyethylene Glycol 1000 Aqueous Solutions. Spectr. Lett. 2017, 50, 130–136. [Google Scholar] [CrossRef]
  56. Chambers Jeanne, C.; Allen Craig, R.; Cushman Samuel, A. Operationalizing Ecological Resilience Concepts for Managing Species and Ecosystems at Risk. Front. Ecol. Evol. 2019, 7, 241. [Google Scholar] [CrossRef] [Green Version]
  57. Feder, A.; Fred-Torres, S.; Southwick, S.M.; Charney, D.S. The Biology of Human Resilience: Opportunities for Enhancing Resilience Across the Life Span. Biol. Psych. 2019, 86, 443–453. [Google Scholar] [CrossRef] [PubMed]
  58. Liu, H.; Zhang, C.; Ji, Y.; Yang, L. Biological and Psychological Perspectives of Resilience: Is It Possible to Improve Stress Resistance? Front. Hum. Neurosci. 2018, 12, 326. [Google Scholar] [CrossRef] [PubMed] [Green Version]
  59. Ruud, J.R.; Hartigh, D.; Hill, Y. Conceptualizing and measuring psychological resilience: What can we learn from physics? New Ideas Psych. 2022, 66, 100934. [Google Scholar]
  60. Saenz de Miera, L.E.; Pinto, R.; Calvo, L.; Ansola, G. A new index of resilience applicable to external pulse-disturbances that considers the recovery of communities in the short term. Ecol. Indic. 2021, 130, 108051. [Google Scholar] [CrossRef]
  61. Zhang, X.; Xu, Y.; Zhang, Y.; Wang, L.; Hou, C.; Zhou, X.; Ling, X.; Xu, Z. Intraoperative detection of thyroid carcinoma by fourier transform infrared spectrometry. J. Surg. Res. 2011, 171, 650–656. [Google Scholar] [CrossRef]
  62. Wu, M.; Zhang, W.; Tian, P.; Ling, X.; Xu, Z. Intraoperative diagnosis of thyroid diseases by fourier transform infrared spectroscopy based on support vector machine. Int. J. Clin. Exp. Med. 2016, 9, 2351–2358. [Google Scholar]
  63. Bhosale, J.S. High signal-to-noise Fourier transform spectroscopy with light emitting diode sources. Rev. Sci. Instrum. 2011, 82, 093103. [Google Scholar] [CrossRef]
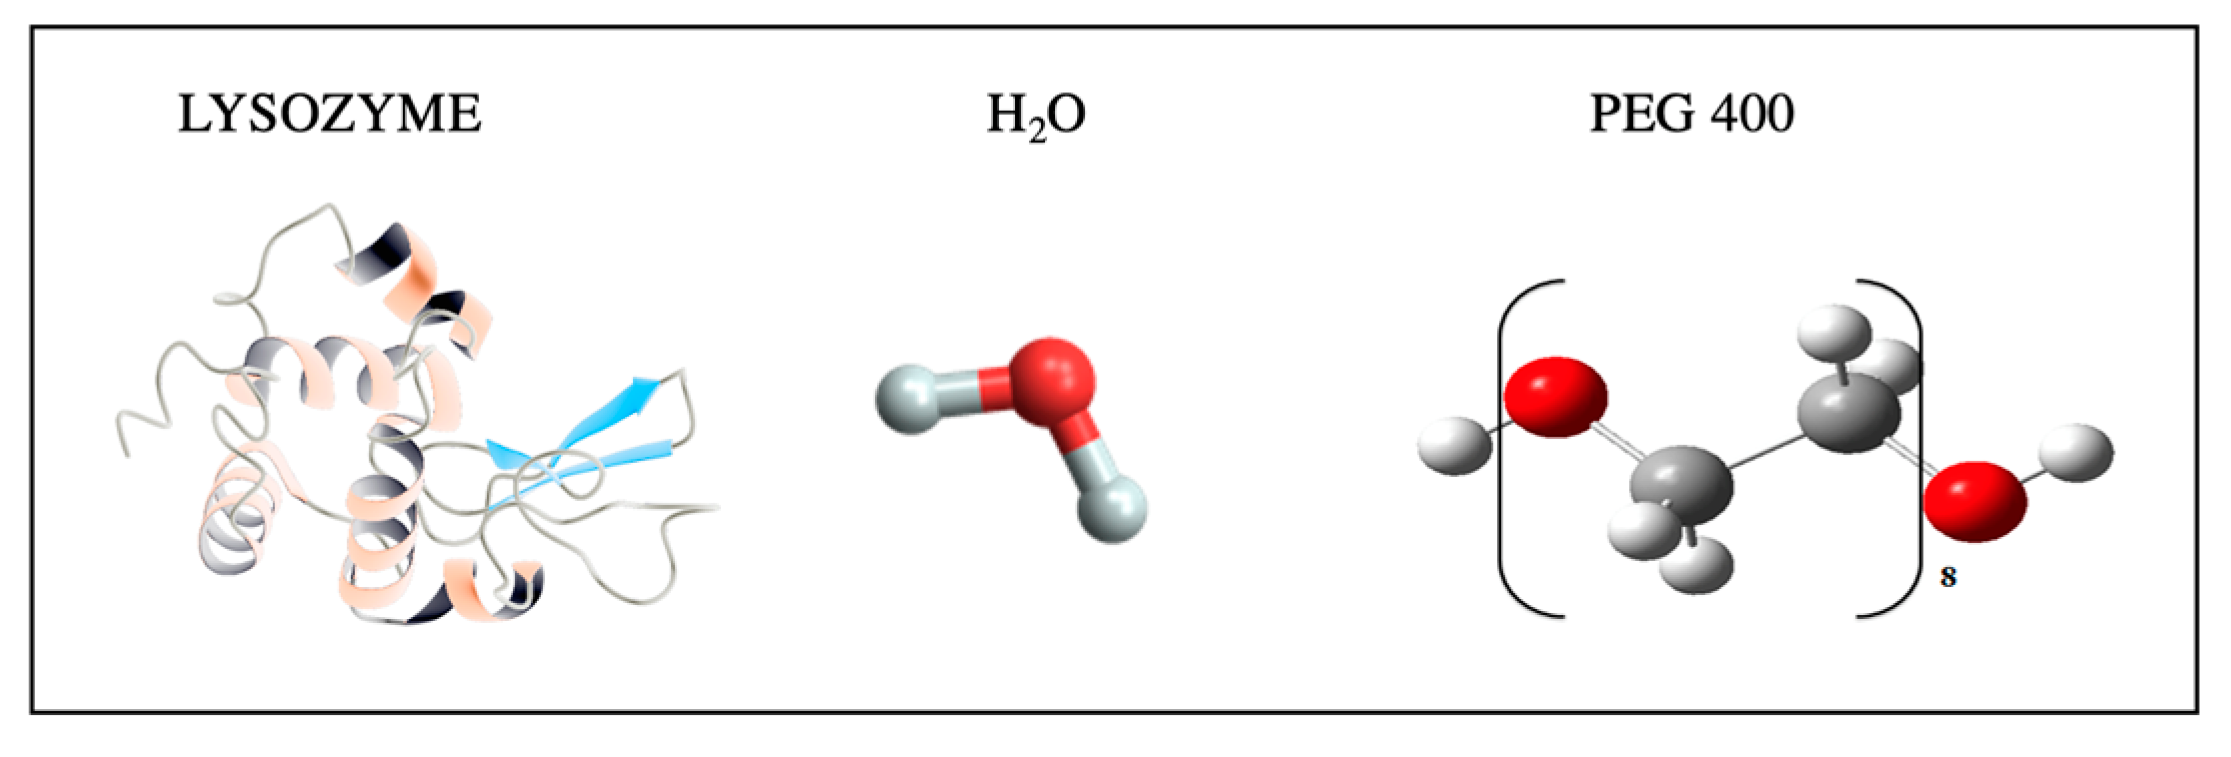
Figure 1. Molecular structures of H2O, PEG 400, and Lysozyme.
Molecules 27 08760 g001
Figure 2. IR spectrum of PEG400 with band assignation; in particular, the peak at ~ 2869 cm−1 is attributed to -CH stretching, ~ 1456 cm−1 and ~ 1353 cm−1 is attributed to C-H bending, and ~ 1061 cm−1 is attributed to C-O stretching.
Molecules 27 08760 g002
Figure 3. IR spectrum of Lysozyme with the assignation of Amide I and Amide II, at 1638 cm−1 and 1529 cm−1, respectively.
Molecules 27 08760 g003
Figure 4. FTIR spectra of aqueous solution of Lysozyme (a) and FTIR spectra of aqueous solution of Lysozyme in presence of PEG400 (b) in the 400 < Δ ω < 4000 cm−1 spectral range at T = 27 °C, T = 90 °C and again at T = 27 °C, i.e., after that both the systems were brought to a temperature of 90 °C.
Molecules 27 08760 g004
Figure 5. SD values, with error bars, as a function of temperature from 27 °C   to   90 °C for (a) the binary system, i.e., Lysozyme/water, and (b) for the ternary system, i.e., Lysozyme/water/PEG 400. The obtained SD values as a function of temperature fulfil an increasing sigmoid behavior and have been fitted by means of Equation (2) which furnishes three parameter values, A , B and T 0 .
Molecules 27 08760 g005
Figure 6. Calculated SD values during the full temperature cycle. The blue full circles refer to the SD values obtained for the Lysozyme aqueous solution while the magenta full circles refer to the SD values of Lysozyme aqueous solution in the presence of PEG 400. The label from 1 to 13 in the y-axes represents the sequence of the performed measurements, i.e., 1 = 27 °C, 2 = 30 °C, 3 = 50 °C, 4 = 65 °C, 5 = 75 °C, 6 = 80 °C, 7 = 90 °C, 8 = 80 °C, 9 = 70 °C, 10 = 65 °C, 11 = 50 °C, 12 = 30 °C, and 13 = 27 °C.
Molecules 27 08760 g006
Table 1. Values of Amplitude (A), Steepness (B) and Temperature ( T 0 ) extracted from Equation (2) for the two investigated systems.
AmplitudeSteepnessTemperature (°C)
Lysozyme/H2O0.975−0.0128355.32
Lysozyme/H2O/PEG 4000.697−0.0157758.55
Publisher’s Note: MDPI stays neutral with regard to jurisdictional claims in published maps and institutional affiliations.