


Chemical Stability Study of H1 Antihistaminic Drugs from the First and the Second Generations, Diphenhydramine, Azelastine and Bepotastine, in Pure APIs and in the Presence of Two Excipients, Citric Acid and Polyvinyl Alcohol


Abstract
1. Introduction
2. Results and Discussion
2.1. Degradation in Solutions and Kinetics
2.1.1. Methods for Quantitative Measurements
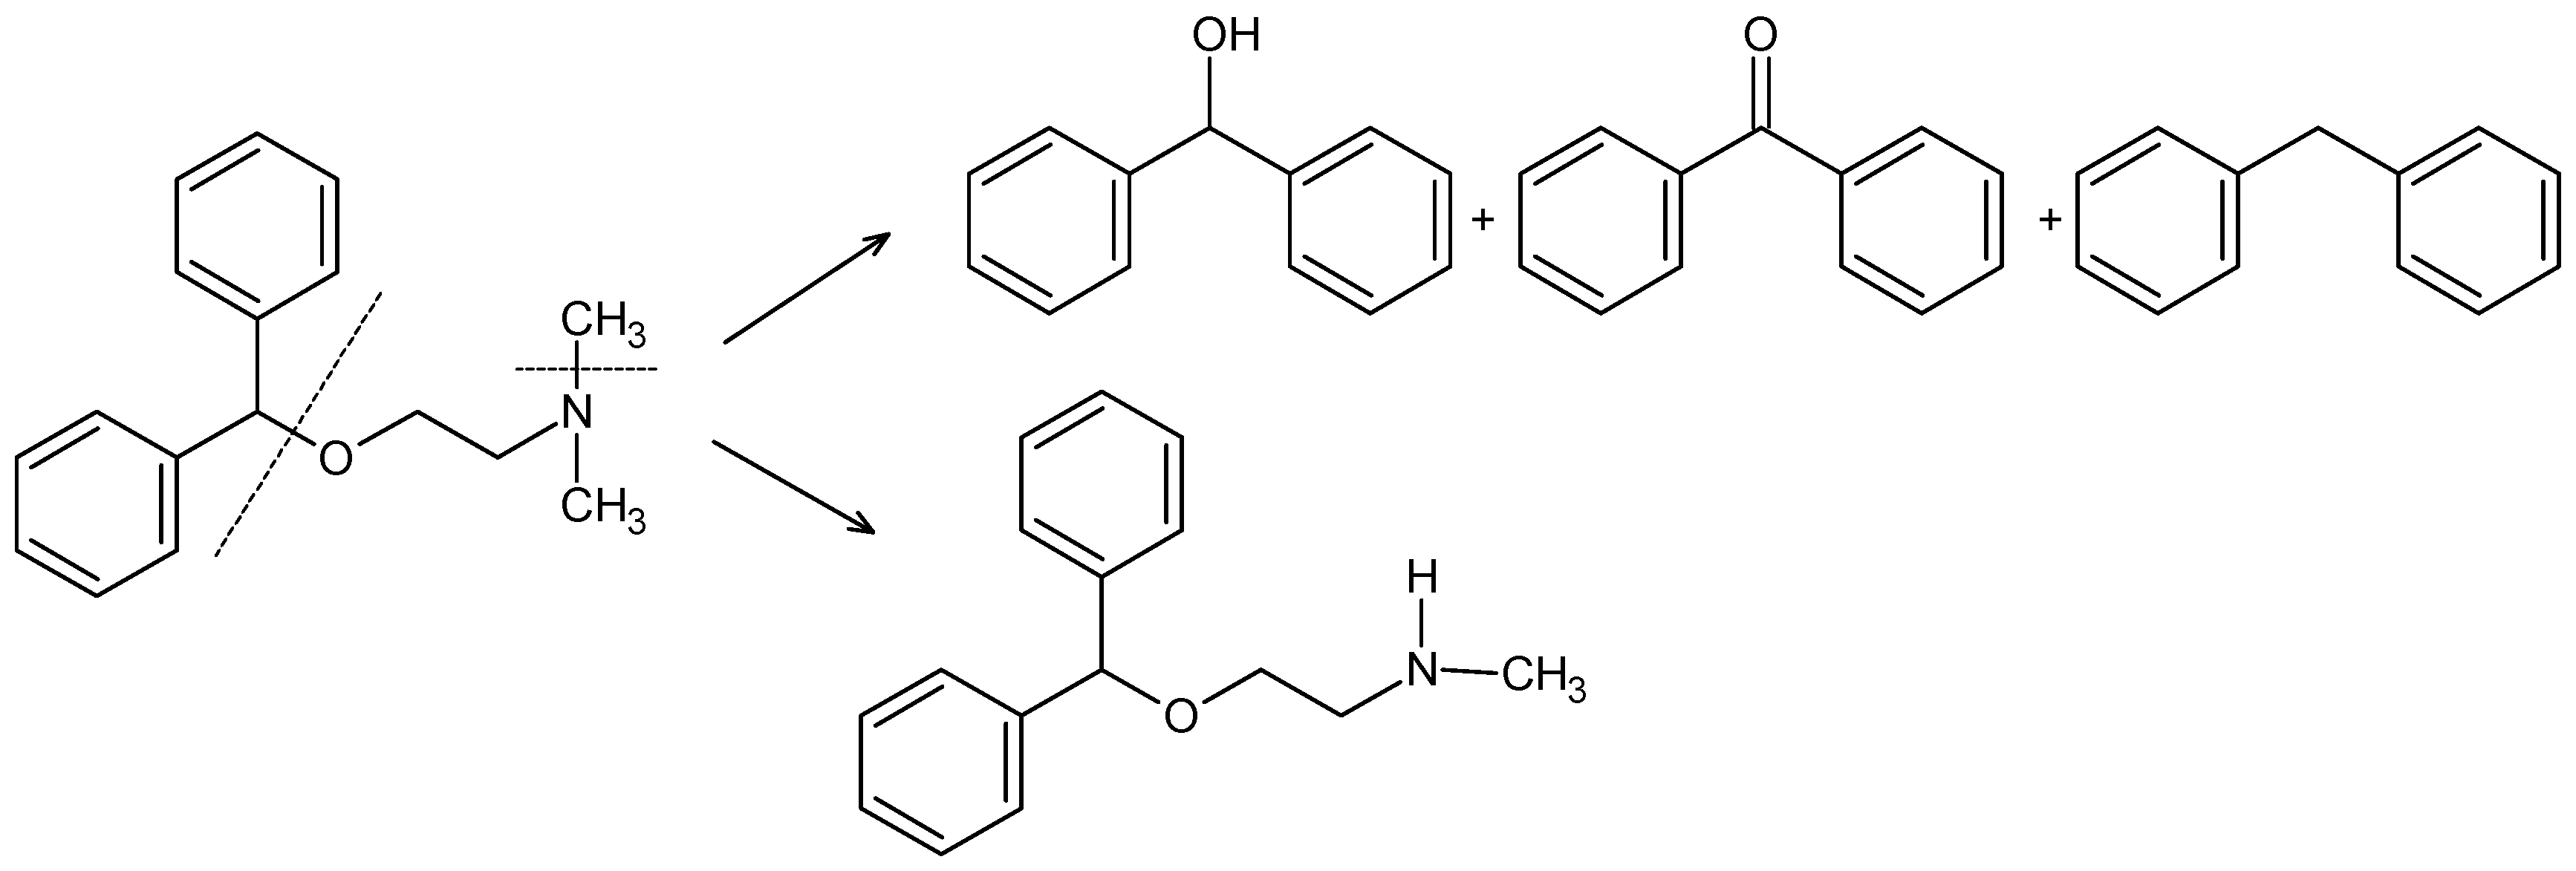
2.1.2. Thermal Degradation in Solutions
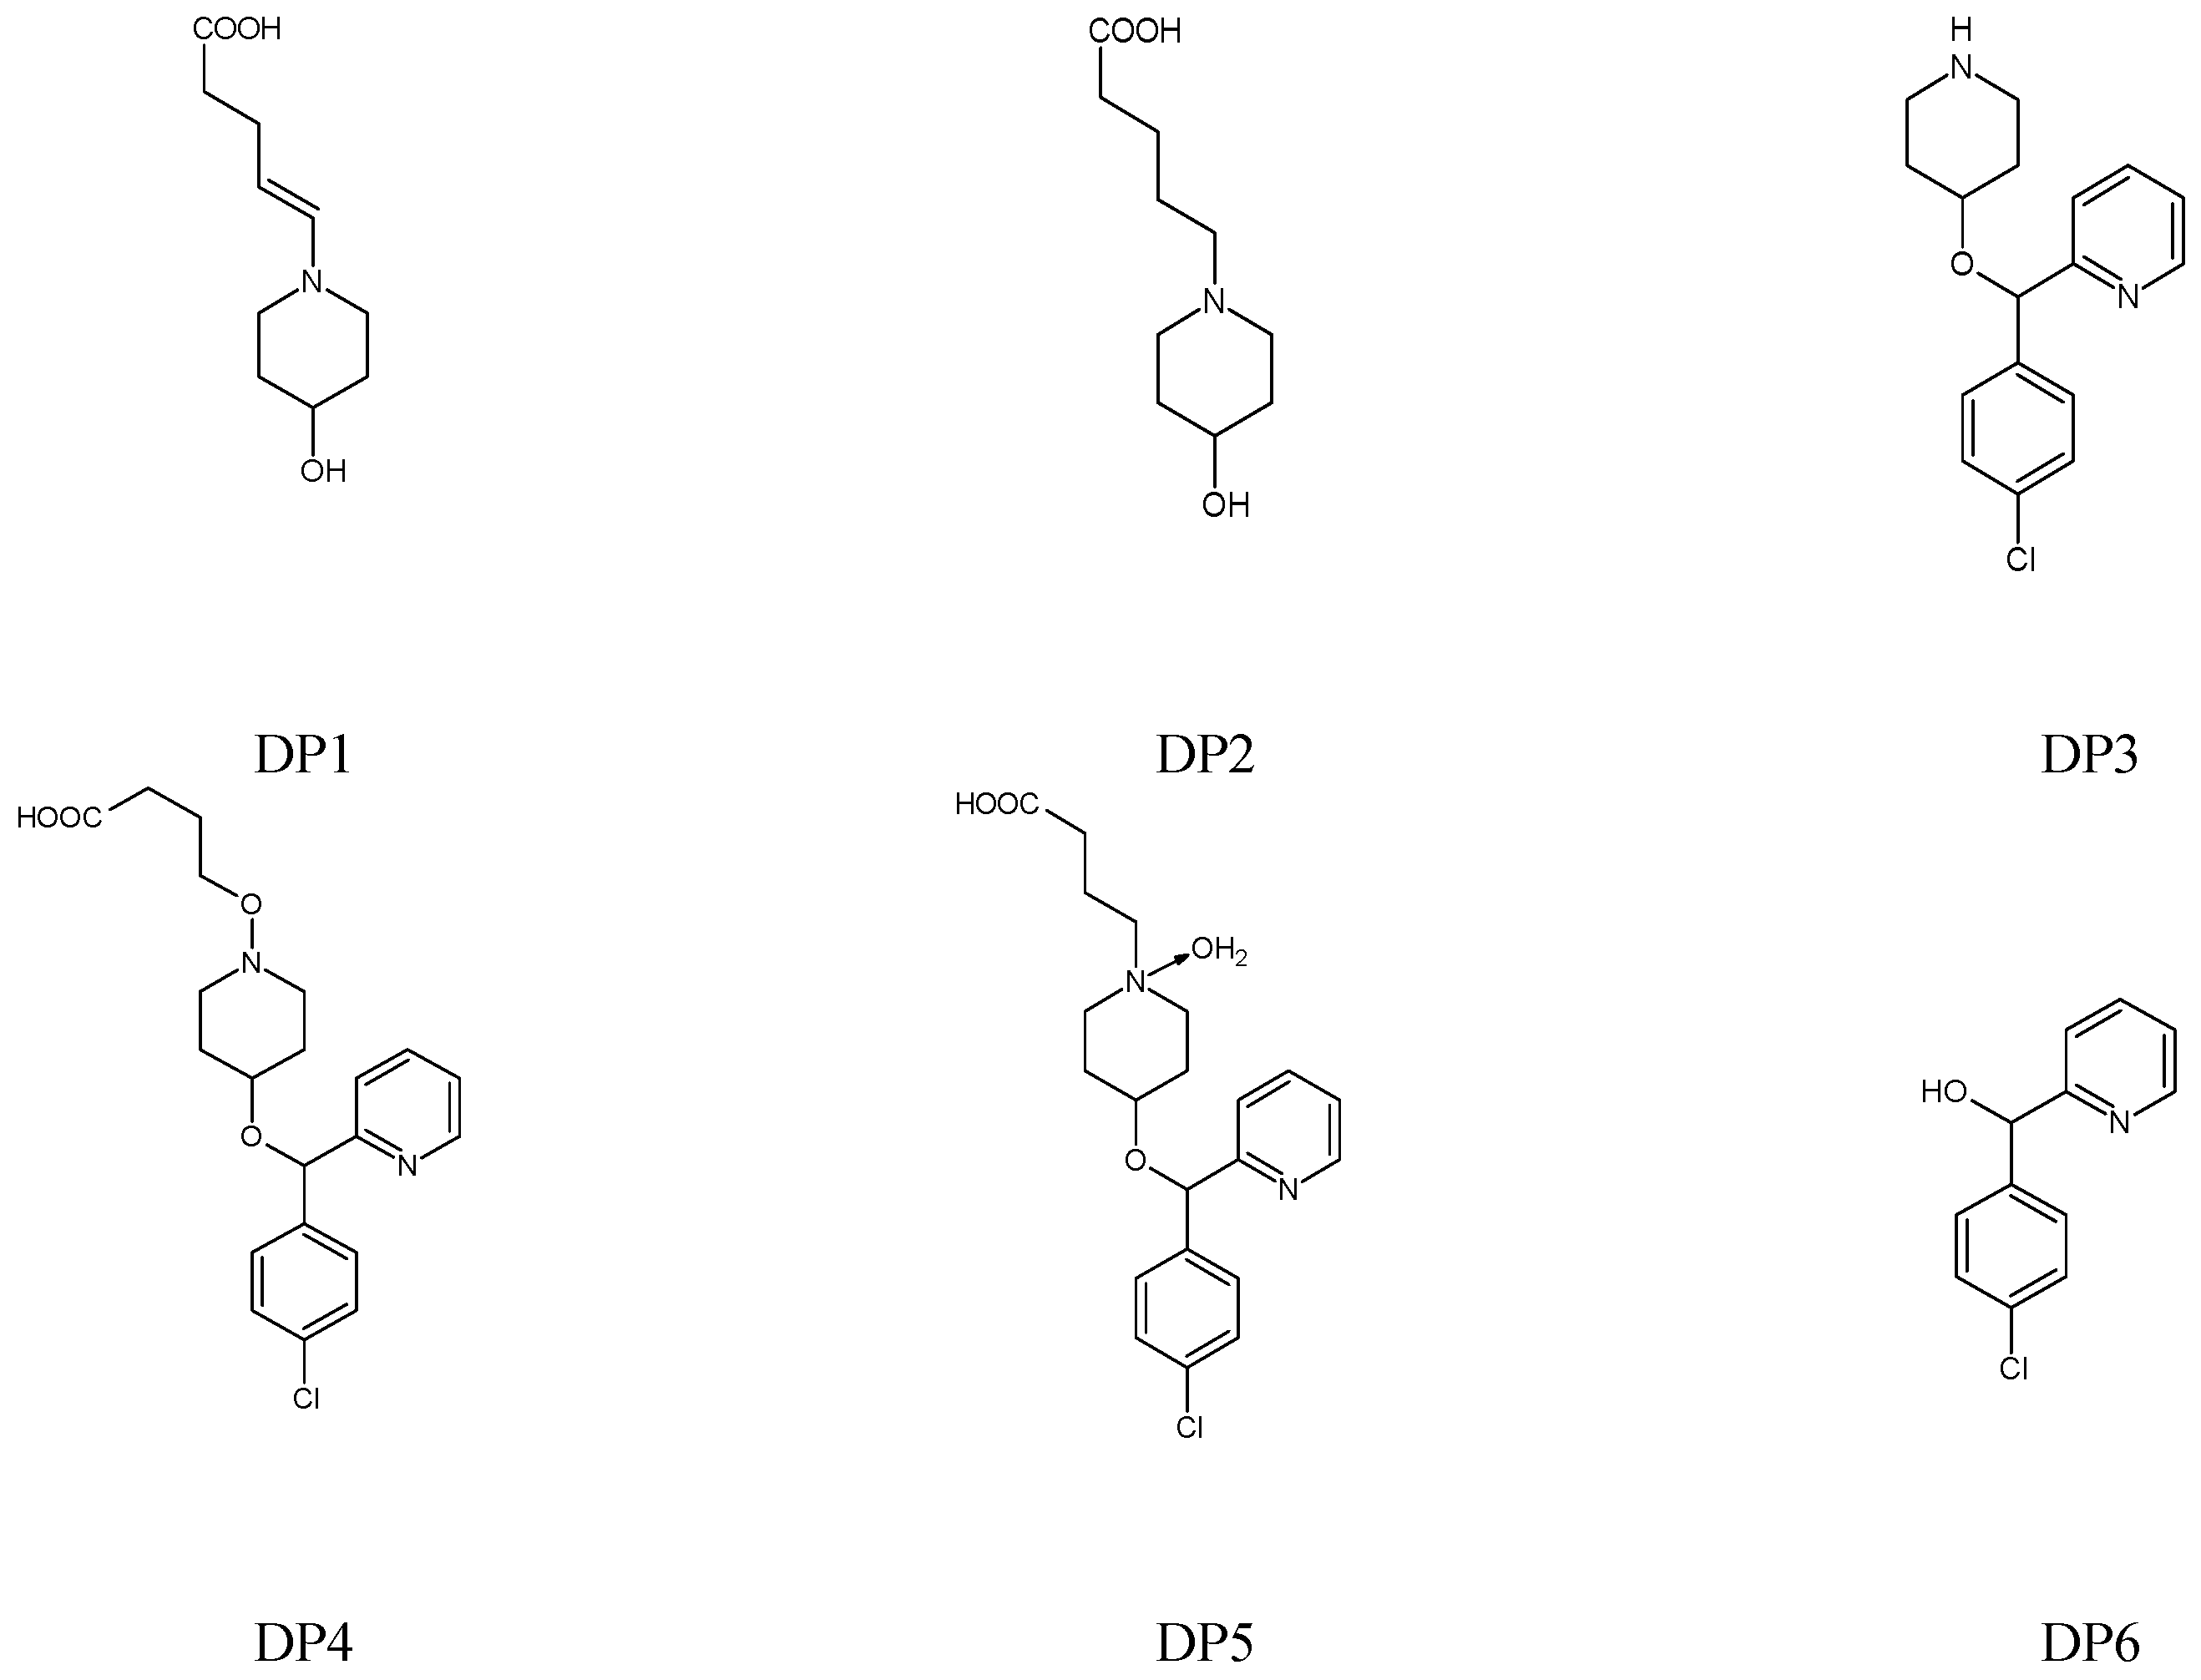
2.1.3. Photolytic Degradation in Solutions
2.1.4. Kinetics
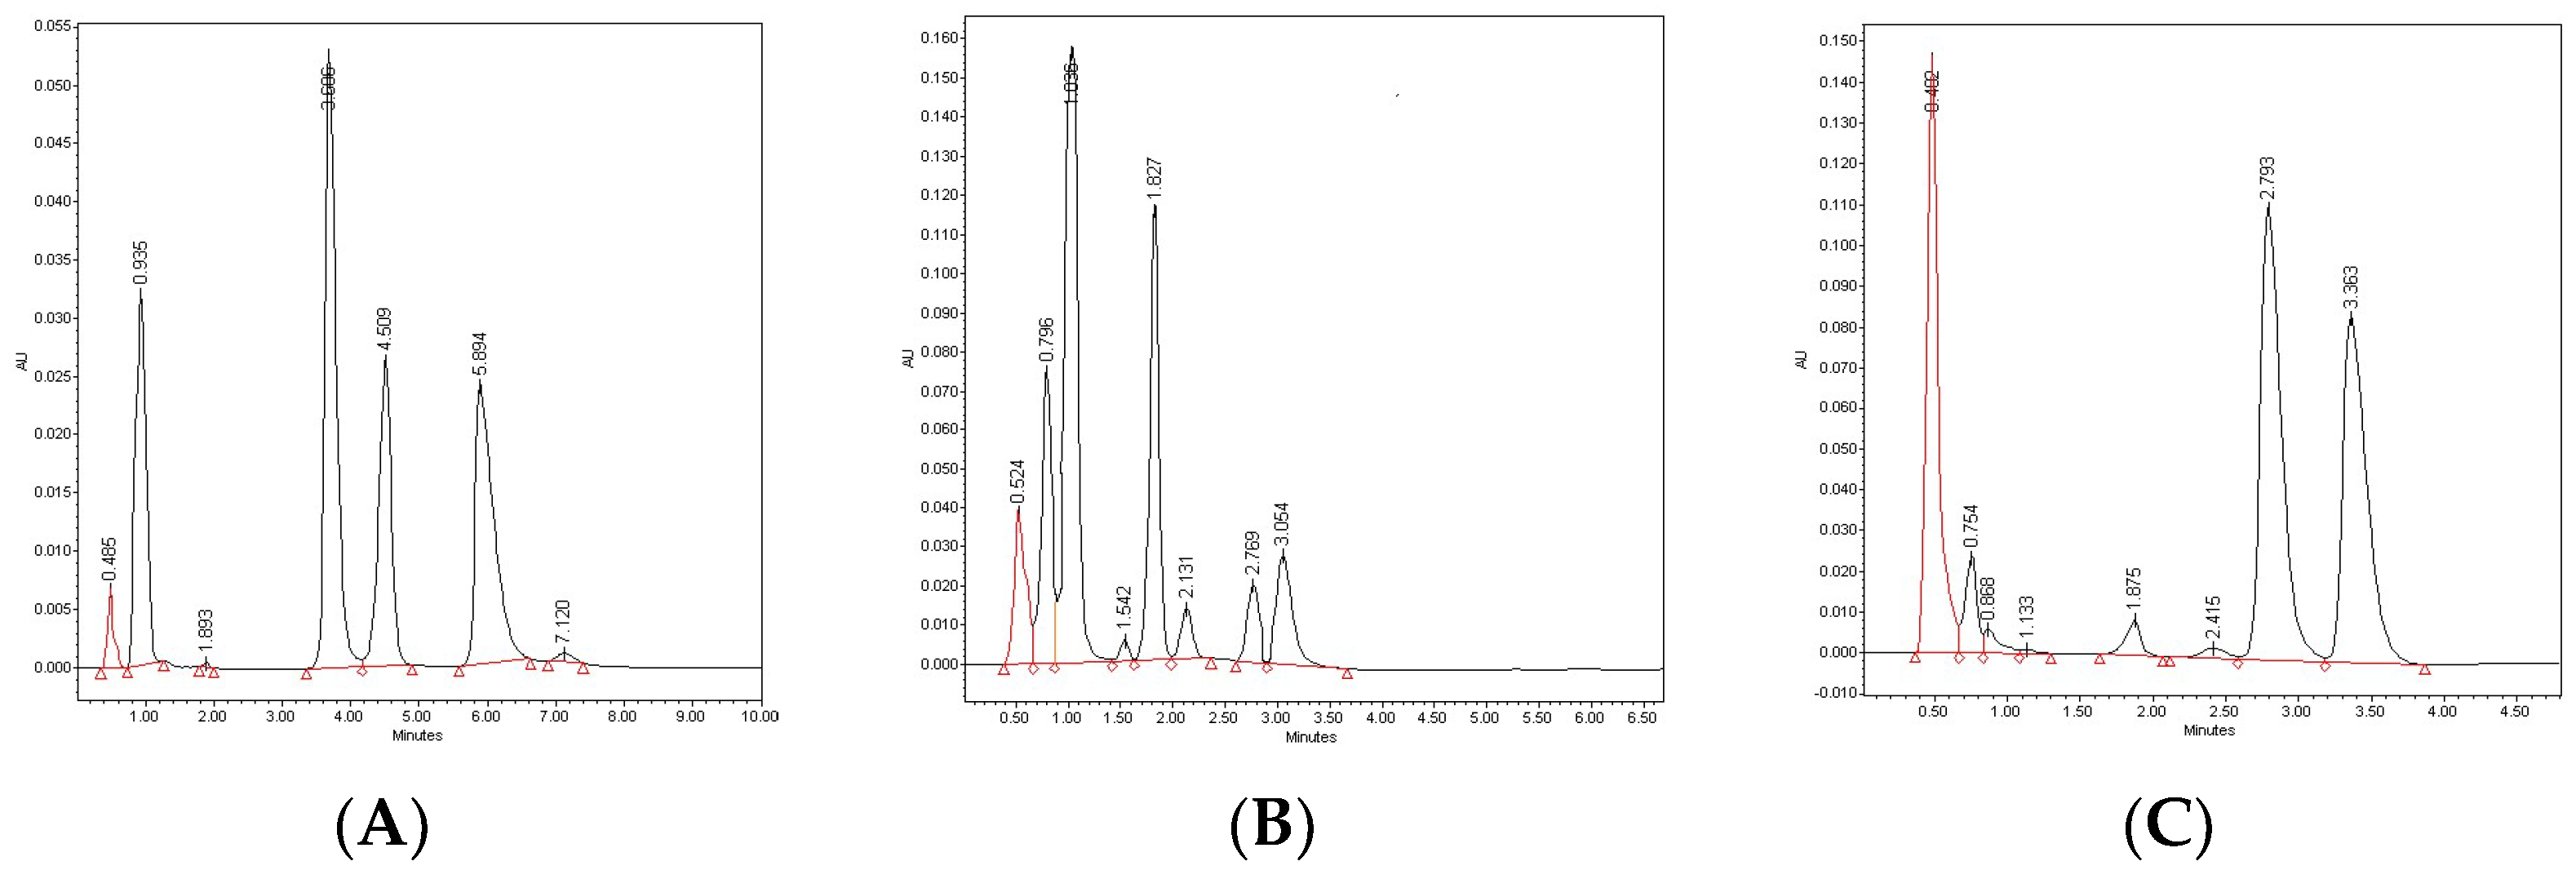
2.1.5. HPLC-UV Chromatograms
2.2. Degradation in Solids and Impact of Excipients
3. Materials and Methods
3.1. Materials
3.2. Apparatus for Accelerated Degradation
3.3. Degradation of DIPH, AZE and BEPO in Solutions
3.4. Degradation of DIPH, AZE and BEPO in Solids
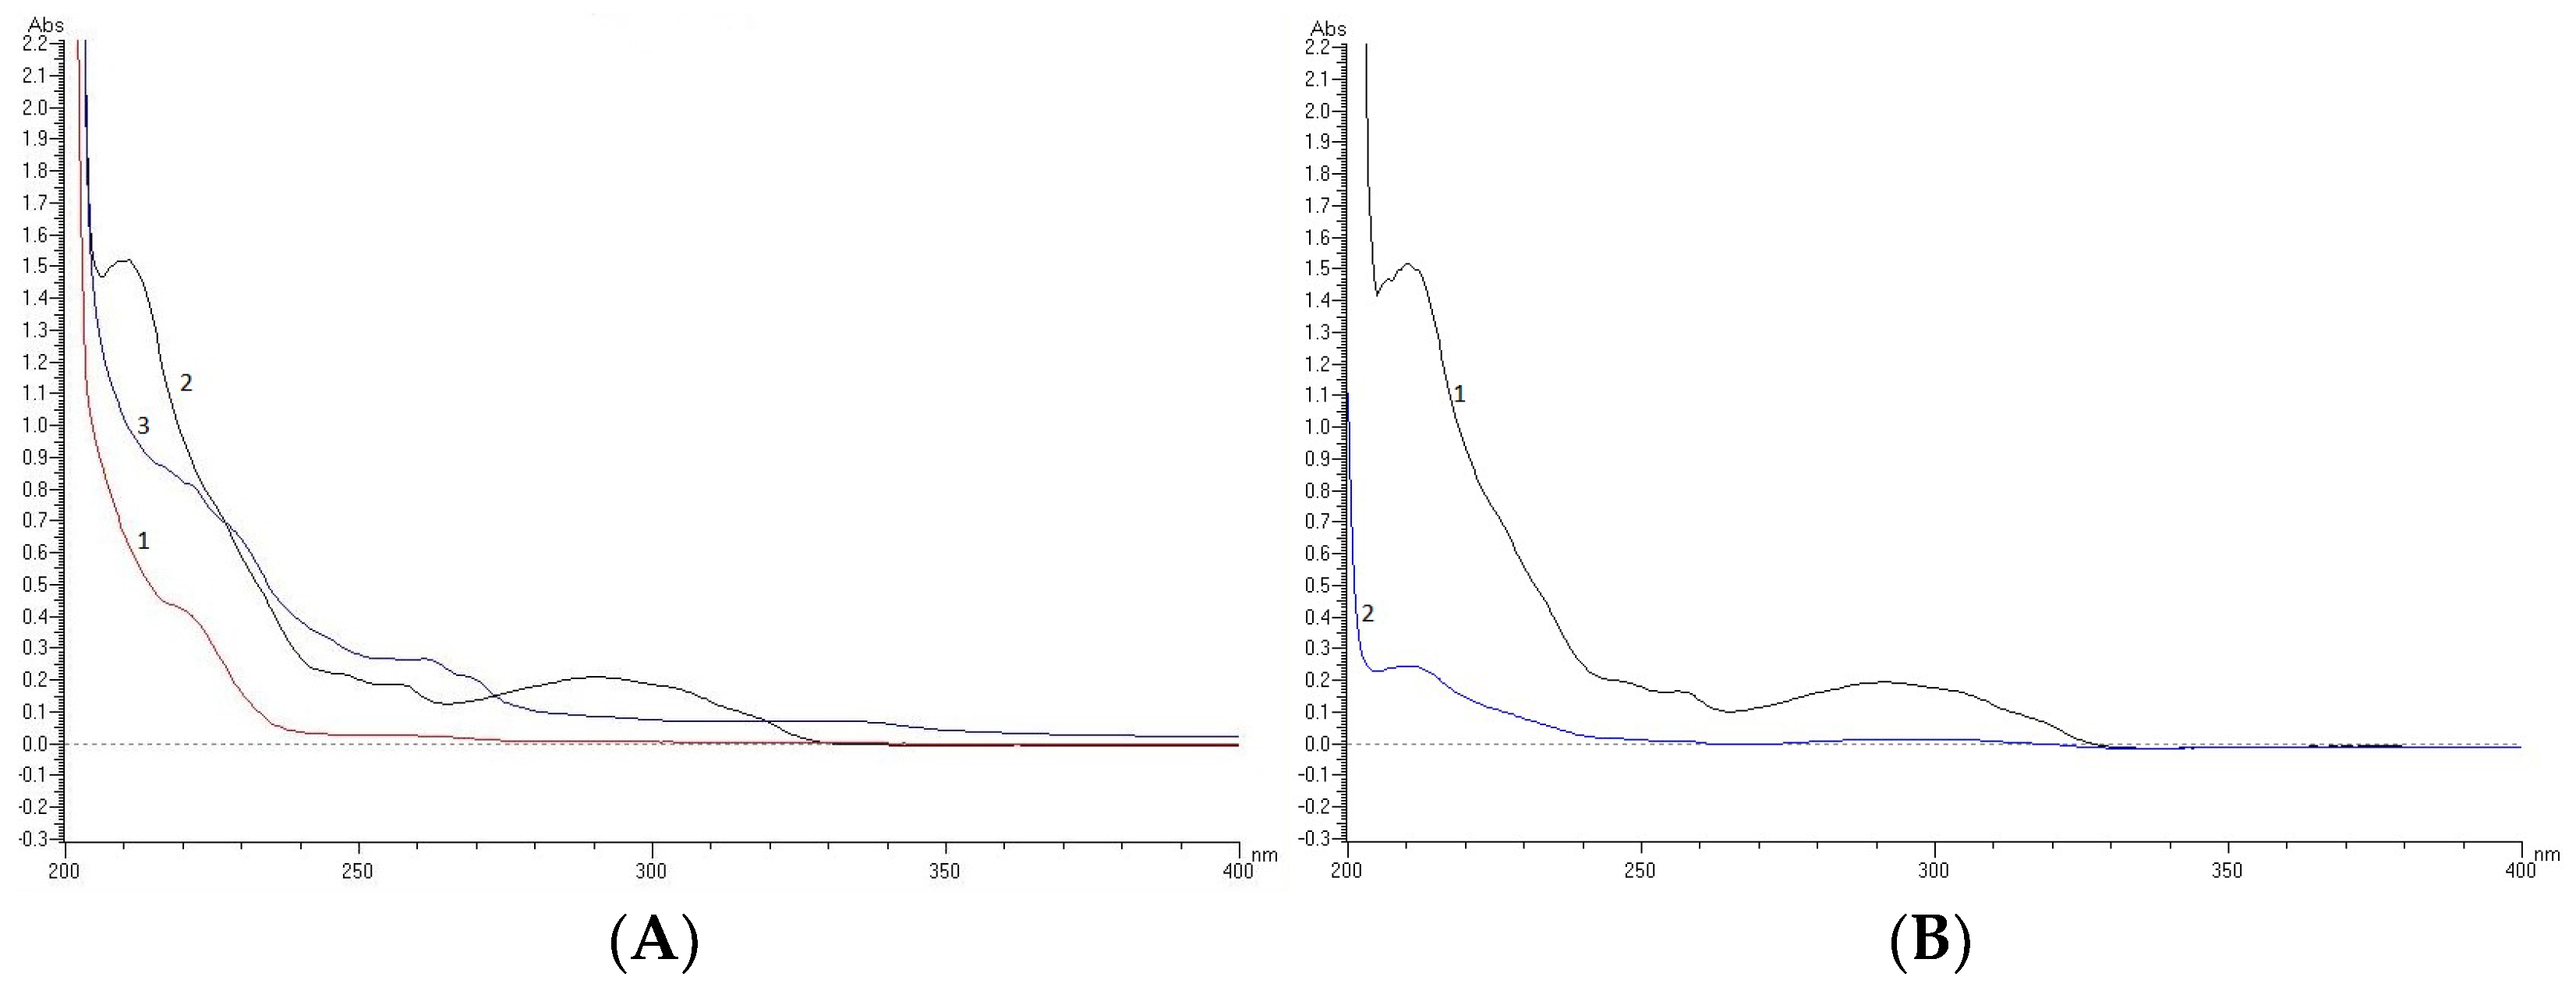
3.5. Spectrophotometric Measurements
3.6. Kinetics of Degradation in Solutions
3.7. HPLC Methods
3.7.1. Chromatography
3.7.2. Validation of the Methods
3.8. FT-IR and NIR Measurements
4. Conclusions
Author Contributions
Funding
Institutional Review Board Statement
Informed Consent Statement
Data Availability Statement
Conflicts of Interest
Sample Availability
References
- Simons, F.E.R.; Simons, K.J. H1 antihistamines, current status and future directions. WAO J. 2008, 1, 145–155. [Google Scholar] [CrossRef] [PubMed]
- Ricciardi, L.; Furci, F.; Stefania, I. Antihistamines for allergic disease: Old-aged but not old-fashioned drugs. Int. J. Allergy Medicat. 2019, 591, 037. [Google Scholar] [CrossRef]
- Tatarkiewicz, J.; Rzodkiewicz, P.; Żochowska, M.; Staniszewska, A.; Bujalska-Zadrożna, M. New antihistamines—Perspectives in the treatment of some allergic and inflammatory disorders. Arch. Med. Sci. 2019, 15, 537–553. [Google Scholar] [CrossRef]
- Trybus, E.; Król, T.; Trybus, W. The multidirectional effect of azelastine hydrochloride on cervical cancer cells. Int. J. Mol. Sci. 2022, 23, 5890. [Google Scholar] [CrossRef]
- Hu, H.-F.; Xu, W.W.; Li, Y.-J.; He, Y.; Zhang, W.-X.; Liao, L.; Zhang, Q.-H.; Han, L.; Yin, X.-F.; Zhao, X.-X.; et al. Anti-allergic drug azelastine suppresses colon tumorigenesis by directly targeting ARF1 to inhibit IQGAP1-ERK-Drp1-medictaed mitochondrial fission. Theranostic 2021, 11, 1828–1844. [Google Scholar] [CrossRef]
- Lu, J.; Hou, Y.; Ge, S.; Wang, X.; Wang, J.; Hu, T.; Lv, Y.; He, H.; Wang, C. Screened antihistaminic drugs inhibits SARS-CoV-2 binding with ACE2 in vitro. Life Sci. 2021, 266, 118889. [Google Scholar] [CrossRef] [PubMed]
- Konrat, R.; Papp, H.; Kimpel, J.; Rossler, A.; Szijarto, V.; Nagy, G.; Madai, M.; Zeghbib, S.; Kuczmog, A.; Lankisz, Z.; et al. The antihistamine azelastine identified by computational drug repurposing, inhibits infection by major variants of SARS-CoV-2 in cell cultures and reconstituted human nasal tissue. Front. Pharmacol. 2020, 13, 861295. [Google Scholar] [CrossRef] [PubMed]
- Aziz, S.N.; Badawy, A.A.; Nessem, D.I.; el Malak, N.S.A. Promising nanoparticulate system for topical delivery of diphenhydramine hydrochloride: In vitro and in vivo evaluation. J. Drug Deliv. Sci. Technol. 2020, 55, 111454. [Google Scholar] [CrossRef]
- Okubo, K.; Kurono, Y.; Ichimura, K.; Enomoto, T.; Okamoto, Y.; Kawauchi, H.; Suzaki, H.; Fujieda, S.; Masuyama, K. Japanese guidelines for allergic rhinitis 2020. Allergol. Int. 2020, 69, 331–345. [Google Scholar] [CrossRef]
- Bernstein, J.A. Azelastine hydrochloride: A review of pharmacology, pharmacokinetics, clinical efficacy and tolerability. Curr. Med. Res. Opin. 2007, 23, 2441–2452. [Google Scholar] [CrossRef]
- Hernandez-Trujillo, V. Antihistamines treatment for allergic rhinitis: Different routes, different mechanisms? Allergy Asthma Proc. 2009, 30, 584–588. [Google Scholar] [CrossRef] [PubMed]
- Dhiraj, D.; Harshal, M.; Gaurav, D.; Hanmant, B. Evaluation of effectiveness and safety of oral bepotastine in the management of chronic urticaria. Int. J. Sci. Stud. 2019, 6, 1–5. [Google Scholar] [CrossRef]
- Al-Salman, H.N.K.; Fayadh, R.H.; Hussein, H.H.; Jasim, E.Q. Development of the stable, reliable, fast and simple RP-HPLC Analytical method for quantifying diphenhydramine-HCl (DPH) in pharmaceuticals. Int. J. Pharm. Res. 2020, 12, 4457–4467. [Google Scholar] [CrossRef]
- Kirkpatrick, D.; Fain, M.; Yang, J.; Santos, L.; Anthony, C. UHPLC assay and impurity methods for diphenhydramine and phenylephrine hydrochloride oral solution. Sep. Sci. Plus 2020, 3, 4–11. [Google Scholar] [CrossRef] [PubMed]
- Donnelly, R.F. Chemical stability of diphenhydramine hydrochloride in minibags and polypropylene syrings. Can. J. Hosp. Pharm. 1999, 52, 150–155. [Google Scholar]
- Sabins, D.; Diep, T.; McCartan, P.; Patel, S.; Zhao, F. Stability and compatibility of diphenhydramine hydrochloride in intravenous mixtures: A new look at an old drug. Hosp. Pharm. 2018, 54, 330–334. [Google Scholar] [CrossRef]
- Bober, K. Application of HPTLC with densitometry for evaluation of the impact of external factors contents of diphenhydramine in its solutions. Int. J. Anal. Chem. 2017, 2017, 4914292. [Google Scholar] [CrossRef]
- European Pharmacopoeia, 10th ed.; Council of Europe: Strasbourg, France, 2019.
- Patel, S.; Ty, P. Stability-indicating high-performance liquid chromatography method for determination of antihistamine drug azelastine. Asian J. Pharm. Clin. Res. 2018, 11, 248–251. [Google Scholar] [CrossRef]
- El-Shaheny, R.N.; Yamada, K. Stability study of the antihistamine drug azelastine HCl along with a kinetic investigation and the identification new degradation products. Anal. Sci. 2014, 30, 691–697. [Google Scholar] [CrossRef]
- da Costa, L.M.; de Almeida Leite, H.O.; Kassab, N.M.; Singh, A.K. Green analytical methods for the separation of seven antihistamines: Application in separation of azelastine and related impurities in nasal solution. Int. J. Anal. Chem. 2019, 2019, 9489723. [Google Scholar] [CrossRef]
- Elghobashy, M.R.; Badran, U.M.; Salem, M.Y.; Kelani, K.M. Stability indicating spectrophotometric and chromatographic methods for the determination of azelastine hydrochloride in presence of its alkaline degradant. Anal. Chem. Indian J. 2014, 14, 135–142. [Google Scholar]
- Kotla, N.R.; Nagaraju, C.V.S.; Eshwaraiah, S.; Reddy, G.S.K.; Rakesh, M.; Kishore, M.; Chakravarthy, I.E. Stability indicating HPLC method for the quantification of bepotastine besilate and its related substances. Pharm. Chem. 2014, 6, 343–351. [Google Scholar]
- Damle, M.C.; Ghode, S.P. Stability indicating chromatographic method for estimation of bepotastine besilate. Indoam. J. Pharm. Sci. 2018, 5, 5222–5228. [Google Scholar]
- Soliman, M.M.; Darvish, M.K.; Razeq, S.A.-A. Validated stability indicating HPTLC, UHPLC and UV-spectrophotometric techniques for the determination of bepotastine besilate in presence of its oxidative degrade. Asian J. Appl. Chem. Res. 2019, 3, 1–14. [Google Scholar] [CrossRef]
- Singh, D.K.; Sahu, A.; Wani, A.A.; Bharatam, P.V.; Chakraborti, A.K.; Giri, S.; Singh, S. Characterization of photodegradation products of bepotastine besilate and in silico evaluation of their physicochemical, absorption, distribution, metabolism, excretion and toxicity properties. J. Pharm. Sci. 2020, 109, 1883–1895. [Google Scholar] [CrossRef] [PubMed]
- Blessy, M.; Ruchi, D.; PatelPrajesh, N.; Prajapati, Y.; Agrawal, K. Development of forced degradation and stability studies of drugs—A review. J. Pharm. Anal. 2014, 4, 159–165. [Google Scholar] [CrossRef]
- Murthy, S.N.; Repka, M.A. Excipients stability; a critical aspect in stability of pharmaceuticals. AAPS PharmSciTech 2018, 19, 11. [Google Scholar] [CrossRef]
- Narang, A.S.; Desai, D.; Badawy, S. Impact of excipient interactions on solid dosage form stability. Pharm. Res. 2012, 29, 2660–2683. [Google Scholar] [CrossRef]
- Silva, I.A.; Lima, A.L.; Gratieri, T.; Gelfuso, G.M.; Sa-Barreto, L.L.; Cunha-Filho, M. Compatibility and stability studies involving polymers used in fused deposition modeling 3D printing of medicines. J. Pharm. Biomed. Anal. 2022, 12, 424–435. [Google Scholar] [CrossRef]
- Lambros, M.; Tran, T.; Fei, Q.; Nicolaou, M. Citric acid: A multifunctional pharmaceutical excipient. Pharmaceutics 2022, 14, 972. [Google Scholar] [CrossRef] [PubMed]
- RxList. Available online: https://www.rxlist.com (accessed on 18 September 2022).
- Dailymed. Available online: https://dailymed.nlm.nih.gov (accessed on 18 September 2022).
- Mazet, R.; Jameogo, J.B.G.; Wouessidjewe, D.; Choisnard, L.; Geze, A. Recent advances in the design of topical ophthalmic delivery systems in the treatment of ocular surface inflammation and thei biopharmaceutical evaluation. Pharmaceutics 2020, 12, 570. [Google Scholar] [CrossRef] [PubMed]
- Jamrógiewicz, M. Consequences of new approach to chemical stability tests to active pharmaceutical ingredients. Front. Pharmacol. 2016, 7, 17. [Google Scholar] [CrossRef]
- Yoshioka, S.; Stella, V.J. pH and pH-Rate Profiles in Stability of Drugs and Dosage Forms; Kluwer Academic Publications: New York, NY, USA, 2002; pp. 80–97. [Google Scholar]
- PubChem. Available online: https://pubchem.ncbi.nlm.nih.gov/ (accessed on 18 September 2022).
- The International Council for Harmonisation of Technical Requirements for Pharmaceuticals for Human Use (ICH). Validation of Analytical Procedures: Text and Methodology Q2(R1); ICH: Geneva, Switzerland, 2005. [Google Scholar]
- FDA Guidance for Industry. Validation of Analytical Procedures: Definitions and Terminology Final Guidance; Center for Drug Evaluation and Research: Rockville, MD, USA, 2010.
- Bhangare, D.; Rajput, N.; Jadav, T.; Sahu, A.K.; Tekade, R.K.; Sengupta, P. Systematic strategies for degradation kinetic study of pharmaceuticals: And issue of utmost importance concerning current stability analysis practice. J. Anal. Technol. 2022, 13, 7. [Google Scholar] [CrossRef]
- The International Council for Harmonisation of Technical Requirements for Pharmaceuticals for Human Use. ICH Guideline S10 Guidance on Photosafety Evaluation of Pharmaceuticals; ICH: Geneva, Switzerland, 2012. [Google Scholar]
- Chen, Y.; Hu, X. Indirect photodegradation of amine drugs in aqueous solution under simulated sunlight. Environ. Sci. Technol. 2009, 43, 2760–2765. [Google Scholar] [CrossRef]
- Bajaj, S.; Singla, D.; Sakhu, N. Stability testing of pharmaceutical Products. J. Appl. Pharm. Sci. 2012, 2, 129–138. [Google Scholar]
- Ahmad, I.; Ahmed, S.; Anwar, Z.; Sheraz, M.A.; Sikorski, M. Photostability and photostabilization of drugs and drug products. Int. J. Photoenergy 2016, 7, 1–19. [Google Scholar] [CrossRef]
- Baranowski, P.; Karolewicz, B.; Gajda, M.; Pluta, J. Ophthalmic drug dosage firms: Characterisation and reseach methods. Sci. World J. 2014, 2014, 861904. [Google Scholar] [CrossRef]
- Beć, K.B.; Grabska, J.; Huck, C.W. Near-infrared spectroscopy in bioapplications. Molecules 2020, 25, 2948. [Google Scholar] [CrossRef] [PubMed]
- Singh, S.; Parikh, T.; Sandhu, H.K.; Shah, N.H.; Malick, A.W.; Singhal, D.; Serajuddin, A.T. Supersolubilization and amorphization of a model basic drug haloperidol, by interaction with weak acids. Pharm. Res. 2013, 30, 1561–1573. [Google Scholar] [CrossRef]
- Parikh, T.; Serajuddin, A.T.M. Development of fast-dissolving amorphous solid dispersion of itraconazole by melt extrusion of its mixture with weak organic carboxylic acid and polymer. Pharm. Res. 2018, 35, 127. [Google Scholar] [CrossRef]
- Medscape. Available online: https://medscape.com (accessed on 2 November 2022).
- The International Council for Harmonisation of Technical Requirements for Pharmaceuticals for Human Use. ICH Topic Q1A (R2) Stability Testing of New Drug Substances and Products; ICH: Geneva, Switzerland, 2003. [Google Scholar]
- The International Council for Harmonisation of Technical Requirements for Pharmaceuticals for Human Use. ICH Topic Q1B Photostability Testing of New Active Substances and Medicinal Products; ICH: Geneva, Switzerland, 1998. [Google Scholar]


| Parameter | DIPH | AZE | BEPO |
|---|---|---|---|
| Linearity range (µg/mL) | 10–100 | 10–100 | 10–100 |
| Slope (n = 6) | 0.07131 | 0.05931 | 0.01839 |
| SD of the slope | 0.00061 | 0.00035 | 0.00012 |
| Intercept (n = 6) | −0.1153 | 0.04611 | −0.00771 |
| SD of the intercept | 0.037276 | 0.02097 | 0.00708 |
| r2 (n = 6) | 0.9951 | 0.9988 | 0.9991 |
| SD of the r2 | 0.008605 | 0.00581 | 0.00634 |
| LOD (µg/mL) | 1.04 | 2.41 | 0.32 |
| LOQ (µg/mL) | 3.15 | 7.29 | 0.96 |
| Accuracy (% Recovery) (n = 9) | 99.84 | 102.44 | 100.21 |
| SD of the Recovery | 2.24 | 1.09 | 2.13 |
| Intra-day precision (%RSD) (n = 3) | 1.07 | 1.37 | 0.99 |
| Inter-day precision (%RSD) (n = 9) | 2.27 | 1.44 | 1.79 |
| % RSD values for the peak areas (n = 6) | 0.87 | 0.94 | 0.85 |
| Peak tailing | 0.9 | 1.2 | 0.9 |
| Conditions | Degradation [%] | y = ax + b | r2 | k [min−1] | t0.5 [h] |
|---|---|---|---|---|---|
| DIPH | |||||
| 0.1 M HCl | 32.8 | y = −0.0107x + 3.8306 | 0.9860 | 9.212 × 10⁻⁴ | 18.01 |
| Buffer pH 4 | 19.9 | y = −0.0001x + 4.5986 | 0.9586 | 2.303 × 10⁻⁴ | 50.15 |
| Buffer pH 7 | 12.7 | y = −0.00007x + 4.6093 | 0.9863 | 1.612 × 10⁻⁴ | 71.65 |
| Buffer pH 10 | 8.6 | - | - | - | - |
| 0.1 M NaOH | 5.3 | - | - | - | - |
| AZE | |||||
| 0.1 M HCl | 2.7 | - | - | - | - |
| Buffer pH 4 | 2.6 | - | - | - | - |
| Buffer pH 7 | 2.9 | - | - | - | - |
| Buffer pH 10 | 2.7 | - | - | - | - |
| 0.1 M NaOH | 1.8 | - | - | - | - |
| BEPO | |||||
| 0.1 M HCl | 56.8 | y = −0.0003x + 4.4823 | 0.9349 | 6.909 × 10⁻⁴ | 16.71 |
| Buffer pH 4 | 23.4 | y = −0.0001x + 4.6097 | 0.9654 | 2.303 × 10⁻⁴ | 50.15 |
| Buffer pH 7 | 17.4 | y = −0.00009x + 4.5963 | 0.9629 | 2.072 × 10⁻⁴ | 55.74 |
| Buffer pH 10 | 23.8 | y = −0.0001x + 4.6027 | 0.9949 | 2.303 × 10⁻⁴ | 50.15 |
| 0.1 M NaOH | 28 | y = −0.0002x + 4.5645 | 0.9126 | 4.606 × 10⁻⁴ | 25.09 |
| Conditions | Degradation (%) | y = ax + b | r2 | k (min−1) | t0.5 (h) |
|---|---|---|---|---|---|
| DIPH | |||||
| 0.1 M HCl | 56.5 | y = −0.0004x + 4.5048 | 0.9171 | 9.321 × 10⁻⁴ | 12.39 |
| Buffer pH 4 | 44.5 | y = −0.0003x + 4.6320 | 0.9818 | 6.909 × 10⁻⁴ | 16.72 |
| Buffer pH 7 | 44 | y = −0.0004x + 4.5222 | 0.9143 | 9.321 × 10⁻⁴ | 12.39 |
| Buffer pH 10 | 49.5 | y = −0.0003x + 4.6412 | 0.9791 | 6.909 × 10⁻⁴ | 16.72 |
| 0.1 M NaOH | 41.8 | y = −0.0002x + 4.6514 | 0.9271 | 9.212 × 10⁻⁴ | 12.53 |
| AZE | |||||
| 0.1 M HCl | 5.5 | - | - | - | - |
| Buffer pH 4 | 21.6 | y = −0.0001x + 4.5904 | 0.9751 | 2.303 × 10⁻⁴ | 50.15 |
| Buffer pH 7 | 57.9 | y = −0.0004x + 4.4860 | 0.9393 | 9.212 × 10⁻⁴ | 12.53 |
| Buffer pH 10 | 92.3 | y = −0.0012x + 4.5004 | 0.9938 | 2.763 × 10⁻³ | 4.18 |
| 0.1 M NaOH | 91.4 | y = −0.0012x + 4.5286 | 0.9721 | 2.763 × 10⁻³ | 4.18 |
| BEPO | |||||
| 0.1 M HCl | 96.3 | y = −0.0016x + 4.2865 | 0.9474 | 3.685 × 10⁻³ | 3.13 |
| Buffer pH 4 | 21.3 | y = −0.0001x + 4.6030 | 0.9761 | 2.303 × 10⁻⁴ | 50.15 |
| Buffer pH 7 | 33.7 | y = −0.0002x + 4.6148 | 0.9802 | 4.606 × 10⁻⁴ | 25.08 |
| Buffer pH 10 | 26.9 | y = −0.0002x + 4.6024 | 0.9454 | 4.606 × 10⁻⁴ | 25.08 |
| 0.1 M NaOH | 61.7 | y = −0.0004x + 4.742 | 0.9320 | 9.212 × 10⁻⁴ | 12.53 |
| Compound | FT-IR | |
|---|---|---|
| cm−1 | Vibrations | |
| DIPH | 3034, 3016, 2951 | C-H stretching aromatic rings |
| 2592 | C-H stretching CH3 | |
| 2517, 2483, 2452 | ||
| 1595 | ||
| 1468, 1455 | C-C stretching aromatic rings | |
| 1375 | C-H bending CH3 | |
| 1282 | C-N stretching N-CH3 | |
| 1171 | C-O stretching C-O-C | |
| 1104 | C-N stretching N-CH3 | |
| 1021 | ||
| 990 | ||
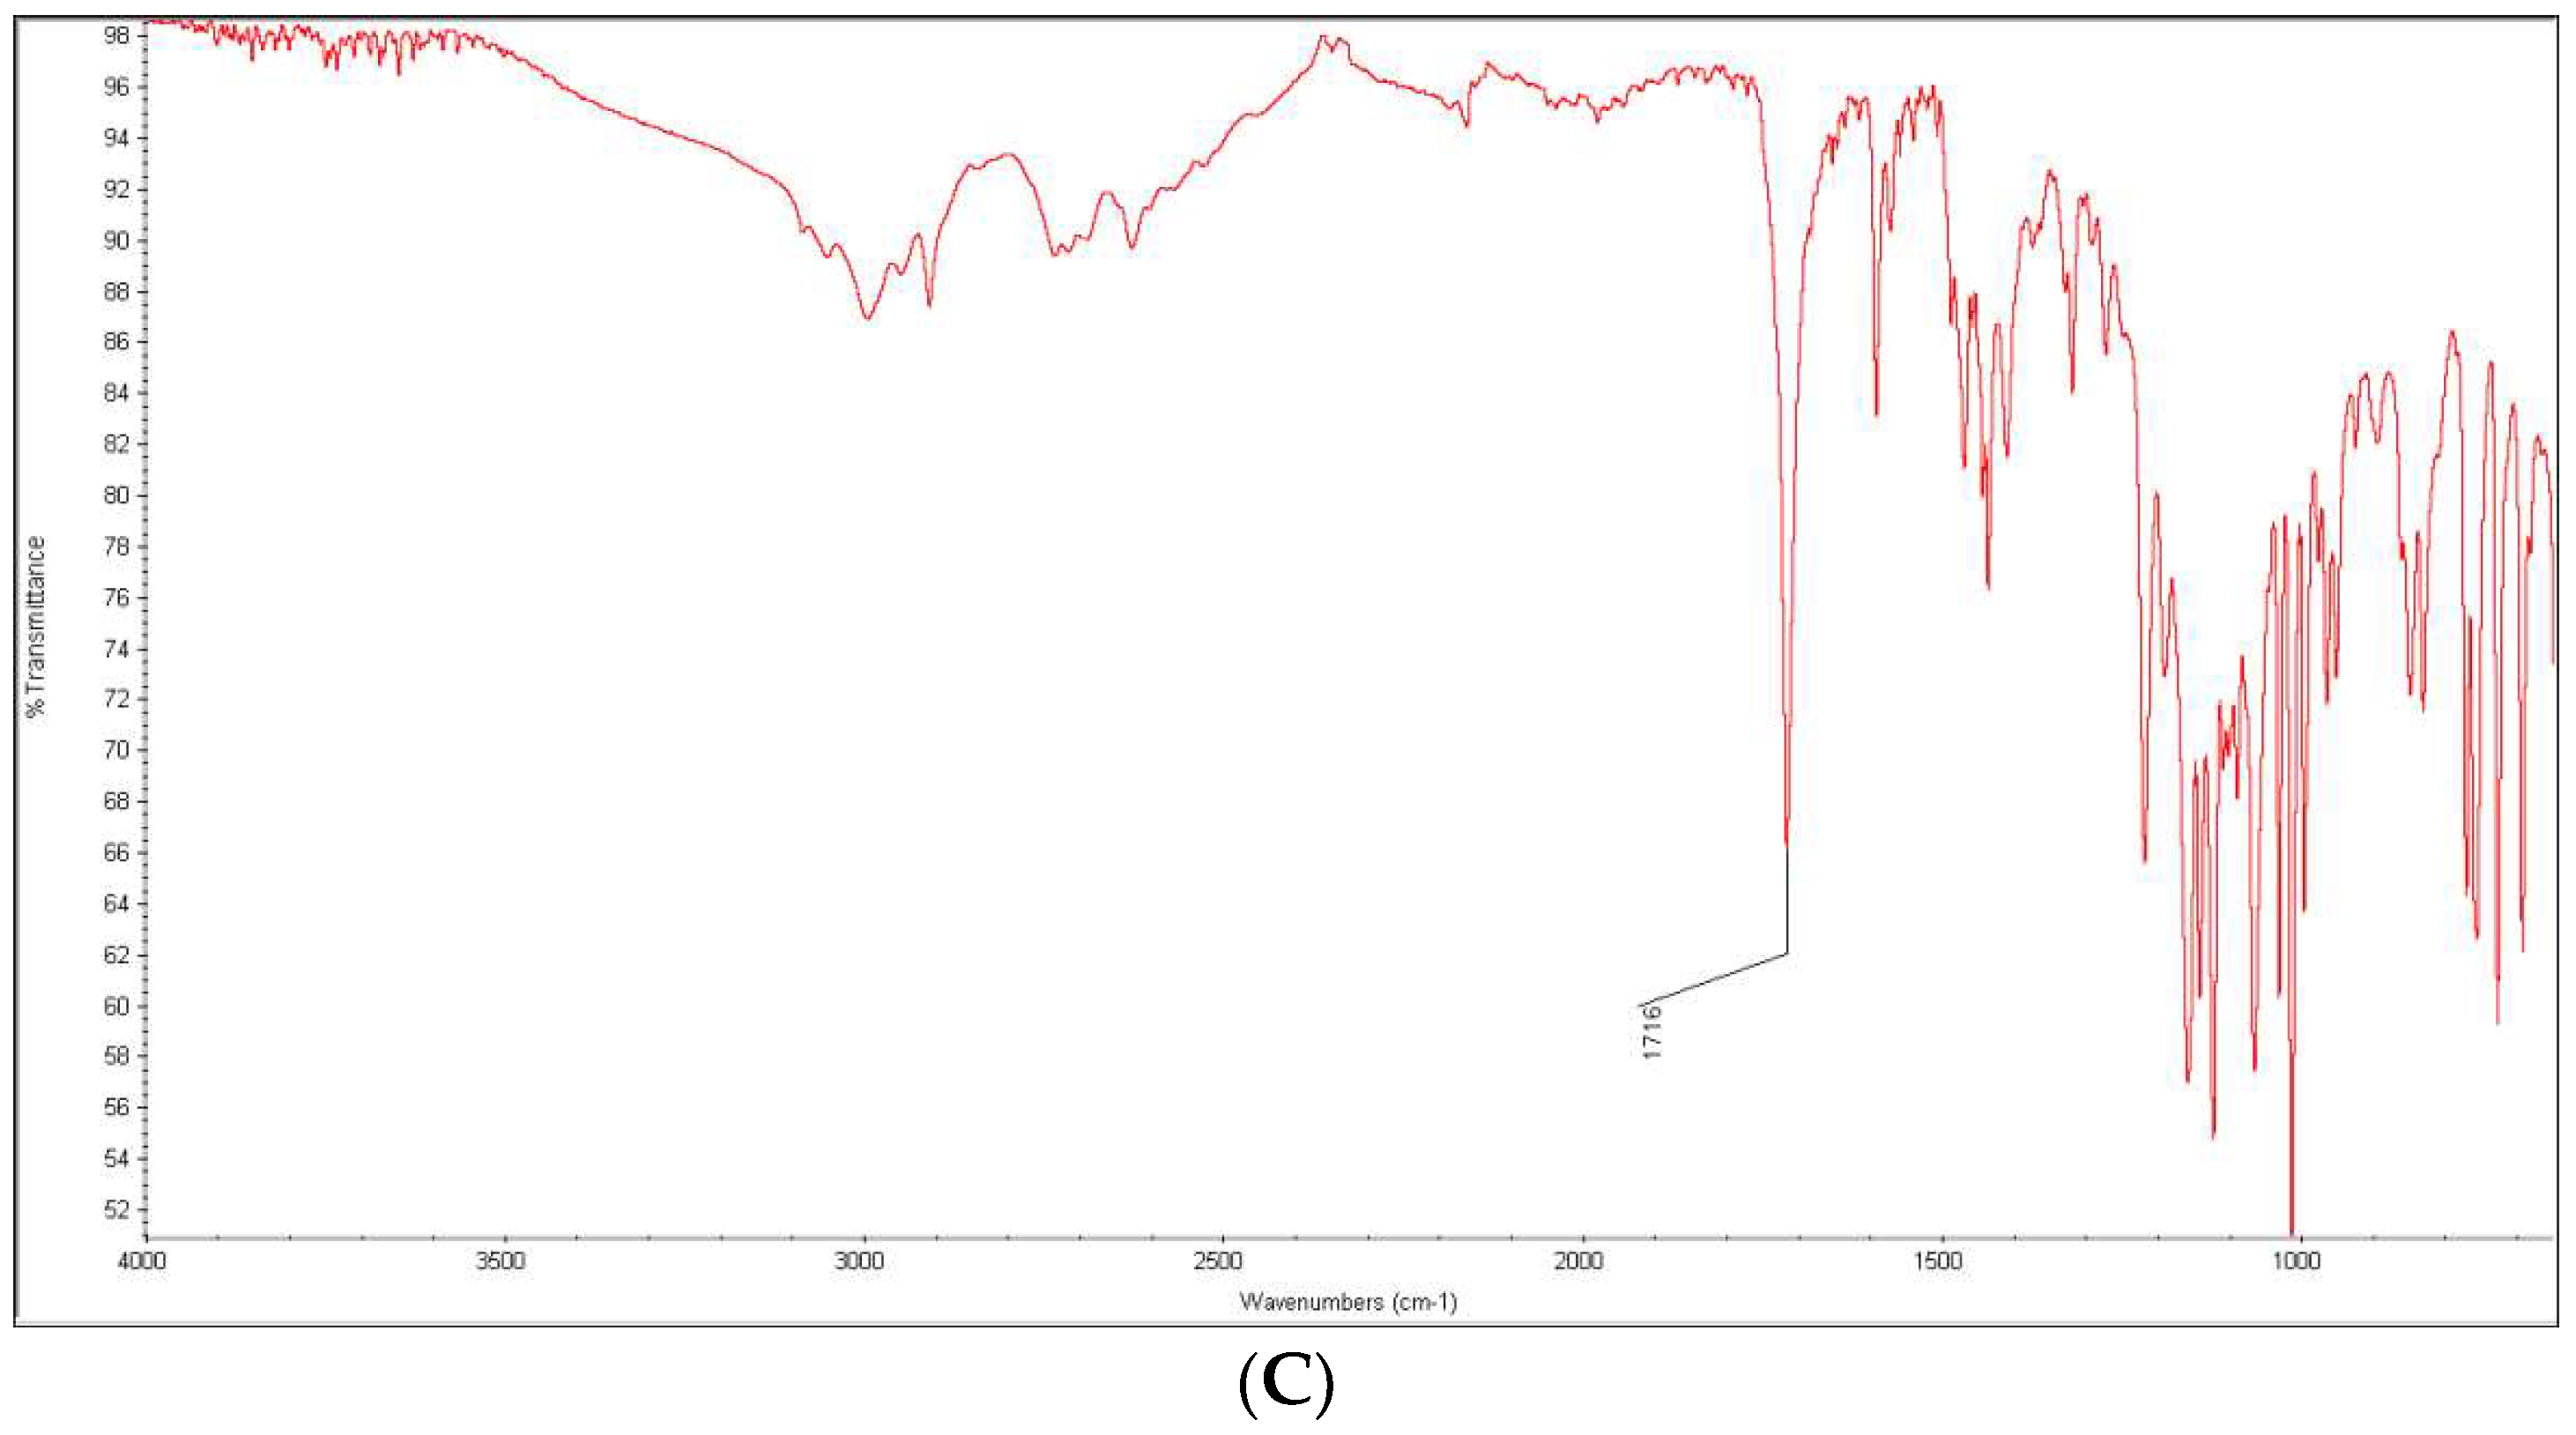
| AZE | 3400 | |
| 3028, 3000, 2966, 2941 | C-H stretching aromatic rings | |
| 2910, 2892, 2861 | ||
| 2548 | ||
| 2437, 2416 | C-H stretching CH3 | |
| 2347 | ||
| 1680 | ||
| 1652 | C=O stretching amides | |
| 1587 | C-C stretching aromatic rings | |
| 1486, 1471 | ||
| 1430 | C-H bending CH3 | |
| 1339, 1326 | C-N stretching N-CH3 | |
| 1213 | ||
| 1104, 1083 | C-O stretching; C-N stretching N-CH3 | |
| 810 | ||
| 780 | C-Cl stretching | |
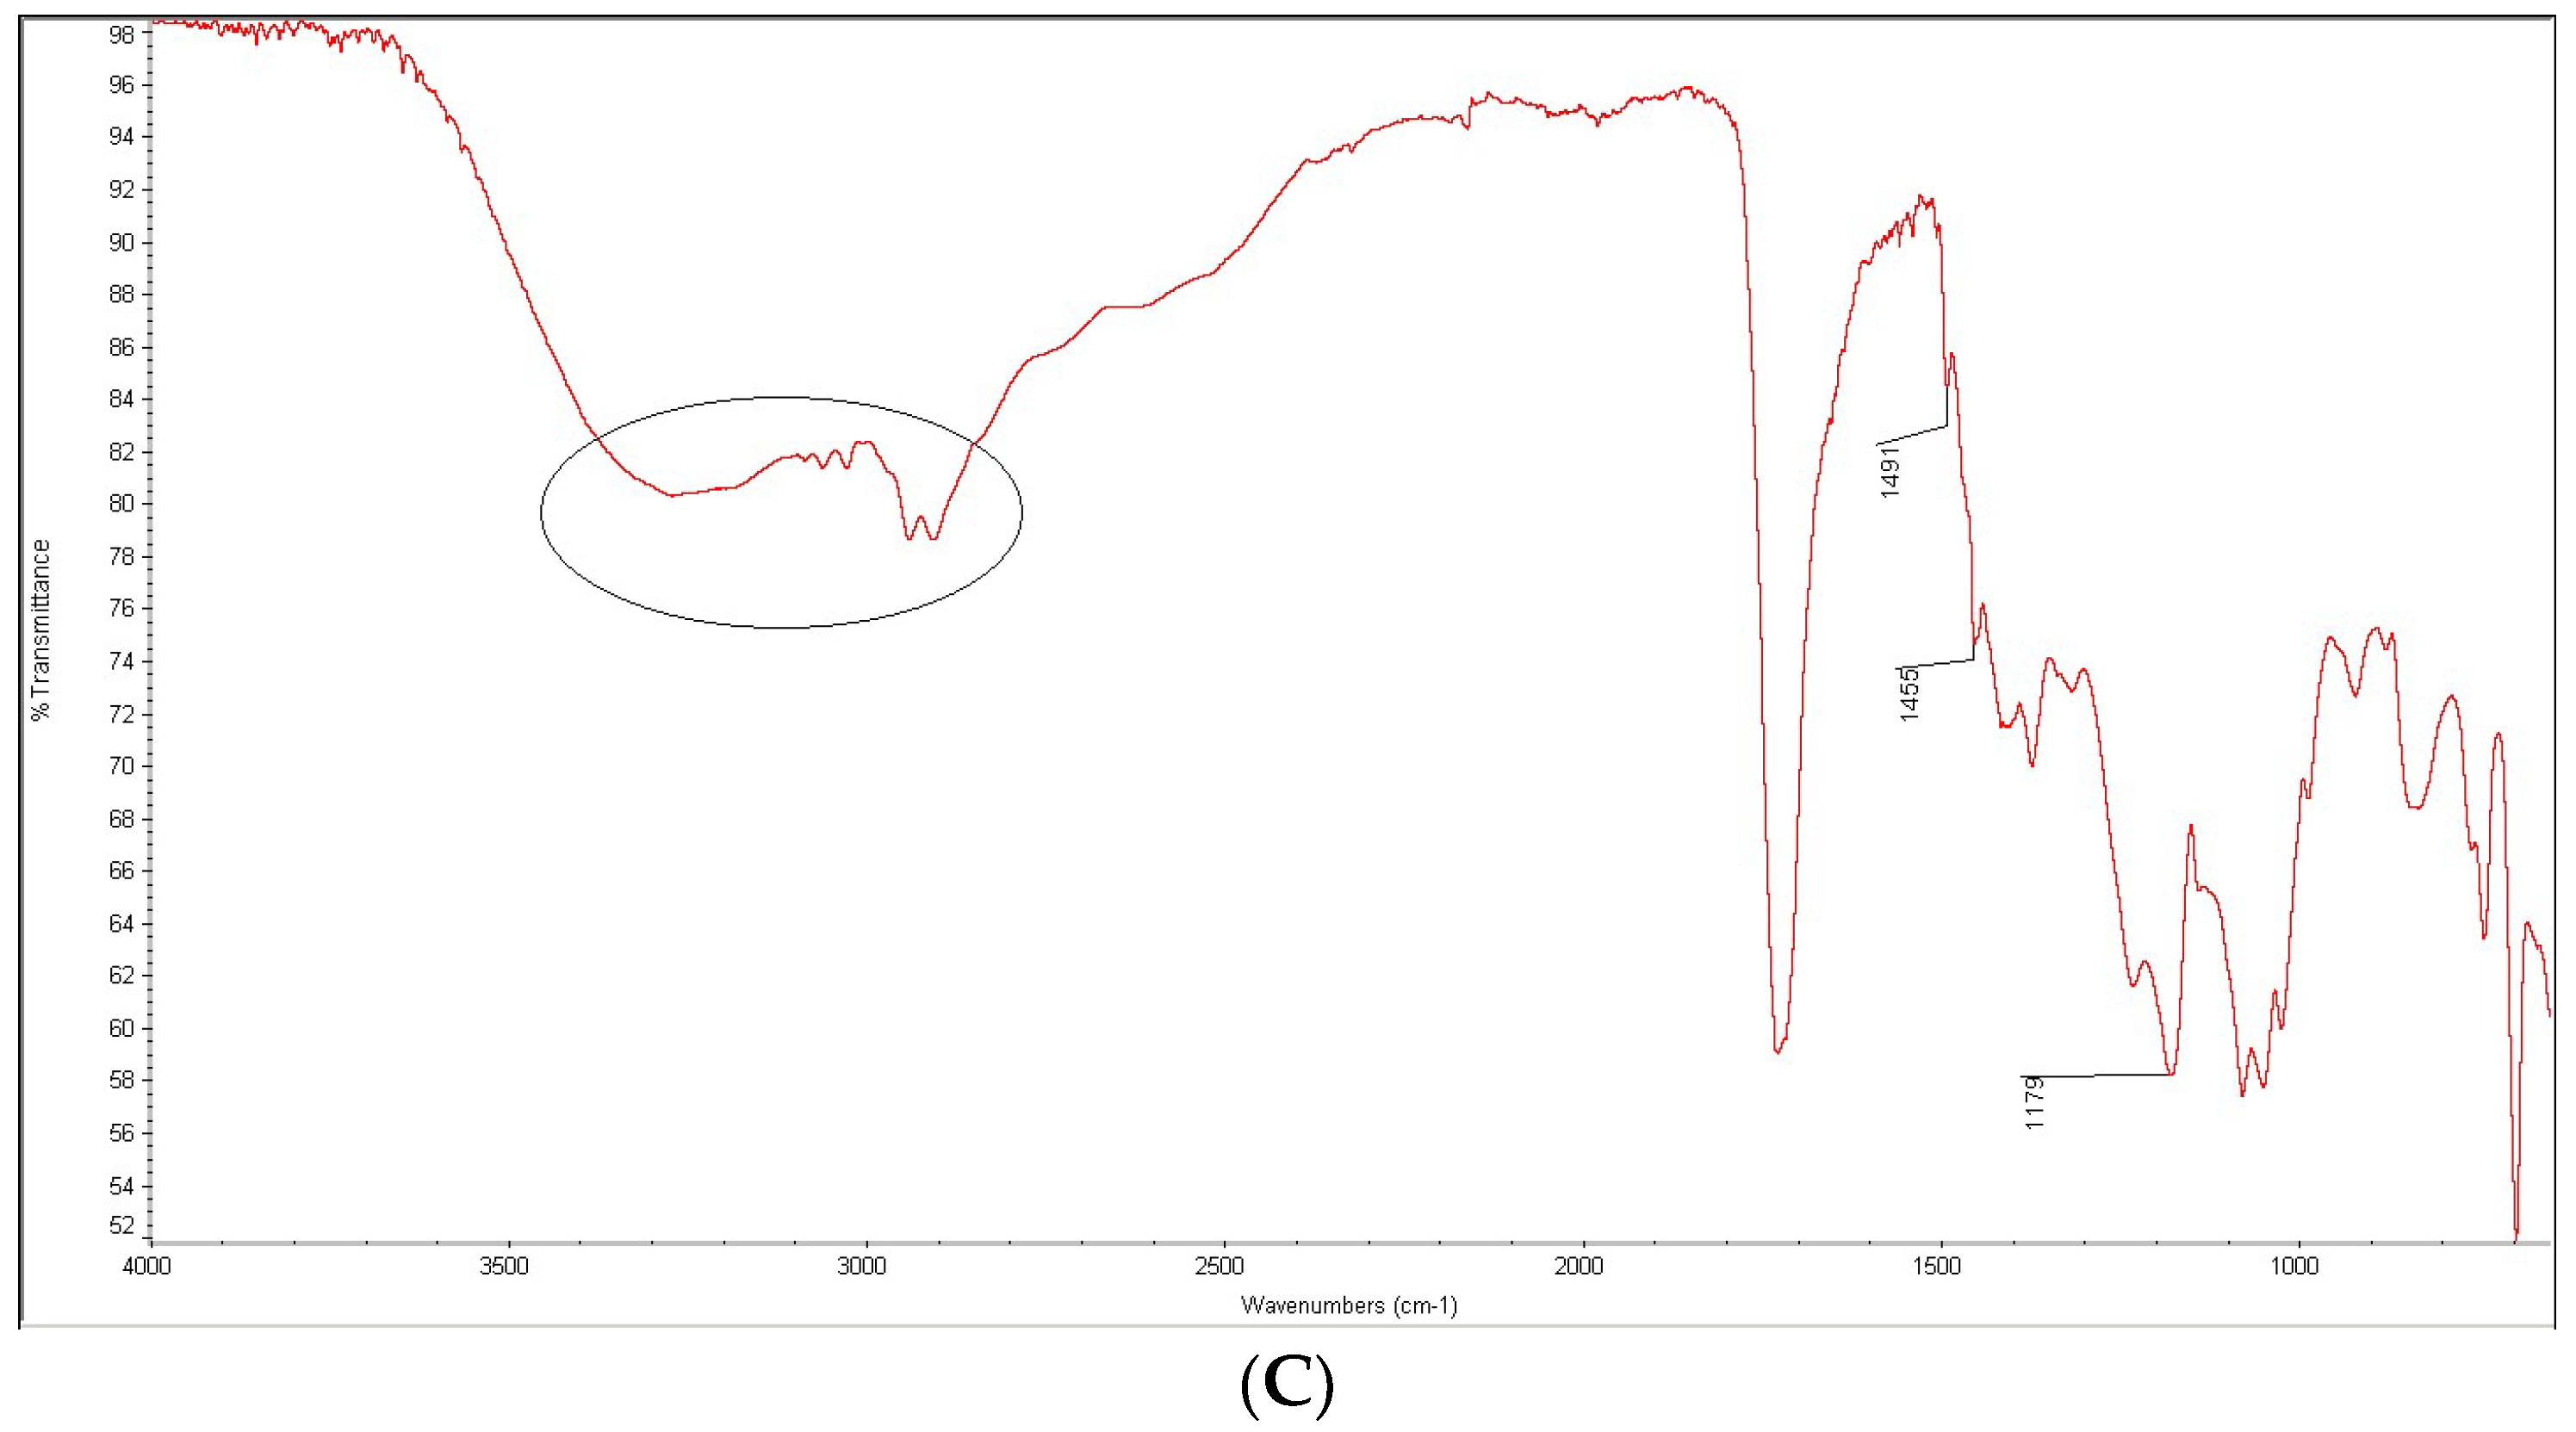
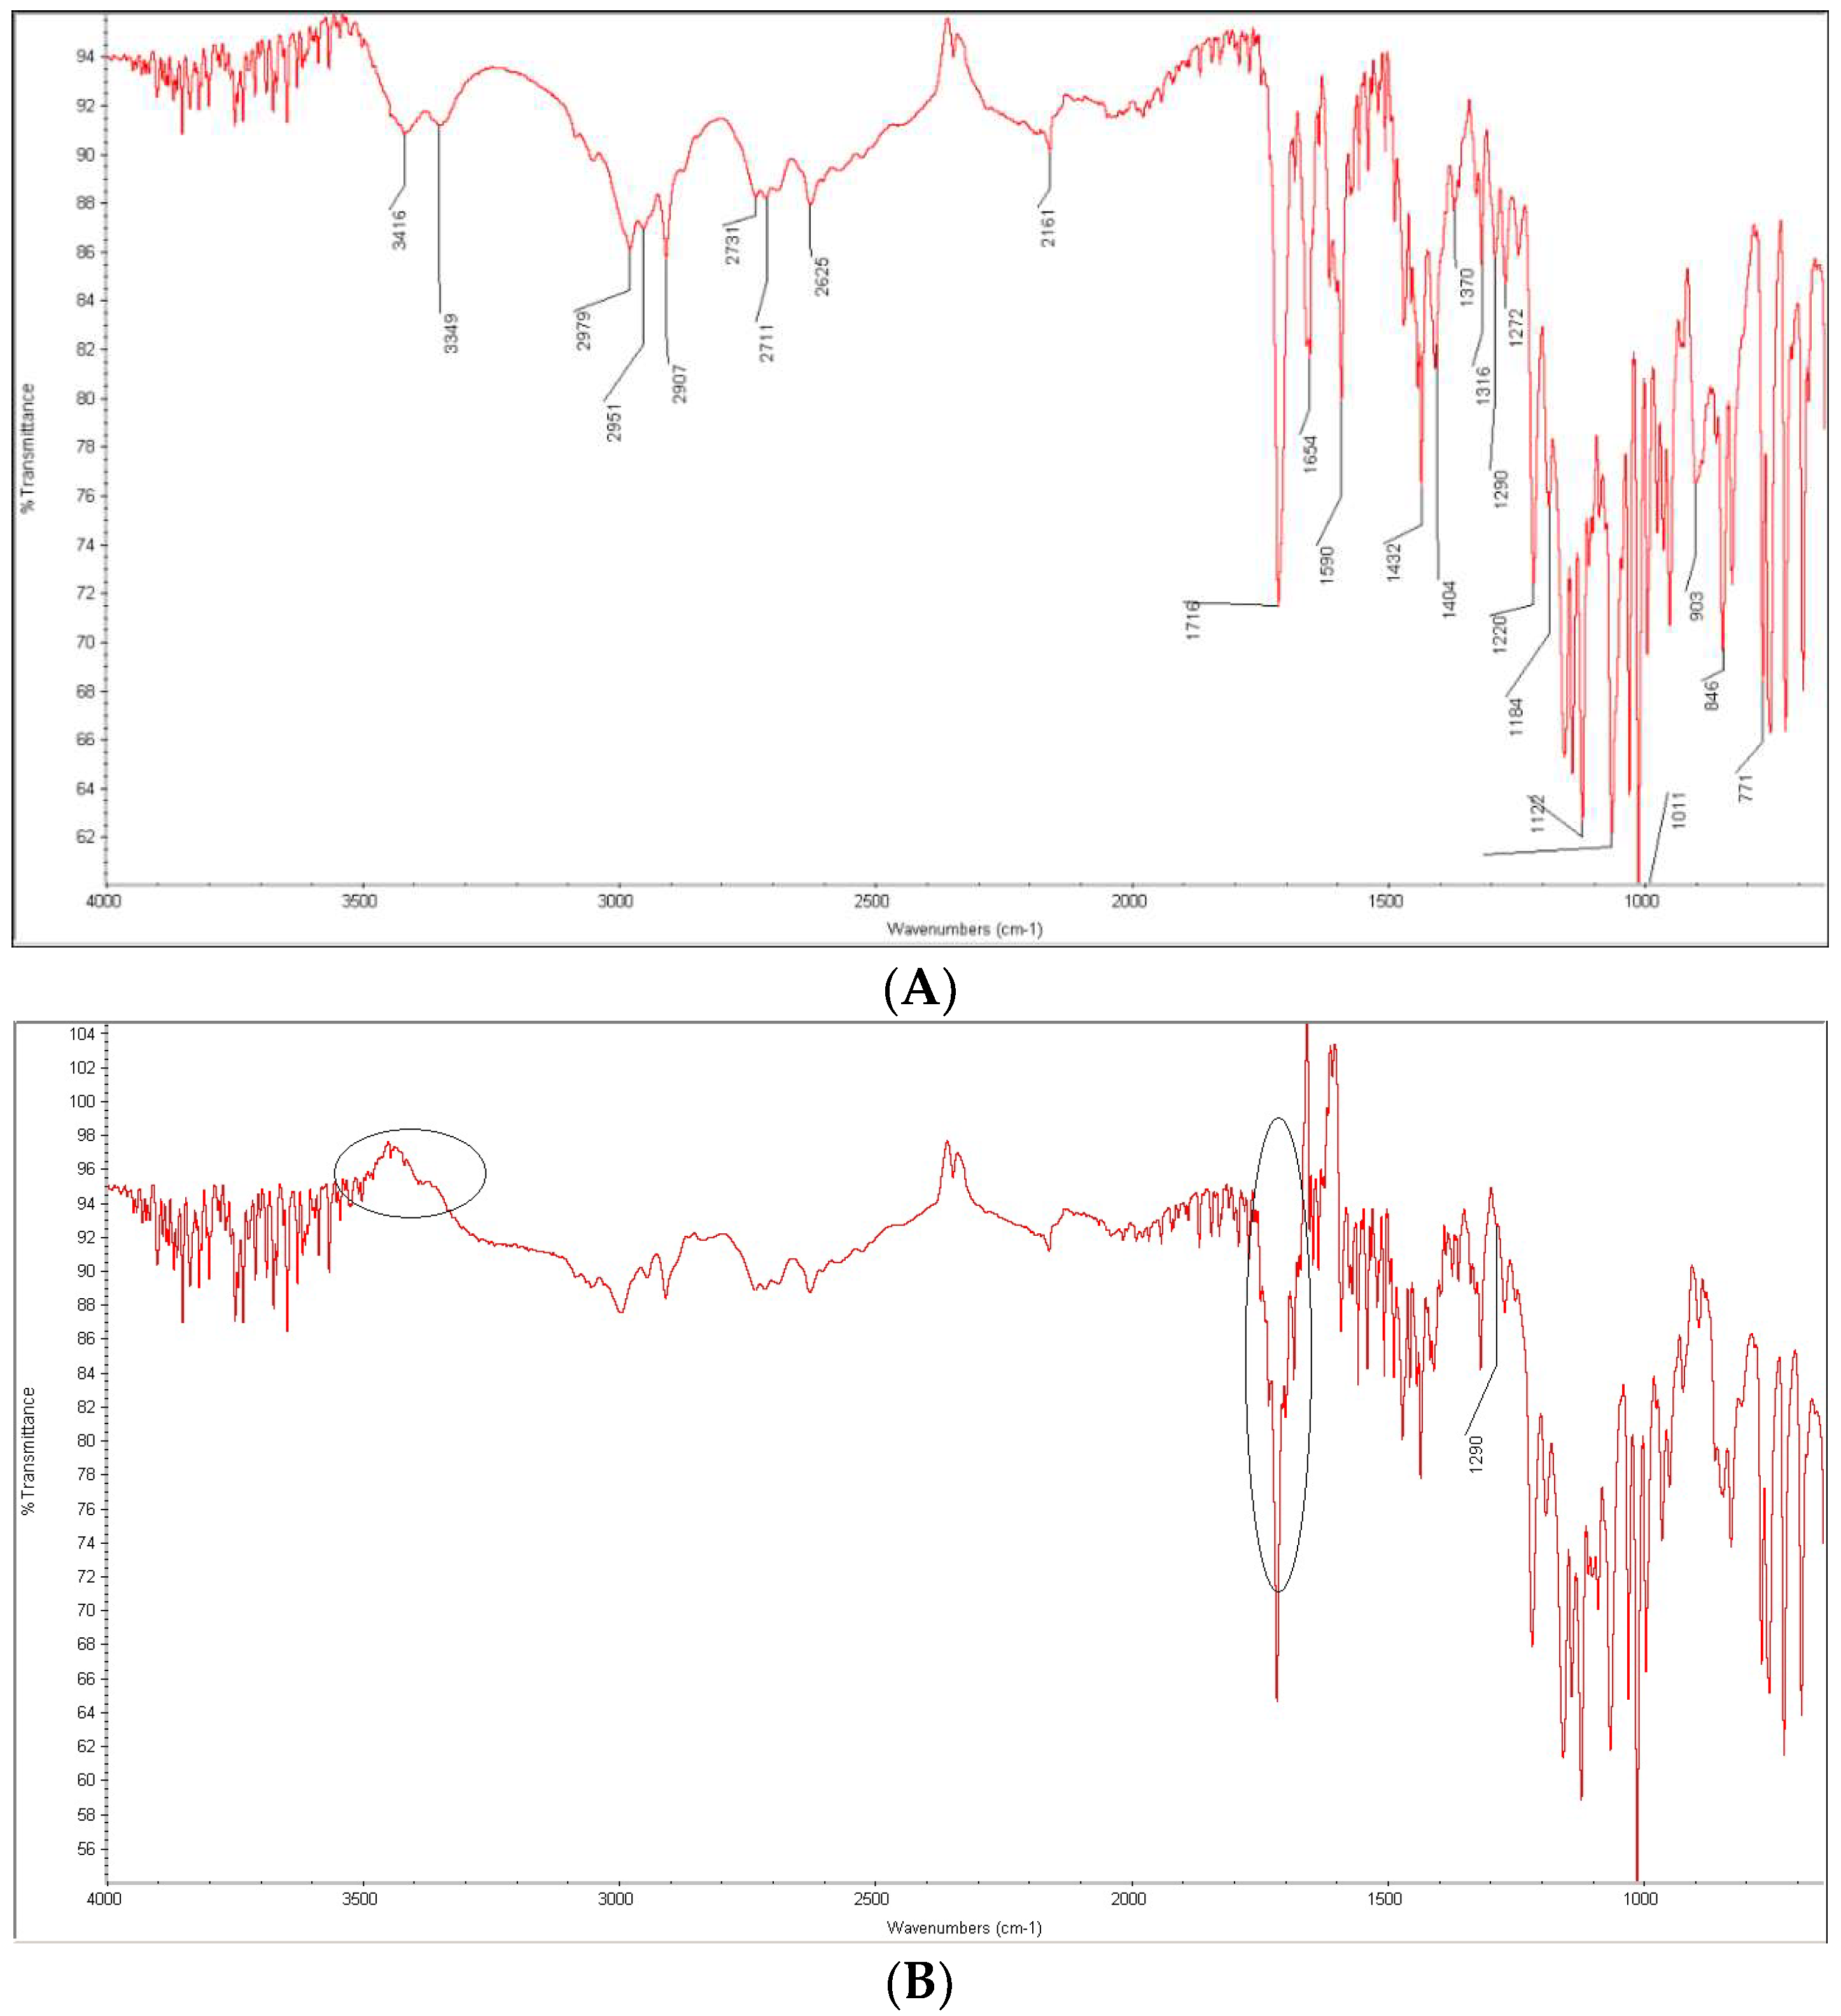
| BEPO | 3416, 3349 | |
| 2979, 2963, 2951 | O-H stretching carboxylic acids | |
| 2907 | ||
| 2731, 2711, 2625 | O-H stretching carboxylic acids | |
| 2161 | ||
| 1716, 1654 | C=O stretching carboxylic acids | |
| 1590 | C-C stretching aromatic rings | |
| 1432, 1404 | ||
| 1370 | S=O stretching sulfonate | |
| 1316, 1290, 1272 | C-O stretching C-O-C | |
| 1220, 1184, 1122 | C-O stretching C-O-C | |
| 1011 | ||
| 903, 846 | C-O stretching | |
| 771 | C-Cl stretching | |
| CA | 3494 | |
| 3380, 3287, 3275 | O-H stretching alcohols | |
| 3050 | O-H stretching carboxylic acids | |
| 1750, 1725, 1675 | C=O stretching carboxylic acids | |
| 1412, 1387, 1350 | C-H bending alkans; O-H bending | |
| 1263, 1200, 1100 | C-O stretching carboxylic acids | |
| 953, 900, 863 | O-H bending carboxylic acids | |
| PVA | 3275 | O-H stretching alcohols |
| 2925–2800 | C-H stretching alkans | |
| 1725 | C-O stretching | |
| 1413 | C-H bending alkans | |
| 1363, 1325 | C-H alkans | |
| 1251 | C-O stretching alcohols | |
Publisher’s Note: MDPI stays neutral with regard to jurisdictional claims in published maps and institutional affiliations. |
© 2022 by the authors. Licensee MDPI, Basel, Switzerland. This article is an open access article distributed under the terms and conditions of the Creative Commons Attribution (CC BY) license (https://creativecommons.org/licenses/by/4.0/).
Share and Cite
Gumieniczek, A.; Lejwoda, K.; Data, N. Chemical Stability Study of H1 Antihistaminic Drugs from the First and the Second Generations, Diphenhydramine, Azelastine and Bepotastine, in Pure APIs and in the Presence of Two Excipients, Citric Acid and Polyvinyl Alcohol. Molecules 2022, 27, 8322. https://doi.org/10.3390/molecules27238322
Gumieniczek A, Lejwoda K, Data N. Chemical Stability Study of H1 Antihistaminic Drugs from the First and the Second Generations, Diphenhydramine, Azelastine and Bepotastine, in Pure APIs and in the Presence of Two Excipients, Citric Acid and Polyvinyl Alcohol. Molecules. 2022; 27(23):8322. https://doi.org/10.3390/molecules27238322
Chicago/Turabian StyleGumieniczek, Anna, Karolina Lejwoda, and Natalia Data. 2022. "Chemical Stability Study of H1 Antihistaminic Drugs from the First and the Second Generations, Diphenhydramine, Azelastine and Bepotastine, in Pure APIs and in the Presence of Two Excipients, Citric Acid and Polyvinyl Alcohol" Molecules 27, no. 23: 8322. https://doi.org/10.3390/molecules27238322
APA StyleGumieniczek, A., Lejwoda, K., & Data, N. (2022). Chemical Stability Study of H1 Antihistaminic Drugs from the First and the Second Generations, Diphenhydramine, Azelastine and Bepotastine, in Pure APIs and in the Presence of Two Excipients, Citric Acid and Polyvinyl Alcohol. Molecules, 27(23), 8322. https://doi.org/10.3390/molecules27238322