

Flavonoid Constituents and Alpha-Glucosidase Inhibition of Solanum stramonifolium Jacq. Inflorescence with In Vitro and In Silico Studies


Abstract
1. Introduction
2. Results
2.1. Screening of Biological Activity and Chemical Constituents of S. stramonifolium Extracts
2.1.1. Alpha-Glucosidase Inhibition
2.1.2. Total Phenolic Contents (TPC) and Total Flavonoid Contents (TFC)
2.2. Combination Inhibitory Effect of S. stramonifolium Extracts and Acarbose on Alpha-Glucosidase Activity
2.3. Isolation and Identification of Isolated Compounds
2.3.1. Myricetin 3, 4′, 5′, 7-Tetramethyl ether (1)
2.3.2. Combretol (2)
2.3.3. Kaempferol (3)
2.3.4. Kaempferol 7-O-Glucopyranoside (4)
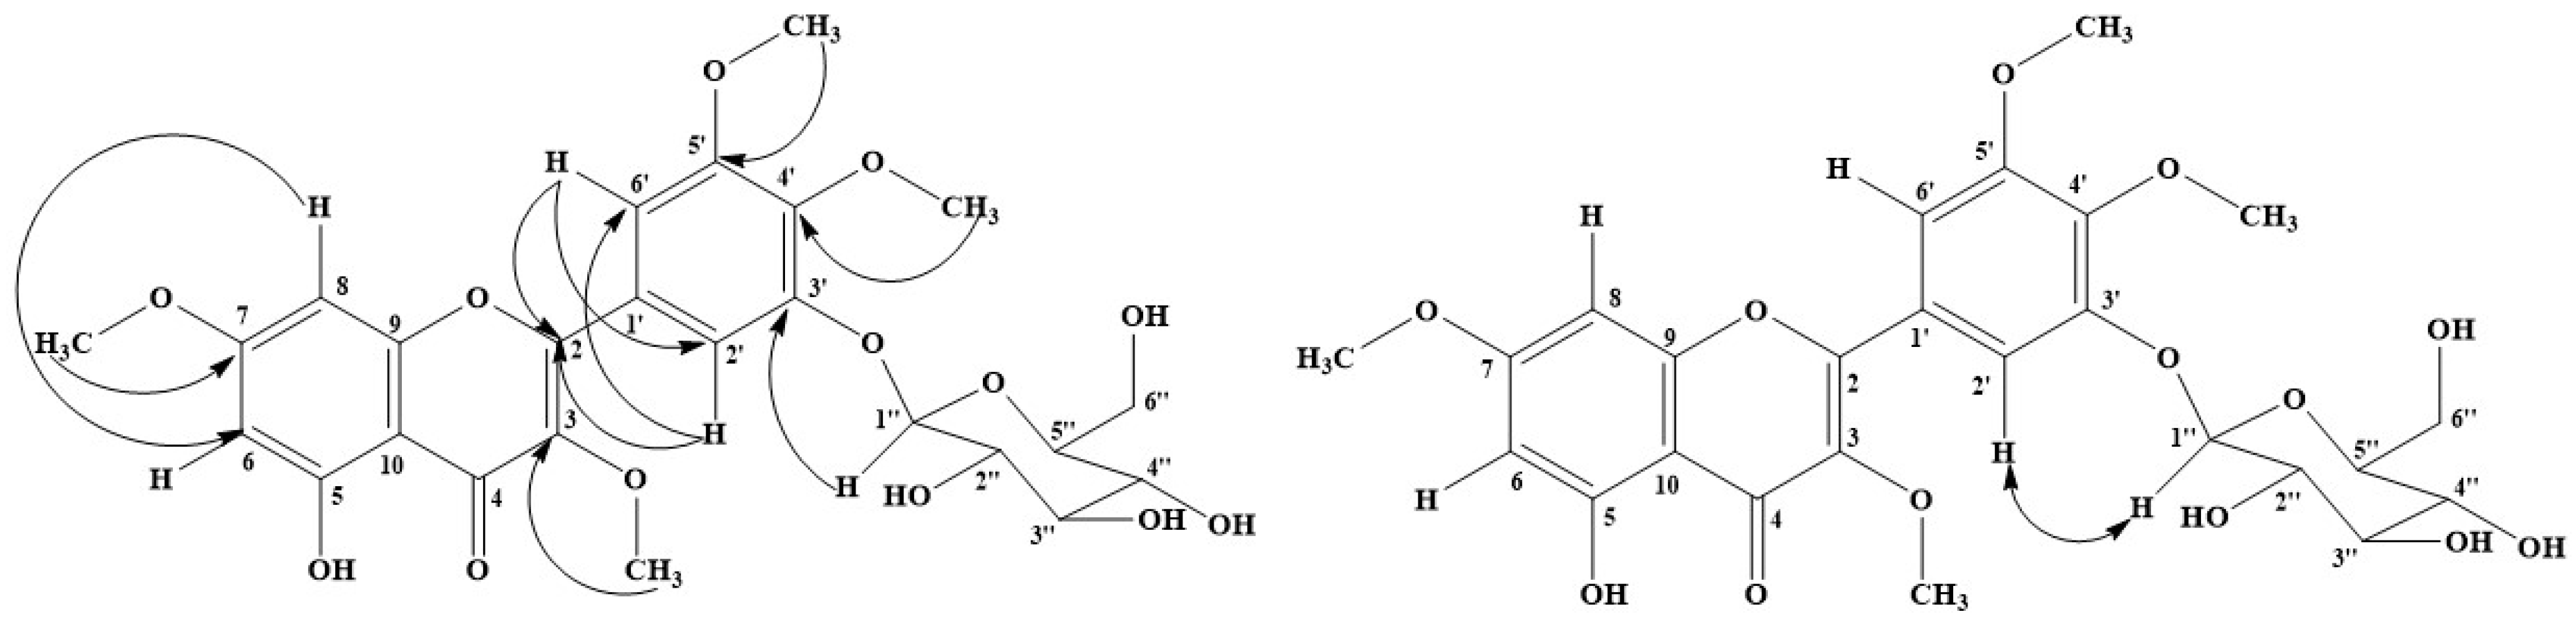
2.3.5. 5-Hydroxy 3-7-4′-5′-Tetramethoxyflavone-3′-O-glucopyranoside (5)
2.3.6. Mixture Compound (6)
Isorhamnetin 3-O-Glucopyranoside (6a)
Astragalin (6b)
2.4. Alpha-Glucosidase Inhibition Assay
2.5. Enzyme Kinetic Assay
2.6. Molecular Docking
3. Discussion
4. Experimental Section
4.1. General
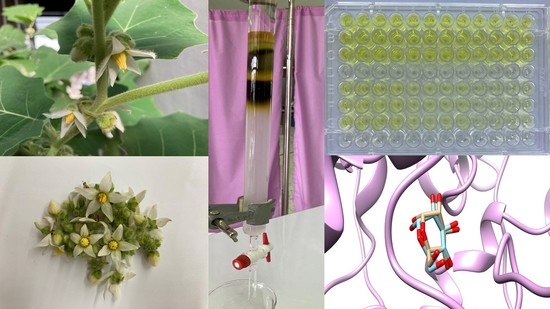
4.2. Plant Material
4.3. Extraction and Isolation
4.4. Enzymatic Assay
4.5. Total Phenolic Content (TPC)
4.6. Total Flavonoid Content (TFC)
4.7. Combination Study
4.8. Enzyme Kinetic Study
4.9. Molecular Docking
5. Conclusions
Supplementary Materials
Author Contributions
Funding
Institutional Review Board Statement
Informed Consent Statement
Data Availability Statement
Acknowledgments
Conflicts of Interest
Sample Availability
References
- IDF Diabetes Atlas Tenth Edition 2021. International Diabetes Federation (IDF). Available online: https://diabetesatlas.org/idfawp/resource-files/2021/07/IDF_Atlas_10th_Edition_2021.pdf (accessed on 12 July 2022).
- Mollor, D.E. New drug targets for type 2 diabetes and the metabolic syndrome. Nature 2001, 414, 821–827. [Google Scholar] [CrossRef] [PubMed]
- Chou, T.C. Drug combination studies and their synergy quantification using the Chu-Talalay method. Cancer Res. 2010, 70, 440–446. [Google Scholar] [CrossRef] [PubMed]
- Gao, J.; Xu, P.; Wang, Y.; Wang, Y.; Hochstetter, D. Combined effect of green tea extracts, green tea polyphenols or epigallocatechin gallate with acarbose on inhibition against α-amylase and α-glucosidase in vitro. Molecules 2013, 18, 11614–11623. [Google Scholar] [CrossRef] [PubMed]
- Ferreira, L.G.; Santos, R.N.; Oliva, G.; Andricopulo, A.D. Molecular docking and structure-based drug design strategies. Molecules 2015, 20, 13384–13421. [Google Scholar] [CrossRef]
- Kaunda, J.S.; Zhang, Y.-J. The genus Solanum: An ethanopharmacological, phytochemical and biological properties review. Nat. Prod. Bioprospect. 2019, 9, 77–137. [Google Scholar] [CrossRef]
- Chidambaram, K.; Alqahtani, T.; Alghazwani, Y.; Aldahish, A.; Annadurai, S.; Venkatesan, K.; Dhandapani, K.; Thailagam, E.; Venkatesan, K.; Paulsamy, P.; et al. Medicinal plants of Solanum species: The promising sources of phyto-insecidal compounds. J. Trop. Med. 2022, 4952221, 1–22. [Google Scholar] [CrossRef]
- Kandimalla, R.; Kalita, S.; Choudhury, B.; Kotoky, J. A review on anti-diabetic potential of gunus Solanum (Solanaceae). J. Drug Deliv. Ther. 2015, 5, 24–27. [Google Scholar]
- Silva, T.M.S.; Camara, A.C.; Agra, M.F. Flavonoid aglycone in species of Solanum. Rev. Bras. Farmacogn. 2022, 32, 201–210. [Google Scholar] [CrossRef]
- Łuzny, M.; Tronina, T.; Kozłowska, E.; Kostrzewa-Susłow, E.; Janeczko, T. Biotransformation of 5,7-methoxyflavones by selected entomopathogenic filamentous fungi. J. Agric. Food Chem. 2021, 69, 3879–3886. [Google Scholar] [CrossRef]
- Lee, Y.S.; Lee, S.; Lee, H.S.; Kim, B.; Ohuchi, K.; Shin, K.H. Inhibitory effects of isorhamnetin-3-O-b-D-glucoside from Salicornia herbacea on rat lens aldose reductase and sorbitol accumulation in streptozotocin-induced diabetic rat tissues. Biol. Pharm. Bull. 2005, 28, 916–918. [Google Scholar] [CrossRef]
- Boittier, E.D.; Tang, Y.Y.; Buckley, M.E.; Schuurs, Z.P.; Richard, D.J.; Gandhi, N.S. Assessing molecular docking tools to guide targeted drug discovery of CD38 inhibitors. Int. J. Mol. Sci. 2020, 21, 5183. [Google Scholar] [CrossRef] [PubMed]
- Peng, X.; Zhang, G.; Liao, Y.; Gong, D. Inhibitory kinetics and mechanism of kaempferol on α-glucosidase. Food Chem. 2016, 190, 207–215. [Google Scholar] [CrossRef] [PubMed]
- Li, Y.; Zhan, L.; Xu, C.; Jiang, H.; Zhu, C.; Sun, L.; Sun, C.; Li, X. α-Glucosidase inhibitors from Chinese bayberry (Morella rubra Sieb et Zucc.) fruit; molecular docking and interaction mechanism of flavonols with different B-ring hydroxylation. RSC Adv. 2020, 10, 29347. [Google Scholar] [CrossRef] [PubMed]
- Şöhretoğlua, D.; Sarib, S.; Barutc, B.; Özelc, A. Discovery of potent α-glucosidase inhibitor flavonols: Insights into mechanism of action through inhibition kinetics and docking simulations. Biorg. Chem. 2018, 79, 257–264. [Google Scholar] [CrossRef]
- Jin, D.; He, J.; Zhang, K.; Luo, X.; Zhang, T. α-Glucosidase inhibition action of major flavonoids identified from Hypericum attenuatum Choisy and their synergistic effects. Chem. Biodivers. 2021, 18, e2100244. [Google Scholar] [CrossRef] [PubMed]
- Copeland, R.A. Reversible modes of inhibitor interactions with enzymes. In Evaluation of Enzyme Inhibitors in Drug Discovery: A Guide for Medicinal Chemists and Pharmacologists; John Wiley & Sons: Hoboken, NJ, USA, 2005; pp. 48–81. [Google Scholar]
- Xiao, J.B.; Högger, P. Dietary polyphenols and type 2 diabetes: Current insights and future perspectives. Curr. Med. Chem. 2015, 22, 23–38. [Google Scholar] [CrossRef] [PubMed]
- Şöhretoğlu, D.; Sari, S. Flavonoids as alpha-glucosidase inhibitors: Mechanistic approaches merged with enzyme kinetics and molecular modelling. Phytochem. Rev. 2020, 19, 1081–1092. [Google Scholar] [CrossRef]
- Proença, C.; Ribeiro, D.; Freitas, M.; Fernandes, E. Flavonoids as potential agents in the management of type 2 diabetes through the modulation of α-amylase and α-glucosidase activity: A review. Crit. Rev. Food Sci. Nutr. 2021, 62, 3137–3207. [Google Scholar] [CrossRef]
- Yamamoto, K.; Miyake, H.; Kusunoki, M.; Osaki, S. Crystal structures of isomaltase from Saccharomyces cerevisiae and in complex with its competitive inhibitor maltose. FEBS J. 2010, 277, 4205–4214. [Google Scholar] [CrossRef]
- Amin, S.; Ullah, B.; Ali, M.; Rauf, A.; Khan, H.; Uriarte, E.; Sobarzo-Sánchez, E. Potent in vitro α-glucosidase inhibition of secondary metabolites derived from Dryopteris cycadina. Molecules 2019, 24, 427. [Google Scholar] [CrossRef]
- Dej-adisai, S.; Pitakbut, T. Determination of α-glucosidase inhibitory activity from selected Fabaceae plants. Pak. J. Pharm. Sci. 2015, 28, 1679–1683. [Google Scholar] [PubMed]
- Chanthasri, W.; Puangkeaw, N.; Kunworarath, N.; Jaisamut, P.; Limsuwan, S.; Maneenoon, K.; Choochana, P.; Chusri, S. Antioxidant capacities and total phenolic contents of 20 polyherbal remedies used as tonics by folk healers in Phatthalung and Songkhla provinces, Thailand. BMC Complement. Altern. Med. 2018, 18, 73. [Google Scholar] [CrossRef] [PubMed]
- Sakulkeo, O.; Wattanapiromsakul, C.; Pitakbut, T.; Dej-adisai, S. Alpha-glucosidase inhibition and molecular docking of isolated compounds from traditional Thai medicine plant, Neuropeltis racemosa Wall. Molecules 2022, 27, 639. [Google Scholar] [CrossRef] [PubMed]
- Trott, O.; Olson, A.J. AutoDock Vina: Improving the speed and accuracy of docking with a new scoring function, efficient optimization, and multithreading. J. Comput. Chem. 2010, 31, 455–461. [Google Scholar] [CrossRef] [PubMed]
- Morris, G.M.; Huey, R.; Lindstrom, W.; Sanner, M.F.; Belew, R.K.; Goodsell, D.S.; Olson, A.J. AutoDock4 and AutoDockTools4: Automated docking with selective receptor flexibility. J. Comput. Chem. 2009, 30, 2785–2791. [Google Scholar] [CrossRef]
- Dej-adisai, S.; Rais, I.R.; Wattanapiromsakul, C.; Pitabut, T. Alpha-glucosidase inhibitory assay-screened isolation and molecular docking model from Bauhinia pulla active compounds. Molecules 2021, 26, 5970. [Google Scholar] [CrossRef]
- Phoopha, S.; Wattanapiromsakul, C.; Pitakbut, T.; Dej-Adisai, S. A new stilbene derivative and isolated compounds from Bauhinia pottsii var. pottsii with their anti-alpha-glucosidase activity. Pharmacogn. Mag. 2020, 16, 161. [Google Scholar]
- Phoopha, S.; Wattanapiromsakul, C.; Pitakbut, T.; Dej-adisai, S. Chemical constituents of Litsea elliptica and their alpha-glucosidase inhibition with molecular docking. Pharmacogn. Mag. 2020, 16, 327. [Google Scholar]
- Chetty, S.; Soliman, M.E.S. Possible allosteric binding site on Gyrase B, a key target for novel anti-TB drugs: Homology modelling and binding site identification using molecular dynamics simulation and binding free energy calculations. Med. Chem. Res. 2015, 24, 2055–2074. [Google Scholar] [CrossRef]
- Hanwell, M.D.; Curtis, D.E.; Lonie, D.C.; Vandermeersch, T.; Zurek, E.; Hutchison, G.R. Avogadro: An advanced semantic chemical editor, visualization, and analysis platform. J. Cheminform. 2012, 4, 17. [Google Scholar] [CrossRef]
- Pettersen, E.F.; Goddard, T.D.; Huang, C.C.; Couch, G.S.; Greenblatt, D.M.; Meng, E.C.; Ferrin, T.E. UCSF Chimera-a visualization system for exploratory research and analysis. J. Comput. Chem. 2004, 25, 1605–1612. [Google Scholar] [CrossRef] [PubMed]


| Extracts | % Yield Extraction | % Inhibition at 2 mg/mL | IC50 (µg/mL) | TPC mg GAE/g Extract | TFC mg CAE/g Extract |
|---|---|---|---|---|---|
| SSIE | 6.35 | 97.98 ± 0.64 | 81.27 | 0.318 ± 0.001 | 80.541 ± 2.010 |
| SSHX | 2.45 | 11.65 ± 9.44 | 3.13 a | 0.034 ± 0.000 | 21.247 ± 0.623 |
| SSEA | 1.01 | 92.79 ± 1.07 | 215.92 | 0.073 ± 0.002 | 25.012 ± 0.471 |
| SSEO | 1.51 | 96.63 ± 0.65 | 221.67 | 0.261 ± 0.003 | 69.012 ± 2.457 |
| SSWT | 29.55 | 69.34 ± 1.76 | 324.44 | 0.118 ± 0.001 | 27.600 ± 0.471 |
| Acarbose (Positive control) | - | 76.44 ± 3.06 | 241.40 | - | - |
| Compounds | % Inhibition | |
|---|---|---|
| at 400 μg/mL | at 200 μg/mL | |
| Myricetin 3, 4′, 5′, 7-tetramethyl ether (1) | 12.78 ± 4.89 | - |
| Combretol (2) | 8.51 ± 3.79 | - |
| Kaempferol (3) | 13.01 ± 2.69 | - |
| Kaempferol 7-O-glucopyranoside (4) | 7.68 ± 0.33 | - |
| 5-Hydroxy 3-7-4′-5′-tetramethoxyflavone-3′-O-glucopyranoside (5) | - | 0.84 ± 0.21 |
| Mixture of isorhamnetin 3-O-glucopyranoside (6a) and astragalin (6b) | 1.99 ± 5.42 | - |
| Acarbose (Positive control) | 60.78 ± 3.61 | 45.27 ± 4.5 |
| Compounds | IC50 (µg/mL) | Inhibition Type | Ki (µM) |
|---|---|---|---|
| Kaempferol | 585.63 | Mixed | - |
| Astragalin | >600 | Mixed | - |
| Acarbose (Positive control) | 191.12 | Competitive | 110.48 |
| No | Residues | Compounds | Consensus | ||||||
|---|---|---|---|---|---|---|---|---|---|
| Myricetin Derivatives | Kaempferol Derivatives | Other | |||||||
| 1 | 2 | 5 | 3 | 4 | 6b | 6a | |||
| 1 | ASP69 | - | - | - | - | ✓ | - | - | 1 |
| 2 | TYR72 | - | - | - | - | ✓ | ✓ | - | 2 |
| 3 | HIS112 | ✓ | ✓ | - | - | ✓ | - | - | 3 |
| 4 | TYR158 | ✓ | ✓ | ✓ | ✓ | - | ✓ | ✓ | 6 |
| 5 | PHE159 | - | - | ✓ | - | - | - | - | 1 |
| 6 | PHE178 | ✓ | ✓ | ✓ | - | - | - | - | 3 |
| 7 | ASP215 | ✓ | - | ✓ | - | ✓ | - | ✓ | 4 |
| 8 | VAL216 | - | - | ✓ | - | - | - | ✓ | 2 |
| 9 | GLU277 | ✓ | - | ✓ | ✓ | - | ✓ | ✓ | 5 |
| 10 | GLN279 | - | - | - | - | - | ✓ | ✓ | 2 |
| 11 | HIS280 | - | ✓ | ✓ | - | - | - | - | 2 |
| 12 | PHE303 | - | - | - | - | - | ✓ | ✓ | 2 |
| 13 | THR306 | - | - | ✓ | - | - | - | - | 1 |
| 14 | ASP307 | - | ✓ | - | - | - | - | - | 1 |
| 15 | ARG315 | ✓ | ✓ | ✓ | ✓ | ✓ | ✓ | ✓ | 7 |
| 16 | TYR316 | - | ✓ | ✓ | - | - | - | - | 2 |
| 17 | TYR347 | - | - | ✓ | - | - | ✓ | - | 2 |
| 18 | ASN350 | - | - | ✓ | - | - | ✓ | ✓ | 3 |
| 19 | HIS351 | - | - | - | - | ✓ | - | - | 1 |
| 20 | ASP352 | ✓ | ✓ | ✓ | ✓ | - | ✓ | ✓ | 6 |
| 21 | GLN353 | - | - | ✓ | - | - | ✓ | - | 2 |
| 22 | GLU411 | - | - | - | - | ✓ | - | - | 1 |
| 23 | ASN415 | - | - | ✓ | - | - | - | - | 1 |
| 24 | ARG442 | ✓ | ✓ | ✓ | ✓ | - | ✓ | ✓ | 6 |
| 25 | ARG446 | - | - | - | - | ✓ | - | - | 1 |
| Total | 8 | 9 | 16 | 5 | 8 | 11 | 10 | ||
| Autodock 4.2.6 | Autodock Vina | ||||||||
|---|---|---|---|---|---|---|---|---|---|
| Compound | vdW+ Hbond (I) | Elec. Energy (II) | Desol. Energy (III) | Total Intermol. Interact. Energy (IV; I + II + III) | Total Internal Energy (V) | Tors. Free Energy (VI) | Unbound’s Energy (VII) | Binding Energy (Kcal/mol) (VIII; IV + V + VI + VII) | Affinity (Kcal/mol) |
| Myricetin derivatives | |||||||||
| 1 | −7.49 * | 0.06 | 5.53 | −1.90 | −2.05 | 2.09 | 0.00 | −1.86 | −6.6 |
| 2 | −10.43 | 0.47 | 5.51 | −4.46 | −1.16 | 2.09 | 0.00 | −3.53 | −6.0 |
| 5 | 51.35 * | 0.86 | 9.30 * | 61.50 | −1.60 | 3.88 | 0.00 | 63.78 | 0.0 |
| Kaempferol derivatives | |||||||||
| 3 | −7.99 | 0.26 | 4.22 | −3.50 | −1.01 | 1.49 | 0.00 | −3.02 | −5.9 |
| 4 | −9.62 * | −0.10 | 7.91 * | −1.80 | −2.77 | 3.28 | 0.00 | −1.29 | −4.6 |
| 6b | 47.06 * | 0.29 | 7.62 | 54.97 | −2.78 | 3.28 | 0.00 | 55.47 | −4.2 |
| Other | |||||||||
| 6a | −12.98 * | 0.23 | 8.34 * | −4.41 | −2.07 | 3.58 | 0.00 | −2.90 | −6.3 |
Publisher’s Note: MDPI stays neutral with regard to jurisdictional claims in published maps and institutional affiliations. |
© 2022 by the authors. Licensee MDPI, Basel, Switzerland. This article is an open access article distributed under the terms and conditions of the Creative Commons Attribution (CC BY) license (https://creativecommons.org/licenses/by/4.0/).
Share and Cite
Dej-adisai, S.; Sakulkeo, O.; Wattanapiromsakul, C.; Pitakbut, T. Flavonoid Constituents and Alpha-Glucosidase Inhibition of Solanum stramonifolium Jacq. Inflorescence with In Vitro and In Silico Studies. Molecules 2022, 27, 8189. https://doi.org/10.3390/molecules27238189
Dej-adisai S, Sakulkeo O, Wattanapiromsakul C, Pitakbut T. Flavonoid Constituents and Alpha-Glucosidase Inhibition of Solanum stramonifolium Jacq. Inflorescence with In Vitro and In Silico Studies. Molecules. 2022; 27(23):8189. https://doi.org/10.3390/molecules27238189
Chicago/Turabian StyleDej-adisai, Sukanya, Oraphan Sakulkeo, Chatchai Wattanapiromsakul, and Thanet Pitakbut. 2022. "Flavonoid Constituents and Alpha-Glucosidase Inhibition of Solanum stramonifolium Jacq. Inflorescence with In Vitro and In Silico Studies" Molecules 27, no. 23: 8189. https://doi.org/10.3390/molecules27238189
APA StyleDej-adisai, S., Sakulkeo, O., Wattanapiromsakul, C., & Pitakbut, T. (2022). Flavonoid Constituents and Alpha-Glucosidase Inhibition of Solanum stramonifolium Jacq. Inflorescence with In Vitro and In Silico Studies. Molecules, 27(23), 8189. https://doi.org/10.3390/molecules27238189