Article

Folding Dynamics of 3,4,3-LI(1,2-HOPO) in Its Free and Bound State with U4+ Implicated by MD Simulations

1
State Key Laboratory of Chemical Resource Engineering, Beijing Advanced Innovation Center for Soft Matter Science and Engineering, Beijing University of Chemical Technology, Beijing 100029, China
2
State Key Laboratory of Fine Chemicals, Liaoning Key Laboratory for Catalytic Conversion of Carbon Resources, School of Chemical Engineering, Dalian University of Technology, Dalian 116024, China
3
CAS-HKU Joint Laboratory of Metallomics on Health and Environment, Multidisciplinary Initiative Center, Institute of High Energy Physics, Chinese Academy of Sciences, Beijing 100049, China
*
Authors to whom correspondence should be addressed.
Molecules 2022, 27(23), 8151; https://doi.org/10.3390/molecules27238151
Submission received: 8 October 2022 / Revised: 18 November 2022 / Accepted: 20 November 2022 / Published: 23 November 2022
(This article belongs to the Special Issue Actinoids in Biologic Systems and Catalysis)

Abstract

:
The octadentate hydroxypyridonate ligand 3,4,3-LI(1,2-HOPO) (t-HOPO) shows strong binding affinity with actinide cations and is considered as a promising decorporation agent used to eliminate in vivo actinides, while its dynamics in its unbound and bound states in the condensed phase remain unclear. In this work, by means of MD simulations, the folding dynamics of intact t-HOPO in its neutral (t-HOPO0) and in its deprotonated state (t-HOPO4) were studied. The results indicated that the deprotonation of t-HOPO in the aqueous phase significantly narrowed the accessible conformational space under the simulated conditions, and it was prepared in a conformation that could conveniently clamp the cations. The simulation of UIV-t-HOPO showed that the tetravalent uranium ion was deca-coordinated with eight ligating O atoms from the t-HOPO4 ligand, and two from aqua ligands. The strong electrostatic interaction between the U4+ ion and t-HOPO4 further diminished the flexibility of t-HOPO4 and confined it in a limited conformational space. The strong interaction between the U4+ ion and t-HOPO4 was also implicated in the shortened residence time of water molecules.

1. Introduction

The accumulation of radioactive metals in organisms causes damage to tissues and organs owing to their chemical and radio toxicity [1,2]. In order to decorporate in vivo radioactive metal ions, a few chelating agents have been proposed in the past few decades [3,4]. Owing to complex biological conditions, e.g., variations in pathology and the redox of metal ions, the development of decorporation agents turned out to be challenging [5], and the earlier reported ethylenediaminetetraacetic acid (EDTA) [6] was deprecated due to its high affinity with divalent metal ions [7]. EDTA was first used as an analytical agent for calcium due to its high affinity for Ca(II) (logKCaL = 10.28) in 1947 [8]. Later studies have shown that it is able to remove in vivo 239Pu and 241Am, as it benefitted from its high complexation ability toward Pu [9]. Diethylenetriaminepentaacetic acid (DTPA) was reported in 1954 as an alternative to EDTA. It shows good selectivity between divalent metal ions and tri-/tetravalent actinides [10], and its salts have been approved for clinic use as actinide chelators. However, it is flawed in its, e.g., insufficient sequestering strength, and it has low efficiency for the removal of hydrolyzed or intracellular actinides [11,12]. Ideal decorporation agents are expected to meet the requirements of free of toxicity, high selectivity, and strong binding strength.
Stimulated by siderophores, which are secreted by microorganisms and responsible for iron trafficking from the host owing to their high iron affinity [13,14], many sequestering agents have been developed to target actinides. These compounds were divided into five categories by Raymond et al. [14]. according to their functional group: (1) catecholamide (CAM) ligands; (2) terephthalamide (TAM) ligands; (3) hydroxypyridinone (HOPO) ligands; (4) mixed ligands; and (5) sulfonamide ligands. The development of the actinide decorporation agents has been reviewed recently [15]. Among these ligands, HOPOs, which coin a hydroxyl and a keto group on a hexa-membered azaheterocycle and are classified into three classes, i.e., 1-hydroxypyridin-2-one (1,2-HOPO), 3-hydroxypyridin-2-one (3,2-HOPO), and 3-hydroxypyridin-4-one (3,4-HOPO) [16], have been used as building blocks to develop a large number of chelating agents. Their in vivo decorporation efficiency for actinides has been evaluated, and the octadentate hydroxypyridinonate ligand, 3,4,3-LI(1,2-HOPO), denoted here as t-HOPO, is one of the most promising candidates for new decorporation therapies. The t-HOPO exhibits high affinity and selectivity [17] to bind with thorium [18], uranium [19], neptunium [20], plutonium [21,22,23], americium [20], curium [20,24], berkelium [25], californium [25] and lanthanides [26], and is regarded as a better actinide decorporation agent than DTPA [20]. Recently, Abergel and coworkers [21] measured the stability constants of tetravalent plutonium and thorium complexed with t-HOPO, and Yang and coworkers [27] reported a DFT study to reveal the bond property between t-HOPO and tri-/tetravalent actinides.
These studies improved our understanding of the interaction modes between t-HOPO and actinides, while the dynamics of t-HOPO and its complexation with actinides in the aqueous phase remain unclear. This motivated the present work in which we applied molecular dynamics simulations to study the folding equilibria of t-HOPO in its neutral and deprotonated states in aqueous solution. Its complexation with tetravalent uranium (U4+) was also investigated here to offer insights on the influence of its complexation with monatomic cations in the aqueous phase. As the most important naturally occurring actinide and a global environmental contaminant, uranium was identified to exist mainly in tetra- and hexa-valent states in the oxidative environment. In recent studies, U4+ has been shown to be stable under physiologic conditions, and its coordination with t-HOPO enhances its stability in the aqueous phase [28], while we lack understanding of the coordination mode and dynamics of the complex at the molecular level. In this work, choosing the UIV(t-HOPO) complex as an exemplar enabled us not only to address the influence of the coordination on the dynamics of t-HOPO, but also shed light on the migration of in vivo U4+ captured by t-HOPO.

2. Results and Discussion

2.1. HOPO in Its Neutral and Deprotonated States

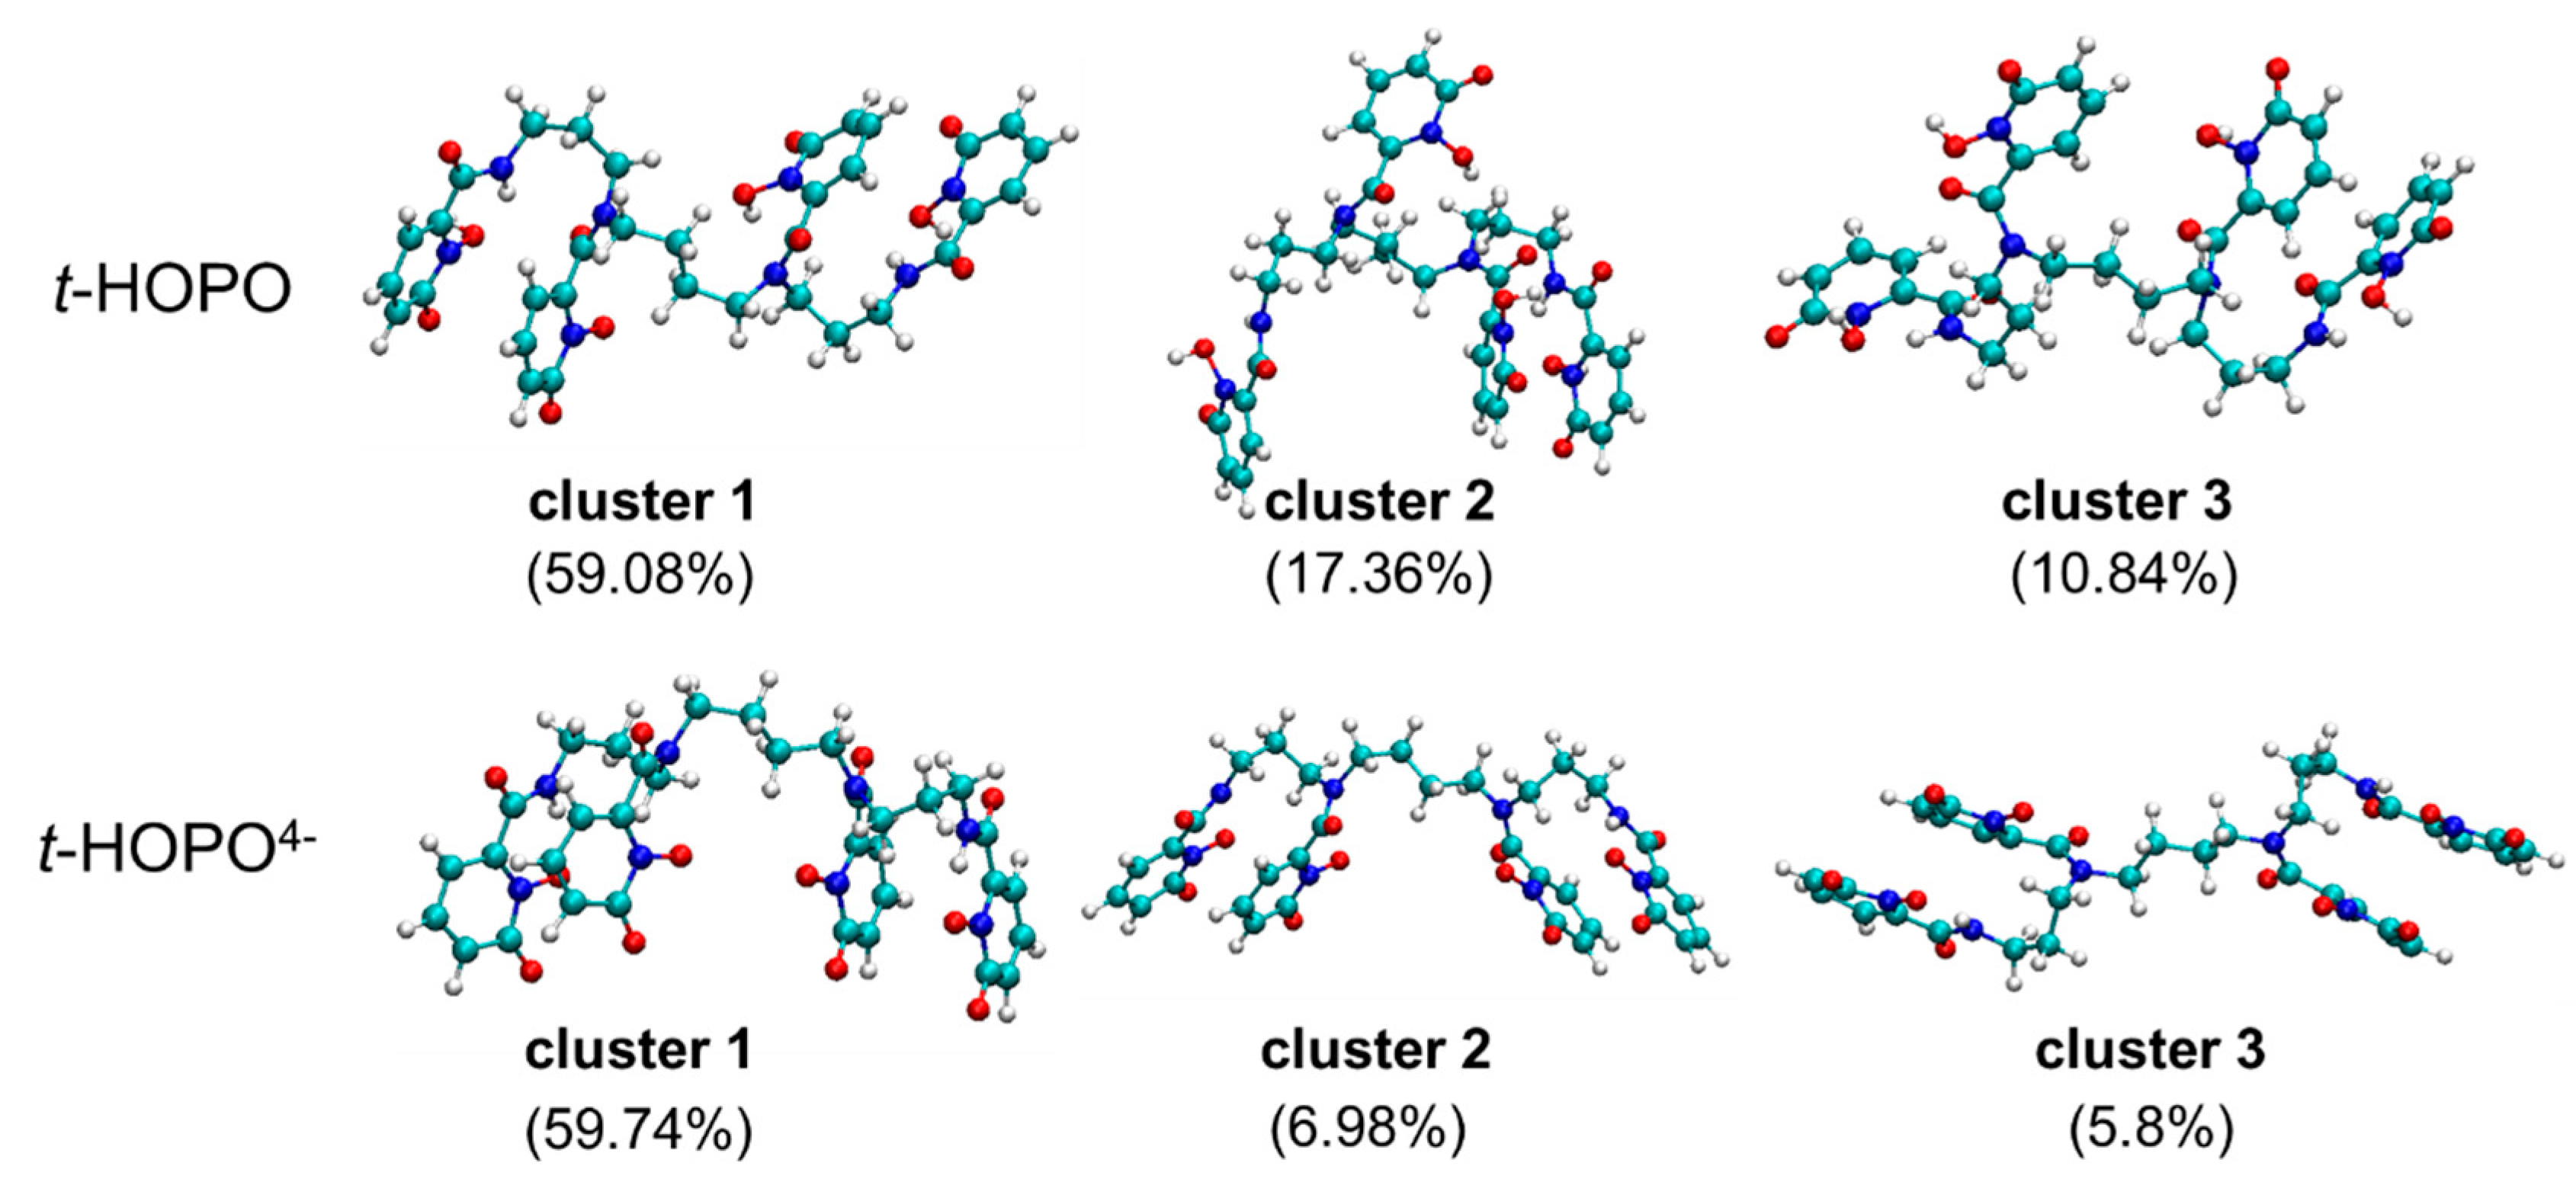
Neutral t-HOPO. Both model systems with t-HOPO in its neutral (t-HOPO0) and deprotonated (t-HOPO4−) states solvated in the aqueous phase (compositions and system sizes are shown in Table S2) were sampled for 100 ns. During the whole plain MD simulation, the conformation of the neutral t-HOPO molecule kept fluctuating, showing that under the simulation conditions, the uncharged t-HOPO could facilely visit broader conformational space owing to the competition between the intramolecular interaction and the interaction between t-HOPO and solvent. In view of the atomic positional RMSD, as shown in Figure 1a, t-HOPO displayed its flexibility with the RMSD in the range of 0.3–0.6 nm. The central structures of the top three clusters obtained from the clustering analysis of simulation trajectories are collected in Figure 2. These clusters covered more than 87% of the trajectories, and they differed from each other in the relative positions of the four m-HOPO rings. According to clustering analysis (cutoff = 0.35 nm), the major cluster (cluster 1 in Figure 2) had a population percentage of 59%.
In the neutral state of t-HOPO, the most populated cluster (cluster 1, Figure 2) is featured by the mutually paralleled Plane1 with Plane2, and Plane3 with Plane4. In the second and third most populated clusters (clusters 2 and 3, Figure 2) of neutral t-HOPO, such a parallel relationship was lost.
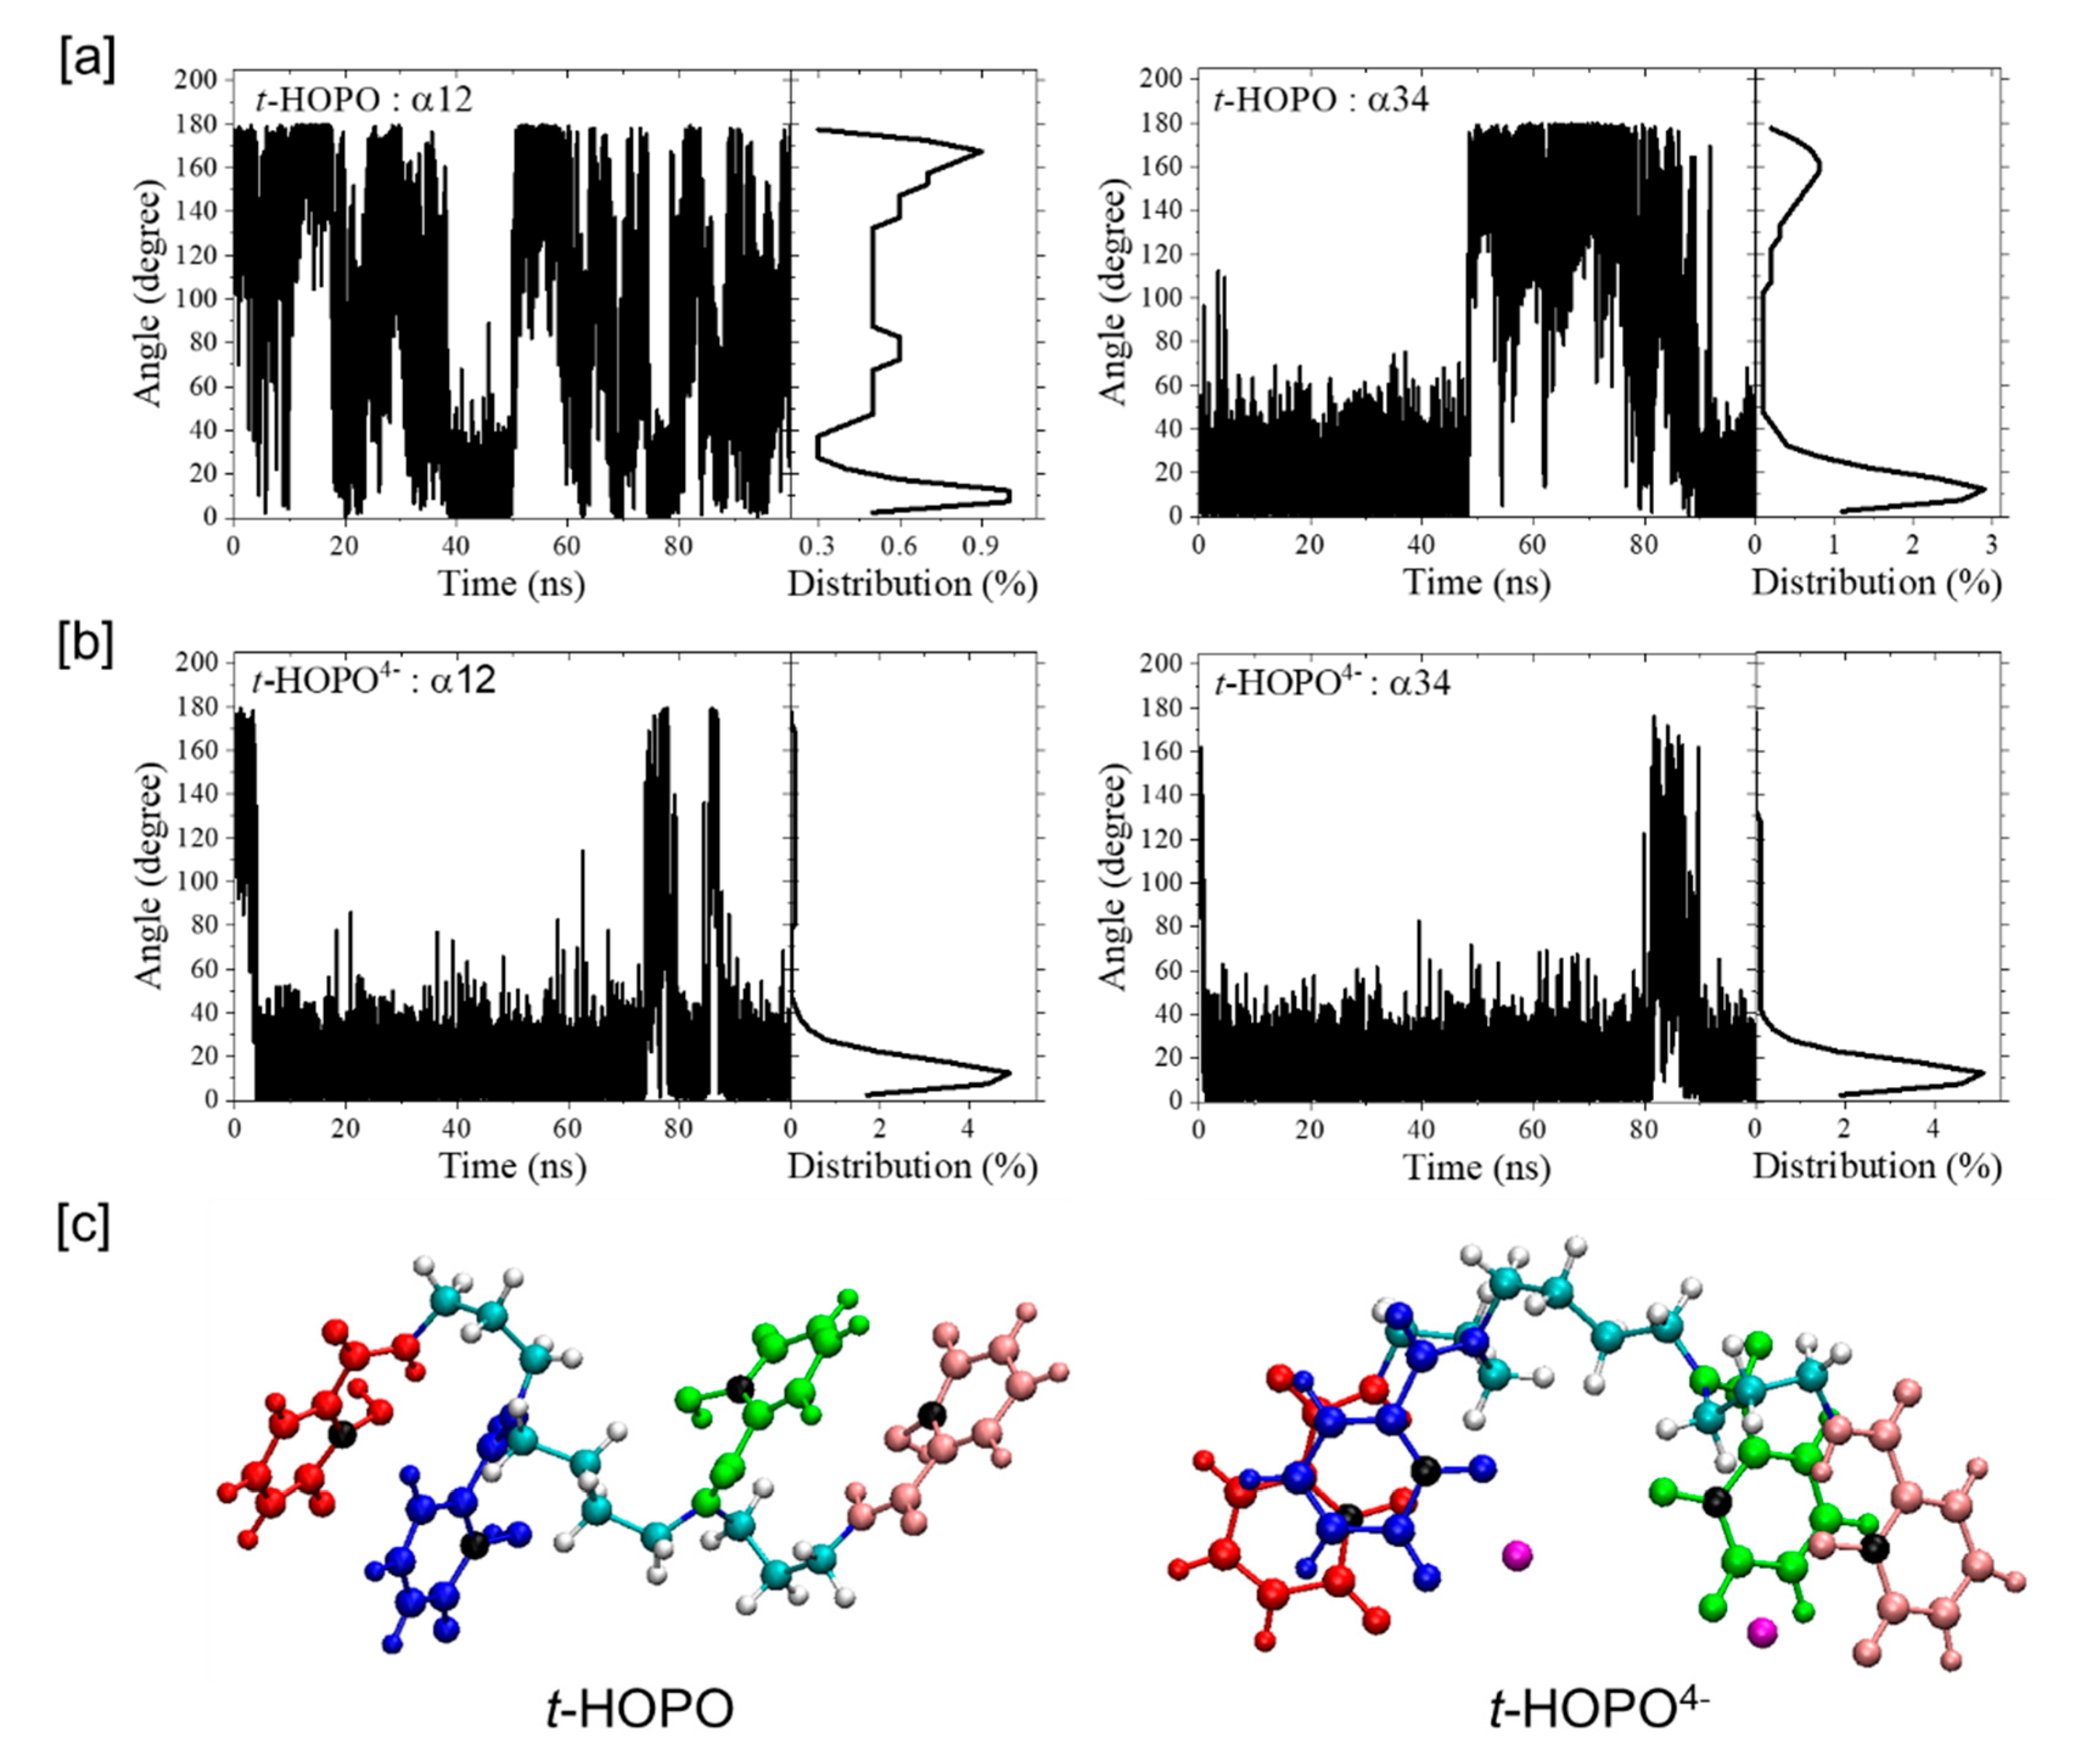
The time evolution of the angles between Plane1 and Plane2 (α12, see Scheme 1 for definitions of the four planes), between Plane3 and Plane4 (α34) and between Plane2 and Plane3 (α23) were analyzed and are shown in Figure 3a and Figure S2. The α12 and α34 angles fluctuated from 0° (parallel) to 180° (antiparallel), indicating that the two pairs of planes could adopt both conformations parallel or antiparallel to each other with more preference for their parallel conformation.
Deprotonated t-HOPO4−. In the deprotonated t-HOPO (denoted as t-HOPO4−), each m-HOPO ring carried −1e charge. These negative charges were neutralized by Na+ counterions in the system. The far fewer fluctuations in the atom positional RMSD (Figure 1b) compared to neutral t-HOPO (Figure 1a) indicated the stronger conformational rigidity of t-HOPO4−. The clustering analysis of t-HOPO4− used a smaller cutoff (0.18 nm) to obtain a similar population of the largest cluster (cluster 1) as its neutral counterpart (Figure 2). In the top three most populated clusters, Plane1 was parallel to Plane2, and Plane3 was parallel to Plane4. Meanwhile, in view of the time evolution of the angles between the four m-HOPO rings in Figure 3b, the four planes showed high propensity to stay parallel in pairs during the simulations. These results indicated that the deprotonated t-HOPO4− displayed lower flexibility than the neutral t-HOPO during the 100 ns simulations.
IGM analysis. To understand the intramolecular non-covalent interactions in neutral t-HOPO and deprotonated t-HOPO4−, independent gradient model (IGM) analysis was carried out for the major cluster (Cluster 1). As shown in Figure 4, there was an interaction region between Plane1 and Plane2 and between Plane3 and Plane4 in both neutral t-HOPO and deprotonated t-HOPO4−, which was characterized as π-π parallel-displaced stacking interactions according to the IGM analysis. Such π-π parallel-displaced stacking interactions were not identified in the other clusters owing to the longer distances between the planes.
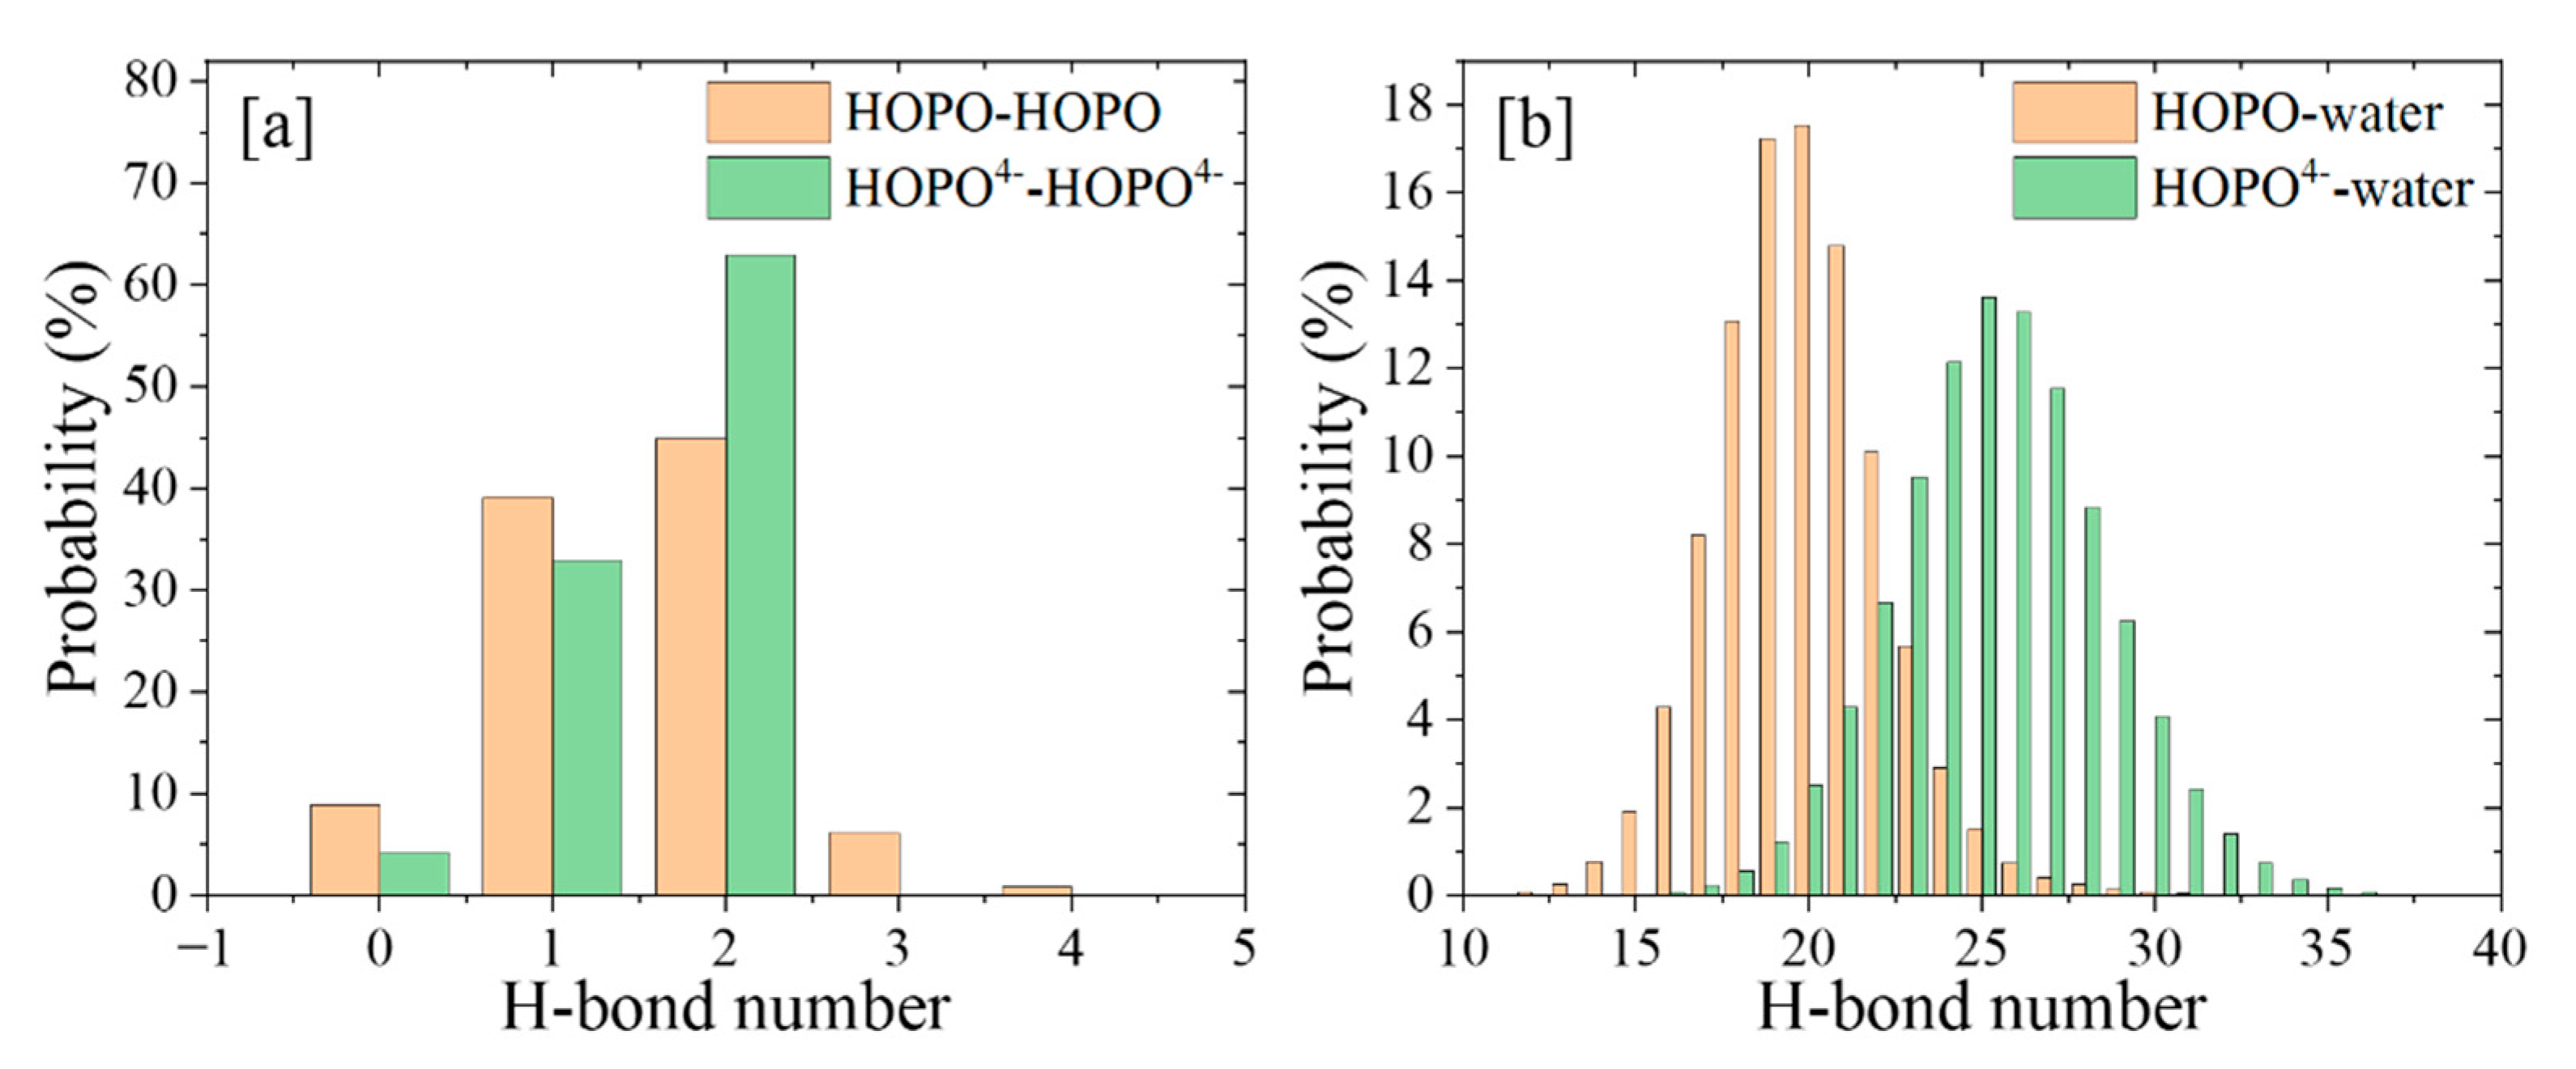
The analysis of hydrogen bonds (H-bonds, Figure 5) showed that there were fewer H-bonds between the four m-HOPO rings of t-HOPO than those of t-HOPO4−, and there were fewer H-bonds between t-HOPO0 and the water solvent than those between t-HOPO4− and the solvent. This is consistent with the fewer fluctuations in the RMSD of the latter than the former, indicating that t-HOPO4− benefited more from the intra- and inter- H-bonds than t-HOPO0 in maintaining their favorable conformations during the simulations (Figure 2).
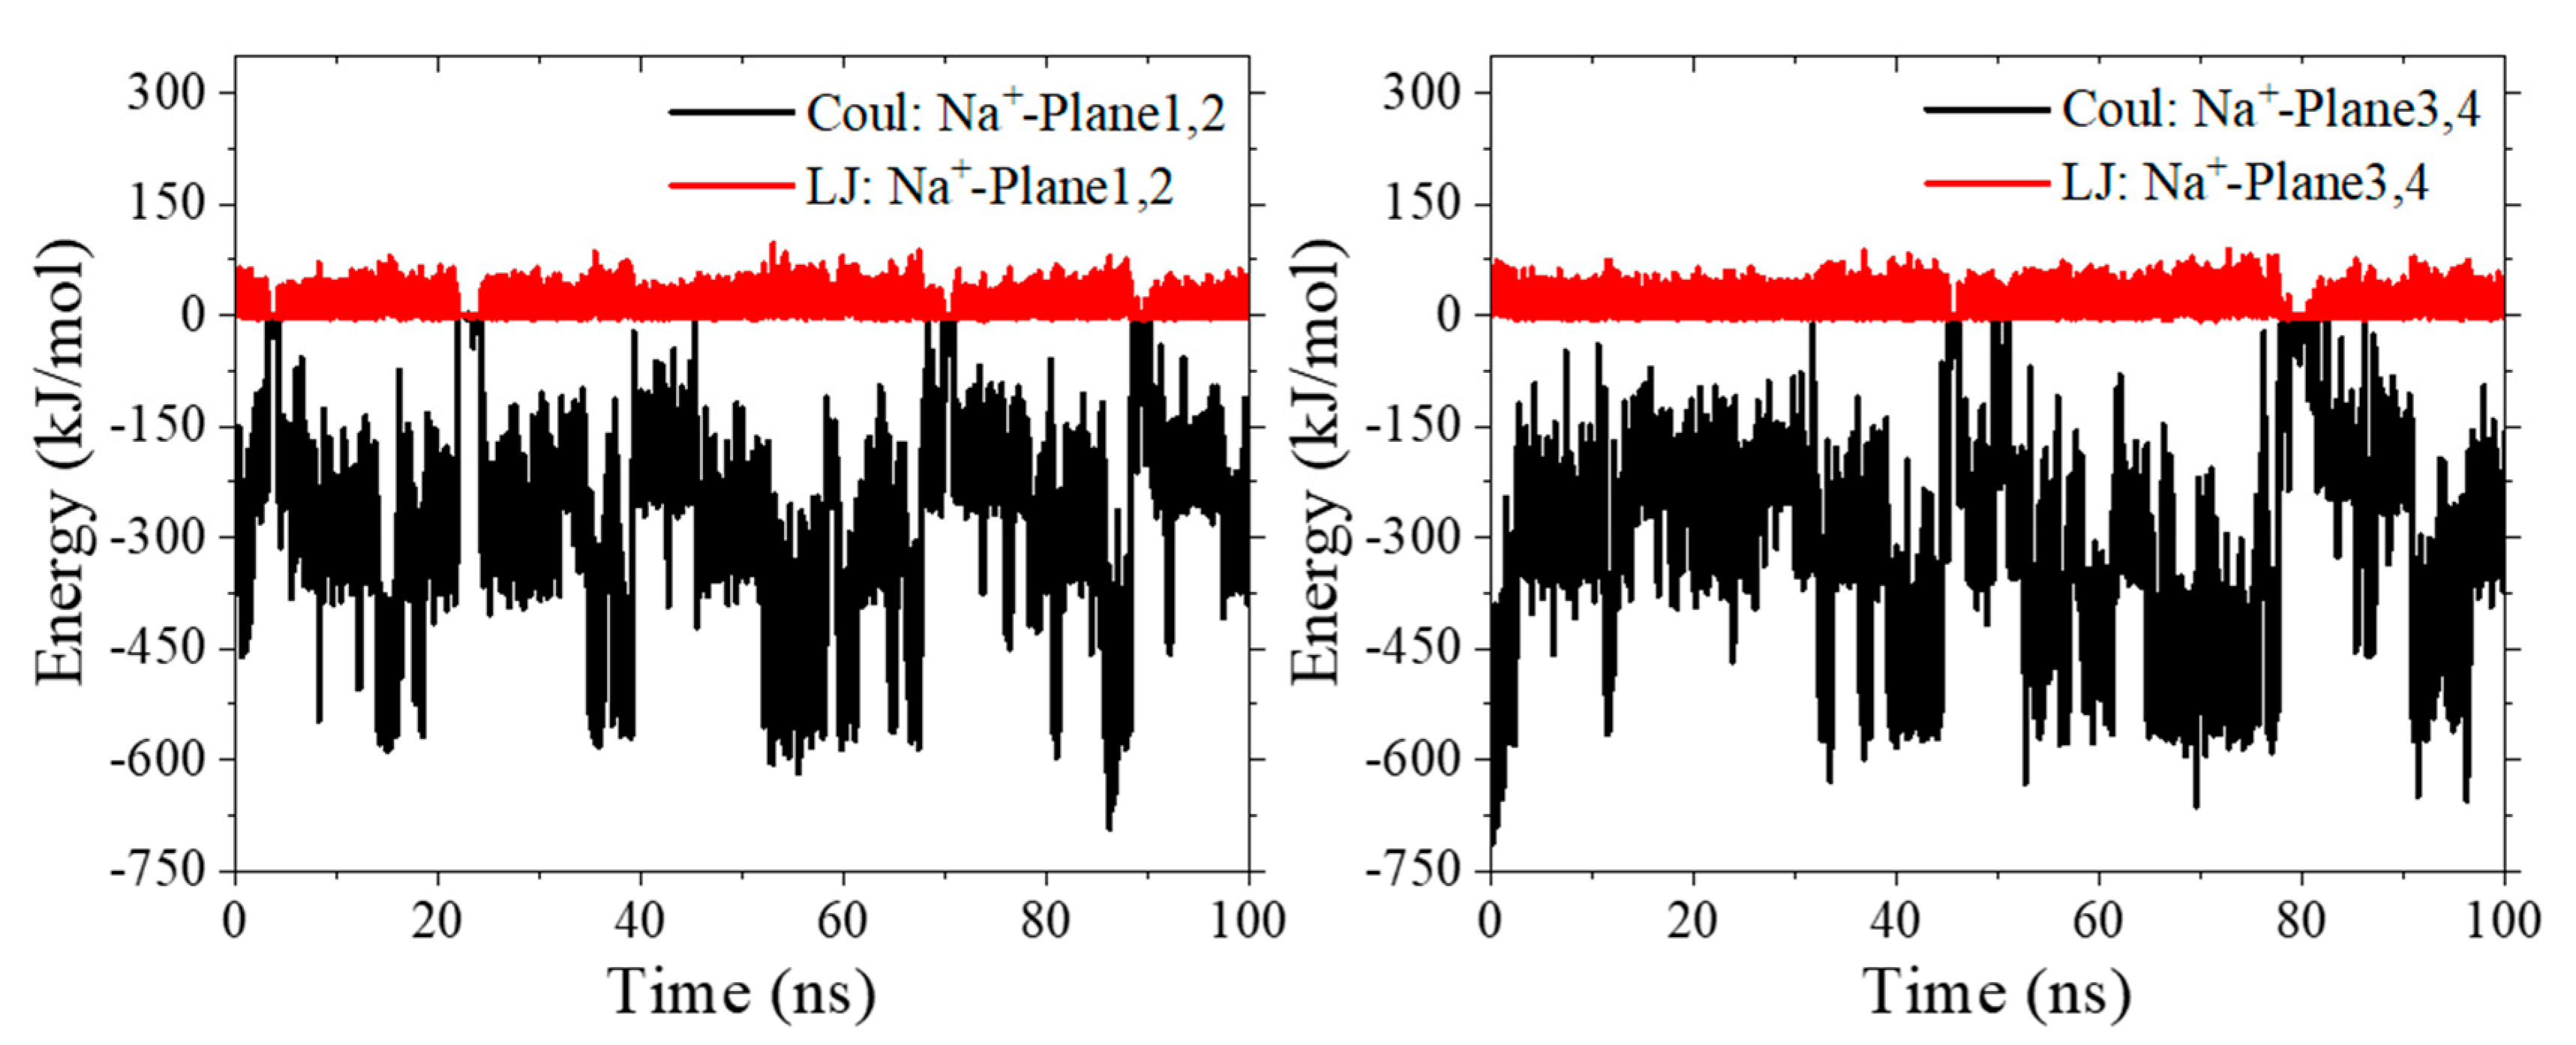
Another beneficial factor for t-HOPO4− to maintain its favorable conformation was contributed by the Na+ counterion, which was not present in the simulations of t-HOPO0. During the 100 ns simulation, there was always one Na+ ion in the vicinity of each pair of mutually paralleled m-HOPO rings of t-HOPO4− (Figure 3c). These Na+ ions locked the two m-HOPO rings via strong electrostatic attractive interactions to maintain the parallel conformation of t-HOPO4− (Figure 6 and Figure S3). The analysis of the trajectory indicated that the Na+ ions may have occasionally moved away from the m-HOPO units, which was accompanied by the disruption of the parallel relationship of the two m-HOPO they locked. These wandering Na+ ions did not move far away, but migrated back quickly (Figure 7), driven by the electrostatic attraction between them and the m-HOPO rings, to recover the parallel relationship between the pair of m-HOPO rings.

2.2. U-t-HOPO Complexes

The t-HOPO was reported with high affinity for tetravalent uranium. Here, the binding of HOPO with U4+ was investigated to analyze the solution behavior of the complex.
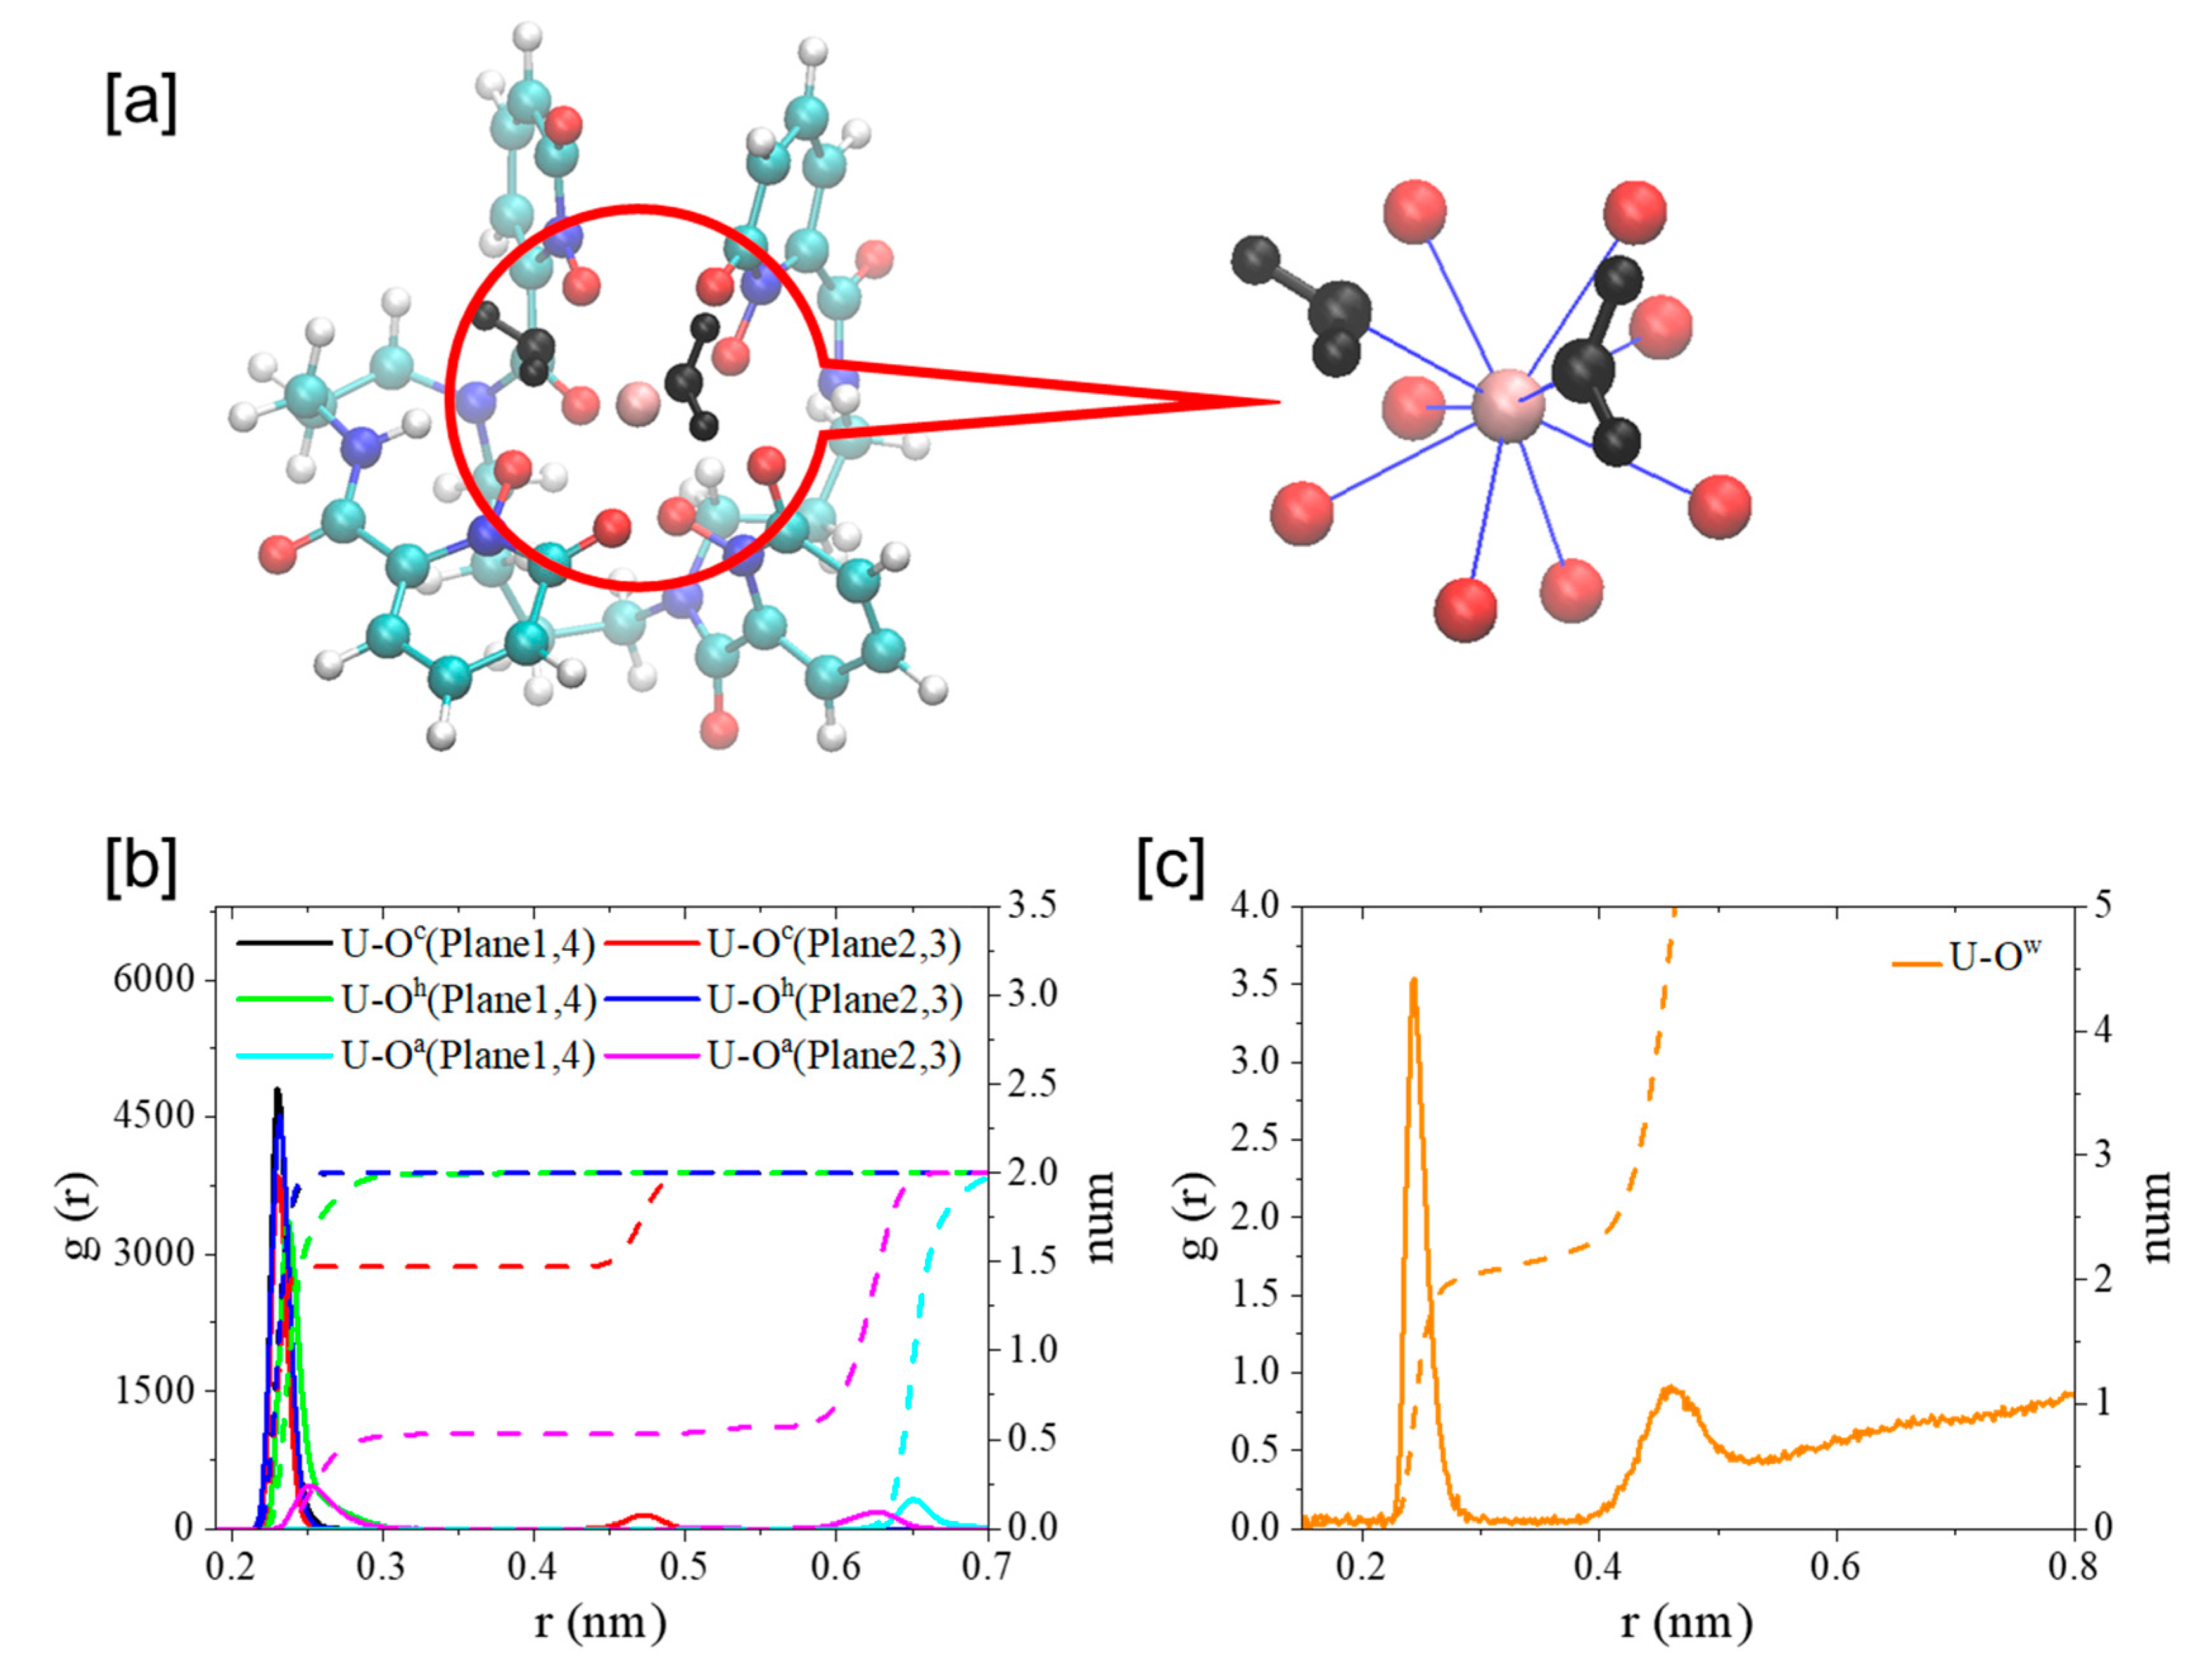
As shown in Figure 8, U4+ coordinated with eight oxygen atoms from the four m-HOPO units of t-HOPO4−, with each m-HOPO unit offering one hydroxyl oxygen (Oh) and one carbonyl oxygen (Oc) on the m-HOPO ring (Scheme 1), which agreed well with previous studies [27]. During simulations, an exchange of the ligating Oc atom on the second m-HOPO ring by the carbonyl O of the amide linker (Oa) was observed (Figure S4). It could be also noticed that there were two water molecules in the first coordination shell of U4+ during the simulation. This complemented the very limited number of previous studies in which this was ambiguous in the presence of water ligands in the first coordination shell of actinides when coordinating with t-HOPO4− ligand. In an earlier study by Abergel and coworkers [24], the measurement of the luminescence lifetime of the Cm3+-t-HOPO complex indicated the possible presence of inner-sphere water. In a later computational study, Yang and coworkers [27] reported that the coordination of inner-sphere water to Am(III) in an [Am(t-HOPO)]- complex could not survive geometric optimization unless a distance restraint was imposed.
The elusive coordination interaction between actinide ion and ligating water molecules in the [U(t-HOPO)]0 complexes reported in previous experimental and computational studies [24,27] could be due to the labile nature of the aqua ligands and the underestimation of the solvent effect when handled by the implicit continuum model. This was demonstrated in the present study in which we observed the exchange of the two water molecules in the first shell of U4+ with the bulk, showing that the inner-sphere water molecules were in a dynamic equilibrium (Figure 9). We note that in an earlier study of the complexation of uranyl with t-HOPO4−, Den Auwer and Vidaud and coworkers [29] reported an energy difference of 0.32 eV between the two coordination patterns [UO28-t-HOPO)]2−∙(H2O)2 and [UO26-t-HOPO)(H2O)2]2−, which showed the competing coordination of t-HOPO and aqua ligands with actinides.
In the [UIV-t-HOPO]0 complex, each [m-HOPO]- unit offered its two oxygen atoms (Oh and Oc in Scheme 1) on the ring to coordinate with U4+. The coordination mode and key bond distances are shown in Table 1 and Figure 8. The carbonyl oxygen (Oc), which benefited from its more negative atomic charge than the deprotonated Oh site, built stronger interaction with U, as seen in the shorter UIV-Oc distance than that of UIV-Oh.
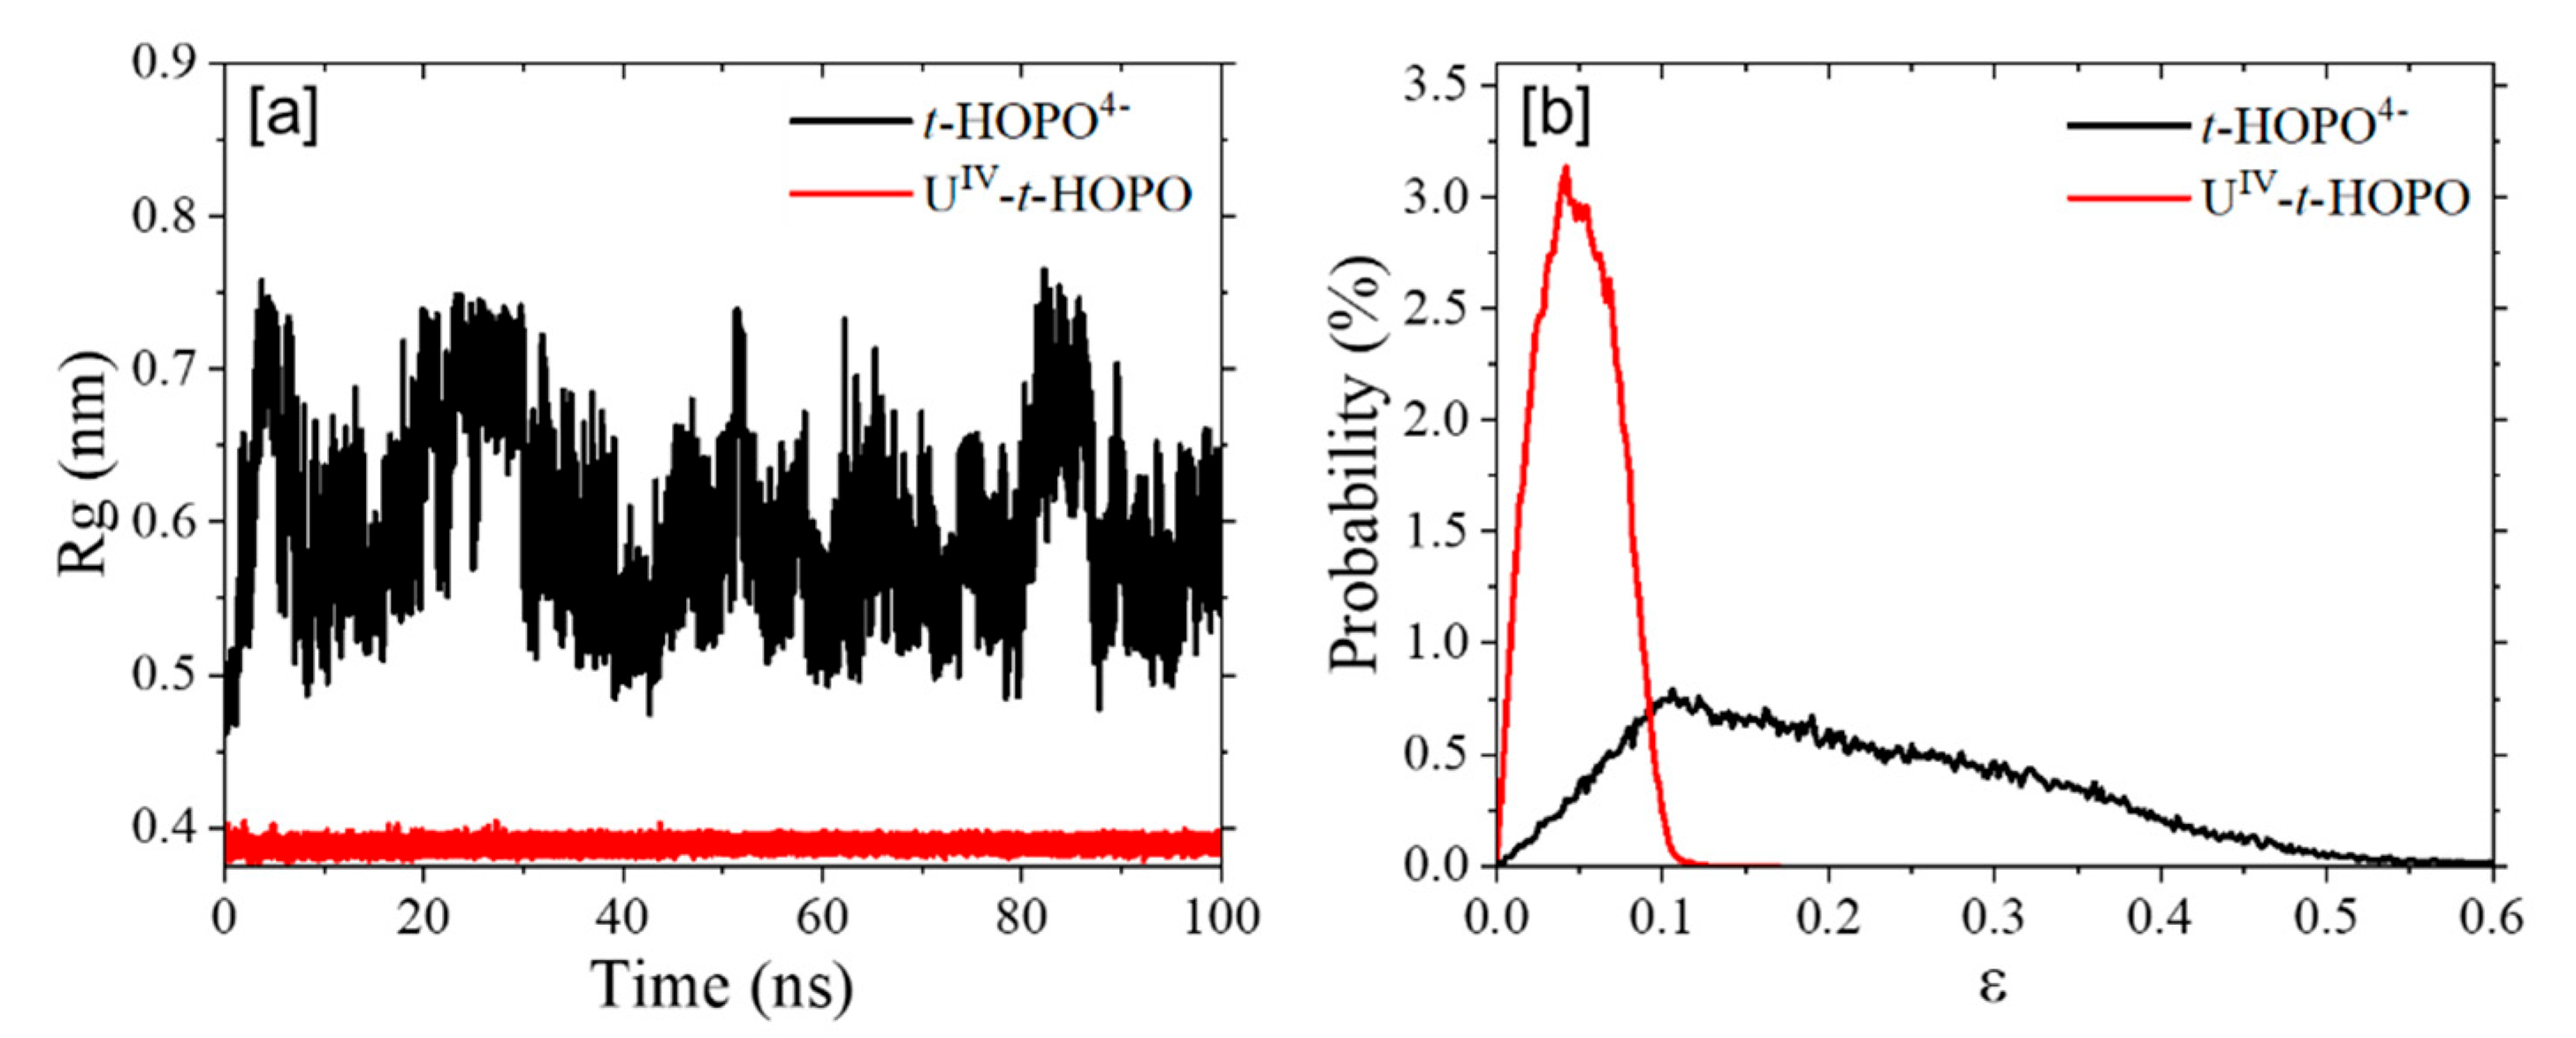
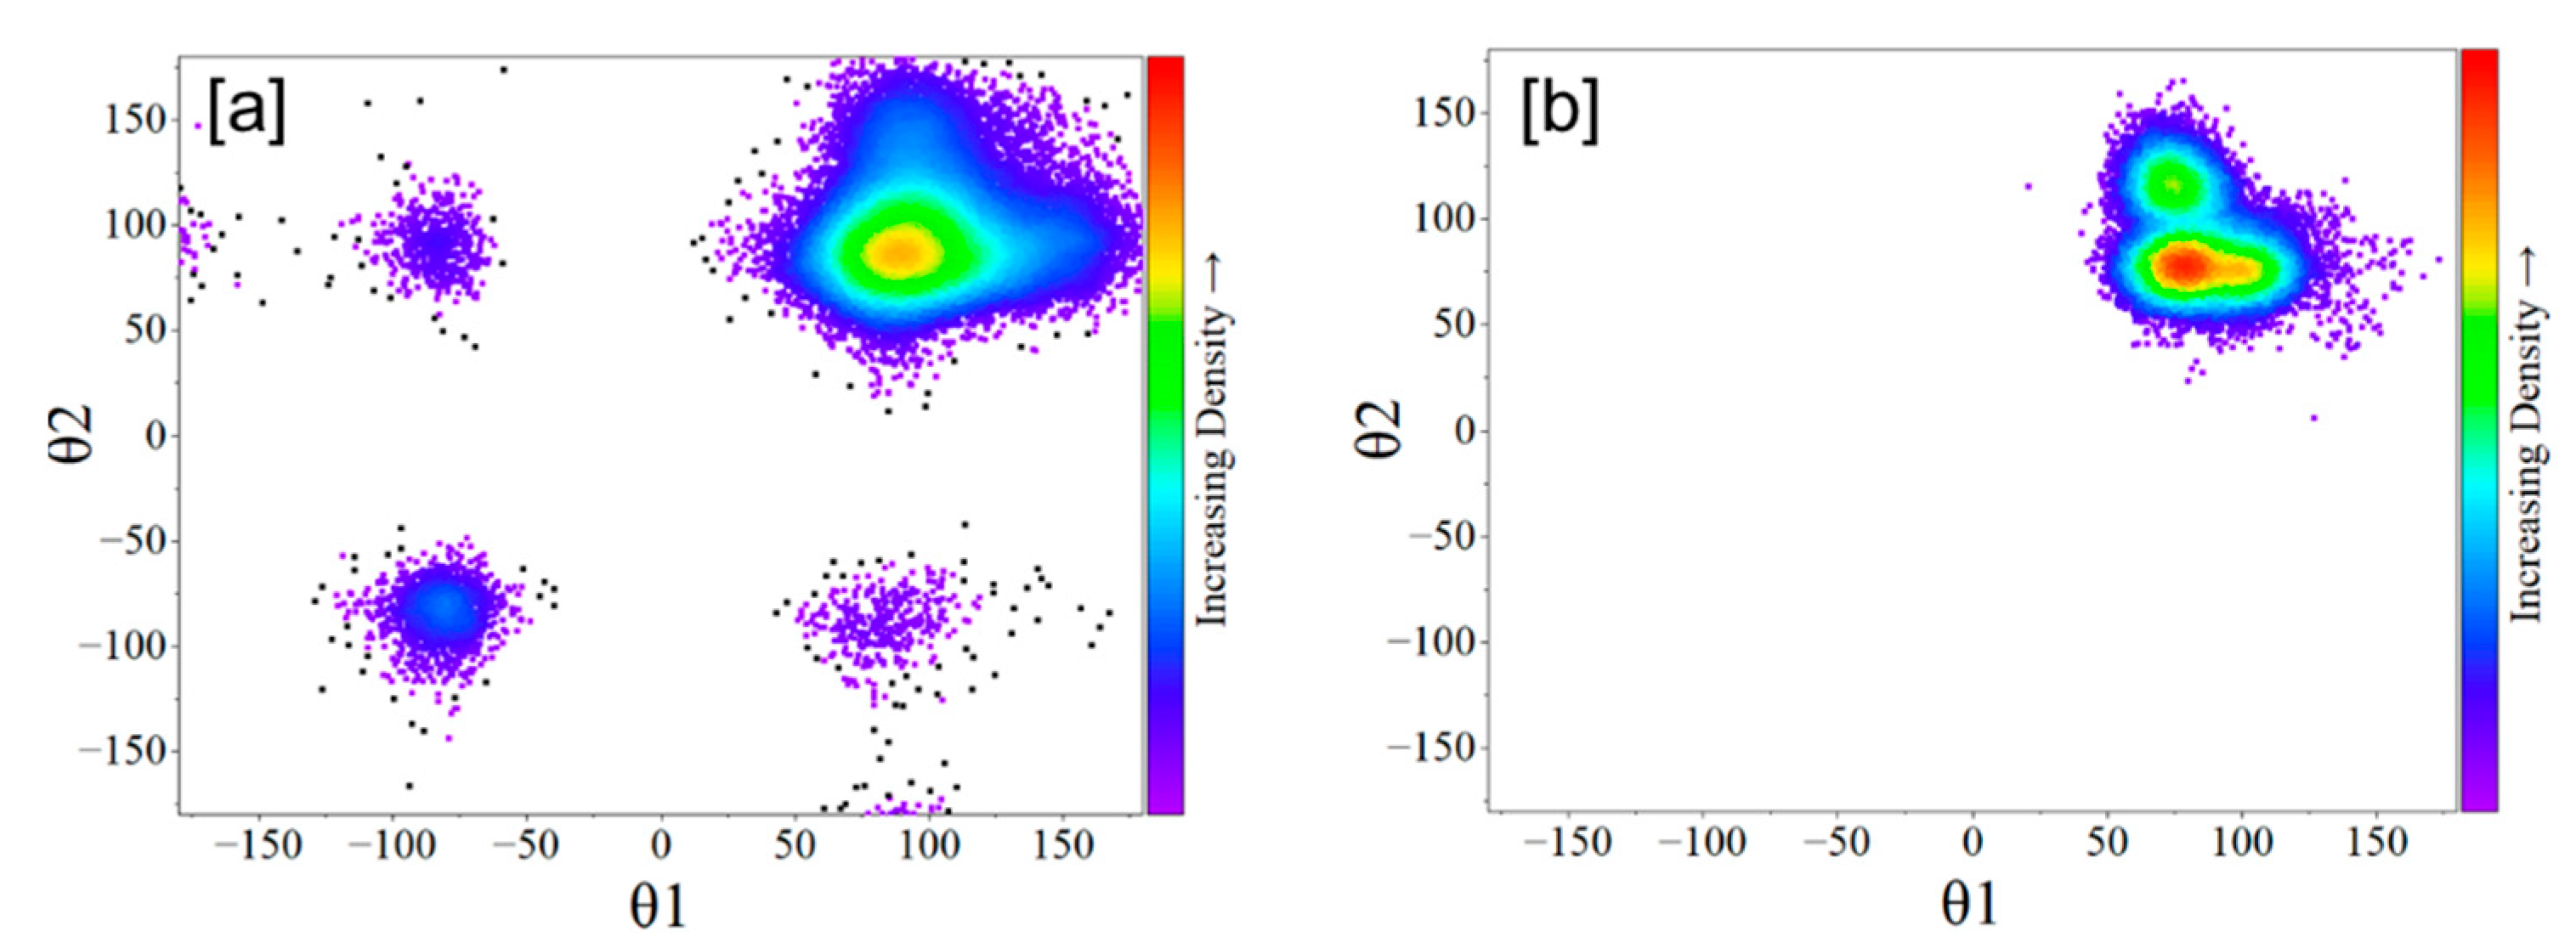
Upon binding with U4+, the t-HOPO4− became more compact in view of its smaller radius of gyration (Rg) (Figure 10a) and its smaller eccentricity (Figure 10b). This agrees with a much more limited conformational space in the θ1-θ2 map of the UIV-t-HOPO complex than that of t-HOPO4− (Figure 11). In t-HOPO4−, θ1 and θ2 visited broader space than that of the UIV-t-HOPO complex in which the population of two angles was confined in the region of around (100°,100°). The fluctuations of θ1 and θ2 were directly relevant to the conformational stability of the t-HOPO4− ligand; thus, the smaller fluctuations of θ1 and θ2 in the UIV-t-HOPO than those in the free t-HOPO4− indicated the significantly narrowed conformational space of the ligand upon its coordination with U4+.
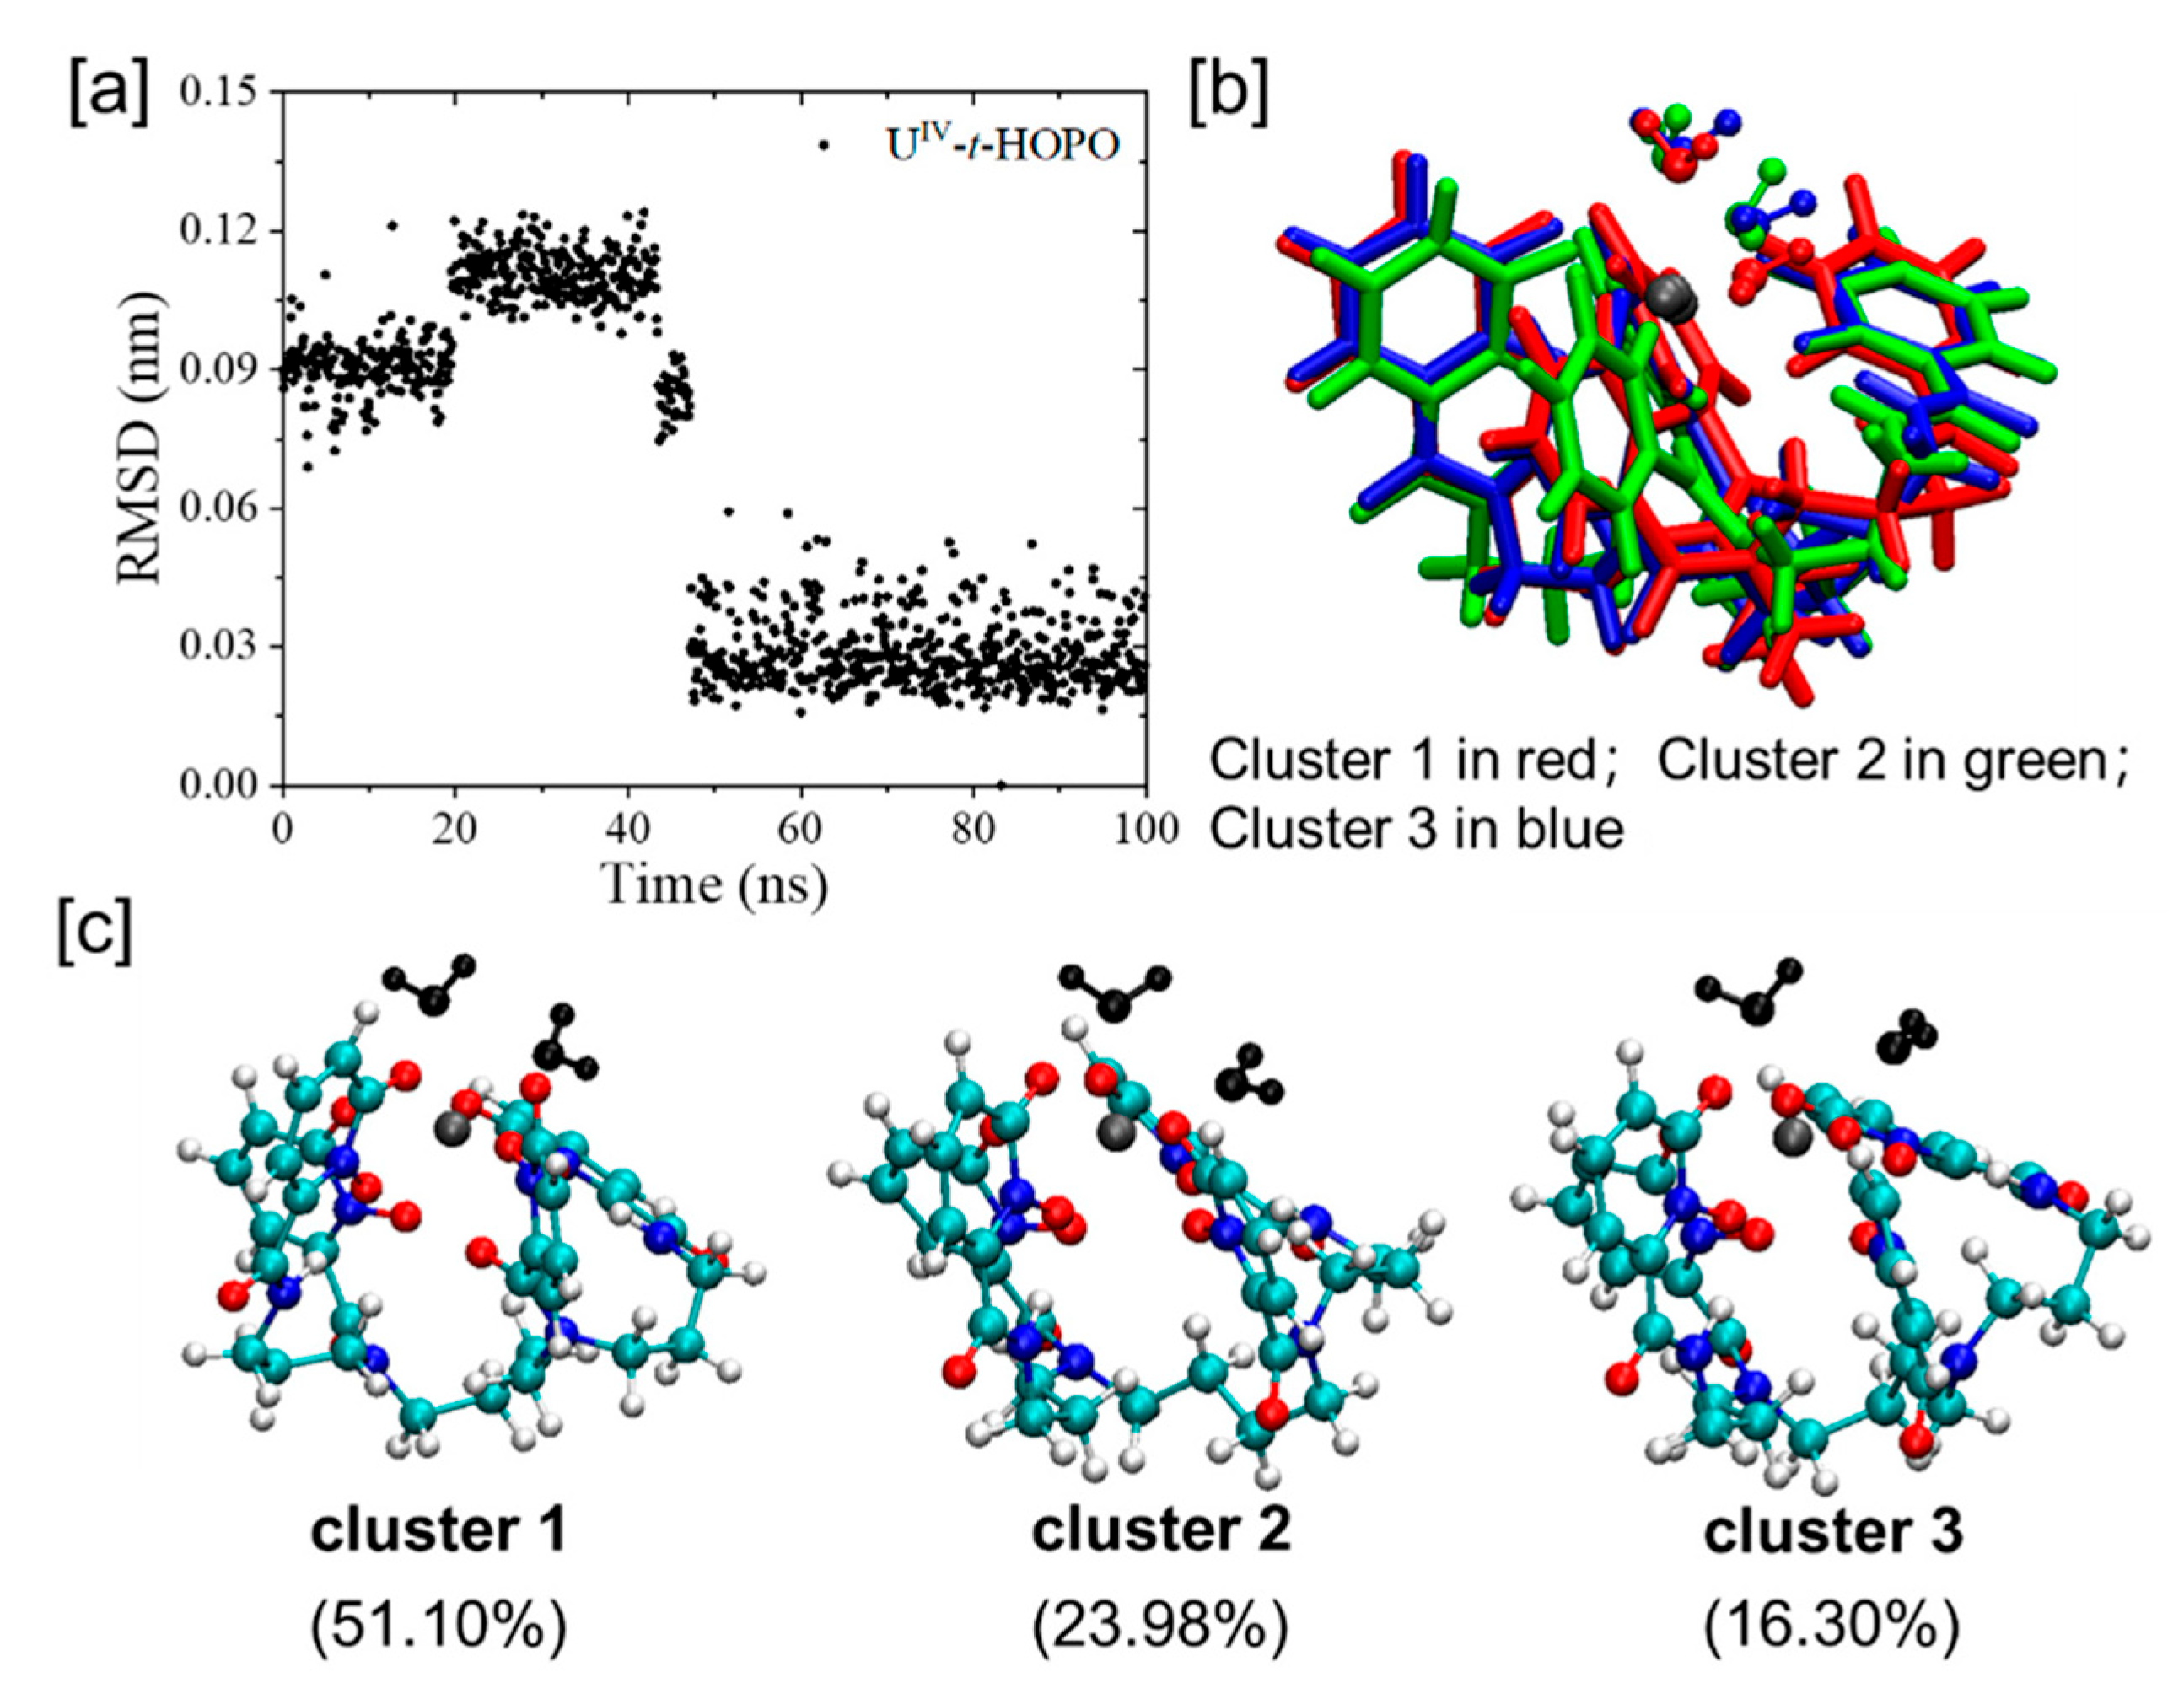
Clustering analysis. With the same cutoff value, the conformational clustering analysis gave a significantly smaller number of clusters for the UIV-t-HOPO complex than that for t-HOPO4−, indicating that t-HOPO4− was confined in a limited conformational space upon binding with U4+. To analyze the details in the conformational changes in the UIV-t-HOPO complex, a smaller cutoff value of 0.05 nm was used in the analysis of the UIV-t-HOPO complex to obtain a distribution of the clusters with the population of the cluster 1 (51%, Figure 12c) comparable with that of unbound t-HOPO4− ligand. Consistently, the atomic positional RMSD of the UIV-t-HOPO complex (Figure 12), which fluctuated in the range of 0.02–0.12 nm, was much less than that of t-HOPO4− (from 0.1 nm to 0.4 nm).
In addition, as seen from the time evolution of RMSD (Figure 12a), there was a conformational transition of the UIV-t-HOPO complex at about 50 ns, as seen from the sharp change in RMSD (Figure 12a), and during the last 50 ns, the simulation sampled the most populated cluster (cluster 1 with a population of 51.1%, Figure 12c and Figure S5). The superposition of the top three clusters (Figure 12b) showed noticeable changes in the positions of ligating water molecules and the m-HOPO rings neighboring to the water ligands, implicating their mutual influence.
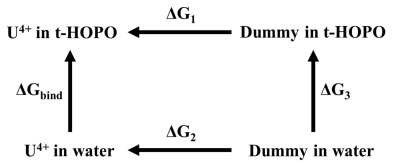
Binding free energy. The binding free energy of UIV8-t-HOPO) was calculated according to the following thermodynamic cycle:
Molecules 27 08151 i001
where ΔG3 represents the energy cost to transfer a dummy atom from water to HOPO and is equal to zero. Following the thermodynamic cycle, the binding free energy may be calculated as
ΔGbind = ΔG1 − ΔG2
where ΔG1 and ΔG2 were calculated by using the free energy perturbation (FEP) method.
As seen in Table 2, t-HOPO4− showed strong affinity for U4+, which was calculated to be up to −81.3 kcal/mol. The strong interaction between t-HOPO4− and U4+ benefitted from the strong electrostatic interaction between them. In addition, as discussed above, the t-HOPO4− showed much lower conformational flexibility than its neutral counterpart t-HOPO0 as a consequence of the balance between the hydrophilic and hydrophobic interactions. The negatively charged t-HOPO4− adapted better in the aqueous phase than t-HOPO0 and could be populated mainly with its dominant conformation (cluster 1, Figure 2 bottom). The Na+ in the vicinity of its m-HOPO rings helped to lock them in a conformation parallel to each other. It is interesting to note that in the dominant conformation of t-HOPO4−, the spermine backbone folded, and the four m-HOPO rings were on the same side (Figure 2), which was a conformation prepared to clamp a cation together. This was different from the main conformation of t-HOPO0, in which the two pairs of m-HOPO rings were on the opposite sides of the spermine backbone. The well-prepared conformation of t-HOPO4− saved energy when clamping U4+ and could easily rearrange itself to adopt a conformation fitting with the U4+ ion.
The decomposition of the interactions between UIV and t-HOPO4− and between UIV and water ligands (Table 2) showed much stronger electrostatic interactions between U4+ and t-HOPO, which was more than five times stronger than that between U4+ and water ligands. This stabilized the compact structure of the UIV8-t-HOPO) complex.

3. Computational Detail Methodology

All molecular dynamics simulations were conducted by employing the Gromacs 5.1.4 package [30]. The bonded and non-bonded parameters of neutral and deprotonated HOPO were generated by the Antechamber module [31] in the Amber16 package [32] using the GAFF force field [33]. RESP charge was employed to describe the coulombic interaction and calculated by the semi-empirical quantum chemistry (sqm) tool in the Antechamber module. Water molecules were treated using the SPC/E water model [34]. The 12-6 Lennard-Jones (LJ) parameters of U4+ were taken from Merz et al. [35]. Long-range electrostatic interactions were calculated by the smooth particle-mesh-Ewald method [36]. The cut-off of the electrostatics and LJ potential were set to 1.0 nm. All hydrogen bonds were constrained by the LINCS algorithm [37] to allow a time step of 1 fs during the simulations. Periodic boundary conditions were imposed to all three dimensions.
All simulation systems were first relaxed by 1000 steps of energy minimization (the steepest descent), equilibrated 300 ps for NVT and then for 500 ps at a constant pressure of 1 atm and temperature of 310 K (isothermal–isobaric conditions, NPT). The equilibrated model systems were then sampled at 310 K and 1 atm with the NPT ensemble for 100 ns for analysis. During the simulations, the temperature was kept constant using the v-rescale weak coupling scheme with τT = 2.0 ps [38] and the pressure using the Berendsen barostat with τP = 1.0 ps [39].
Atomic positional root-mean-square deviation (RMSD) analysis was performed with all atoms in t-HOPO, t-HOPO4− and UIV-t-HOPO complex taken into account, and the central structures of the most populated clusters in the simulations were used as the reference to distinguish the transition between the most populated cluster and other clusters in each simulation. The time evolution of RMSD with the starting structure as the reference was also calculated and is provided in the Supporting Information (Figure S1).
In the clustering analysis, the algorithm of Daura et al. was used [40]. Owing to the different flexibilities of the t-HOPO, t-HOPO4− and UIV-t-HOPO complexes, using the same cutoff value in the analysis of the three model systems would result in the too-sparse distribution of conformations of t-HOPO (smaller cutoff) or too few clusters of UIV-t-HOPO (bigger cutoff), as shown in Table S1. Therefore, to obtain the proper distribution of the conformations to assist our understanding of the sampled conformational space and the flexibility of three model systems, the cutoff was set to 0.35 nm for the t-HOPO, 0.18 nm for the t-HOPO4− and 0.05 nm for the UIV-t-HOPO complex, respectively. The intra-molecular weak interaction analysis of t-HOPO and t-HOPO4− was carried out by using the independent gradient model (IGM) [41] implemented in the Multiwfn 3.5 program [42].
The compactness of the complex was estimated by calculating its radius of gyration (Rg)
Rg   = i m i r i 2 i m i
where mi is the mass of atom i located at distance ri from the center of mass of the complex. The calculation included U4+ and t-HOPO4− in the complex.
When calculating the angles between each pair of the four hydroxypyridinone rings (Planes 1, 2, 3 and 4, Scheme 1) of t-HOPO in its neutral and deprotonated states, the two C atoms and one N atom on each hydroxypyridinone ring (denoted as m-HOPO, see Scheme 1) were selected to define the plane (marked by a Δ sign in Scheme 1).
The binding free energy of t-HOPO with U4+ was calculated by using the free energy perturbation (FEP) method [43]. U4+ was perturbed from the gas phase to the aqueous phase, and each perturbed state was controlled by two variables λvdW and λcoul for the perturbation of van der Waals and Coulomb interactions between U4+ and the solvent/ligand, respectively. The increment in each perturbation factor was 0.05, and in total, there were 41 windows. Each window underwent an equilibration phase composed of two sequential 1 ns simulations under NVT and NPT ensembles, respectively, which was followed by a 100 ns production run for analysis. The Gibbs free energy change in the two states was calculated using the Bennett acceptance ratio method [28] based on the energy difference between these windows.

4. Conclusions

The conformational dynamics of t-HOPO in its neutral and deprotonated states and the dynamics of UIV-t-HOPO were studied using MD simulations.
In its neutral state, t-HOPO showed high flexibility, and there were frequent transition events among the conformational spaces accessible under simulation conditions. The four hydroxypyridinone rings of t-HOPO exhibited propensity to be parallel in pairs and benefitted from the weak π-π stacking and H-bond interactions between hydroxypyridinone rings, which were not sufficient to resist the perturbation from the solvent, resulting in frequent exchange between their parallel and anti-parallel conformations.
In contrast, in its deprotonated state (t-HOPO4−), its accessible conformational space was significantly smaller, and the propensity of the four hydroxypyridinone rings to stay in paralleled states in pairs was enhanced. The analysis of the trajectories indicated that, besides the π-π stacking and H-bond interactions between hydroxypyridinone rings, there were also Na+ ions to lock the pairs of hydroxypyridinone rings via electrostatic attractions between the Na+ and t-HOPO4− ligand, which could resist the disturbance of the water solvent.
Upon binding with U4+, t-HOPO could immobilize the cation by its eight oxygen atoms coordinating with the cation. Meanwhile, there were two water molecules in the first shell of U4+, resulting in the U4+ ion being deca-coordinated. Conformational analysis showed that the whole complex displayed less flexibility than t-HOPO in its neutral and deprotonated states owing to the strong electrostatic attraction between U4+ and t-HOPO4−.

Supplementary Materials

The following supporting information can be downloaded at: https://www.mdpi.com/article/10.3390/molecules27238151/s1. Table S1: The number of clusters sampled in the simulations of t-HOPO, t-HOPO4− and U-t-HOPO complex systems, respectively, using three cutoff values. The proportions of main clusters in each system are also shown; Table S2: The compositions of the systems to simulate t-HOPO, t-HOPO4− and UIV-t-HOPO in aqueous phase; Figure S1: Atomic positional RMSD of all atoms of t-HOPO (a) and t-HOPO4− (b). The structure of the first frame in each simulation was used as the reference.; Figure S2: The time evolution of the angle between Plane2 and Plane3 (α23) and their populations in the simulations of t-HOPO in its neutral (left) and deprotonated (right) states; Figure S3: The time evolution of the interaction between Na+ counterion and the m-HOPO units in the simulations of t-HOPO4− and the typical conformations in the simulation. Color scheme: Plane1 and Na1 in red, Plane2 and Na2 in blue, Plane3 and Na3 in green, Plane4 and Na4 in pink; Figure S4: The time evolution of distances between U4+ and Oc, U4+ and Oa; Figure S5: The central structures of the top three clusters in the simulations of UIV-t-HOPO complex with side view (top) and top view (below). Color scheme: N atoms in blue, O atoms in red, water molecules in black, C atoms in cyan, H atoms in white, and U atom in brown; Figure S6: (a) Atomic positional RMSD of all atoms of UIV-t-HOPO complex with the structure of first frame in the simulation used as the reference. (b) The structure of first frame in the simulation.

Author Contributions

Conceptualization, Z.L., Y.-F.S. and D.W.; formal analysis, Z.L. and Q.W.; investigation, Z.L. and Q.W.; writing draft, Z.L. and Q.W.; writing-review and editing, Y.-F.S. and D.W.; All authors have read and agreed to the published version of the manuscript.

Funding

This research was funded by the National Natural Science Foundation of China to Y. F. Song (22178019, U1707603), Z. Liu (22209018) and D. Wang (21473206), the LiaoNing Revitalization Talents Program (XLYC2002015) and the Fundamental Research Funds for the Central Universities, which are gratefully acknowledged.

Institutional Review Board Statement

Not applicable.

Informed Consent Statement

Not applicable.

Data Availability Statement

Not applicable.

Acknowledgments

Calculations were carried out on the computational grids in the National Supercomputing Center in Tianjin (NSCC-TJ).

Conflicts of Interest

The authors declare no conflict of interest.

References

  1. Jee, S.S.W. The Health Effects of Plutonium and Radium: Proceedings of the Symposium, Sun Valley, Idaho, USA, 6–9 October 1975; JW Press: Martin, TN, USA, 1976. [Google Scholar]
  2. Nénot, J.-C.; Stather, J.W. The Toxicity of Plutonium, Americium and Curium: A Report Prepared under Contract for the Commission of the European Communities within Its Research and Development Programme on Plutonium Recycling in Light Water Reactors; Elsevier: Amsterdam, The Netherlands, 2013. [Google Scholar]
  3. Sigel, H. Metal Ions in Biological Systems: Volume 42: Metal Complexes in Tumor Diagnosis and as Anticancer Agents; CRC Press: Boca Raton, FL, USA, 2004. [Google Scholar]
  4. Meunier, B.; Robert, A.; Crisponi, G.; Nurchi, V.; Lachowicz, J.I.; Nairz, M.; Weiss, G.; Pai, A.B.; Ward, R.J.; Crichton, R.R. Essential Metals in Medicine: Therapeutic Use and Toxicity of Metal Ions in the Clinic; Walter de Gruyter GmbH & Co KG: Berlin, Germany, 2019; Volume 19. [Google Scholar]
  5. Barnham, K.J.; Bush, A.I. Biological metals and metal-targeting compounds in major neurodegenerative diseases. Chem. Soc. Rev. 2014, 43, 6727–6749. [Google Scholar] [CrossRef] [PubMed] [Green Version]
  6. Scott, K.G.; Crowley, J.; Foreman, H. Tracer studies: The metabolism of the fission products. In Medical and Health Physics Divisions Quarterly Report; University of California Radiation Laboratory: Berkeley, CA, USA, 1950; pp. 8–22. [Google Scholar]
  7. Hamilton, J.G.; Scott, K.G. Effect of calcium salt of versene upon metabolism of plutonium in the rat. Proc. Soc. Exp. Biol. Med. 1953, 83, 301–305. [Google Scholar] [CrossRef] [PubMed]
  8. SillÉN, L.G.; Martell, A.E. Stability Constants of Metal-Ion Complexes; Chemical Society: New York, NY, USA, 1964. [Google Scholar]
  9. Dagirmanjian, R.; Maynard, E.; Hodge, H. The effects of calcium disodium ethylenediamine tetraacetate on uranium poisoning in rats. J. Pharmacol. Exp. Ther. 1956, 117, 20–28. [Google Scholar] [PubMed]
  10. Smith, V.H. Removal of internally deposited plutonium. Nature 1958, 181, 1792–1793. [Google Scholar] [CrossRef] [PubMed]
  11. Volf, V. Treatment of Incorporated Transuranium Elements; Technical Reports Series, No. 184; IAEA: Vienna, Austria, 1978. [Google Scholar]
  12. Guilmette, R.A.; Lindhorst, P.S.; Hanlon, L.L. Interaction of Pu and Am with bone mineral in vitro. Radiat. Prot. Dosim. 1998, 79, 453–458. [Google Scholar] [CrossRef]
  13. Stradling, G.N. Decorporation of actinides: A review of recent research. J. Alloy. Compd. 1998, 271, 72–77. [Google Scholar] [CrossRef]
  14. Gorden, A.E.V.; Xu, J.; Raymond, K.N.; Durbin, P. Rational design of sequestering agents for plutonium and other actinides. Chem. Rev. 2003, 103, 4207–4282. [Google Scholar] [CrossRef]
  15. Wang, X.; Shi, C.; Guan, J.; Chen, Y.; Xu, Y.; Diwu, J.; Wang, S. The development of molecular and nano actinide decorporation agents. Chinese Chem. Lett. 2022, 33, 3395–3404. [Google Scholar] [CrossRef]
  16. Cilibrizzi, A.; Abbate, V.; Chen, Y.-L.; Ma, Y.; Zhou, T.; Hider, R.C. Hydroxypyridinone Journey into Metal Chelation. Chem. Rev. 2018, 118, 7657–7701. [Google Scholar] [CrossRef]
  17. Choi, T.A.; Furimsky, A.M.; Swezey, R.; Bunin, D.I.; Byrge, P.; Iyer, L.V.; Chang, P.Y.; Abergel, R.J. In Vitro Metabolism and Stability of the Actinide Chelating Agent 3,4,3-LI (1,2-HOPO). J. Pharm. Sci. 2015, 104, 1832–1838. [Google Scholar] [CrossRef]
  18. Sturzbecher-Hoehne, M.; Deblonde, G.J.P.; Abergel, R.J. Solution thermodynamic evaluation of hydroxypyridinonate chelators 3,4,3-LI(1,2-HOPO) and 5-LIO(Me-3,2-HOPO) for UO2(VI) and Th(IV) decorporation. Radiochim. Acta 2013, 101, 359–366. [Google Scholar] [CrossRef]
  19. Abergel, R.J.; Durbin, P.W.; Kullgren, B.; Ebbe, S.N.; Xu, J.; Chang, P.Y.; Bunin, D.I.; Blakely, E.A.; Bjornstad, K.A.; Rosen, C.J. Biomimetic actinide chelators: An update on the preclinical development of the orally active hydroxypyridonate decorporation agents 3,4,3-LI (1,2-HOPO) and 5-LIO (Me-3,2-HOPO). Health Phys. 2010, 99, 401–407. [Google Scholar] [CrossRef] [Green Version]
  20. Sturzbecher-Hoehne, M.; Choi, T.A.; Abergel, R.J. Hydroxypyridinonate complex stability of group (IV) metals and tetravalent f-block elements: The key to the next generation of chelating agents for radiopharmaceuticals. Inorg. Chem. 2015, 54, 3462–3468. [Google Scholar] [CrossRef] [Green Version]
  21. An, D.D.; Kullgren, B.; Jarvis, E.E.; Abergel, R.J. From early prophylaxis to delayed treatment: Establishing the plutonium decorporation activity window of hydroxypyridinonate chelating agents. Chem. Biol. Interact. 2017, 267, 80–88. [Google Scholar] [CrossRef] [Green Version]
  22. An, D.D.; Villalobos, J.A.; Morales-Rivera, J.A.; Rosen, C.J.; Bjornstad, K.A.; Gauny, S.S.; Choi, T.A.; Sturzbecher-Hoehne, M.; Abergel, R.J. 238Pu elimination profiles after delayed treatment with 3,4,3LI (1,2HOPO) in female and male Swiss-Webster mice. Int. J. Radiat. Biol. 2014, 90, 1055–1061. [Google Scholar] [CrossRef]
  23. Sturzbecher-Hoehne, M.; Kullgren, B.; Jarvis, E.E.; An, D.D.; Abergel, R.J. Highly Luminescent and Stable Hydroxypyridinonate Complexes: A Step Towards New Curium Decontamination Strategies. Chem. Eur. J. 2014, 20, 9962–9968. [Google Scholar] [CrossRef]
  24. Deblonde, G.J.P.; Sturzbecher-Hoehne, M.; Rupert, P.B.; An, D.D.; Illy, M.-C.; Ralston, C.Y.; Brabec, J.; de Jong, W.A.; Strong, R.K.; Abergel, R.J. Chelation and stabilization of berkelium in oxidation state+IV. Nat. Chem. 2017, 9, 843–849. [Google Scholar] [CrossRef] [Green Version]
  25. Sturzbecher-Hoehne, M.; Leung, C.N.P.; D’Aléo, A.; Kullgren, B.; Prigent, A.-L.; Shuh, D.K.; Raymond, K.N.; Abergel, R.J. 3,4,3-LI (1,2-HOPO): In vitro formation of highly stable lanthanide complexes translates into efficacious in vivo europium decorporation. Daltion T. 2011, 40, 8340–8346. [Google Scholar] [CrossRef] [Green Version]
  26. Kelley, M.P.; Deblonde, G.J.P.; Su, J.; Booth, C.H.; Abergel, R.J.; Batista, E.R.; Yang, P. Bond covalency and oxidation state of actinide ions complexed with therapeutic chelating agent 3,4,3-LI (1,2-HOPO). Inorg. Chem. 2018, 57, 5352–5363. [Google Scholar] [CrossRef] [Green Version]
  27. Carter, K.P.; Smith, K.F.; Tratnjek, T.; Deblonde, G.J.P.; Moreau, L.M.; Rees, J.A.; Booth, C.H.; Abergel, R.J. Controlling the Reduction of Chelated Uranyl to Stable Tetravalent Uranium Coordination Complexes in Aqueous Solution. Inorg. Chem. 2021, 60, 973–981. [Google Scholar] [CrossRef]
  28. Younes, A.; Creff, G.; Beccia, M.R.; Moisy, P.; Roques, J.; Aupiais, J.; Hennig, C.; Solari, P.L.; Den Auwer, C.; Vidaud, C. Is hydroxypyridonate 3,4,3-LI(1,2-HOPO) a good competitor of fetuin for uranyl metabolism? Metallomics 2019, 11, 496–507. [Google Scholar] [CrossRef] [PubMed]
  29. Pronk, S.; Páll, S.; Schulz, R.; Larsson, P.; Bjelkmar, P.; Apostolov, R.; Shirts, M.R.; Smith, J.C.; Kasson, P.M.; van der Spoel, D.; et al. GROMACS 4.5: A high-throughput and highly parallel open source molecular simulation toolkit. Bioinformatics 2013, 29, 845–854. [Google Scholar] [CrossRef] [PubMed] [Green Version]
  30. Wang, J.; Wang, W.; Kollman, P.A.; Case, D.A. Automatic atom type and bond type perception in molecular mechanical calculations. J. Mol. Graph. Model. 2006, 25, 247–260. [Google Scholar] [CrossRef] [PubMed]
  31. Pearlman, D.A.; Case, D.A.; Caldwell, J.W.; Ross, W.S.; Cheatham, T.E.; DeBolt, S.; Ferguson, D.; Seibel, G.; Kollman, P. AMBER, a package of computer programs for applying molecular mechanics, normal mode analysis, molecular dynamics and free energy calculations to simulate the structural and energetic properties of molecules. Comput. Phys. Commun. 1995, 91, 1–41. [Google Scholar] [CrossRef]
  32. Wang, J.; Wolf, R.M.; Caldwell, J.W.; Kollman, P.A.; Case, D.A. Development and Testing of a General AMBER Force Field. J. Comput. Chem. 2004, 25, 1157–1174. [Google Scholar] [CrossRef]
  33. Berendsen, H.J.C.; Grigera, J.R.; Straatsma, T.P. The missing term in effective pair potentials. J. Phys. Chem. 1987, 91, 6269–6271. [Google Scholar] [CrossRef]
  34. Li, P.; Song, L.F.; Merz, K.M. Parameterization of Highly Charged Metal Ions Using the 12-6-4 LJ-Type Nonbonded Model in Explicit Water. J. Phys. Chem. B 2015, 119, 883–895. [Google Scholar] [CrossRef] [Green Version]
  35. Essmann, U.; Perera, L.; Berkowitz, M.L.; Darden, T.; Lee, H.; Pedersen, L.G. A smooth particle mesh Ewald method. J. Chem. Phys. 1995, 103, 8577–8593. [Google Scholar] [CrossRef] [Green Version]
  36. Hess, B.; Bekker, H.; Berendsen, H.J.C.; Fraaije, J.G.E.M. LINCS: A linear constraint solver for molecular simulations. J. Comput. Chem. 1997, 18, 1463–1472. [Google Scholar] [CrossRef]
  37. Bussi, G.; Donadio, D.; Parrinello, M. Canonical sampling through velocity rescaling. J. Chem. Phys. 2007, 126, 014101. [Google Scholar] [CrossRef]
  38. Berendsen, H.J.C.; Postma, J.P.M.; van Gunsteren, W.F.; DiNola, A.; Haak, J.R. Molecular dynamics with coupling to an external bath. J. Chem. Phys. 1984, 81, 3684–3690. [Google Scholar] [CrossRef] [Green Version]
  39. Daura, X.; Gademann, K.; Jaun, B.; Seebach, D.; van Gunsteren, W.F.; Mark, A.E. Peptide Folding: When Simulation Meets Experiment. Angew. Chem. Int. Edit. 1999, 38, 236–240. [Google Scholar] [CrossRef]
  40. Lefebvre, C.; Rubez, G.; Khartabil, H.; Boisson, J.-C.; Contreras-García, J.; Hénon, E. Accurately extracting the signature of intermolecular interactions present in the NCI plot of the reduced density gradient versus electron density. Phys. Chem. Chem. Phys. 2017, 19, 17928–17936. [Google Scholar] [CrossRef]
  41. Lu, T.; Chen, F. Multiwfn: A multifunctional wavefunction analyzer. J. Comput. Chem. 2012, 33, 580–592. [Google Scholar] [CrossRef]
  42. Zwanzig, R.W. High-Temperature Equation of State by a Perturbation Method. I. Nonpolar Gases. J. Chem. Phys. 1954, 22, 1420–1426. [Google Scholar] [CrossRef]
  43. Bennett, C.H. Efficient estimation of free energy differences from Monte Carlo data. J. Comput. Phys. 1976, 22, 245–268. [Google Scholar] [CrossRef]
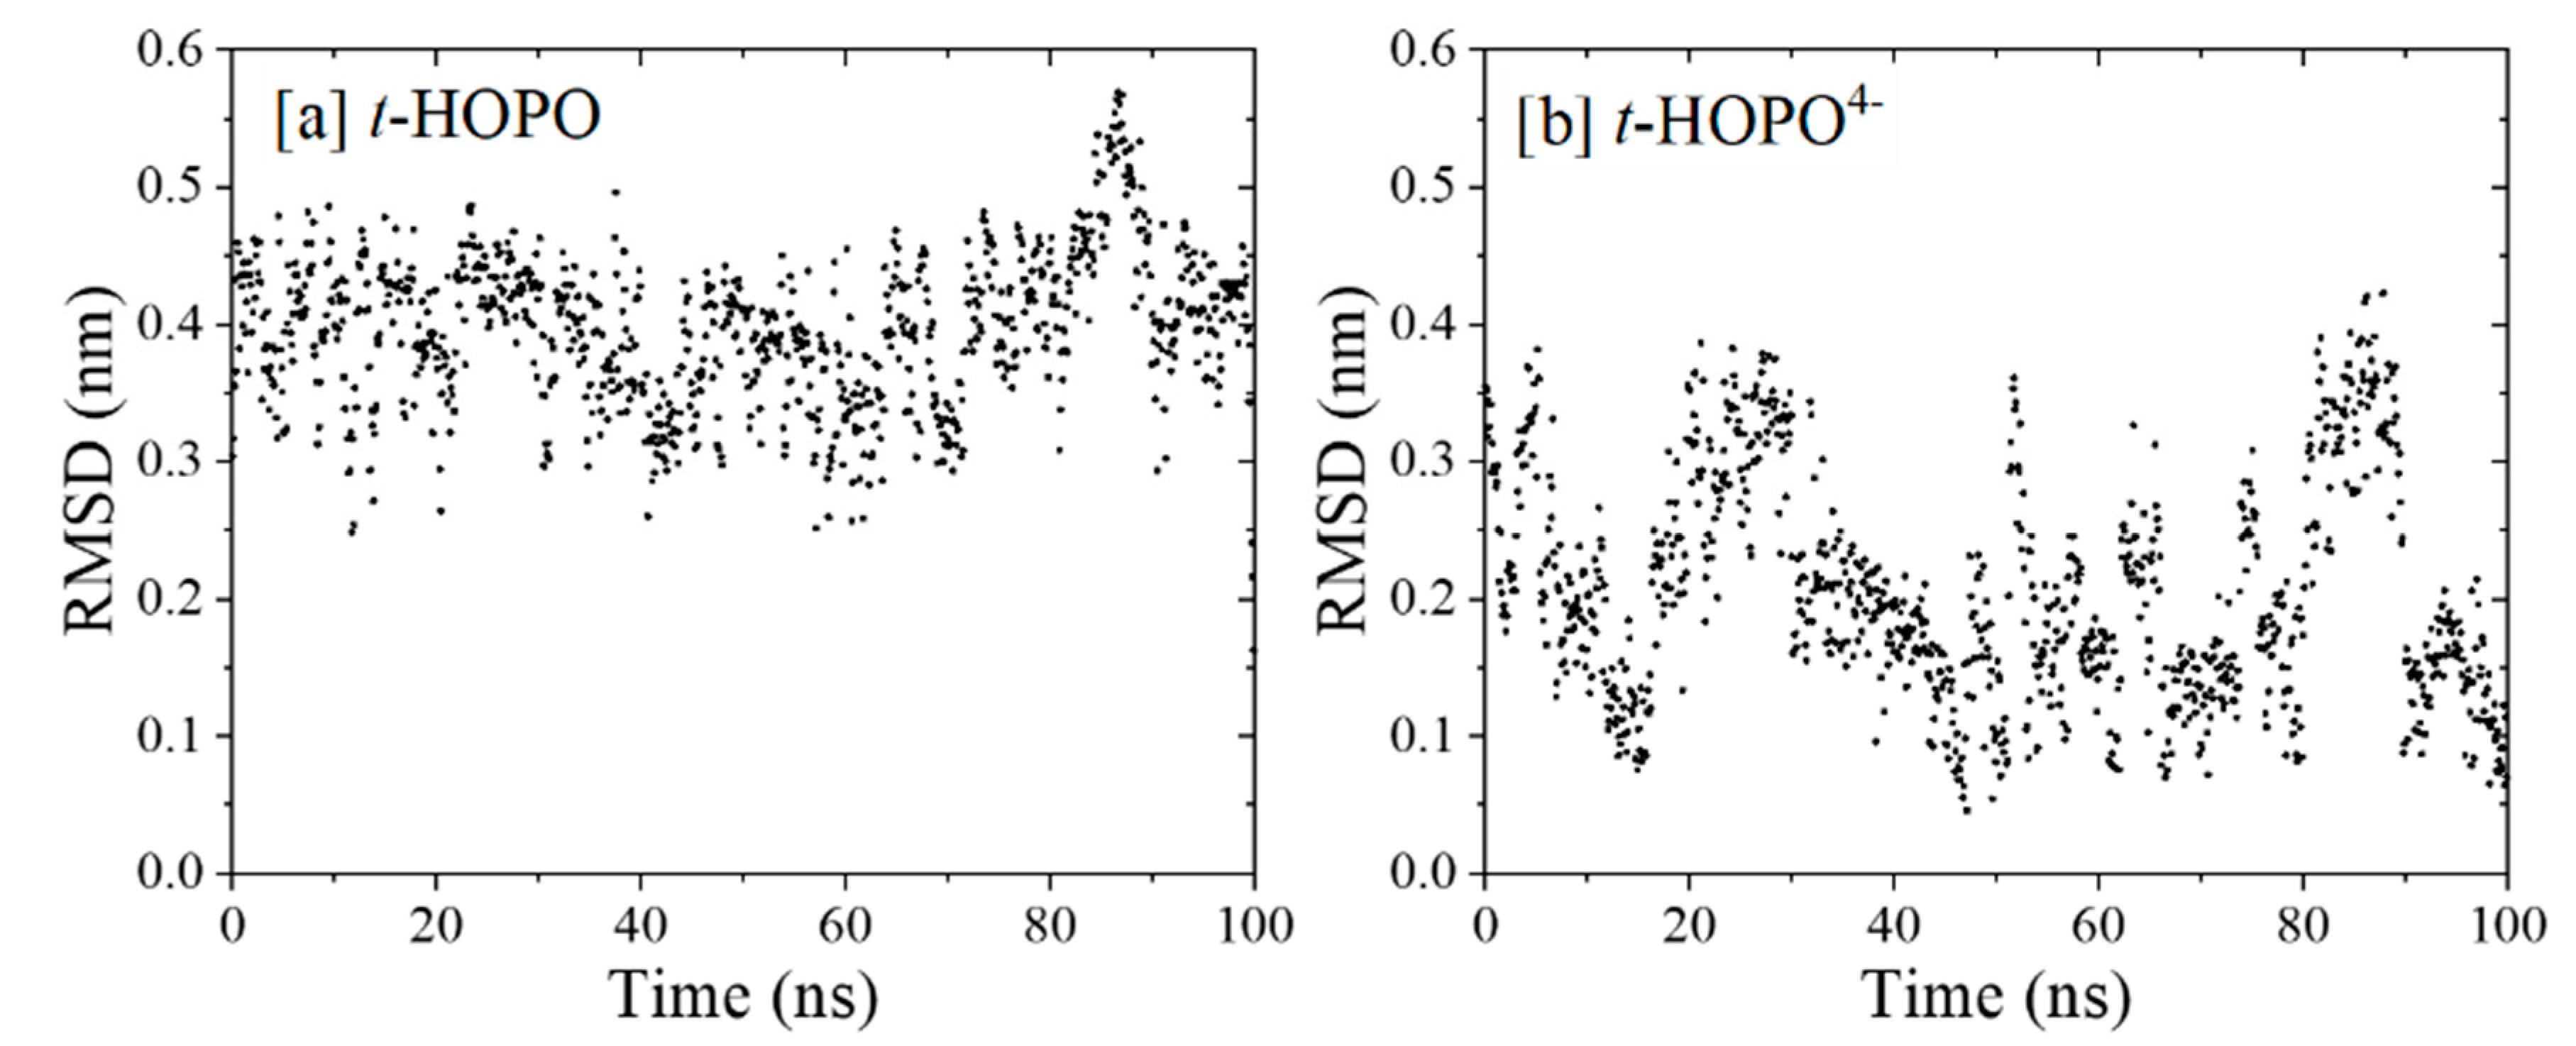
Figure 1. Time evolution of atomic positional RMSD of (a) t-HOPO and (b) t-HOPO4−. All non-hydrogen atoms were considered in the calculations, and the central structure of the most populated cluster (rank 1) in each simulation was used as the reference. The time evolution of RMSD with the starting structure as the reference is provided in the Supporting Information (Figure S1).
Molecules 27 08151 g001
Figure 2. The central structures of top three clusters in the simulations of t-HOPO in its neutral (top) and deprotonated (bottom) states. The cutoff of t-HOPO is 0.35 nm, and the cutoff of t-HOPO4− is 0.18 nm. Color scheme: N atoms in blue, O atoms in red, C atoms in cyan and H atoms in white.
Molecules 27 08151 g002
Scheme 1. Schematic elucidation of the structure of 3,4,3-LI(1,2-HOPO) (denoted as t-HOPO). The molecule is partitioned into a spermine chain and four 1-hydroxy-pyridin-2-one rings (denoted as m-HOPO; Plane1, Plane2, Plane3 and Plane4 highlighted in red, blue, green and pink, respectively). The carbonyl group of each amide linker is counted in the neighboring HOPO unit. The definitions of θ1 and θ2, and the two O atoms of the m-HOPO ring (Oh for the oxygen atom in hydroxyl group) and Oc (oxygen atoms in carbonyl group) are also shown. The atoms used to define the ring plane when calculating the angles between each pair of the four planes are marked by a Δ symbol. The definitions of the three atoms are the same in the other three m-HOPO rings, thus are not shown.
Molecules 27 08151 sch001
Figure 3. The time evolution of the angles between Plane1 and Plane2 (α12), and between Plane3 and Plane4 (α34), and their populations in the simulations of t-HOPO in its neutral (a) and deprotonated (b) states. The typical conformations with two planes parallel (αij~0°) or anti-parallel (αij~180°) to each other in t-HOPO and t-HOPO4− are also shown (c). Color scheme: Plane1 in red, Plane2 in blue, Plane3 in green, Plane4 in pink, N atoms in each ring in black, Na+ in purple.
Molecules 27 08151 g003
Figure 4. IGM analysis of intra-molecular non-covalent interactions between each pair of the four m-HOPO rings: (a) t-HOPO; (b) t-HOPO4−. The isovalues of the IGM descriptor δg were 0.01. Color scheme: N atoms in blue, O atoms in red, C atoms in cyan and H atoms in white.
Molecules 27 08151 g004
Figure 5. The count of intra- (a) and inter- (b) molecular H-bonds during the 100 ns MD simulations.
Molecules 27 08151 g005
Figure 6. The time evolution of the interaction between Na+ counterion and the m-HOPO units in the simulations of t-HOPO4−.
Molecules 27 08151 g006
Figure 7. The distances between four Na+ ions (Na1, Na2, Na3 and Na4) with the nearest atom of HOPO rings.
Molecules 27 08151 g007
Figure 8. The typical structure of U4+ coordinated with t-HOPO4− and two water molecules (a); radial distribution functions (RDF, solid lines) of Oh, Oc (b) and Ow (c) around metal ion (U4+) and their integrals (dash lines) calculated from the 100 ns MD simulations. Color scheme: N atoms in blue, O atoms in red, water molecules in black, C atoms in cyan and H atoms in white.
Molecules 27 08151 g008
Figure 9. The time evolution of the distances between U4+ and the coordinating water molecules during the simulation. The right figure shows the exchange of the second coordinating water ligand (W2) with three additional water molecules (W2(1), W2(2) and W2(2)). The dash line in the right figures designates the U-OW distance of 0.3 nm.
Molecules 27 08151 g009
Figure 10. (a) The radius of gyration (Rg) and (b) eccentricity (ε) of t-HOPO4− and UIV-t-HOPO complex.
Molecules 27 08151 g010
Figure 11. The θ1-θ2 map of the t-HOPO4− (a) and U-t-HOPO complex (b) obtained from the 100 ns MD simulations.
Molecules 27 08151 g011
Figure 12. (a) Atomic positional RMSD of all atoms of UIV8-t-HOPO) complex with the central structure of cluster 1 used as the reference. (b) The superposition of the central structures of the top three clusters (colored in red, green and blue according to their ranks) in the simulations of UIV8-t-HOPO) complex. The cutoff for clustering analysis is 0.05 nm. (c) The central structures of the top three clusters in the simulations of UIV8-t-HOPO) complex. Color scheme: N atoms in blue, O atoms in red, water molecules in black, C atoms in cyan, H atoms in white, and U atom in brown. The time evolution of RMSD with the starting structure as the reference was also calculated and is provided in the Supporting Information (Figure S6).
Molecules 27 08151 g012
Table 1. The atomic RESP (restrained electrostatic potential) charges of Oh and Oc in t-HOPO4−, Oa in the amide group and Ow in the SPCE model; the distances (nm) of U-Oh, U-Oc and U-Ow; and the coordination number (C.N.) of U4+ contributed by each type of ligating atoms. The data were calculated from 100 ns MD simulations.
ChargedM-O (nm)C.N.
Oh (Plane1, 4)−0.6673210.2382
Oc (Plane1, 4)−0.7459960.2302
Oh (Plane2, 3)−0.7230670.2322
Oc (Plane2, 3)−0.7830670.2301
Oa (Plane2, 3)−0.6524270.2521
Ow−0.8476000.2442
Table 2. The calculated ΔG1, ΔG3 and ΔGbind (kcal/mol) in the evaluation of the binding strength of U4+ with t-HOPO via the FEP method, and the decomposition of the UIV-t-HOPO and UIV-water interaction energies (kcal/mol) averaged over the 100 ns-long MD trajectories.
Thermodynamic CycleDecomposed Interaction Energies
UIV-t-HOPO U-t-HOPO
(U4+ Bound with t-HOPO)
U-Water
(U4+ in Water)
ΔG1−1330.14Eele−750.50−141.90
ΔG2−1248.84ELJ70.9713.51
ΔG−81.30Eele + ELJ−679.52−128.39
Publisher’s Note: MDPI stays neutral with regard to jurisdictional claims in published maps and institutional affiliations.