
Optical Anisotropy of Porphyrin Nanocrystals Modified by the Electrochemical Dissolution

 , ,
, , 
Abstract
1. Introduction
2. Results and Discussion
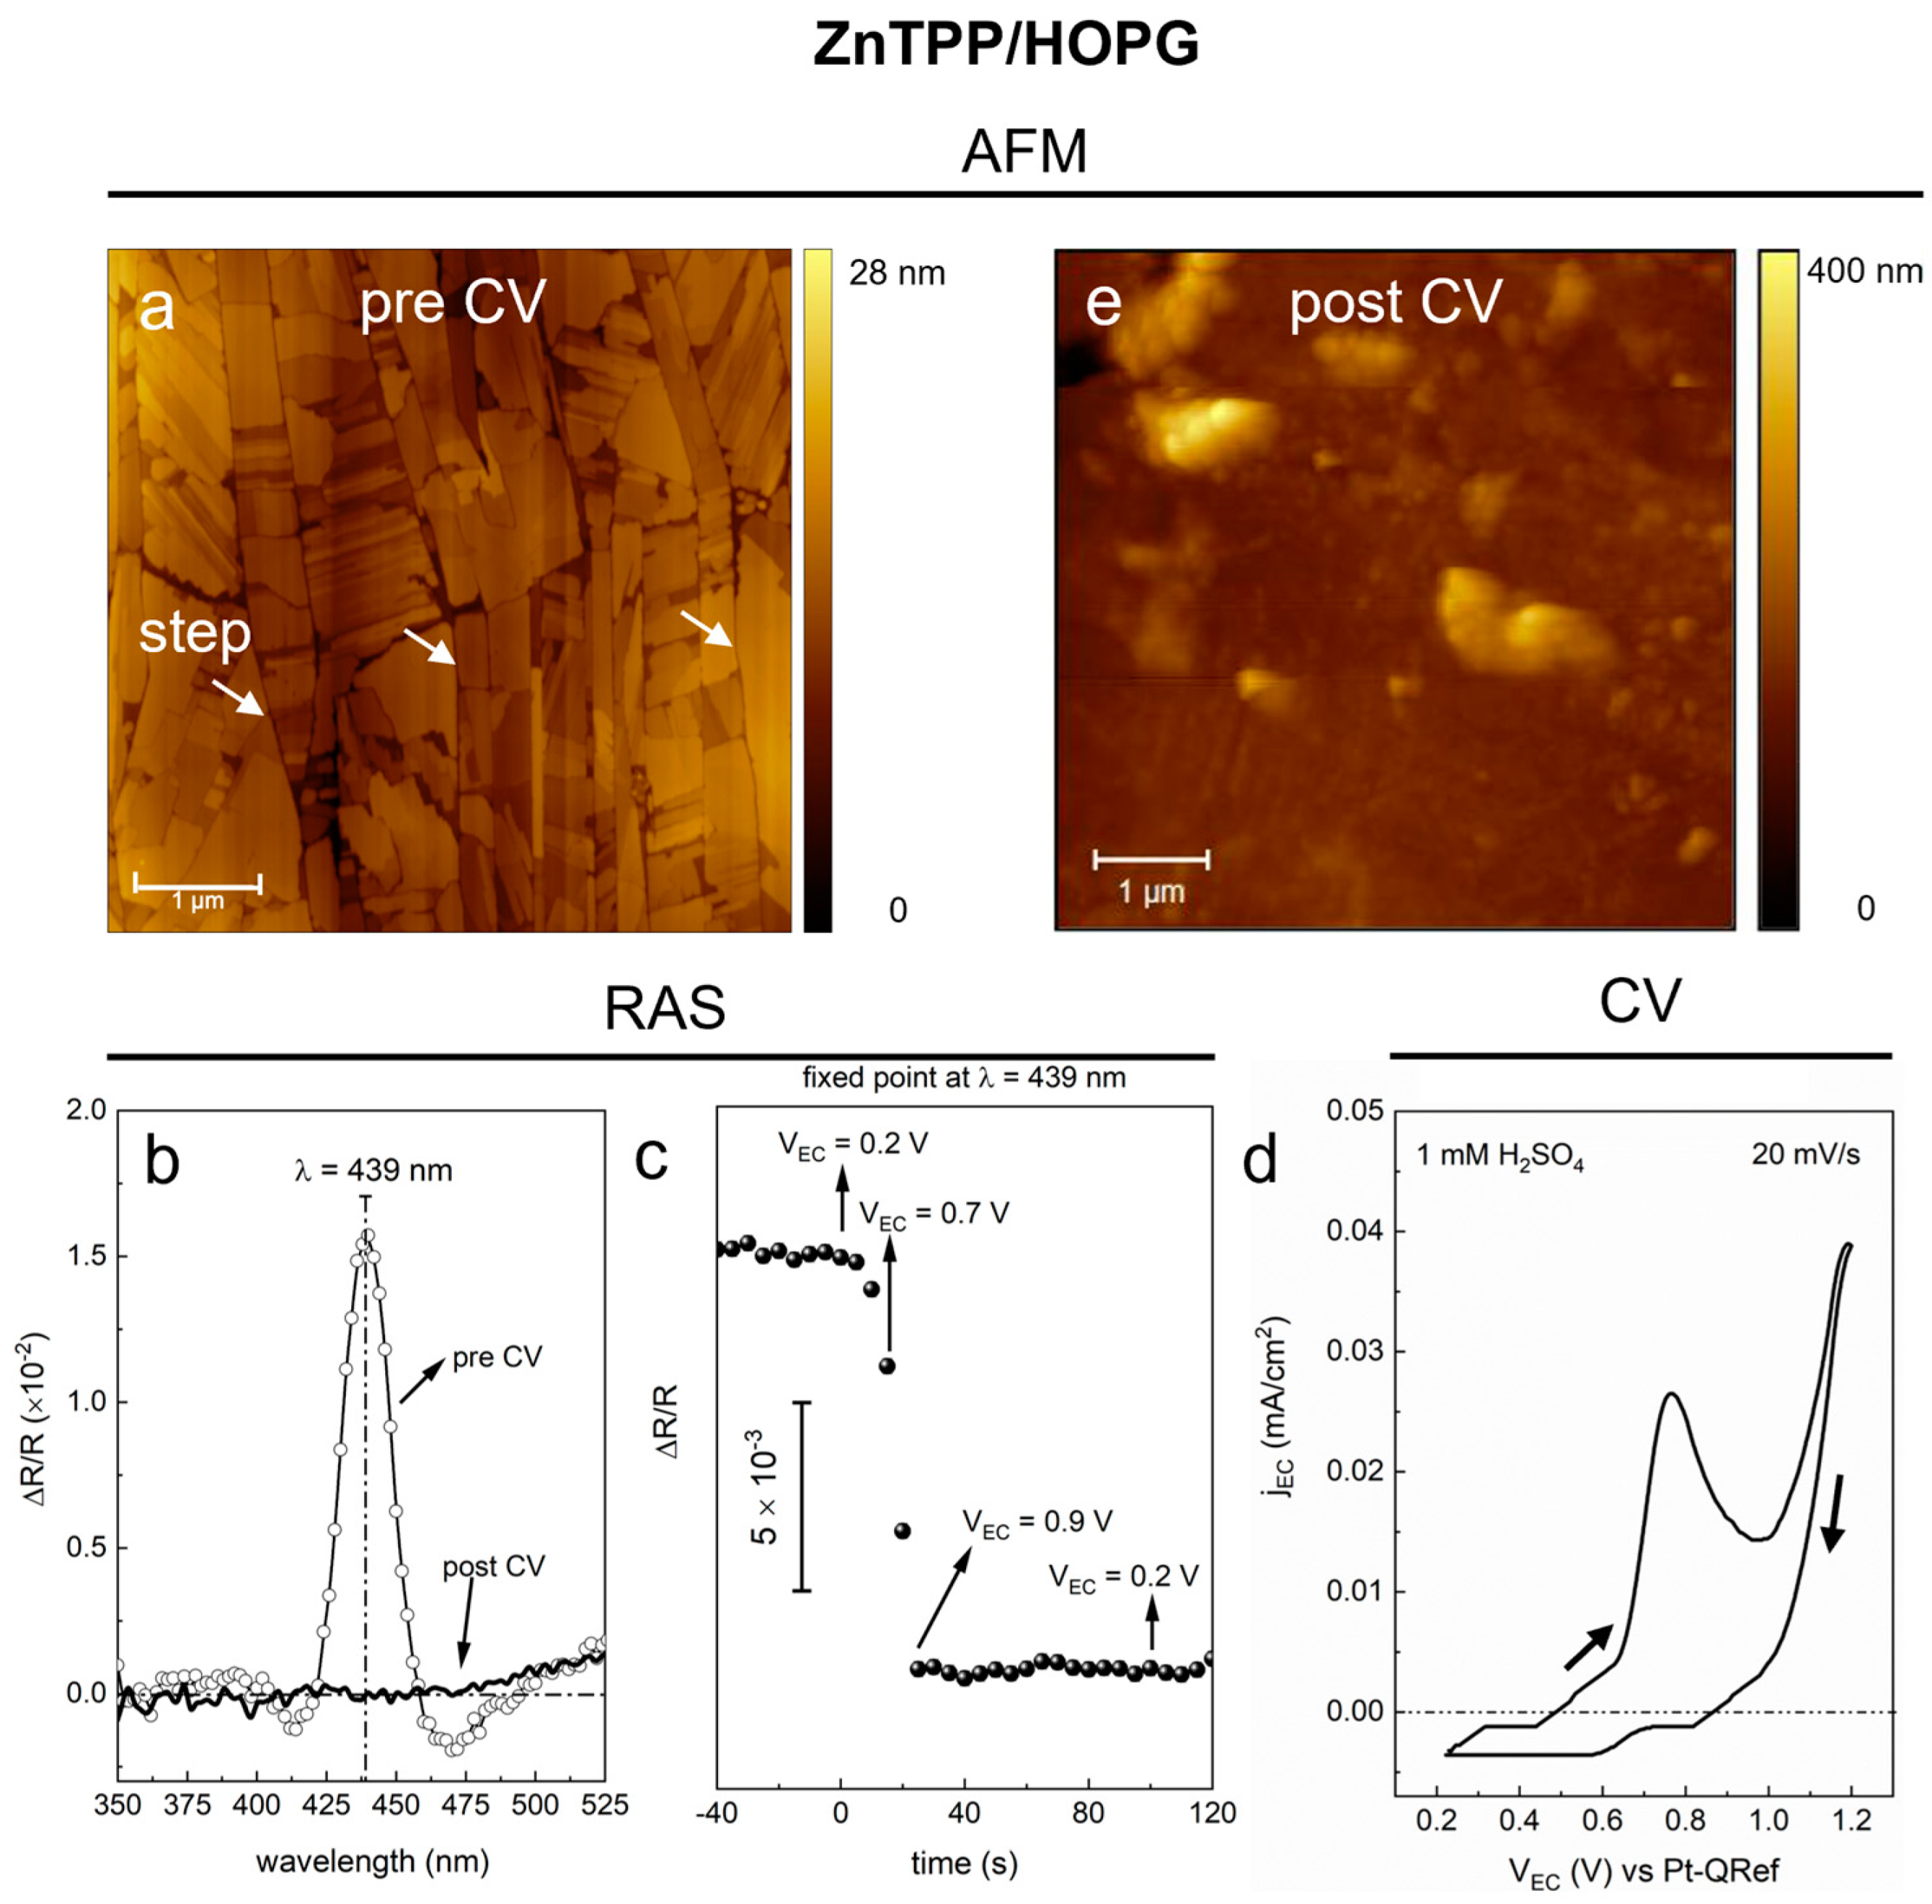
2.1. ZnTPP Film
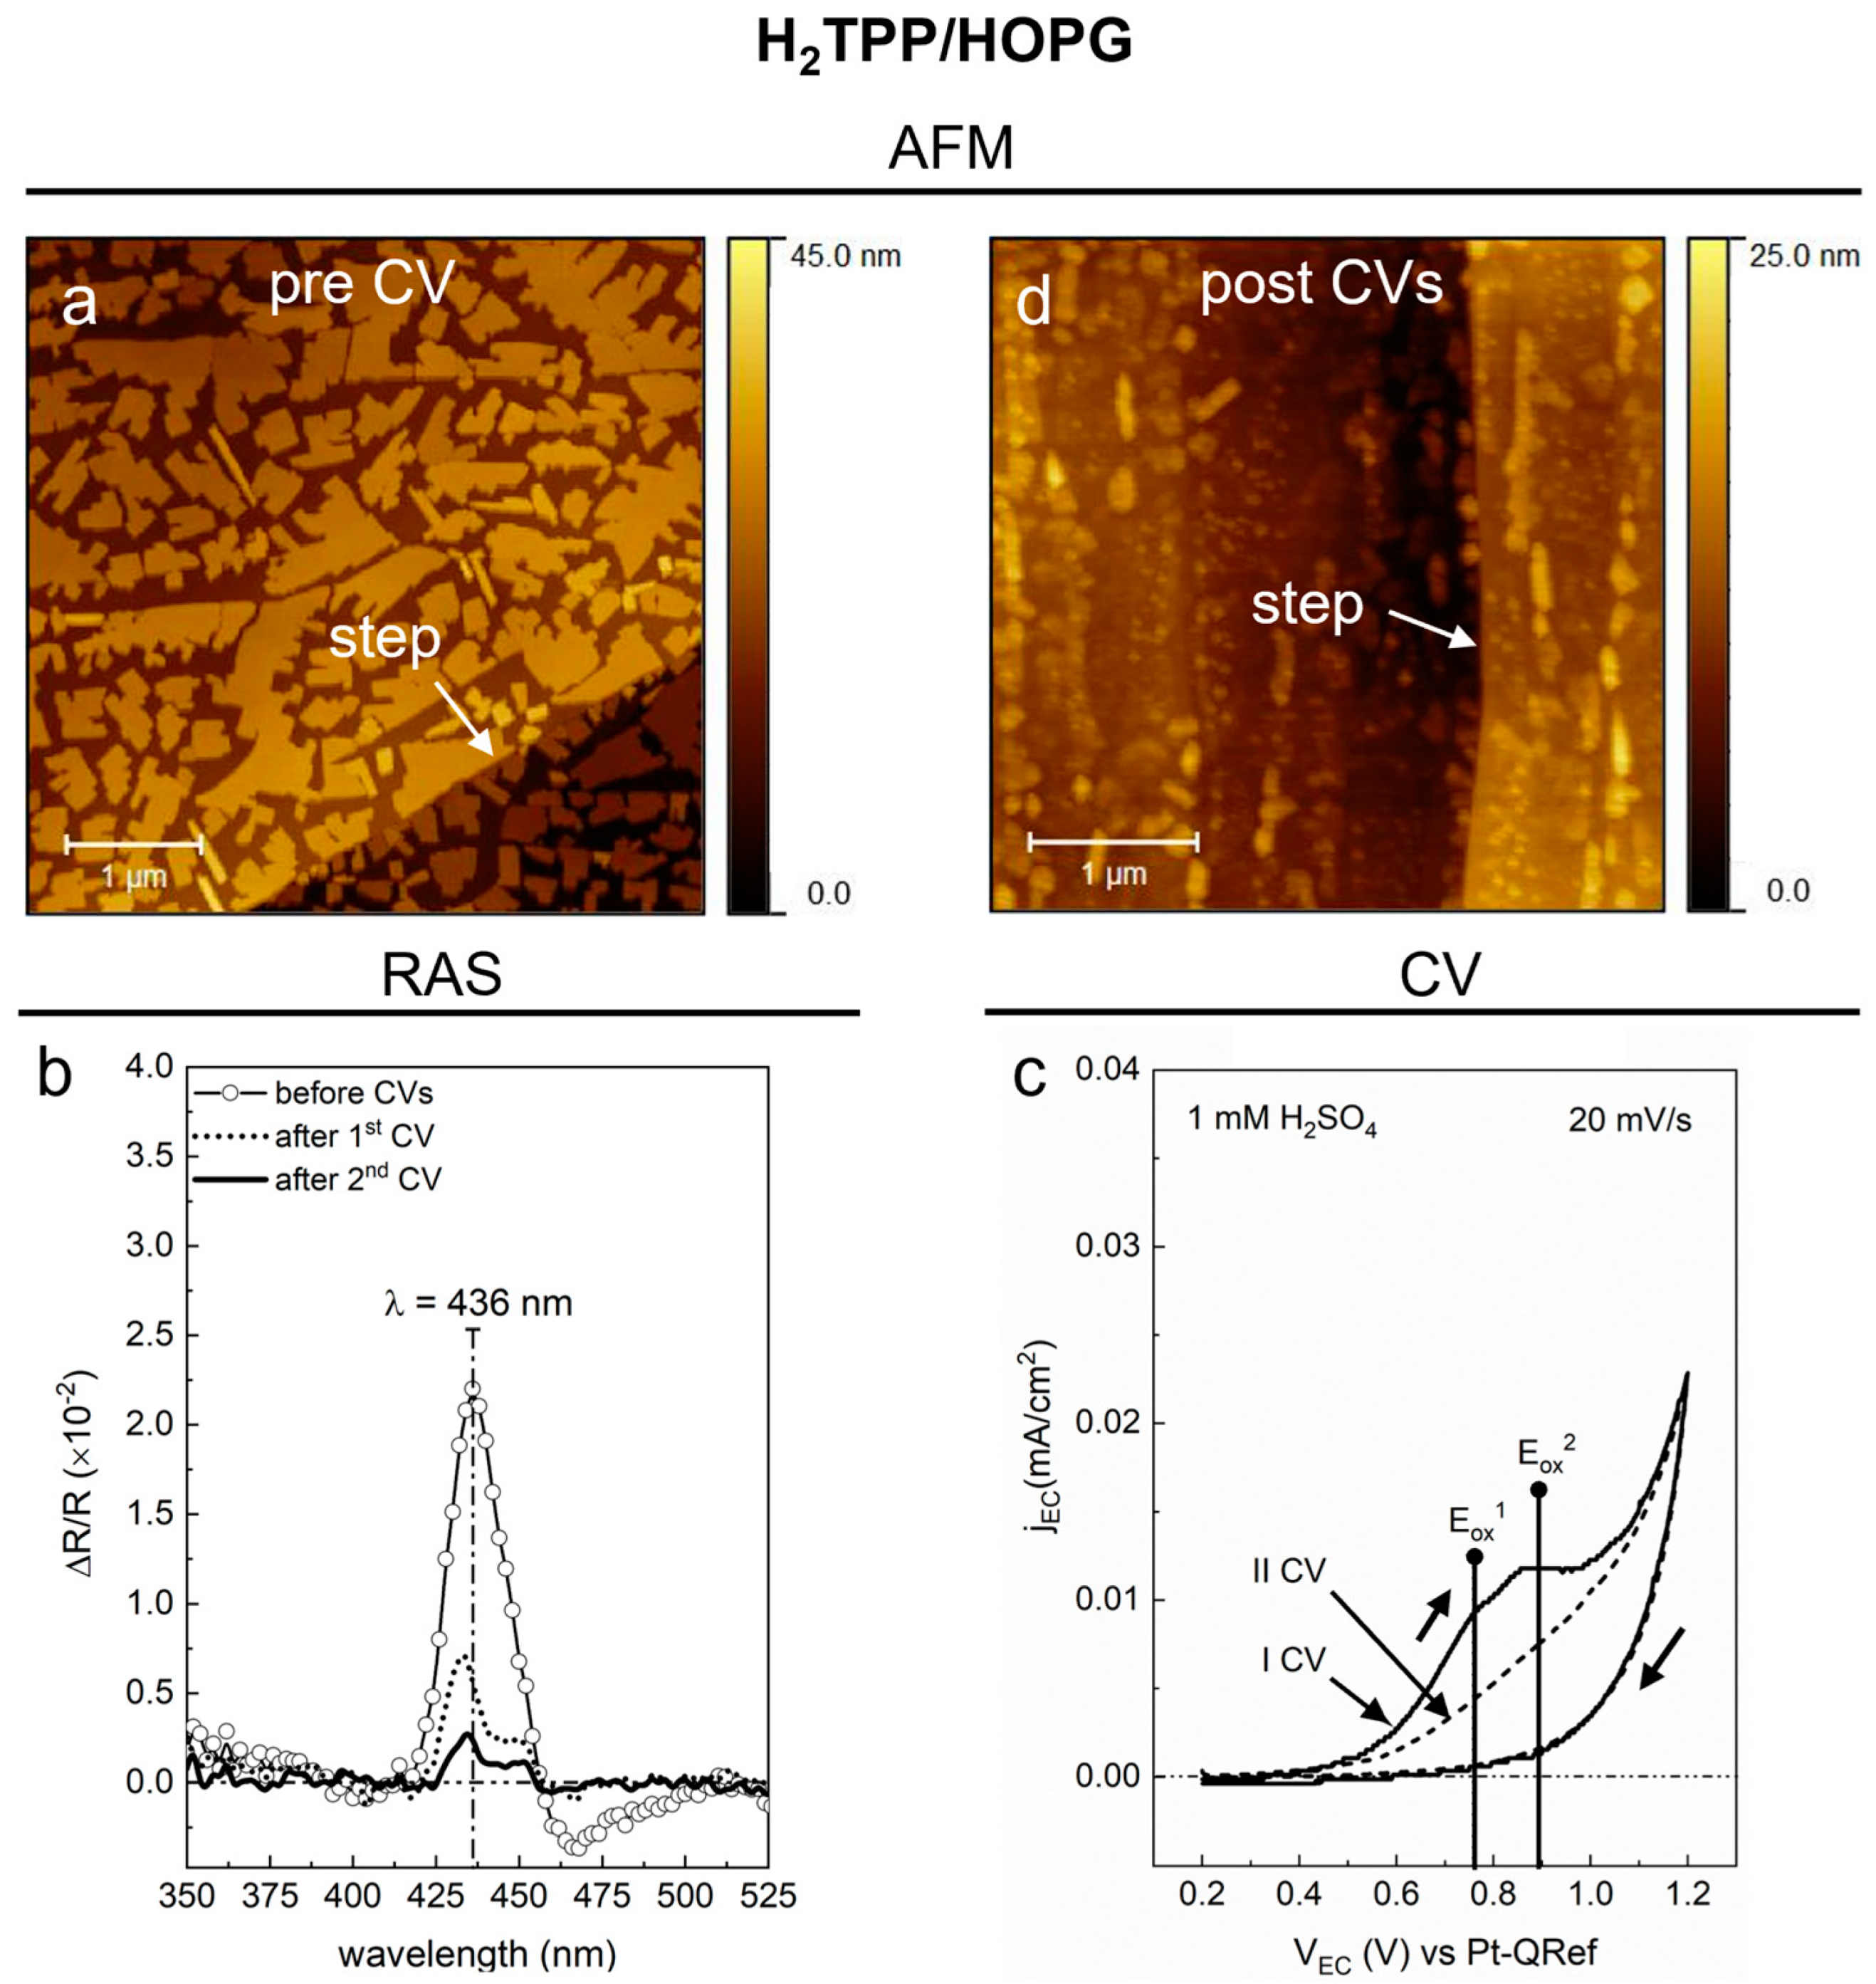
2.2. H2TPP Film
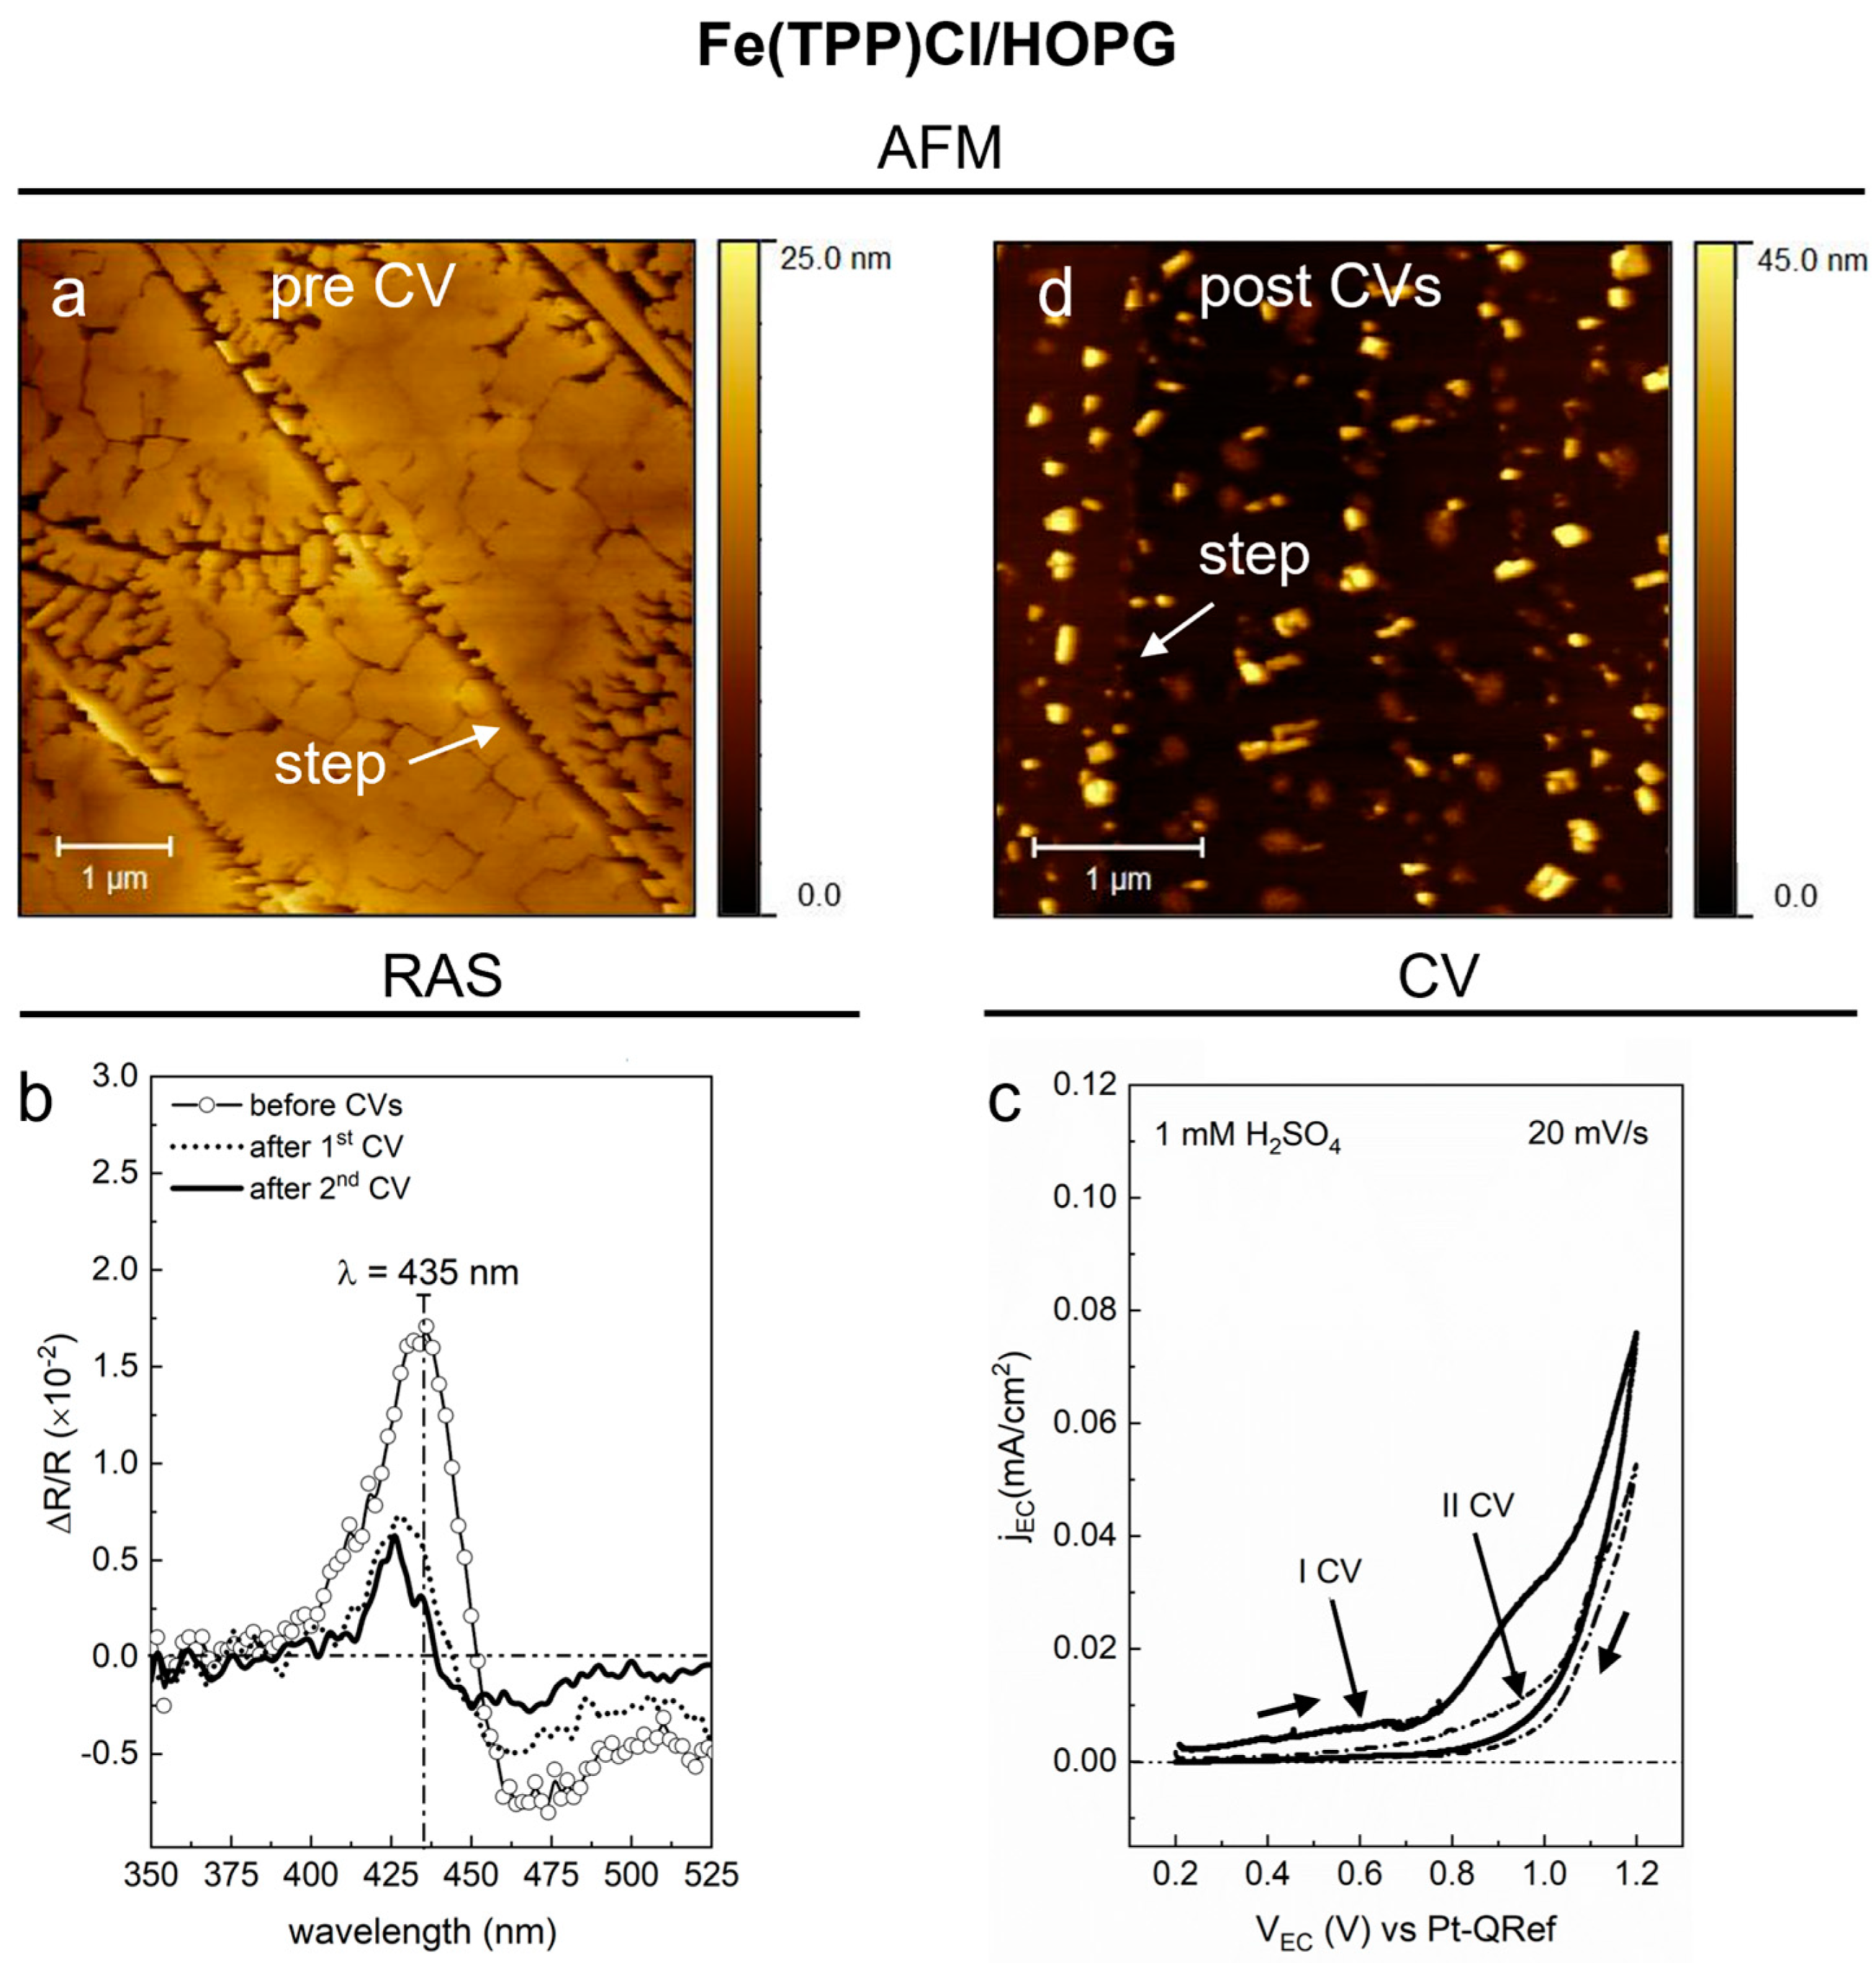
2.3. Fe(TPP)Cl Film
3. Materials and Methods
3.1. Sample and Solution Preparation
3.2. RAS Apparatus and EC Cell
3.3. Atomic Force Microscopy
4. Conclusions
Author Contributions
Funding
Institutional Review Board Statement
Informed Consent Statement
Acknowledgments
Conflicts of Interest
Sample Availability
References
- Goletti, C.; Paolesse, R.; Di Natale, C.; Bussetti, G.; Chiaradia, P.; Froiio, A.; Valli, L.; D’Amico, A. Optical Anisotropy of Porphyrin Langmuir–Blodgett Films. Surf. Sci. 2002, 501, 31–36. [Google Scholar] [CrossRef]
- Goletti, C.; Paolesse, R.; Dalcanale, E.; Berzina, T.; Di Natale, C.; Bussetti, G.; Chiaradia, P.; Froiio, A.; Cristofolini, L.; Costa, M.; et al. Thickness Dependence of the Optical Anisotropy for Porphyrin Octaester Langmuir-Schaefer Films. Langmuir 2002, 18, 6881–6886. [Google Scholar] [CrossRef]
- Goletti, C.; Bussetti, G.; Chiaradia, P.; Sassella, A.; Borghesi, A. The Application of Reflectance Anisotropy Spectroscopy to Organics Deposition. Org. Electron. 2004, 5, 73–81. [Google Scholar] [CrossRef]
- Goletti, C.; Bussetti, G.; Chiaradia, P.; Sassella, A.; Borghesi, A. In Situ Optical Investigation of Oligothiophene Layers Grown by Organic Molecular Beam. J. Phys. Condens. Matter 2004, 16, S4393. [Google Scholar] [CrossRef]
- Bussetti, G.; Ferraro, L.; Bossi, A.; Campione, M.; Duò, L.; Ciccacci, F. A Microprocessor-Aided Platform Enabling Surface Differential Reflectivity and Reflectance Anisotropy Spectroscopy. Eur. Phys. J. Plus 2021, 136, 421. [Google Scholar] [CrossRef]
- Bussetti, G.; Campione, M.; Riva, M.; Picone, A.; Raimondo, L.; Ferraro, L.; Hogan, C.; Palummo, M.; Brambilla, A.; Finazzi, M.; et al. Stable Alignment of Tautomers at Room Temperature in Porphyrin 2D Layers. Adv. Funct. Mater. 2014, 24, 958–963. [Google Scholar] [CrossRef]
- Bussetti, G.; Corradini, C.; Goletti, C.; Chiaradia, P.; Russo, M.; Paolesse, R.; Di Natale, C.; D’Amico, A.; Valli, L. Optical Anisotropy and Gas Sensing Properties of Ordered Porphyrin Films. Phys. Status Solidi. 2005, 242, 2714–2719. [Google Scholar] [CrossRef]
- Bussetti, G.; Cirilli, S.; Violante, A.; Chiaradia, P.; Goletti, C.; Tortora, L.; Paolesse, R.; Martinelli, E.; D’Amico, A.; Di Natale, C.; et al. Optical Anisotropy Readout in Solid-State Porphyrins for the Detection of Volatile Compounds. Appl. Phys. Lett. 2009, 95, 2007–2010. [Google Scholar] [CrossRef]
- Bussetti, G.; Violante, A.; Yivlialin, R.; Cirilli, S.; Bonanni, B.; Chiaradia, P.; Goletti, C.; Tortora, L.; Paolesse, R.; Martinelli, E.; et al. Site-Sensitive Gas Sensing and Analyte Discrimination in Langmuir-Blodgett Porphyrin Films. J. Phys. Chem. C 2011, 115, 8189–8194. [Google Scholar] [CrossRef]
- Weightman, P.; Martin, D.S.; Cole, R.J.; Farrell, T. Reflection Anisotropy Spectroscopy. Reports Prog. Phys. 2005, 68, 1251. [Google Scholar] [CrossRef]
- Wandelt, K. (Ed.) Encyclopedia of Interfacial Chemistry, 1st ed.; Elsevier: Amsterdam, The Netherlands, 2018; ISBN 978-0-12-809894-3. [Google Scholar]
- De Rosa, S.; Branchini, P.; Yivlialin, R.; Duò, L.; Bussetti, G.; Tortora, L. Disclosing the Graphite Surface Chemistry in Acid Solutions for Anion Intercalation. ACS Appl. Nano Mater. 2020, 3, 691–698. [Google Scholar] [CrossRef]
- Mazine, V.; Borensztein, Y.; Cagnon, L.; Allongue, P. Optical Reflectance Anisotropy Spectroscopy of the Au(110) Surface in Electrochemical Environment. Phys. Status Solidi. 1999, 175, 311–316. [Google Scholar] [CrossRef]
- Smith, C.I.; Maunder, A.J.; Lucas, C.A.; Nichols, R.J.; Weightman, P. Adsorption of Pyridine on Au(110) as Measured by Reflection Anisotropy Spectroscopy. J. Electrochem. Soc. 2003, 150, E233. [Google Scholar] [CrossRef]
- Goletti, C.; Bussetti, G.; Violante, A.; Bonanni, B.; Di Giovannantonio, M.; Serrano, G.; Breuer, S.; Gentz, K.; Wandelt, K. Cu(110) Surface in Hydrochloric Acid Solution: Potential Dependent Chloride Adsorption and Surface Restructuring. J. Phys. Chem. C 2015, 119, 1782–1790. [Google Scholar] [CrossRef]
- Barati, G.; Solokha, V.; Wandelt, K.; Hingerl, K.; Cobet, C. Chloride-Induced Morphology Transformations of the Cu(110) Surface in Dilute HCl. Langmuir 2014, 30, 14486–14493. [Google Scholar] [CrossRef]
- Weightman, P.; Harrison, P.; Lucas, C.A.; Grunder, Y.; Smith, C.I. The Reflection Anisotropy Spectroscopy of the Au(1 1 0) Surface Structures in Liquid Environments. J. Phys. Condens. Matter 2015, 27, 475005. [Google Scholar] [CrossRef]
- Yivlialin, R.; Bussetti, G.; Penconi, M.; Bossi, A.; Ciccacci, F.; Finazzi, M.; Duò, L. Vacuum-Deposited Porphyrin Protective Films on Graphite: Electrochemical Atomic Force Microscopy Investigation during Anion Intercalation. ACS Appl. Mater. Interfaces 2017, 9, 4100–4105. [Google Scholar] [CrossRef]
- Yivlialin, R.; Penconi, M.; Bussetti, G.; Biroli, A.O.; Finazzi, M.; Duò, L.; Bossi, A. Morphological Changes of Porphine Films on Graphite by Perchloric and Phosphoric Electrolytes: An Electrochemical-AFM Study. Appl. Surf. Sci. 2018, 442, 501–506. [Google Scholar] [CrossRef]
- Bussetti, G.; Filoni, C.; Li Bassi, A.; Bossi, A.; Campione, M.; Orbelli Biroli, A.; Castiglioni, C.; Trabattoni, S.; De Rosa, S.; Tortora, L.; et al. Driving Organic Nanocrystals Dissolution Through Electrochemistry. Chem. Open 2021, 10, 748–755. [Google Scholar] [CrossRef]
- Filoni, C.; Duò, L.; Ciccacci, F.; Li Bassi, A.; Bossi, A.; Campione, M.; Capitani, G.; Denti, I.; Tommasini, M.; Castiglioni, C.; et al. Reactive Dissolution of Organic Nanocrystals at Controlled PH. ChemNanoMat 2020, 6, 567–575. [Google Scholar] [CrossRef]
- Bussetti, G.; Campione, M.; Ferraro, L.; Raimondo, L.; Bonanni, B.; Goletti, C.; Palummo, M.; Hogan, C.; Duò, L.; Finazzi, M.; et al. Probing Two-Dimensional vs Three-Dimensional Molecular Aggregation in Metal-Free Tetraphenylporphyrin Thin Films by Optical Anisotropy. J. Phys. Chem. C 2014, 118, 15649–15655. [Google Scholar] [CrossRef]
- Bussetti, G.; Campione, M.; Raimondo, L.; Yivlialin, R.; Finazzi, M.; Ciccacci, F.; Sassella, A.; Duò, L. Unconventional Post-deposition Chemical Treatment on Ultra-thin H2TPP. Cryst. Res. Technol. 2014, 49, 581–586. [Google Scholar] [CrossRef]
- Kano, K.; Fukuda, K.; Wakami, H.; Nishiyabu, R.; Pasternack, R.F. Factors Influencing Self-Aggregation Tendencies of Cationic Porphyrins in Aqueous Solution. J. Am. Chem. Soc. 2000, 122, 7494–7502. [Google Scholar] [CrossRef]
- Scheidt, W.R.; Mondal, J.U.; Eigenbrot, C.W.; Adler, A.; Radonovich, L.J.; Hoard, J.L. Crystal and Molecular Structure of the Silver(II) and Zinc(II) Derivatives of Meso-Tetraphenylporphyrin. An Exploration of Crystal-Packing Effects on Bond Distance. Inorg. Chem. 1986, 25, 795–799. [Google Scholar] [CrossRef]
- Byrn, M.P.; Curtis, C.J.; Hsiou, Y.; Khan, S.I.; Sawin, P.A.; Tendick, S.K.; Terzis, A.; Strouse, C.E. Porphyrin Sponges: Conservation of Host Structure in over 200 Porphyrin-Based Lattice Clathrates. J. Am. Chem. Soc. 1993, 115, 9480–9497. [Google Scholar] [CrossRef]
- Hunter, S.C.; Smith, B.A.; Hoffmann, C.M.; Wang, X.; Chen, Y.S.; McIntyre, G.J.; Xue, Z.L. Intermolecular Interactions in Solid-State Metalloporphyrins and Their Impacts on Crystal and Molecular Structures. Inorg. Chem. 2014, 53, 11552–11562. [Google Scholar] [CrossRef]
- Bussetti, G.; Yivlialin, R.; Ciccacci, F.; Duò, L.; Gibertini, E.; Accogli, A.; Denti, I.; Magagnin, L.; Micciulla, F.; Cataldo, A.; et al. Electrochemical Scanning Probe Analysis Used as a Benchmark for Carbon Forms Quality Test. J. Phys. Condens. Matter 2020, 33, 115002. [Google Scholar] [CrossRef]
- Bussetti, G.; Campione, M.; Sassella, A.; Duò, L. Optical and Morphological Properties of Ultra-Thin H2TPP, H4TPP and ZnTPP Films. Phys. Status Solidi Basic Res. 2015, 252, 93857832. [Google Scholar] [CrossRef]
- Castillo, C.; Vazquez-Nava, R.A.; Mendoza, B.S. Reflectance Anisotropy for Porphyrin Octaester Langmuir-Schaefer Films. In Proceedings of the Physica Status Solidi C: 5th International Conference on Optics of Surfaces and Interfaces (OSI-V), León, Mexico, 26–30 May 2003; pp. 2971–2975. [Google Scholar]
- Mendoza, B.S.; Vázquez-Nava, R.A. Model for Reflectance Anisotropy Spectra of Molecular Layered Systems. Phys. Rev. B-Condens. Matter Mater. Phys. 2005, 72, 035411. [Google Scholar] [CrossRef]
- Ward, S.; Perkins, M.; Zhang, J.; Roberts, C.J.; Madden, C.E.; Luk, S.Y.; Patel, N.; Ebbens, S.J. Identifying and Mapping Surface Amorphous Domains. Pharm. Res. 2005, 22, 1195–1202. [Google Scholar] [CrossRef]
- Raberg, W.; Wandelt, K. Atomically ResolvedAFM Investigations of an Amorphous Barium Silicate Surface. Appl. Phys. A Mater. Sci. Process. 1998, 66, 1143–1146. [Google Scholar] [CrossRef]
- Paul-Roth, C.; Rault-Berthelot, J.; Simonneaux, G.; Poriel, C.; Abdalilah, M.; Letessier, J. Electroactive Films of Poly(Tetraphenylporphyrins) with Reduced Bandgap Electroanalytical Chemistry. J. Electroanal. Chem. 2006, 597, 19–27. [Google Scholar] [CrossRef]
- Kadish, K.M.; Larson, G.; Lexa, D.; Momenteau, M. Electrochemical and Spectral Characterization of the Reduction Steps of μ-Oxo-Bis (Iron Tetraphenylporphyrin) Dimer in Dimethylformamide. J. Am. Chem. Soc. 1975, 97, 282–288. [Google Scholar] [CrossRef]
- Kadish, K.M.; Morrison, M.M.; Constant, L.A.; Dickens, L.; Davis, D.G. A Study of Solvent and Substituent Effects on the Redox Potentials and Electron-Transfer Rate Constants of Substituted Iron Meso-Tetraphenylporphyrins. J. Am. Chem. Soc. 1976, 98, 8387–8390. [Google Scholar] [CrossRef]
- Felton, R.H.; Owen, G.S.; Dolphin, D.; Fajer, J. Iron(IV) Porphyrins. J. Am. Chem. Soc. 1971, 2041, 6332–6334. [Google Scholar] [CrossRef]
- Bussetti, G.; Calloni, A.; Celeri, M.; Yivlialin, R.; Finazzi, M.; Bottegoni, F.; Duò, L.; Ciccacci, F. Structure and Electronic Properties of Zn-Tetra-Phenyl-Porphyrin Single- and Multi-Layers Films Grown on Fe(001)-p(1 × 1)O. Appl. Surf. Sci. 2016, 390, 856–862. [Google Scholar] [CrossRef]
- Aspnes, D.E.; Harbison, J.P.; Studna, A.A.; Florez, L.T. Reflectance-Difference Spectroscopy System for Real-Time Measurements of Crystal Growth. Appl. Phys. Lett. 1988, 52, 957–959. [Google Scholar] [CrossRef]


Publisher’s Note: MDPI stays neutral with regard to jurisdictional claims in published maps and institutional affiliations. |
© 2022 by the authors. Licensee MDPI, Basel, Switzerland. This article is an open access article distributed under the terms and conditions of the Creative Commons Attribution (CC BY) license (https://creativecommons.org/licenses/by/4.0/).
Share and Cite
Yivlialin, R.; Filoni, C.; Goto, F.; Calloni, A.; Duò, L.; Ciccacci, F.; Bussetti, G. Optical Anisotropy of Porphyrin Nanocrystals Modified by the Electrochemical Dissolution. Molecules 2022, 27, 8010. https://doi.org/10.3390/molecules27228010
Yivlialin R, Filoni C, Goto F, Calloni A, Duò L, Ciccacci F, Bussetti G. Optical Anisotropy of Porphyrin Nanocrystals Modified by the Electrochemical Dissolution. Molecules. 2022; 27(22):8010. https://doi.org/10.3390/molecules27228010
Chicago/Turabian StyleYivlialin, Rossella, Claudia Filoni, Francesco Goto, Alberto Calloni, Lamberto Duò, Franco Ciccacci, and Gianlorenzo Bussetti. 2022. "Optical Anisotropy of Porphyrin Nanocrystals Modified by the Electrochemical Dissolution" Molecules 27, no. 22: 8010. https://doi.org/10.3390/molecules27228010
APA StyleYivlialin, R., Filoni, C., Goto, F., Calloni, A., Duò, L., Ciccacci, F., & Bussetti, G. (2022). Optical Anisotropy of Porphyrin Nanocrystals Modified by the Electrochemical Dissolution. Molecules, 27(22), 8010. https://doi.org/10.3390/molecules27228010