Abstract
In this study, a simple colorimetric method was established to detect copper ion (Cu2+), sulfathiazole (ST), and glucose based on the acetylcholinesterase (AChE)-like activity of zeolitic imidazolate framework-8 (ZIF-8). The AChE-like activity of ZIF-8 can hydrolyze acetylthiocholine chloride (ATCh) to thiocholine (TCh), which will further react with 5,5′-dithiobis (2-nitrobenzoic acid) (DTNB) to generate 2-nitro-5-thiobenzoic acid (TNB) that has a maximum absorption peak at 405 nm. The effects of different reaction conditions (buffer pH, the volume of ZIF-8, reaction temperature and time, and ATCh concentration) were investigated. Under the optimized conditions, the value of the Michaelis-Menten constant (Km) is measured to be 0.83 mM, which shows a high affinity toward the substrate (ATCh). Meanwhile, the ZIF-8 has good storage stability, which can maintain more than 80.0% of its initial activity after 30 days of storage at room temperature, and the relative standard deviation (RSD) of batch-to-batch (n = 3) is 5.1%. The linear dependences are obtained based on the AChE-like activity of ZIF-8 for the detection of Cu2+, ST, and glucose in the ranges of 0.021–1.34 and 5.38–689.66 µM, 43.10–517.24 µM, and 0.0054–1.40 mM, respectively. The limit of detections (LODs) are calculated to be 20.00 nM, 9.25 µM, and 5.24 µM, respectively. Moreover, the sample spiked recoveries of Cu2+ in lake water, ST in milk, and glucose in strawberry samples were measured, and the results are in the range of 98.4–115.4% with the RSD (n = 3) lower than 3.3%. In addition, the method shows high selectivity in the real sample analysis.
1. Introduction
Nowadays, enzyme-mimicking catalytic nanomaterial (nanozyme) has been rapidly developed, attracting much attention in many fields. The nanozyme can make up for several shortcomings of biological enzymes, such as poor stability in harsh environments, difficulty in recycling, and high-cost of production. The frequently used nanozymes include metal oxides, metal sulfides, noble metals, and metal-organic frameworks (MOFs) [1,2,3]. MOFs, owning uniform porous structure, high surface area, porosity, and good chemical stability, are composed of organic ligands and metal nodes, which have been intensively used in the analysis of gases, ions, aromatic compounds, and bioactive species based on optical, electrochemical, mechanical or other sensing methods [4]. For example, He, et al. [5] successfully synthesized a novel 3D ruthenium-based metal-organic gels (Ru-MOGs) with fibrillar network structure using a facile one-step strategy at room temperature, which was used in the detection of glucose with a good linearity in the range of 0.02–5 μM, and the limit of detection (LOD) is 9 nM. Sun et al. [6] synthesized an Eu-MOF ([Eu2L2(DMF)-(H2O)2] 2DMF H2O) as a turn-off probe for the detection of ferric ion (Fe3+) and copper ion (Cu2+) in N, N-dimethylformamide (DMF), and the LODs are 12.2 µM and 18.3 µM, respectively. Nevertheless, the synthesis conditions of most MOF materials require high temperature and pressure, large amounts of organic reagents, and long synthesis time. Among the reported MOFs, zeolitic imidazolate framework-8 (ZIF-8) shows a relatively high porous, robust structure, and multiple enzyme activities. In addition, the synthesis process of ZIF-8 is green and simple.
Cu2+, an important cofactor or a structural component of many enzymes and other proteins in living organisms, plays an important role in several physiological processes, such as cellular respiration, hematopoietic function, bone formation, prevention of cardiovascular diseases, and connective tissue development [7]. Because of its widespread applications in agriculture and industry, Cu2+ continues to be one of the major components of environmental pollutants. Excessive Cu2+ induces damages to liver, brain, kidney and other tissues, and further result in serious neurological diseases, such as Wilson’s, Parkinson’s, and Alzheimer’s diseases [8]. The World Health Organization requires that the concentration of Cu2+ in drinking water should be less than 2.0 mg/L, and the safe concentration limit of Cu2+ in drinking water stipulated by the Chinese Ministry of Health is 1.0 mg/L [9]. Therefore, it is necessary to establish a fast, sensitive, and convenient method for the determination of Cu2+.
Sulfathiazole (ST), a kind of synthetic antimicrobial agent that contains the sulfonamide group, is active against a broad spectrum of gram-positive and gram-negative bacteria, which is a kind of antibacterial drug used in farm animals for the treatment of various bacterial infections. Prolonged or irregular using, or prolonged contacting to the residues of ST may lead to antibiotic resistance in both veterinary and human applications [10]. Moreover, ST is found to be carcinogenic and has relatively long half-life. The widespread use of antibiotics will not only affect the ecological system but also risk the contamination of food, and their metabolites endanger the health of the consumers [11]. Therefore, it is necessary to monitor ST in real-time.
Glucose is the energy source and metabolic intermediate product of living cells, which is closely related to the metabolism of the endocrine system. Glucose is one of the most important monosaccharides in almost all kinds of fruits, which is used as an indicator of fruit quality [12]. Consuming fruits containing high sugar will increase the blood sugar level and blood sugar load of patients with diabetes [13]. The detection of glucose concentration is vital in many fields, such as medical diagnosis and the food industry [14]. Thus, the development of a sensitive glucose sensor is essential for practical applications.
In this study, a colorimetric method was established for Cu2+, ST, and glucose detection based on the AChE-like activity of ZIF-8, which may be due to the similarities in structure of them. ZIF-8 consists of a central zinc ion (Zn2+) and four 2-methylimidazole ligands. And the crystal structure of AChE indicates that the active site, constituted by a catalytic triad and a so-called anionic subsite, is located at the bottom of a deep and narrow gorge. The anionic subsite recognizes the quaternary ammonium group of the substrate, while the catalytic triad, formed by Glu327, His440, and Ser200, is responsible for the hydrolysis of substrate acetylthiocholine chloride (ATCh) [15] (Figure S1). It is worth mentioning that the process utilizes the enzyme-like activity of the material will not change its structure before and after the reaction. As shown in Figure 1, ZIF-8 can act on the ATCh to generate thiocholine (TCh), which can further react with 5,5′-dithiobis (2-nitrobenzoic acid) (DTNB) to generate 2-nitro-5-thiobenzoic acid (TNB), showing a maximum absorption peak at 405 nm. The reaction can be suppressed by the addition of Cu2+, which can chelate with TCh to reduce its reaction to DTNB. Furthermore, gluconic acid and H2O2 are generated by the reaction of glucose oxidase (GOX) and glucose. The H2O2 can oxidize TCh, therefore, less TCh can react with DTNB to generate TNB. In addition, ST and its isosteres (sulfamides and sulfamates) have been extensively studied as potent metabolic AChE inhibitors, which will weaken the catalytic reaction of the enzyme [16]. Therefore, a colorimetric method based on the AChE-like activity of ZIF-8 can be designed to detect Cu2+, ST, and glucose. The linear relationship between the Cu2+, ST, and glucose concentrations and the inhibition rate of ZIF-8 activity was investigated. Finally, the developed method was applied to detect Cu2+, ST, and glucose in lake water, milk, and strawberry samples, respectively.
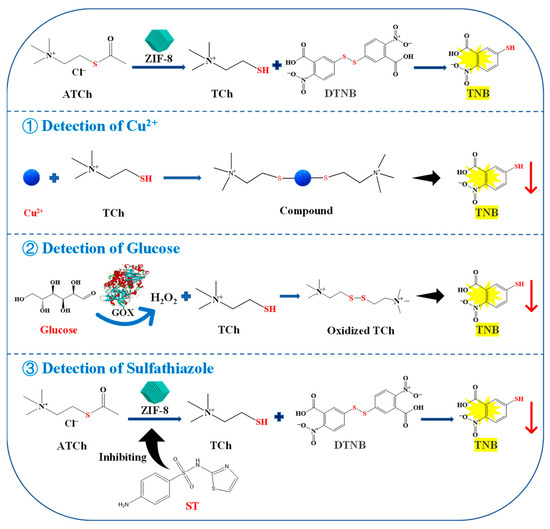
Figure 1.
Schematic illustration for the detection of Cu2+, glucose, and ST based on the AChE-like activity of ZIF-8. ATCh, acetylthiocholine chloride; TCh, thiocholine; DTNB, 5,5′-dithiobis-(2-nitrobenzoic acid); TNB, 5-dithiobis nitrobenzoic acid; ST, sulfathiazole.
2. Results and Discussion
2.1. Characterization of ZIF-8 and Feasibility of the Method for Cu2+, ST, and Glucose Detection
The morphology and structure of ZIF-8 were characterized by scanning electron microscope (SEM), X-ray powder diffraction (XRD), Fourier transform infrared spectroscopy (FT-TR), and Brunner-Emmet-Teller (BET) measurements. As the SEM images shown in Figure 2A,B, the synthesized ZIF-8 nanocrystals are rhombic dodecahedrons with a uniform size of about 1 µm. The XRD spectrum depicted in Figure 2C shows mainly sharp and intense diffraction peaks (2θ = 011°, 002°, 112°, 022°, and 222°), revealing the formation of a crystalline nanostructure, which is consistent with the previous report [17]. In addition, as shown in Figure 2D, the FT-IR spectrum displays the characteristic bands of ZIF-8. The absorption peaks at 3105 cm−1 and 2926 cm−1 are due to the NH and CH stretching vibrations, respectively. The absorption peak at 1574 cm−1 is assigned to the CN stretching vibration. The absorption peaks at 1425 cm−1 and 1308 cm−1 correspond to the bending signals of the imidazole ring, and the band at 401 cm−1 is attributed to the Zn-N stretching vibration [18]. The ZIF-8 exhibits a BET specific surface area of 1455.6 m2/g with a total pore volume of 0.4975 cm3/g and an average pore diameter of 1.3671 nm (Figure 2E,F). The above results indicate that ZIF-8 is successfully synthesized.
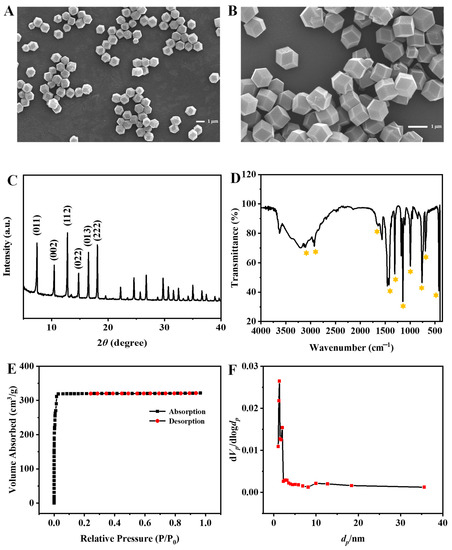
Figure 2.
SEM images (A,B), XRD spectrum (C), FT-IR spectrum (D) of ZIF-8, nitrogen adsorption-desorption isotherm (E) and pore-size distribution (F).
As shown in Figure S2, the mixture of 2-methylimidazole, ATCh, and DTNB shows a certain absorption at 405 nm. However, during the synthesis process of ZIF-8, the material will be washed twice with deionized water to remove the unreacted 2-methylimidazole, so its impact on the reaction can be ignored. In addition, the mixture of C4H6O4Zn∙2H2O, ATCh, and DTNB shows a negligible effect on the reaction as compared to the mixture of ZIF-8, ATCh, and DTNB. As shown in Figure 3A, the mixture of ZIF-8, ATCh, and DTNB shows an obvious absorption at 405 nm. When the Cu2+, ST, or GOX and glucose being added to the system, the relative activity of ZIF-8 is obviously weakened. The Cu2+ slows down the reaction due to its competitive binding with the intermediate TCh [19]. Furthermore, ST weakens the catalytic reaction of ZIF-8 by affecting its enzyme-like activity. In addition, GOX reacts with glucose to generate highly oxidizing H2O2, which can act with the intermediate TCh to reduce its reaction to DTNB. Therefore, these results indicate that this AChE-like activity is coming from ZIF-8, and the established method based on the AChE-like activity of ZIF-8 used for the Cu2+, ST, and glucose detection is practicable.
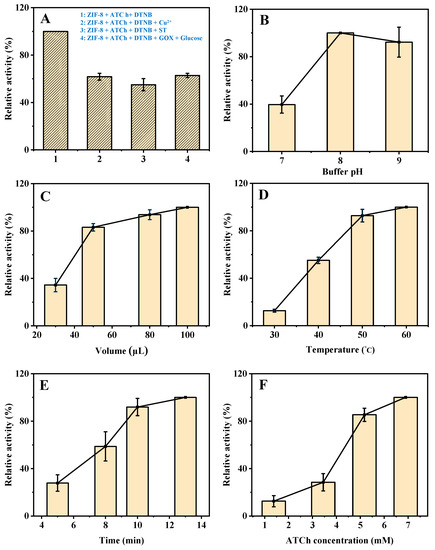
Figure 3.
The UV absorption (405 nm) of (A-1) ZIF-8 + ATCh + DTNB, (A-2) ZIF-8 + ATCh + DTNB + Cu2+, (A-3) ZIF-8 + ATCh + DTNB + ST, (A-4) ZIF-8 + ATCh + DTNB + GOX + glucose. Effects of buffer pH (B), the volume of ZIF-8 (C), reaction temperature (D), reaction time (E), and the concentration of ATCh (F) on the AChE-like activity of ZIF-8. Buffer pH, 8.0 for (A,C–F); the volume of ZIF-8, 30 µL for B, 80 µL for (A,D–F); reaction temperature, 40 °C for (B,C), 50 °C for (A,E,F); reaction time, 8 min for (B–D), 10 min for (A,F); ATCh concentration, 1.51 mM for (B–E), 5.17 mM for (A); Other conditions: DTNB concentration, 1.38 mM; centrifugation time, 2 min; GOX initial concentration, 2 mg/mL; Cu2+, 21.55 µM; ST, 344.83 µM; glucose, 0.17 mM.
2.2. Optimization of the Detection Conditions
In order to obtain a good sensitivity of the developed method for Cu2+, ST, and glucose detection, several experimental parameters were optimized, including buffer pH, the volume of ZIF-8, reaction temperature, reaction time, and the concentration of ATCh. As shown in Figure 3B, the catalytic activity of ZIF-8 changes with the buffer pH (from 7 to 9), and reaches the highest at pH 8, which was selected for the subsequent experiments (The maximum point in each curve was set as 100%).
Then, the effect of the volume of ZIF-8 was investigated. The catalytic activity increases with the increase in the volume of ZIF-8 from 30 to 100 µL (Figure 3C) but increases slowly from 50 µL and remains stable after 80 µL. Therefore, 80 µL was selected for the subsequent experiments. Furthermore, as shown in Figure 3D, the effect of reaction temperature on the catalytic activity of ZIF-8 was investigated. As the increase in reaction temperature from 30 to 60 °C, the catalytic activity keeps steady above 50 °C, which was selected as the optimum reaction temperature. In addition, the catalytic activity increases with the increase in reaction time (5, 8, 10, and 13 min), and increases slowly after 10 min (Figure 3E). Therefore, further experiments were performed for 10 min. Finally, the effect of the concentration of ATCh was investigated. The catalytic activity increases with the increase in ATCh concentration (1.40, 3.45, 5.17, and 6.90 mM), and increases slowly after 5.17 mM (Figure 3F). Therefore, 5.17 mM of substrate (ATCh) is enough for the reaction. In summary, the optimized reaction conditions for the detection of Cu2+, ST, and glucose based on the AChE-like activity of ZIF-8 are as follows. The buffer pH, volume of ZIF-8, reaction temperature, reaction time, and the concentration of ATCh are 8, 80 µL, 50 °C, 10 min, and 5.17 mM, respectively.
2.3. Kinetics Study and Stability of ZIF-8
The steady-state kinetic study for the AChE-like activity of ZIF-8 was performed. As shown in Figure 4A, a typical Lineweaver-Burk plot curve was obtained based on the different ATCh concentrations (0.17, 0.34, 0.69, 1.03, and 1.38 mM). Through Equation (1), the obtained linear regression equation of the Lineweaver-Burk plot is y = 0.4256x + 0.5099 and R2 = 0.9927, where x and y are the reciprocal of ATCh (substrate) concentration and reaction velocity (the absorbance of product), respectively. A smaller Km value indicates a stronger affinity between the enzyme and the substrate. The Km value of the AChE-like activity of ZIF-8 in this study (0.83 mM) is similar to that of natural AChE (0.23 mM) [20], which indicates that the ZIF-8 has a good affinity toward ATCh and exhibits excellent AChE-like catalytic activity. In addition, a batch of ZIF-8 was synthesized and kept at room temperature for 30 days under dry conditions. The relative AChE-like activity of ZIF-8 maintains more than 80.0% of its initial activity after 30 days of storage, and the relative standard deviation (RSD) of batch-to-batch (n = 3) is 5.1%, indicating that the synthesized ZIF-8 is stable (Figure 4B).
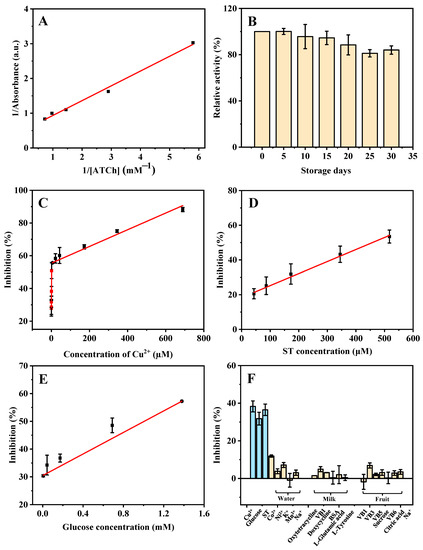
Figure 4.
Double reciprocal plot (A) and storage stability (B) of the ZIF-8 catalyzed activity. The linear range of Cu2+ (C), ST (D), and glucose (E), and the selectivity (F) for the detection of Cu2+, ST, and glucose based on the AChE-like activity of ZIF-8 under the optimized conditions. ATCh concentrations are from 0.17 to 1.40 mM for (A). Cu2+ concentrations are from 0.021 to 689.66 µM for (C). ST concentrations are from 43.10 to 517.24 µM for (D). Glucose concentrations are from 0.0054 to 1.40 mM for (E). Cu2+, ST, and glucose concentrations are 0.67 µM, 172.41 µM, and 0.043 mM, respectively; other possible ions in lake water (Co2+, Ni2+, K+, Mn2+, Na+) are 344.82 µM; other possible substances in milk (oxytetracycline, doxycycline, VB1, L-glutamic acid, BSA, and L-tyrosine) are 172.41 µM; other possible substances in strawberry (VB1, VB3, VB5, VB6, sucrose, citric acid, and Na+) are 344.83 µM for (F). Other conditions: buffer pH, 8; the volume of ZIF-8, 80 µL; reaction temperature, 50 °C; reaction time, 10 min; ATCh concentration, 5.17 mM; DTNB concentration, 1.38 mM.
2.4. Colorimetric Detection of Cu2+, ST, and Glucose
In Figure 4C, based on the AChE-like activity of ZIF-8, with the increase in concentration of Cu2+, the absorbance at 405 nm is decreased because the inhibition rate of ZIF-8 activity is increased. Good linear dependence is obtained in the ranges of 0.021–1.34 µM (calibration curve: y = 16.3204x + 28.0815, R2 = 0.9884), and 5.38–689.66 µM (y = 0.05109x + 55.4258, R2 = 0.9904). The LOD is calculated based on 3σ/s, where σ is the standard deviation of the blank signal (n = 11) and s is the slope of the regression line. The LOD is calculated to be 20.00 nM. As shown in Figure 4D, good linear dependence is obtained based on the AChE-like activity of ZIF-8 for the ST detection in the range of 43.10–517.24 µM (calibration curve: y = 0.06929x + 18.2985, R2 = 0.9953), and the LOD is calculated to be 9.25 µM. In addition, a linear equation for the detection of glucose is obtained in the range of 0.0054–1.40 mM (calibration curve: y = 19.4178x + 30.4700, R2 = 0.9987). The LOD is calculated to be 5.24 µM (Figure 4E). As compared with previous studies (Table 1, Table 2 and Table 3), most of the reported methods require a long time for the synthesis of materials, or a high temperature, and many organic reagents, which is not cost-effective and environmentally friendly. The developed method in this study for the detection of Cu2+, ST, and glucose shows some advantages, such as simplicity of the material synthesis process, high efficiency, low LOD, and wide linear range.

Table 1.
Comparison of the previously reported methods and present work for the detection of Cu2+.
Table 2.
Comparison of the previously reported methods and present work for the detection of ST.
Table 3.
Comparison of the previously reported methods and present work for the detection of glucose.
For the purpose of assessing the selectivity of the sensing system for Cu2+, ST, and glucose detection, some potential interfering substances, including amino acids, small biomolecules, and common ions, were systematically investigated in their effects on the detection. As shown in Figure 4F, the potential substances in the lake water samples (detection of Cu2+) such as Co2+, Ni2+, K+, Mn2+, and Na+, the potential substances in the milk sample (detection of ST) such as oxytetracycline, VB1, doxycycline, BSA, L-glutamic acid, and L-tyrosine, the potential substances in fruit sample (detection of glucose) such as VB1, VB3, VB5, VB6, sucrose, citric acid, and Na+, were investigated. The results indicate that only Cu2+, ST, and glucose have obvious effects on the AChE-like activity of ZIF-8, indicating that the sensor has a high specificity for the detection of Cu2+, ST, and glucose.
2.5. Detection of Cu2+, ST, and Glucose in Real Samples
To evaluate the practical application of this sensing platform, the real samples were analyzed on the basis of the standard addition method. As shown in Table 4, the established method was used for the detection of Cu2+, ST, and glucose in the lake water, milk, and strawberry samples. A standard addition method was adopted by adding Cu2+ into the lake water samples to reach the final concentrations of 0.084, 21.55, and 172.41 µM, and the sample spiked recoveries are within the range of 81.4–112.8% with the RSD (n = 3) lower than 8.1%. Furthermore, the ST was added into the milk sample with the final concentrations of 43.10, 86.21, and 172.41 µM, and analyzed by the developed method, the sample spiked recoveries are in the range of 98.4–115.4% with the RSD lower than 3.3%. Finally, standard addition of glucose to the strawberry sample with the final concentration of 0.086, 0.17, and 0.34 mM was performed, the sample spiked recoveries are in the range of 93.0–112.8% with the RSD lower than 1.8%. These results indicate that the developed method has good analytical performance and can be applied in the real sample analysis. In addition, this Cu2+, ST, and glucose sensor shows reasonable repeatability and reliability for their low RSD% value.
Table 4.
Determination of Cu2+, ST, and glucose in lake water, milk, and fruit samples, respectively.
3. Materials and Methods
3.1. Chemicals and Materials
Potassium chloride (KCl), sodium phosphate dibasic dihydrate (NaH2PO4∙2H2O), and sodium chloride (NaCl) were purchased from Chengdu Chron Chemicals Co., Ltd. (Chengdu, China). Copper (II) sulfate pentahydrate (CuSO4·5H2O) was purchased from Chongqing Chuandong Chemical Group Co., Ltd. (Chongqing, China). D (+)-glucose, 2-methylimidazole, vitamin B1 (VB1), vitamin B6 (VB6), vitamin B3 (VB3), vitamin B5 (VB5), ST, and ATCh (≥99%) were purchased from Shanghai YuanYe Biological Technology Co., Ltd. (Shanghai, China). DTNB, GOX, and zinc acetate dihydrate (C4H6O4Zn∙2H2O) were purchased from Macklin (Shanghai, China). L (+)-Glutamic acid and manganese chloride (MnCl2∙4H2O) were purchased from Shanghai Aladdin Biochemical Technology Co., Ltd. (Shanghai, China). L-tyrosine was purchased from Chengdu Huaxia Chemical Reagent Co., Ltd. (Chengdu, China). Bovine serum albumin (BSA) was purchased from Sangon Biotech Co., Ltd. (Shanghai, China). All the chemicals are analytical grade and deposited at the Pharmaceutical Engineering Laboratory of School of Chemistry and Chemical Engineering, Chongqing University (Chongqing, China). The milk sample was purchased from Chongqing Tianyou Dairy Co., Ltd. (Chongqing, China). The real water samples were obtained from the YUN and JIN lakes of Chongqing University (Chongqing, China). Strawberry was purchased from Chongqing New Century Department Store (Chongqing, China).
3.2. Instruments
For the characterization of material, the SEM images were obtained through a field-emission SEM (JSM-7600F, JEOL Ltd., Tokyo, Japan); The XRD pattern was obtained using a X’ pert Powder diffractometer (Malvern Panalytical Ltd., Malvern, The Netherlands) with secondary beam graphite monochromated Cu Kα radiation; The FT-TR pattern was obtained through a Nicolet iS50 (Thermo Scientific Inc., Waltham, MA, USA); And the BET studies were performed on a Quadrasorb 2 MP (Kantar, New York, NY, USA) specific surface and aperture analyzer. The ultrapure water used for all experiments was purified by a water purification system (ATSelem 1820A, Antesheng Environmental Protection Equipment, Chongqing, China). The UV-Vis analysis was performed on a UV-5500 PC spectrophotometer (Shanghai Metash Instruments Co., Ltd., Shanghai, China). A tabletop low-speed centrifuge L420 was purchased from Hunan Xiang Yi Laboratory Instrument Development Co., Ltd. (Changsha, China).
3.3. Synthesis of ZIF-8
The ZIF-8 was synthesized according to the previously reported method [41]. Firstly, the mixture solution of 4 mL of C4H6O4Zn∙2H2O (0.40 M) and 40 mL of 2-methylimidazole (0.80 M) was placed in an oven and reacted at 30 °C for 2 h. The obtained ZIF-8 was purified by centrifugation for 5 min at 3800 rpm (2259× g) and rinsed with ultra-pure water twice. Finally, the prepared ZIF-8 was re-suspended in 8 mL of deionized water and stored in a 4 °C refrigerator.
3.4. ZIF-8 Activity Assays
ZIF-8 can catalyze ATCh to TCh, which will further react with DTNB to generate TNB that has a maximum absorption peak at 405 nm. In a 0.5 mL centrifuge tube, 80 μL of ZIF-8 (dispersed in deionized water), 100 μL of PBS (prepared in 10.00 mM of phosphate buffer, pH 8), 200 μL of 5.17 mM ATCh (prepared in 10.00 mM phosphate buffer, pH 8), and 200 μL of 1.38 mM DTNB (prepared in ethanol) were mixed together, and then incubated at 50 °C with shaken at 160 rpm for 10 min. After being centrifuged by a handheld mini centrifuge for 2 min, the absorbance of the supernatant at 405 nm was recorded. Each sample was measured three times.
3.5. Enzyme Kinetics
The Km is an important parameter of an enzyme kinetic reaction and reflects the affinity between the enzyme and substrate, which can be calculated by the Lineweaver-Burk Equation (1) [42].
where V and Vmax are the initial and maximum rate of the enzyme reaction, respectively, [S] is the concentration of the substrate (ATCh), and Km is the Michaelis-Menten constant. The initial velocity of ZIF-8 was monitored by the absorbance of the product (TNB). Experiments were carried out by altering the concentration of ATCh (0.17, 0.34, 0.69, 1.03, and 1.40 mM) under optimized conditions.
3.6. Procedure for Cu2+, ST, and Glucose Determination
Based on the AChE-like activity of ZIF-8, a facile colorimetric method for Cu2+, ST, and glucose detection was developed. For the detection of Cu2+, 80 μL of ZIF-8, 100 μL of different concentrations of Cu2+ (0.021, 0.042, 0.17, 0.67, 1.35, 5.39, 21.55, 43.10, 172.41, 344.83, and 689.66 µM), 200 μL of 5.17 mM ATCh (prepared in 10.00 mM phosphate buffer, pH 8), and 200 μL of 1.38 mM DTNB (prepared in ethanol) were mixed together into a 0.5 mL centrifuge tube, and then incubated at 50 °C with shaken at 160 rpm for 10 min, respectively. For the detection of ST, 80 μL of ZIF-8, 100 μL of different concentrations of ST (43.10, 86.21, 172.41, 344.83, and 517.24 µM), 200 μL of 5.17 mM ATCh (prepared in 10.00 mM phosphate buffer, pH 8), and 200 μL of 1.38 mM DTNB (prepared in ethanol) were mixed together into a 0.5 mL centrifuge tube, and then incubated at 50 °C with shaken at 160 rpm for 10 min, respectively. For the detection of glucose, 80 μL of ZIF-8, 50 μL of different concentrations of glucose (0.0054, 0.043, 0.17, 0.69, and 1.40 mM), 50 μL of GOX (initial concentration of 2 mg/mL), 200 μL of 5.17 mM ATCh (prepared in 10.00 mM phosphate buffer, pH 8), and 200 μL of 1.38 mM DTNB (prepared in ethanol) were mixed together into a 0.5 mL centrifuge tube, and then incubated at 50 °C with shaken at 160 rpm for 10 min, respectively. The absorbance at 405 nm of the mixture supernatant was recorded. Each sample was measured three times.
3.7. Real Sample Analysis
To validate its feasibility and practicability, the method based on the AChE-like activity of ZIF-8 was used to detect the Cu2+, ST, and glucose in lake water, milk, and strawberry samples, respectively. (1) For the Cu2+ detection, 80 μL of ZIF-8, 100 μL of different concentrations of Cu2+ (final concentrations of 0.084, 21.55, and 172.41 μM) spiked lake water, 200 μL of 5.17 mM ATCh (prepared in 10.00 mM phosphate buffer, pH 8), and 200 μL of 1.38 mM DTNB (prepared in ethanol) were mixed together into a 0.5 mL centrifuge tube, and then incubated at 50 °C with shaken at 160 rpm for 10 min, respectively. (2) For the ST detection, 80 μL of ZIF-8, 100 μL of different concentrations of ST (final concentrations of 43.10, 86.21, and 172.41 μM) spiked milk sample, 200 μL of 5.17 mM ATCh (prepared in 10.00 mM phosphate buffer, pH 8), and 200 μL of 1.38 mM DTNB (prepared in ethanol) were mixed together into a 0.5 mL centrifuge tube, and then incubated at 50 °C with shaken at 160 rpm for 10 min, respectively. (3) For the glucose detection, in a 0.5 mL centrifuge tube, 80 μL of ZIF-8, 50 μL of GOX (initial concentration of 2 mg/mL), 50 μL of different concentrations of glucose (final concentrations of 0.086, 0.17, and 0.34 mM) spiked strawberry sample, 200 μL of 5.17 mM ATCh (prepared in 10.00 mM phosphate buffer, pH 8), and 200 μL of 1.38 mM DTNB (prepared in ethanol) were mixed well, and then incubated at 50 °C with shaken at 160 rpm for 10 min, respectively. The absorbance at 405 nm of the mixture supernatant was recorded. The spiked recoveries in lake water, milk, and strawberry samples of Cu2+, ST, and glucose were calculated by the linear relationship between the inhibition rates and their concentrations, respectively.
4. Conclusions
In summary, the AChE-like activity of ZIF-8 was successfully applied in the sensitive detection of Cu2+, ST, and glucose. ZIF-8 has high AChE activity and shows good affinity to the substrate, which also has good storage stability. As compared with the other methods, this method has the advantages of a low LOD and wide detection range, which has the potential as a convenient method for the rapid and sensitive detection of Cu2+, ST, and glucose. Moreover, the ZIF-8 is of high stability, and low cost, which can be synthesized through a simple method under mild conditions. In addition, ZIF-8 has a series of enzyme-like activities, which can be further applied in the analysis of different analytes. In short, this study provides a feasible detection method for Cu2+, ST, and glucose, which may be applied in monitoring their levels in some health problems, such as Alzheimer’s disease, Menke’s disease, Wilson’s disease, resistance to antibiotics, allergic reactions, and toxic effects, and Diabetes.
Supplementary Materials
The following supporting information can be downloaded at: https://www.mdpi.com/article/10.3390/molecules27217491/s1, Figure S1: Structures of AChE and ZIF-8; Figure S2: The UV absorption (405 nm) of (1) 2-methylimidazole + ATCh + DTNB, (2) C4H6O4Zn∙2H2O + ATCh + DTNB, (3) ZIF-8 + DTNB, (4) ZIF-8 + ATCh + DTNB. Buffer pH, 8.0; the volume of ZIF-8, 80 µL; reaction temperature, 50 °C; ATCh concentration, 5.17 mM; DTNB concentration, 1.38 mM; centrifugation time, 2 min; 2-methylimidazole concentration, 17.2 mM; C4H6O4Zn∙2H2O concentration, 17.2 mM.
Author Contributions
G.-Y.C.: Conceptualization, Methodology, Investigation, Writing-Original Draft. Z.-M.Q.: Methodology, Funding acquisition. S.-J.Y.: Investigation. X.Z.: Investigation. F.-Q.Y.: Supervision, Project administration, Funding acquisition. All authors have read and agreed to the published version of the manuscript.
Funding
This work was supported by the National Key Research and Development Program of China (No. 2021YFC2103300).
Institutional Review Board Statement
Not applicable.
Informed Consent Statement
Not applicable.
Data Availability Statement
The data presented in this study are contained within the article.
Conflicts of Interest
All the authors declare that they have no conflict of interest.
Sample Availability
Samples of the compounds are available from the authors.
References
- Chen, W.; Vázquez-González, M.; Kozell, A.; Cecconello, A.; Willner, I. Cu2+-modified metal-organic framework nanoparticles: A peroxidase-mimicking nanoenzyme. Small 2018, 14, 1703149. [Google Scholar] [CrossRef] [PubMed]
- Dai, Z.; Liu, S.; Bao, J.; Ju, H. Nanostructured FeS as a mimic peroxidase for biocatalysis and biosensing. Chem.-Eur. J. 2009, 15, 4321–4326. [Google Scholar] [CrossRef] [PubMed]
- Zhang, D.; Han, Q.; Liu, W.; Xu, K.; Shao, M.; Li, Y.; Du, P.; Zhang, Z.; Liu, B.; Zhang, L.; et al. Au-decorated N-rich carbon dots as peroxidase mimics for the detection of acetylcholinesterase activity. ACS Appl. Nano Mater. 2022, 5, 1958–1965. [Google Scholar] [CrossRef]
- Niu, X.; Li, X.; Lyu, Z.; Pan, J.; Ding, S.; Ruan, X.; Zhu, W.; Du, D.; Lin, Y. Metal-organic framework based nanozymes: Promising materials for biochemical analysis. Chem. Commun. 2020, 56, 11338–11353. [Google Scholar] [CrossRef] [PubMed]
- He, L.; Li, Y.; Wu, Q.; Wang, D.M.; Li, C.M.; Huang, C.Z.; Li, Y.F. Ru (III)-based metal-organic gels: Intrinsic horseradish and NADH peroxidase-mimicking nanozyme. ACS Appl. Mater. Inter. 2019, 11, 29158–29166. [Google Scholar] [CrossRef]
- Sun, S.; Wang, F.; Sun, Y.; Guo, X.; Ma, R.; Zhang, M.; Guo, H.; Xie, Y.; Hu, T. Construction of a dual-function metal-organic framework: Detection of Fe3+, Cu2+, nitroaromatic explosives, and a high second-harmonic generation response. Ind. Eng. Chem. Res. 2019, 58, 17784–17791. [Google Scholar] [CrossRef]
- Kaur, G.; Verma, N. Colorimetric determination of Cu2+ ions in water and milk by apo-tyrosinase disc. Sens. Actuator B-Chem. 2018, 263, 524–532. [Google Scholar] [CrossRef]
- Park, Y.; Lee, C.Y.; Park, K.S.; Park, H.G. Enzyme-free colorimetric detection of Cu2+ by utilizing target-triggered DNAzymes and toehold-mediated DNA strand displacement events. Chem.-Eur. J. 2017, 23, 17379–17383. [Google Scholar] [CrossRef]
- Huangfu, C.X.; Zhang, Y.; Jang, M.; Feng, L. A mu PAD for simultaneous monitoring of Cu2+, Fe2+ and free chlorine in drinking water. Sens. Actuator B-Chem. 2019, 293, 350–356. [Google Scholar] [CrossRef]
- Alipanahpour Dil, E.; Ghaedi, M.; Mehrabi, F.; Tayebi, L. Highly selective magnetic dual template molecularly imprinted polymer for simultaneous enrichment of sulfadiazine and sulfathiazole from milk samples based on syringe-to-syringe magnetic solid-phase microextraction. Talanta 2021, 232, 122449. [Google Scholar] [CrossRef]
- Ait Lahcen, A.; Amine, A. Mini-review: Recent advances in electrochemical determination of sulfonamides. Anal. Lett. 2018, 51, 424–441. [Google Scholar] [CrossRef]
- Galant, A.L.; Kaufman, R.C.; Wilson, J.D. Glucose: Detection and analysis. Food Chem. 2015, 188, 149–160. [Google Scholar] [CrossRef] [PubMed]
- Zhang, H.; Li, X.; Qian, Z.M.; Wang, S.; Yang, F.Q. Glucose oxidase-mediated sodium alginate gelation: Equipment-Free detection of glucose in fruit samples. Enzyme Microb Technol. 2021, 148, 109805. [Google Scholar] [CrossRef] [PubMed]
- Li, Y.; Xie, M.; Zhang, X.; Liu, Q.; Lin, D.; Xu, C.; Xie, F.; Sun, X. Co-MOF nanosheet array: A high-performance electrochemical sensor for non-enzymatic glucose detection. Sens. Actuator B-Chem. 2019, 278, 126–132. [Google Scholar] [CrossRef]
- Radic, Z.; Gibney, G.; Kawamoto, S.; MacPhee-Quigley, K.; Bongiorno, C.; Taylor, P. Expression of recombinant acetylcholinesterase in a baculovirus system: Kinetic properties of glutamate 199 mutants. Biochemistry 1992, 31, 9760–9767. [Google Scholar] [CrossRef]
- Işık, M.; Akocak, S.; Lolak, N.; Taslimi, P.; Türkeş, C.; Gülçin, I.; Durgun, M.; Beydemir, S. Synthesis, characterization, biological evaluation, and in silico studies of novel 1,3-diaryltriazene-substituted sulfathiazole derivatives. Arch. Pharm. 2020, 353, 2000102. [Google Scholar] [CrossRef]
- Joo, D.H.; Mok, J.S.; Bae, G.H.; Oh, S.E.; Kang, J.H.; Kim, C. Colorimetric detection of Cu2+ and fluorescent detection of PO43− and S2− by a multifunctional chemosensor. Ind. Eng. Chem. Res. 2017, 56, 8399–8407. [Google Scholar] [CrossRef]
- Chen, J.; Wang, G.; Su, X. Fabrication of red-emissive ZIF-8@QDs nanoprobe with improved fluorescence based on assembly strategy for enhanced biosensing. Sens. Actuator B-Chem. 2022, 368, 132188. [Google Scholar] [CrossRef]
- Zhang, P.; Fu, C.; Xiao, Y.; Zhang, Q.; Ding, C. Copper (II) complex as a turn on fluorescent sensing platform for acetylcholinesterase activity with high sensitivity. Talanta 2020, 208, 120406. [Google Scholar] [CrossRef]
- Zang, L.Y.; Misra, H.P. Inactivation of acetylcholinesterase by 1-methyl-4-phenyl-1,2,3,6-tetrahydropyridine hydrochloride. Mol. Cell. Biochem. 2003, 254, 131–136. [Google Scholar] [CrossRef]
- Geng, R.; Tang, H.; Ma, Q.; Liu, L.; Feng, W.; Zhang, Z. Bimetallic Ag/Zn-ZIF-8: An efficient and sensitive probe for Fe3+ and Cu2+ detection. Colloid Surf. A-Physicochem. Eng. Asp. 2022, 632, 127755. [Google Scholar] [CrossRef]
- Lv, J.; Zhang, C.; Wang, S.; Li, M.; Guo, W. MOF-derived porous ZnO-Co3O4 nanocages as peroxidase mimics for colorimetric detection of copper (ii) ions in serum. Analyst 2021, 146, 605–611. [Google Scholar] [CrossRef] [PubMed]
- Wu, X.; Gong, X.; Dong, W.; Ma, J.; Chao, J.; Li, C.; Wang, L.; Dong, C. A novel fluorescein-based colorimetric probe for Cu2+ detection. RSC Adv. 2016, 6, 59677–59683. [Google Scholar] [CrossRef]
- Li, T.; Yang, Z.; Li, Y.; Liu, Z.; Qi, G.; Wang, B. A novel fluorescein derivative as a colorimetric chemosensor for detecting copper (II) ion. Dyes Pigments. 2011, 88, 103–108. [Google Scholar] [CrossRef]
- Ye, Y.; Zhang, Q.; Wang, F.; Li, Y.; Gao, F.; Zhang, Y. Cu2+ catalyzed and H2O2-facilitated oxidation strategy for sensing copper (ii) based on cysteine-mediated aggregation of gold nanoparticles. RSC Adv. 2017, 7, 55620–55625. [Google Scholar] [CrossRef]
- Yu, C.; Zhang, D.; Zhu, Q.; Chao, D.; Liu, H.; Zhou, L. Preparation and characterisation of dual sensing carbon dots for water and Cu2+ detection. Dyes Pigments. 2022, 198, 110008. [Google Scholar] [CrossRef]
- Rasheed, T.; Nabeel, F.; Shafi, S. Chromogenic vesicles for aqueous detection and quantification of Hg2+/Cu2+ in real water samples. J. Mol. Liq. 2019, 282, 489–498. [Google Scholar] [CrossRef]
- Sun, M.; Huang, S.; Su, G.; Wang, X.; Lu, Z.; Wang, Y.; Liu, T.; Jiang, Y.; Song, C.; Rao, H. Synthesis of pH-switchable Pt/Co3O4 nanoflowers: Catalytic mechanism, four-enzyme activity and smartphone biosensing applications. Chem. Eng. J. 2022, 437, 134414. [Google Scholar] [CrossRef]
- Carolina Rafanhin Sousa, A.; Nascimento Makara, C.; Canniatti Brazaca, L.; Carrilho, E. A colorimetric microfluidic paper-based analytical device for sulfonamides in cow milk using enzymatic inhibition. Food Chem. 2021, 356, 129692. [Google Scholar] [CrossRef]
- Xu, L.; Wu, R.; Geng, X.; Zhu, X.; Xiong, Y.; Chen, T.; Ai, S. Rapid detection of sulfonamide antibiotics residues in swine urine by surface-enhanced Raman spectroscopy. Spectroc. Acta Pt. A-Molec. Biomolec. Spectr. 2022, 267, 120570. [Google Scholar] [CrossRef]
- Sadeghi, S.; Oliaei, S. Microextraction of sulfathiazole from milk and honey samples using a polymeric ionic liquid membrane followed by fluorometric determination. J. Food Compos. Anal. 2021, 97, 103774. [Google Scholar] [CrossRef]
- Zotou, A.; Vasiliadou, C. LC of sulfonamide residues in poultry muscle and eggs extracts using fluorescence pre-column derivatization and monolithic silica column. J. Sep. Sci. 2010, 33, 11–22. [Google Scholar] [CrossRef] [PubMed]
- Sun, Y.; Gao, H.; Xu, L.; Waterhouse, G.I.N.; Zhang, H.; Qiao, X.; Xu, Z. Ultrasensitive determination of sulfathiazole using a molecularly imprinted electrochemical sensor with CuS microflowers as an electron transfer probe and Au@COF for signal amplification. Food Chem. 2020, 332, 127376. [Google Scholar] [CrossRef] [PubMed]
- Li, Z.B.; Liu, J.X.; Wang, Z.H.; Wang, J.P. Determination of sulfonamides in meat with dummy-template molecularly imprinted polymer-based chemiluminescence sensor. Anal. Bioanal. Chem. 2019, 411, 3179–3189. [Google Scholar] [CrossRef] [PubMed]
- Jiang, S.; Zhang, Y.; Yang, Y.; Huang, Y.; Ma, G.; Luo, Y.; Huang, P.; Lin, J. Glucose Oxidase-Instructed Fluorescence Amplification Strategy for Intracellular Glucose Detection. ACS Appl. Mater. Inter. 2019, 11, 10554–10558. [Google Scholar] [CrossRef] [PubMed]
- Tian, K.; Liu, H.; Dong, Y.; Chu, X.; Wang, S. Amperometric detection of glucose based on immobilizing glucose oxidase on g-C3N4 nanosheets. Colloid Surf. A-Physicochem. Eng. Asp. 2019, 581, 123808. [Google Scholar] [CrossRef]
- Kong, T.; Chen, Y.; Ye, Y.; Zhang, K.; Wang, Z.; Wang, X. An amperometric glucose biosensor based on the immobilization of glucose oxidase on the ZnO nanotubes. Sens. Actuator B-Chem. 2009, 138, 344–350. [Google Scholar] [CrossRef]
- Chen, B.; Wu, X.; Xiong, J.; Zong, M.; Cheng, J.; Ge, J.; Lou, W. Biomimetic mineralization of prussian blue analogue-incorporated glucose oxidase hybrid catalyst for glucose detection. Catal. Lett. 2022, 152, 689–698. [Google Scholar] [CrossRef]
- Ma, Z.; Ma, Y.; Liu, B.; Xu, L.; Jiao, H. A high-performance Co-MOF non-enzymatic electrochemical sensor for glucose detection. N. J. Chem. 2021, 45, 21350–21358. [Google Scholar] [CrossRef]
- Ji, W.; Shen, C.; Xi, X.; Tang, W.; Wu, D.; Su, Y.; Liu, R. Batch-producible fibrous microelectrodes for enzyme-free electrochemical detection of glucose. J. Mater. Sci.-Mater. Electron. 2022, 33, 11511–11522. [Google Scholar] [CrossRef]
- Chen, G.Y.; Zhou, X.; Tian, T.; Zhang, C.Y.; Yin, S.J.; Chen, H.; Xu, Y.; Yang, F.Q. Nanozyme based on ZIF-8 for the colorimetric detection of sulfonamides in cow milk. Anal. Biochem. 2022, 652, 114748. [Google Scholar] [CrossRef] [PubMed]
- Chen, G.Y.; Zhang, H.; Zhang, C.P.; Zhang, C.Y.; Wang, Y.; Chen, H.; Yang, F.Q. On-line immobilized acetylcholinesterase microreactor based on capillary electrophoresis for the determination of organophosphorus pesticide residues. Chin. J. Anal. Chem. 2021, 49, 11–17. [Google Scholar] [CrossRef]


Publisher’s Note: MDPI stays neutral with regard to jurisdictional claims in published maps and institutional affiliations. |
© 2022 by the authors. Licensee MDPI, Basel, Switzerland. This article is an open access article distributed under the terms and conditions of the Creative Commons Attribution (CC BY) license (https://creativecommons.org/licenses/by/4.0/).