
Volatile Profiling of Magnolia champaca Accessions by Gas Chromatography Mass Spectrometry Coupled with Chemometrics

 ,
,  , ,
, ,  ,
,
Abstract
1. Introduction
2. Results and Discussion
2.1. Essential Oil Yield
2.2. Essential Oil Composition
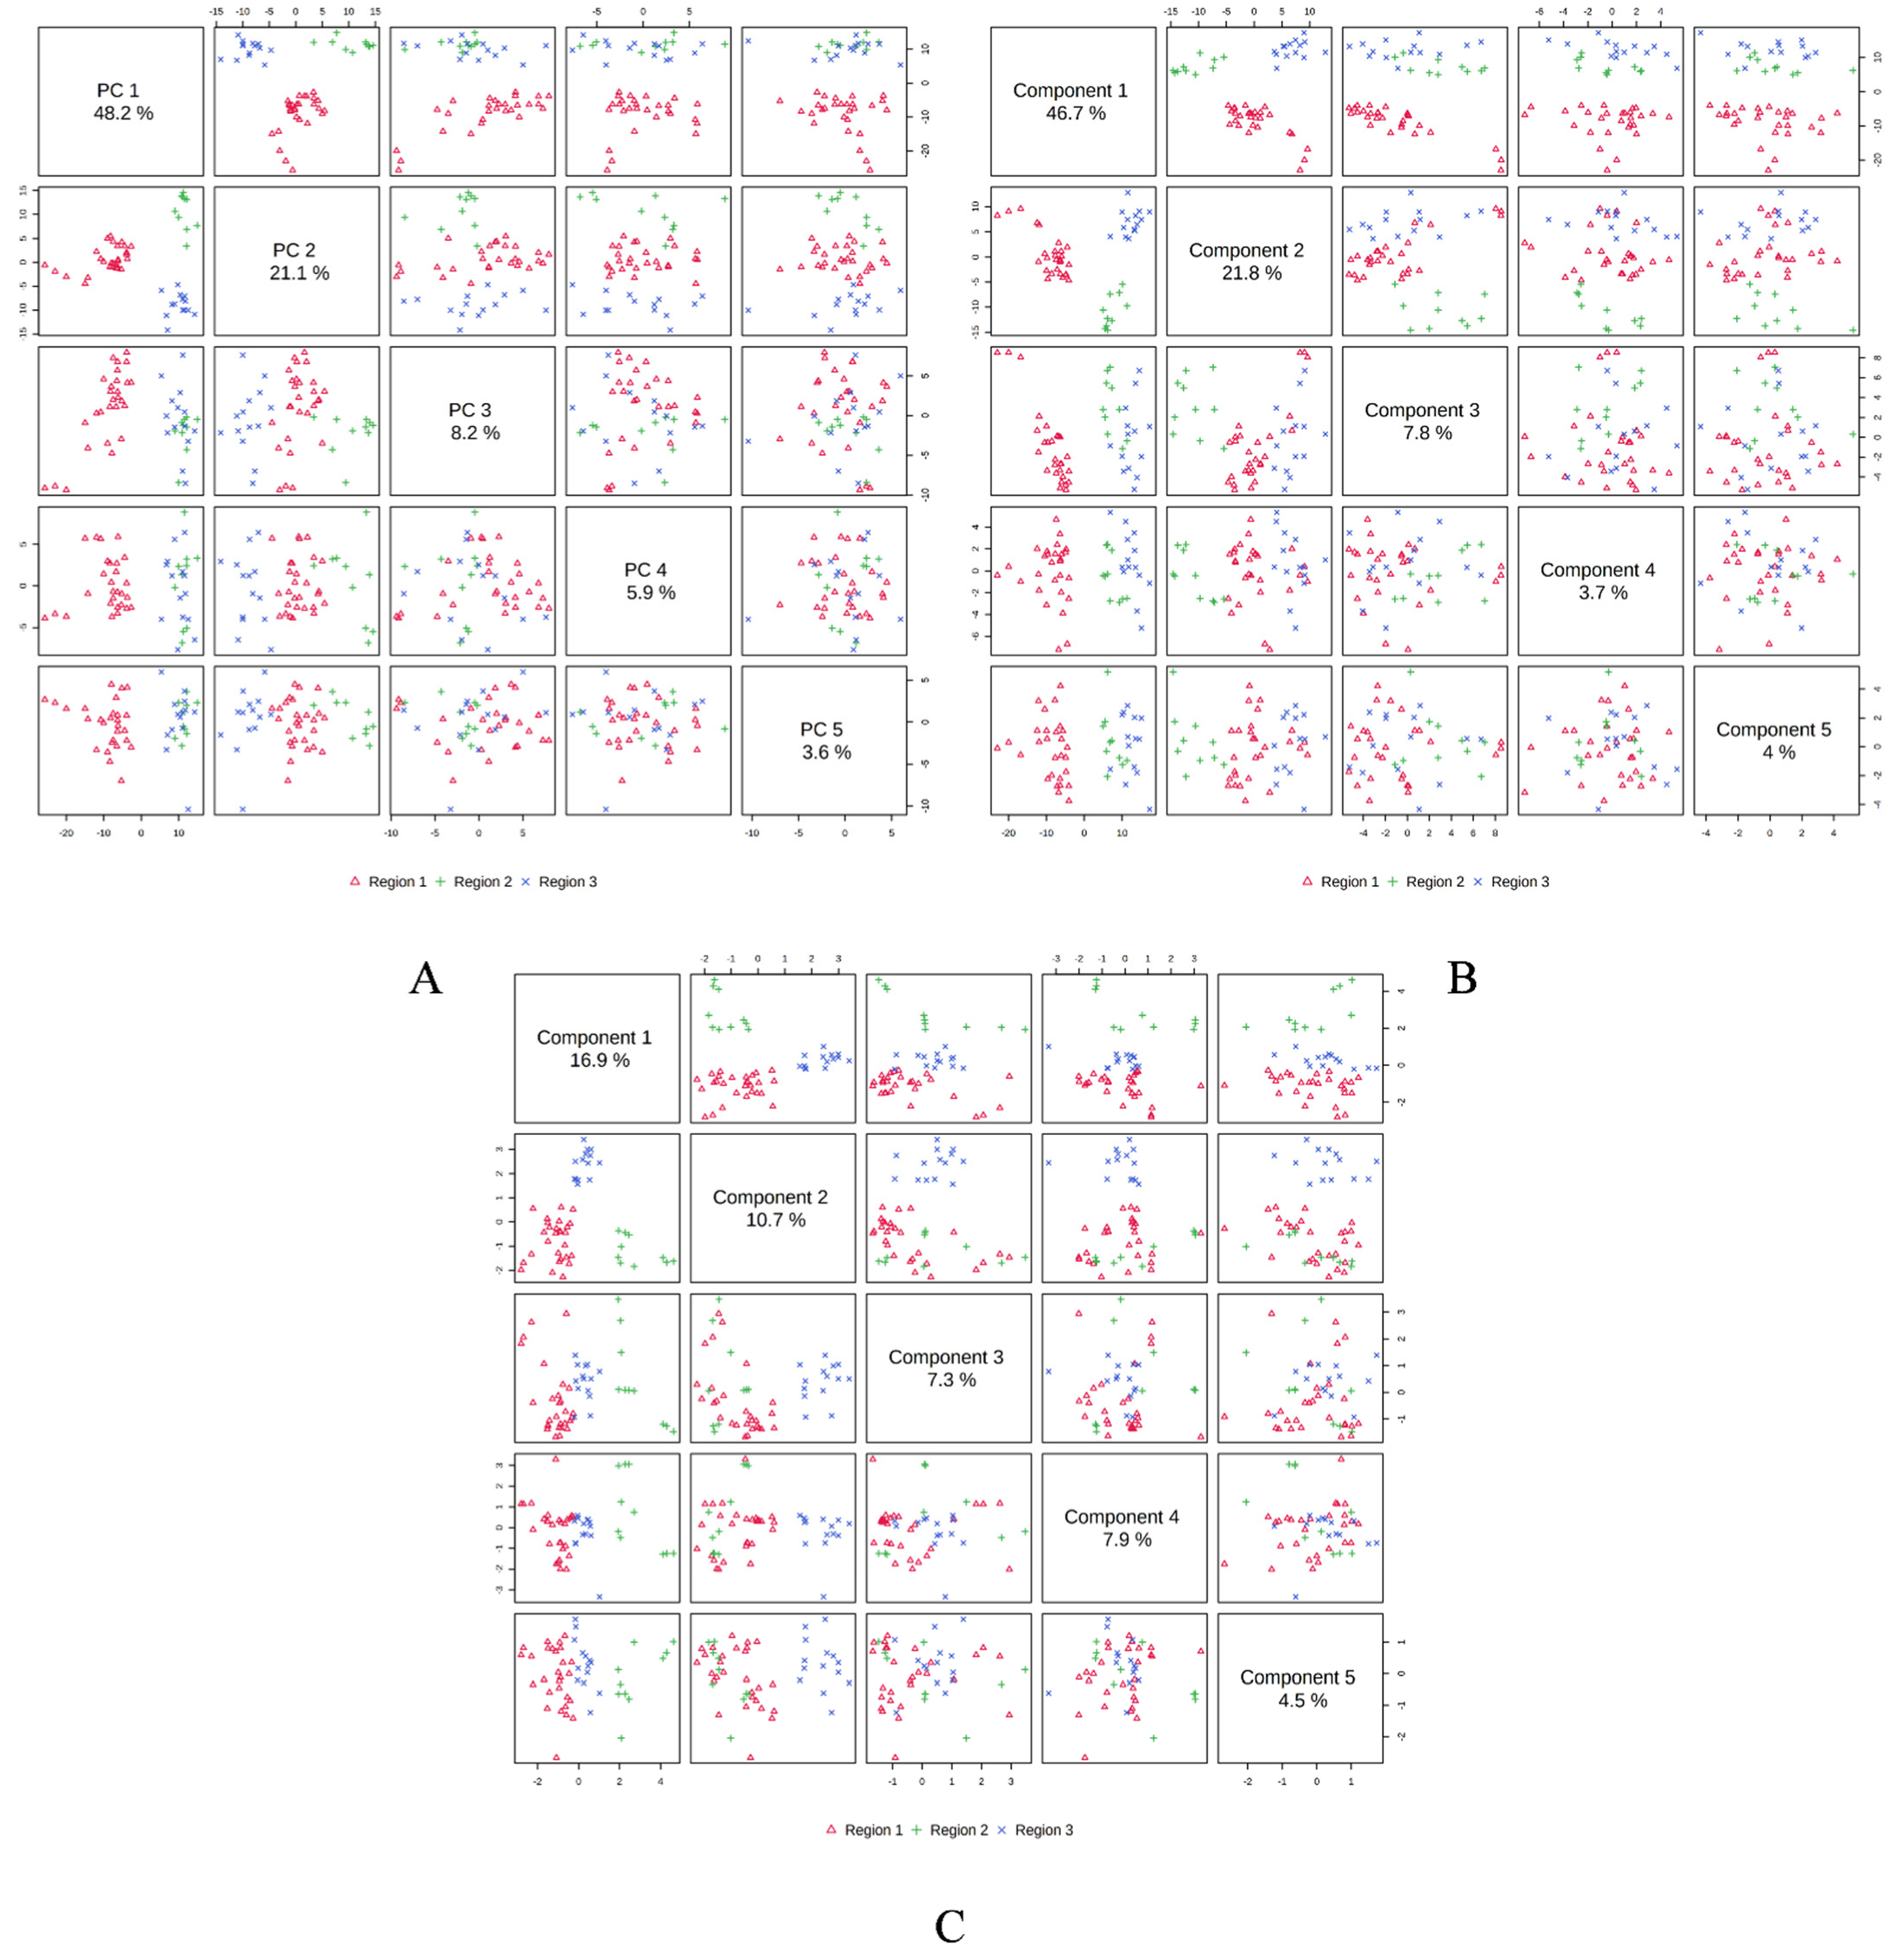
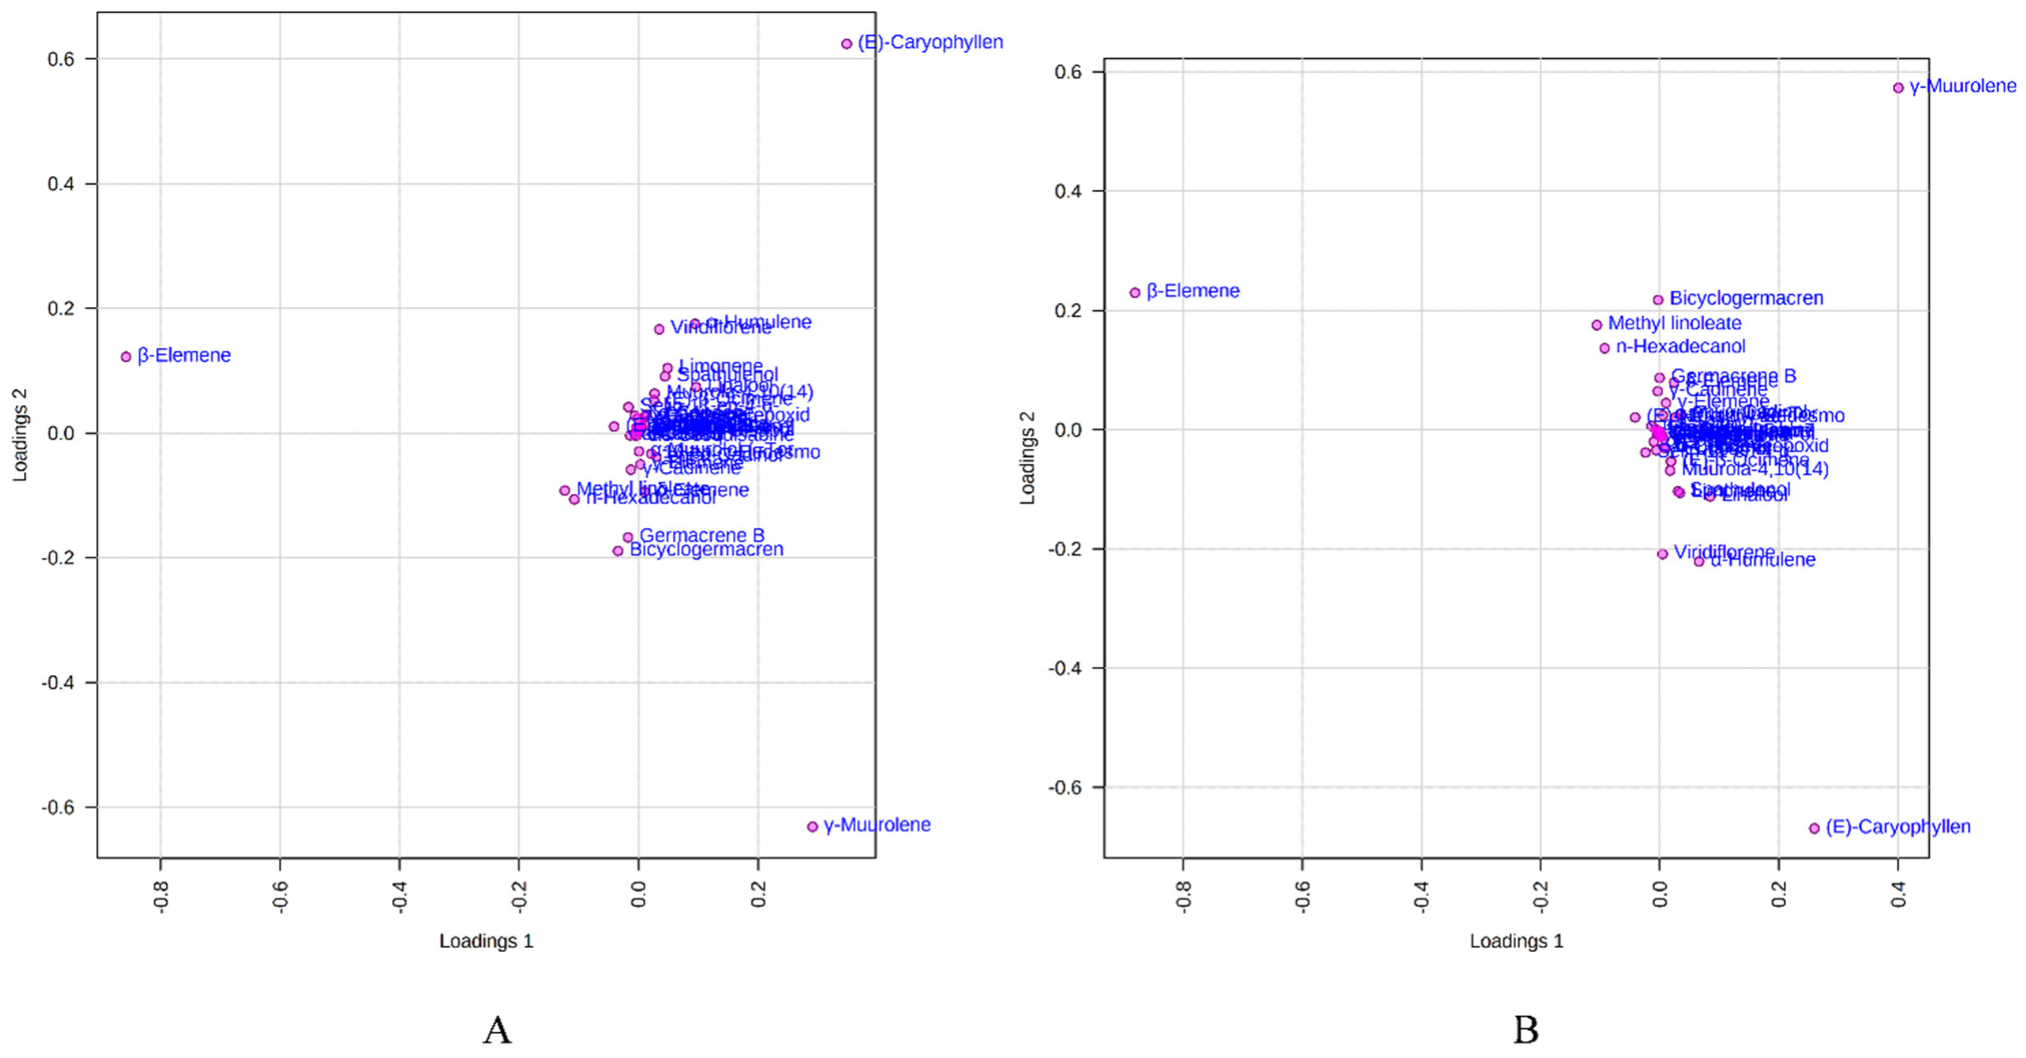
2.3. Multivariate Analysis of phytoconstituents
3. Materials and Methods
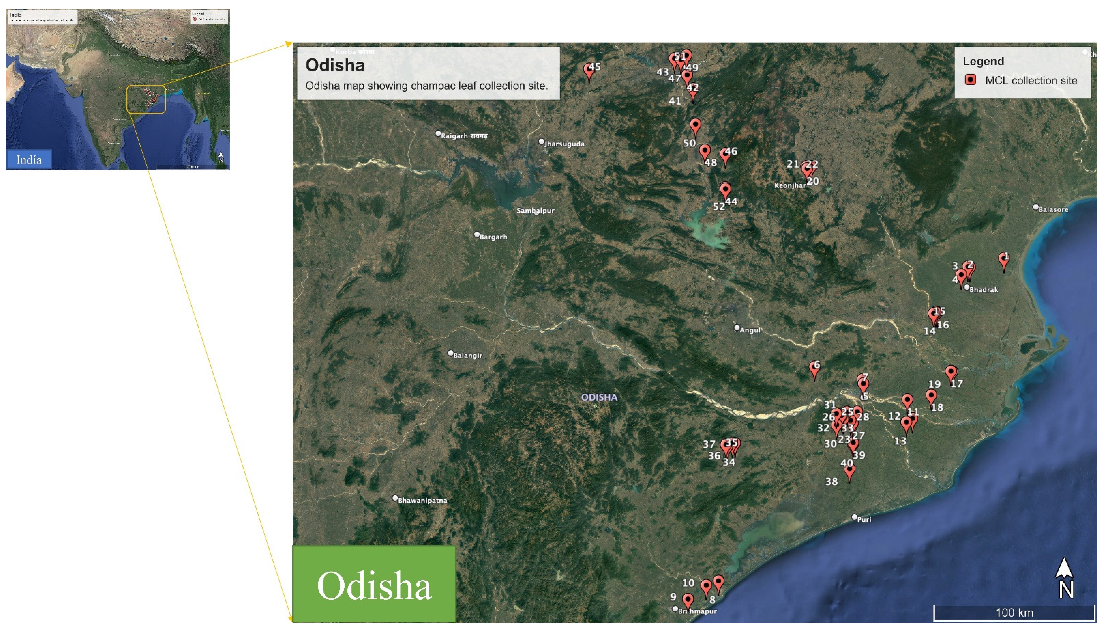
3.1. Plant Material
3.2. Extraction of Essential Oils
3.3. GC-MS Analysis of Isolated EOs
3.4. Statistical Analysis
4. Conclusions
Author Contributions
Funding
Institutional Review Board Statement
Informed Consent Statement
Data Availability Statement
Acknowledgments
Conflicts of Interest
Sample Availability
References
- Bakkali, F.; Averbeck, S.; Averbeck, D.; Idaomar, M. Biological effects of essential oils—A review. Food Chem. Toxicol. 2008, 46, 446–475. [Google Scholar] [CrossRef]
- Ray, A.; Jena, S.; Dash, B.; Kar, B.; Halder, T.; Chatterjee, T.; Ghosh, B.; Panda, P.C.; Nayak, S.; Mahapatra, N. Chemical diversity, antioxidant and antimicrobial activities of the essential oils from Indian populations of Hedychium coronarium Koen. Ind. Crops Prod. 2018, 112, 353–362. [Google Scholar] [CrossRef]
- Kamila, P.K.; Ray, A.; Jena, S.; Sahoo, A.; Kar, S.K.; Nayak, S.; Panda, P.C. Intraspecific variability in yield and chemical composition of essential oil of the endemic species Hypericum gaitii from different natural habitats of Eastern India. Plant Biosyst. 2021, in press. [CrossRef]
- Behura, S.; Sahoo, A.; Singh, S.; Jena, S.; Kar, B.; Nayak, S. Variation in essential oil yield and volatile constituents of Curcuma aromatica rhizome from different regions of eastern and southern India. J. Essent. Oil Bear. Plants 2021, 24, 1248–1255. [Google Scholar] [CrossRef]
- Sahoo, A.; Jena, S.; Ray, A.; Dash, K.T.; Nayak, S.; Panda, P.C. Chemical constituent analysis and antioxidant activity of leaf essential oil of Curcuma xanthorrhiza. J. Essent. Oil Bear. Plants 2021, 24, 736–744. [Google Scholar] [CrossRef]
- Sahoo, A.; Dash, B.; Jena, S.; Ray, A.; Panda, P.C.; Nayak, S. Phytochemical composition of flower essential oil of Plumeria alba grown in India. J. Essent. Oil Bear. Plants 2021, 24, 671–676. [Google Scholar] [CrossRef]
- Zhang, D.Y.; Yao, X.H.; Duan, M.H.; Wei, F.Y.; Wu, G.H.; Li, L. Variation of essential oil content and antioxidant activity of Lonicera species in different sites of China. Ind. Crops Prod. 2015, 77, 772–779. [Google Scholar] [CrossRef]
- Masotti, V.; Juteau, F.; Bessière, J.M.; Viano, J. Seasonal and phenological variations of the essential oil from the narrow endemic species Artemisia molinieri and its biological activities. J. Agric. Food Chem. 2003, 51, 7115–7121. [Google Scholar] [CrossRef]
- Angioni, A.; Barra, A.; Coroneo, V.; Dessi, S.; Cabras, P. Chemical composition, seasonal variability, and antifungal activity of Lavandula stoechas L. ssp. Stoechas essential oils from stem/leaves and flowers. J. Agric. Food Chem. 2006, 54, 4364–4370. [Google Scholar] [CrossRef]
- Sahoo, A.; Kar, B.; Jena, S.; Dash, B.; Ray, A.; Sahoo, S.; Nayak, S. Qualitative and quantitative evaluation of rhizome essential oil of eight different cultivars of Curcuma longa L. (Turmeric). J. Essent. Oil Bear. Plants 2019, 22, 239–247. [Google Scholar] [CrossRef]
- Morshedloo, M.R.; Ebadi, A.; Maggi, F.; Fattahi, R.; Yazdani, D.; Jafari, M. Chemical characterization of the essential oil compositions from Iranian populations of Hypericum perforatum L. Ind. Crops Prod. 2015, 76, 565–573. [Google Scholar] [CrossRef]
- Aghbash, B.N.; Dehghan, G.; Movafeghi, A.; Talebpour, A.H.; Pouresmaeil, M.; Maggi, F.; Nojadeh, M.S. Chemical compositions and biological activity of essential oils from four populations of Satureja macrantha C. A. Mey. J. Essent. Oil Bear. Plants 2021, 33, 133–142. [Google Scholar] [CrossRef]
- Sinha, R.; Varma, R. Michelia champaca L. (swarna champa): A review. Int. J. Enhanc. Res. Sci. Technol. Eng. 2016, 5, 78–83. [Google Scholar]
- Taprial, S.; Kashyap, D.; Mehta, V.; Kumar, S.; Kumar, D. Antifertility effect of hydroalcoholic leaves extract of Michelia champaca L.: An ethnomedicine used by Bhatra women in Chhattisgarh state of India. J. Ethnopharmacol. 2013, 147, 671–675. [Google Scholar] [CrossRef]
- Ramyashree, C.; Hemalatha, K. Ethnomedicinal profile on magnolia species (Magnoliaceae): A review. Int. J. Herb. Med. 2020, 8, 39–46. [Google Scholar]
- Khan, M.R.; Kihara, M.; Omoloso, A.D. Antimicrobial activity of Michelia champaca. Fitoterapia 2002, 73, 744–748. [Google Scholar] [CrossRef]
- Gupta, S.; Mehla, K.; Chauhan, D.; Nair, A. Anti-inflammatory activity of leaves of Michelia champaca investigated on acute inflammation induced rats. Lat. Am. J. Pharm. 2011, 30, 819–822. [Google Scholar]
- Hossain, M.M.; Jahangir, R.; Hasan, S.R.; Akter, R.; Ahmed, T.; Islam, M.I.; Faruque, A. Antioxidant, analgesic and cytotoxic activity of Michelia champaca Linn. Leaf. Stamford J. Pharm. Sci. 2009, 2, 1–7. [Google Scholar] [CrossRef][Green Version]
- Mullaicharam, A.R.; Kumar, M.S. Effect of Michelia champaca Linn on pylorous ligated rats. J. Appl. Pharm. Sci. 2011, 1, 60–64. [Google Scholar]
- Ahmad, H.; Saxena, V.; Mishra, A.; Gupta, R.; Saraf, S.A. Procognitive effects of hexane extracts of Michelia champaca leaves in normal and memory deficit mice. Pharmacogn. Commun. 2011, 1, 30–36. [Google Scholar] [CrossRef]
- Dama, G.; Bidkar, J.; Deore, S.; Jori, M.; Joshi, P. Helmintholytic activity of the methanolic and aqueous extracts of leaves of Michelia champaca. Res. J. Pharmacol. Pharmacodyn. 2011, 3, 25–26. [Google Scholar]
- Kumar, S.A.; Sankar, A.; Kumar, S.R.; Vijayan, M. Magnolia champaca plant leaves extract for the inhibition of mild steel corrosion in acidic medium. Asian J. Res. Chem. 2013, 6, 1023–1026. [Google Scholar]
- Mandal, U.; Mallick, S.K.; Mahalik, G. Ethnomedicinal plants used for the treatment and healing of skin diseases in Odisha, India: A review. Shodh Sanchar Bull. 2020, 10, 100–108. [Google Scholar]
- Lago, J.H.G.; Fávero, O.A.; Romoff, P. Chemical composition and seasonal variation of the volatile oils from leaves of Michelia champaca L., Magnoliaceae. Rev. Bras. Farmacogn. 2009, 19, 880–882. [Google Scholar] [CrossRef]
- Jiang, D.; Li, Y.; Xia, B.; He, F.; Pan, H. Components and antibacterial functions of volatile organic compounds from leaves and flowers of Michelia champaka. J. Northeast For. Univ. 2012, 40, 71–74. [Google Scholar]
- Moremi, M.P.; Kamatou, G.P.; Viljoen, A.M.; Tankeu, S.Y. Croton gratissimus-essential oil composition and chemometric analysis of an ethnomedicinally important tree from South Africa. S. Afr. J. Bot. 2021, 138, 141–147. [Google Scholar] [CrossRef]
- Ray, A.; Jena, S.; Haldar, T.; Sahoo, A.; Kar, B.; Patnaik, J.; Ghosh, B.; Panda, P.C.; Mahapatra, N.; Nayak, S. Population genetic structure and diversity analysis in Hedychium coronarium populations using morphological, phytochemical and molecular markers. Ind. Crops Prod. 2019, 132, 118–133. [Google Scholar] [CrossRef]
- Dai, D.N.; Thang, T.D.; Ogunwande, I.A. Essential oil composition of four Magnoliaceae species cultivated in Vietnam. J. Herbs Spices Med. Plants 2016, 22, 279–287. [Google Scholar] [CrossRef]
- Ha, C.T.T.; Thai, T.H.; Thanh, T.X.; Thuy, D.T.T.; Tra, N.T.; Ha, N.T.T. Chemical composition and antimicrobial activity of the essential oils from stems and leaves of Michelia alba DC growing in Vietnam. Acad. J. Biol. 2018, 40, 96–105. [Google Scholar]
- Ha, C.T.T.; Thai, T.H.; Thuy, D.T.T.; Ky, N.D.; Tam, H.M. Chemical composition and antimicrobial activity of the essential oil from twigs and leaves of Magnolia macclurei (Dandy) Figlar from Ha Giang Province, Vietnam. Acad. J. Biol. 2020, 42, 41–49. [Google Scholar] [CrossRef]
- Adams, R.P. Identification of Essential Oil Component by Gas Chromatography/Mass Spectrometry, 4th ed.; Allured Publishing Corporation: Carol Stream, IL, USA, 2007; pp. 1–811. [Google Scholar]
- Dupuy, N.; Molinet, J.; Mehl, F.; Nanlohy, F.; Le Dréau, Y.; Kister, J. Chemometric analysis of mid infrared and gas chromatography data of Indonesian nutmeg essential oils. Ind. Crops Prod. 2013, 43, 596–601. [Google Scholar] [CrossRef]
- Croteau, R.; Gershenzon, J. Genetic Control of Monoterpene Biosynthesis in Mints (Mentha: Lamiaceae). In Genetic Engineering of Plant Secondary Metabolism, 1st ed.; Ellis, B.E., Kuroki, G.W., Stafford, H.A., Eds.; Springer: Boston, MA, USA, 1994; Volume 28, pp. 193–229. [Google Scholar]
- Al-Sagheer, N.A. Magnolia champaca (L.) Baill. Ex Pierre (Magnoliaceae): A first report and a new record in the Arabian Peninsula (Yemen). J. Saudi Soc. Agric. Sci. 2021, 20, 243–247. [Google Scholar] [CrossRef]
- Zouari, N.; Ayadi, I.; Fakhfakh, N.; Rebai, A.; Zouari, S. Variation of chemical composition of essential oils in wild populations of Thymus algeriensis Boiss. Et Reut., a North African endemic Species. Lipids Health Dis. 2012, 11, 28. [Google Scholar] [CrossRef]
- Vallat, A.; Gu, H.; Dorn, S. How rainfall, relative humidity and temperature influence volatile emissions from apple trees in situ. Phytochemistry 2005, 66, 1540–1550. [Google Scholar] [CrossRef]
- Lago, J.H.G.; Fávero, O.A.; Romoff, P. Microclimatic factors and phenology influences in the chemical composition of the essential oils from Pittosporum undulatum Vent. Leaves. J. Braz. Chem. Soc. 2006, 17, 1334–1338. [Google Scholar] [CrossRef]
- Barra, A. Factors affecting chemical variability of essential oils: A review of recent developments. Nat. Prod. Commun. 2009, 4, 1147–1154. [Google Scholar] [CrossRef]
- Ward, J.H., Jr. Hierarchical grouping to optimize an objective function. J. Am. Stat. Assoc. 1963, 58, 236–244. [Google Scholar] [CrossRef]
- Ward, J.H., Jr.; Hook, M.E. Application of an hierarchical grouping procedure to a problem of grouping profiles. Educ. Psychol. Meas. 1963, 23, 69–81. [Google Scholar] [CrossRef]


| Sl No. | Accession No. | Location | District | Latitude | Longitude | Altitude (m) | Oil Yield (%) * | Date of Collection | Voucher Specimen No. |
|---|---|---|---|---|---|---|---|---|---|
| 1 | MCL1 | Basudebpur | Bhadrak | 21.132299 | 86.734740 | 5 | 0.11 ± 0.01 no | 27 February 2022 | 2350/CBT |
| 2 | MCL2 | Charampa | Bhadrak | 21.087979 | 86.520914 | 16 | 0.07 ± 0.01 pq | 27 February 2022 | 2351/CBT |
| 3 | MCL3 | Gelpur | Bhadrak | 21.044568 | 86.480404 | 16 | 0.06 ± 0.01 q | 28 February 2022 | 2352/CBT |
| 4 | MCL4 | Khordanga | Bhadrak | 21.084711 | 86.532225 | 14 | 0.06 ± 0.01 q | 28 February 2022 | 2353/CBT |
| 5 | MCL5 | Chauliaganj | Cuttack | 20.456451 | 85.902186 | 25 | 0.20 ± 0.01 fghi | 11 March 2022 | 2354/CBT |
| 6 | MCL6 | Sankarpur | Cuttack | 20.548721 | 85.618641 | 42 | 0.19 ± 0.01 ghij | 11 March 2022 | 2355/CBT |
| 7 | MCL7 | Zobra | Cuttack | 20.478640 | 85.896844 | 26 | 0.22 ± 0.01 defg | 11 March 2022 | 2356/CBT |
| 8 | MCL8 | Barlapalli | Ganjam | 19.385068 | 85.060824 | 5 | 0.25 ± 0.01 cd | 23 March 2022 | 2357/CBT |
| 9 | MCL9 | Korapalli | Ganjam | 19.285533 | 84.884574 | 22 | 0.29 ± 0.01 ab | 23 March 2022 | 2358/CBT |
| 10 | MCL10 | Chatrapur | Ganjam | 19.361912 | 84.989735 | 23 | 0.23 ± 0.01 cdef | 23 March 2022 | 2359/CBT |
| 11 | MCL11 | Raghunathpur | Jagatsinghpur | 20.368431 | 86.158429 | 14 | 0.18 ± 0.01 hijk | 8 April 2022 | 2360/CBT |
| 12 | MCL12 | Patenigan | Jagatsinghpur | 20.264791 | 86.187224 | 13 | 0.17 ± 0.01 ijkl | 8 April 2022 | 2361/CBT |
| 13 | MCL13 | Benupur | Jagatsinghpur | 20.245119 | 86.152115 | 12 | 0.18 ± 0.01 hijk | 8 April 2022 | 2362/CBT |
| 14 | MCL14 | Ameswarpur | Jajpur | 20.841792 | 86.328084 | 14 | 0.11 ± 0.01 no | 18 April 2022 | 2363/CBT |
| 15 | MCL15 | Baidyarajpur | Jajpur | 20.834910 | 86.315929 | 16 | 0.12 ± 0.01 mno | 18 April 2022 | 2364/CBT |
| 16 | MCL16 | Kalyanpur | Jajpur | 20.840515 | 86.336724 | 17 | 0.12 ± 0.01 mno | 18 April 2022 | 2365/CBT |
| 17 | MCL17 | Gulnagar | Kendrapara | 20.519592 | 86.414565 | 5 | 0.14 ± 0.01 lmn | 4 May 2022 | 2366/CBT |
| 18 | MCL18 | Tarada | Kendrapara | 20.390703 | 86.298042 | 11 | 0.16 ± 0.01 jkl | 4 May 2022 | 2367/CBT |
| 19 | MCL19 | Garapur | Kendrapara | 20.516980 | 86.423092 | 6 | 0.17 ± 0.01 ijkl | 4 May 2022 | 2368/CBT |
| 20 | MCL20 | Raintira | Keonjhar | 21.624656 | 85.579860 | 486 | 0.23 ± 0.01 cdef | 25 May 2022 | 2369/CBT |
| 21 | MCL21 | Dhenkpur | Keonjhar | 21.636924 | 85.603657 | 476 | 0.19 ± 0.01 ghij | 25 May 2022 | 2370/CBT |
| 22 | MCL22 | Bidyarajsahi | Keonjhar | 21.635674 | 85.575923 | 496 | 0.20 ± 0.01 fghi | 25 May 2022 | 2371/CBT |
| 23 | MCL23 | Forest park | Khordha | 20.257316 | 85.826255 | 36 | 0.10 ± 0.01 op | 3 June 2022 | 2372/CBT |
| 24 | MCL24 | Khandagiri | Khordha | 20.264246 | 85.783965 | 63 | 0.18 ± 0.01 hijk | 3 June 2022 | 2373/CBT |
| 25 | MCL25 | Durgamadhab nagar | Khordha | 20.291257 | 85.775147 | 72 | 0.21 ± 0.01 efgh | 3 June 2022 | 2374/CBT |
| 26 | MCL26 | Jaydev vihar | Khordha | 20.302974 | 85.805600 | 62 | 0.09 ± 0.01 opq | 11 June 2022 | 2375/CBT |
| 27 | MCL27 | Old town | Khordha | 20.241975 | 85.839274 | 20 | 0.31 ± 0.02 a | 11 June 2022 | 2376/CBT |
| 28 | MCL28 | Palasuni | Khordha | 20.303605 | 85.865650 | 21 | 0.12 ± 0.01 mno | 11 June 2022 | 2377/CBT |
| 29 | MCL29 | Nayapalli | Khordha | 20.303781 | 85.805565 | 65 | 0.17 ± 0.01 ijkl | 15 June 2022 | 2378/CBT |
| 30 | MCL30 | Tomando | Khordha | 20.233206 | 85.745459 | 29 | 0.22 ± 0.01 defg | 15 June 2022 | 2379/CBT |
| 31 | MCL31 | Gothapatna | Khordha | 20.294390 | 85.743991 | 78 | 0.21 ± 0.01 efgh | 15 June 2022 | 2380/CBT |
| 32 | MCL32 | Sampur | Khordha | 20.284518 | 85.773200 | 72 | 0.26 ± 0.01 bc | 24 June 2022 | 2381/CBT |
| 33 | MCL33 | Kalinga nagar | Khordha | 20.284124 | 85.775564 | 75 | 0.24 ± 0.01 cde | 24 June 2022 | 2382/CBT |
| 34 | MCL34 | Itamati nagar | Nayagarh | 20.136615 | 85.156632 | 71 | 0.19 ± 0.01 ghij | 13 July 2022 | 2383/CBT |
| 35 | MCL35 | Khandapada | Nayagarh | 20.128100 | 85.104011 | 106 | 0.15 ± 0.01 klm | 13 July 2022 | 2384/CBT |
| 36 | MCL36 | Pratapprasad | Nayagarh | 20.136224 | 85.140644 | 76 | 0.20 ± 0.01 fghi | 16 July 2022 | 2385/CBT |
| 37 | MCL37 | Old town | Nayagarh | 20.117820 | 85.110669 | 89 | 0.16 ± 0.01 jkl | 16 July 2022 | 2386/CBT |
| 38 | MCL38 | Siriapur | Puri | 19.993425 | 85.820178 | 9 | 0.20 ± 0.01 fghi | 21 July 2022 | 2387/CBT |
| 39 | MCL39 | Pipili | Puri | 20.135786 | 85.841370 | 14 | 0.21 ± 0.01 efgh | 21 July 2022 | 2388/CBT |
| 40 | MCL40 | Samalapur | Puri | 20.127881 | 85.840332 | 13 | 0.19 ± 0.01 ghij | 21 July 2022 | 2389/CBT |
| 41 | MCL41 | Chandanpur | Puri | 19.886747 | 85.814705 | 17 | 0.12 ± 0.01 mno | 22 July 2022 | 2390/CBT |
| 42 | MCL42 | Lathikata | Sundargarh | 22.136464 | 84.878344 | 186 | 0.09 ± 0.01 opq | 27 July 2022 | 2391/CBT |
| 43 | MCL43 | Udit nagar | Sundargarh | 22.221226 | 84.841473 | 196 | 0.11 ± 0.01 no | 27 July 2022 | 2392/CBT |
| 44 | MCL44 | Tensa | Sundargarh | 21.515307 | 85.102925 | 257 | 0.09 ± 0.01 opq | 27 July 2022 | 2393/CBT |
| 45 | MCL45 | Badagaon | Sundargarh | 22.169503 | 84.301875 | 252 | 0.11 ± 0.01 no | 28 July 2022 | 2394/CBT |
| 46 | MCL46 | Fuljhar | Sundargarh | 21.707314 | 85.102838 | 219 | 0.23 ± 0.01 cdef | 28 July 2022 | 2395/CBT |
| 47 | MCL47 | Basanti | Sundargarh | 22.221585 | 84.841456 | 196 | 0.11 ± 0.01 no | 28 July 2022 | 2396/CBT |
| 48 | MCL48 | Ruguda | Sundargarh | 21.726694 | 84.982909 | 155 | 0.18 ± 0.01 hijk | 3 August 2022 | 2397/CBT |
| 49 | MCL49 | Sector 4 | Sundargarh | 22.245085 | 84.874139 | 211 | 0.23 ± 0.01 cdef | 3 August 2022 | 2398/CBT |
| 50 | MCL50 | Rajamunda | Sundargarh | 21.867753 | 84.928222 | 163 | 0.12 ± 0.01 mno | 4 August 2022 | 2399/CBT |
| 51 | MCL51 | Panposh | Sundargarh | 22.226728 | 84.804252 | 188 | 0.09 ± 0.01 opq | 4 August 2022 | 2400/CBT |
| 52 | MCL52 | Tensa | Sundargarh | 21.522735 | 85.101525 | 444 | 0.18 ± 0.01 hijk | 4 August 2022 | 2401/CBT |
| Sl No. | Compounds | RI a | RI b | Peak Area (%) * | ||||||||||
|---|---|---|---|---|---|---|---|---|---|---|---|---|---|---|
| Bhadrak | Cuttack | Ganjam | Jagatsinghpur | Jajpur | Kendrapara | Keonjhar | Khordha | Nayagarh | Puri | Sundargarh | ||||
| 1 | (3E)-Hexenol | 848 | 853 | 0.10 ± 0.01 c | 0.17 ± 0.05 a | - | - | - | 0.16 ± 0.07 ab | - | 0.14 ± 0.05 b | 0.10 ± 0.01 c | - | 0.14 ± 0.06 b |
| 2 | α-Pinene | 928 | 939 | - | - | - | - | - | 0.58 ± 0.06 a | - | 0.15 ± 0.03 c | - | - | 0.35 ± 0.17 b |
| 3 | α-Fenchene | 945 | 952 | - | - | - | - | - | 0.79 ± 0.06 a | - | - | - | - | 0.22 ± 0.09 b |
| 4 | Sabinene | 967 | 975 | - | 0.11 ± 0.06 c | - | - | - | 1.90 ± 0.09 a | - | 0.18 ± 0.03 c | - | - | 0.32 ± 0.20 b |
| 5 | β-Pinene | 973 | 979 | - | 0.17 ± 0.08 d | - | - | - | 1.49 ± 0.09 b | - | 0.29 ± 0.11 c | - | - | 1.68 ± 0.43 a |
| 6 | Myrcene | 982 | 990 | - | - | - | - | - | 0.60 ± 0.06 a | - | 0.17 ± 0.04 b | - | - | 0.19 ± 0.03 b |
| 7 | Limonene | 1028 | 1029 | - | 0.45 ± 0.28 c | - | - | 1.25 ± 0.03 b | 7.36 ± 1.00 a | - | 0.11 ± 0.05 d | - | 1.14 ± 0.06 b | 1.11 ± 0.85 b |
| 8 | (E)-β-Ocimene | 1040 | 1050 | - | - | - | - | - | 3.82 ± 0.09 a | - | 0.27 ± 0.15 c | - | - | 1.86 ± 0.72 b |
| 9 | Linalool | 1096 | 1096 | 3.67 ± 0.18 c | 3.53 ± 0.18 c | 0.80 ± 0.07 g | 1.87 ± 0.09 f | 2.33 ± 0.12 ef | 7.59 ± 0.38 a | 2.40 ± 0.12 e | 2.26 ± 0.11 ef | 1.88 ± 0.09 ef | 5.24 ± 0.26 b | 2.95 ± 0.15 d |
| 10 | γ-Terpineol | 1176 | 1199 | - | 0.17 ± 0.03 d | - | - | 0.23 ± 0.01 c | 0.61 ± 0.06 a | - | 0.17 ± 0.08 d | - | 0.35 ± 0.02 b | 0.19 ± 0.09 d |
| 11 | Linalool formate | 1191 | 1216 | - | 0.21 ± 0.08 a | - | - | - | 0.20 ± 0.03 a | - | 0.13 ± 0.05 c | - | 0.16 ± 0.01 b | 0.16 ± 0.03 b |
| 12 | Menthyl acetate | 1291 | 1295 | 1.46 ± 0.04 a | 0.13 ± 0.01 c | - | - | - | - | 0.13 ± 0.01 c | 0.30 ± 0.16 b | 0.16 ± 0.03 c | 0.25 ± 0.02 b | 0.24 ± 0.05 b |
| 13 | iso-Menthyl acetate | 1306 | 1305 | 1.56 ± 0.02 a | 0.14 ± 0.01 de | - | - | - | 0.11 ± 0.07 e | 0.15 ± 0.02 de | 0.31 ± 0.18 b | 0.20 ± 0.04 cd | 0.26 ± 0.02 bc | 0.30 ± 0.07 b |
| 14 | δ-Elemene | 1328 | 1338 | 1.99 ± 0.01 bcd | 2.22 ± 0.56 b | - | 1.75 ± 0.04 d | 1.95 ± 0.05 cd | 0.24 ± 0.08 f | 2.63 ± 0.58 a | 1.89 ± 0.52 cd | 1.74 ± 0.64 d | 2.02 ± 0.08 bc | 1.36 ± 0.92 e |
| 15 | α-Copaene | 1367 | 1376 | 0.12 ± 0.05 d | 0.28 ± 0.25 c | 1.49 ± 0.07 b | 0.23 ± 0.05 cd | 1.62 ± 0.05 b | 2.11 ± 0.09 a | 0.28 ± 0.05 c | 0.28 ± 0.12 c | 0.22 ± 0.09 cd | 0.34 ± 0.02 c | 1.59 ± 0.33 b |
| 16 | β-Elemene | 1383 | 1390 | 3.69 ± 0.18 f | 15.93 ± 0.80 d | 35.76 ± 1.79 a | 18.51 ± 0.93 c | 5.72 ± 0.29 ef | 6.67 ± 0.33 e | 3.42 ± 0.17 f | 18.30 ± 0.92 cd | 22.61 ± 1.13 b | 19.11 ± 0.96 c | 3.67 ± 0.18 c |
| 17 | (Z)-Caryophyllene | 1399 | 1408 | - | 1.79 ± 0.94 a | 0.12 ± 0.04 d | 0.23 ± 0.02 c | - | - | 0.12 ± 0.01 d | 0.22 ± 0.21 c | 0.27 ± 0.18 c | - | 0.38 ± 0.21 b |
| 18 | β-Caryophyllene | 1412 | 1419 | 18.20 ± 0.91 a | 1.00 ± 0.05 f | 1.64 ± 0.08 ef | 5.46 ± 0.27 c | 18.79 ± 0.94 a | 18.73 ± 0.94 a | 8.57 ± 0.43 b | 3.55 ± 0.18 d | 2.93 ± 0.15 de | 5.49 ± 0.27 c | 4.00 ± 0.20 cd |
| 19 | γ-Elemene | 1421 | 1436 | 1.76 ± 0.02 b | 1.87 ± 0.65 ab | 0.30 ± 0.05 d | 1.17 ± 0.32 c | 1.05 ± 0.05 c | 0.14 ± 0.07 d | 1.70 ± 0.09 b | 1.19 ± 0.33 c | 1.02 ± 0.20 c | 1.16 ± 0.06 c | 1.97 ± 0.68 a |
| 20 | Aromadendrene | 1427 | 1441 | 0.13 ± 0.04 d | 0.18 ± 0.08 b | 0.07 ± 0.01 e | 0.12 ± 0.01 d | - | 0.12 ± 0.07 d | - | 0.15 ± 0.06 c | - | - | 0.21 ± 0.12 a |
| 21 | 6,9-Guaiadiene | 1434 | 1444 | 0.13 ± 0.04 f | 0.27 ± 0.01 e | - | 0.35 ± 0.06 de | 1.38 ± 0.03 b | - | 1.65 ± 0.07 a | 0.34 ± 0.11 de | 0.33 ± 0.11 de | 0.48 ± 0.04 c | 0.40 ± 0.13 cd |
| 22 | cis-Muurola-3,5-diene | 1439 | 1450 | 0.14 ± 0.04 c | 0.22 ± 0.02 b | 0.12 ± 0.04 c | 0.28 ± 0.03 b | 0.23 ± 0.01 b | - | 1.36 ± 0.05 a | 0.25 ± 0.07 b | 0.21 ± 0.05 b | 0.23 ± 0.01 b | 0.26 ± 0.11 b |
| 23 | α-Humulene | 1446 | 1454 | 6.42 ± 0.32 b | 4.24 ± 0.21 de | - | 6.07 ± 0.30 bc | 7.36 ± 0.37 a | 5.40 ± 0.27 c | 3.86 ± 0.19 e | 4.68 ± 0.23 d | 4.06 ± 0.20 de | 2.92 ± 0.15 f | 4.27 ± 0.21 de |
| 24 | allo-Aromadendrene | 1452 | 1460 | 1.14 ± 0.04 a | 0.17 ± 0.05 de | - | 0.19 ± 0.06 cd | 0.20 ± 0.01 cd | 0.13 ± 0.07 e | 0.20 ± 0.02 cd | 0.22 ± 0.07 bcd | 0.22 ± 0.05 bcd | 0.24 ± 0.01 bc | 0.26 ± 0.15 b |
| 25 | cis-Cadina-1(6),4-diene | 1464 | 1463 | 1.52 ± 0.02 a | - | 0.36 ± 0.05 b | - | - | 0.18 ± 0.03 c | - | 0.21 ± 0.08 c | - | - | 0.23 ± 0.02 c |
| 26 | γ-Gurjunene | 1466 | 1477 | - | 1.82 ± 0.04 a | 0.15 ± 0.04 de | 1.69 ± 0.09 a | 1.70 ± 0.05 a | 0.20 ± 0.03 d | - | 0.38 ± 0.13 c | 1.51 ± 0.26 b | 0.27 ± 0.02 cd | 0.25 ± 0.11 cd |
| 27 | γ-Muurolene | 1481 | 1479 | 7.04 ± 0.35 b | 3.48 ± 0.17 e | 8.29 ± 0.41 b | 5.37 ± 0.27 cd | 4.29 ± 0.21 de | 5.66 ± 0.28 c | 16.62 ± 0.83 a | 4.85 ± 0.24 cd | 4.79 ± 0.24 cd | 3.34 ± 0.17 e | 17.50 ± 0.87 a |
| 28 | β-Selinene | 1479 | 1490 | 1.67 ± 0.02 a | 1.68 ± 0.25 a | 1.08 ± 0.09 b | 1.74 ± 0.04 a | - | 0.33 ± 0.08 c | - | 1.58 ± 0.19 a | - | - | 1.58 ± 0.13 a |
| 29 | cis-β-Guaiene | 1484 | 1493 | 0.19 ± 0.06 d | 1.50 ± 0.09 b | - | 0.24 ± 0.06 d | 1.15 ± 0.08 c | 0.22 ± 0.03 d | 1.48 ± 0.07 b | 0.26 ± 0.17 d | 1.76 ± 0.16 a | 1.48 ± 0.04 b | 1.56 ± 0.37 b |
| 30 | Viridiflorene | 1487 | 1496 | 2.59 ± 0.13 e | 7.95 ± 0.40 b | 1.56 ± 0.08 f | 6.37 ± 0.32 c | 4.53 ± 0.23 d | 8.81 ± 0.44 a | - | 3.82 ± 0.19 d | 1.09 ± 0.05 f | 8.37 ± 0.42 ab | 7.00 ± 0.35 c |
| 31 | γ-Amorphene | 1494 | 1495 | 0.31 ± 0.06 cd | 0.46 ± 0.05 c | 0.17 ± 0.04 d | 1.62 ± 0.08 a | - | 1.27 ± 0.09 b | - | 1.61 ± 0.35 a | 1.61 ± 0.08 a | - | 1.52 ± 0.56 a |
| 32 | Bicyclogermacrene | 1498 | 1500 | 2.93 ± 0.15 ef | 2.66 ± 0.1 f | 6.30 ± 0.32 b | 3.33 ± 0.17 de | 2.37 ± 0.1 f | - | 7.36 ± 0.37 a | 3.43 ± 0.17 de | 5.93 ± 0.30 b | 3.59 ± 0.18 d | 4.49 ± 0.22 c |
| 33 | γ-Cadinene | 1504 | 1513 | 0.15 ± 0.04 e | 0.23 ± 0.09 e | 0.21 ± 0.05 e | 1.29 ± 0.09 d | - | - | 4.11 ± 0.09 a | 1.63 ± 1.24 c | 4.15 ± 1.69 a | 2.60 ± 0.08 b | 0.19 ± 0.06 e |
| 34 | δ-Cadinene | 1509 | 1523 | 1.83 ± 0.02 b | 1.12 ± 0.65 d | 1.47 ± 0.09 c | 1.24 ± 0.04 d | 0.27 ± 0.03 f | 2.46 ± 1.53 a | - | 1.98 ± 0.35 b | 0.22 ± 0.16 f | 0.16 ± 0.01 fg | 0.61 ± 0.42 e |
| 35 | (E)-iso-γ-Bisabolene | 1513 | 1529 | 0.15 ± 0.04 f | 0.12 ± 0.09 f | 0.13 ± 0.04 f | 0.17 ± 0.07 f | 1.69 ± 0.08 b | 0.17 ± 0.07 f | 1.01 ± 0.07 e | 1.43 ± 0.37 c | 1.90 ± 0.31 a | 1.26 ± 0.06 d | 1.12 ± 0.82 de |
| 36 | trans-Cadina-1,4-diene | 1521 | 1534 | - | 0.16 ± 0.06 a | - | 0.17 ± 0.08 a | - | - | 0.13 ± 0.01 b | 0.12 ± 0.04 b | 0.08 ± 0.02 c | - | 0.13 ± 0.03 b |
| 37 | α-Cadinene | 1525 | 1538 | 0.28 ± 0.06 a | 0.17 ± 0.08 b | 0.17 ± 0.05 b | 0.16 ± 0.05 b | - | - | 0.12 ± 0.01 c | 0.12 ± 0.05 c | 0.11 ± 0.03 c | - | 0.12 ± 0.02 c |
| 38 | Hedycaryol | 1540 | 1548 | 1.51 ± 0.02 a | 0.23 ± 0.13 de | - | 0.35 ± 0.02 c | 1.51 ± 0.03 a | 0.62 ± 0.06 b | - | 0.24 ± 0.10 de | 0.16 ± 0.08 e | - | 0.32 ± 0.20 cd |
| 39 | Germacrene B | 1555 | 1561 | 5.54 ± 0.28 d | 6.69 ± 0.33 bc | - | 7.73 ± 0.39 a | - | 6.13 ± 0.31 cd | 7.01 ± 0.35 ab | 6.71 ± 0.34 bc | 5.35 ± 0.27 d | 5.45 ± 0.27 d | |
| 40 | cis-Sesquisabinene hydrate (IPP vs. OH) | 1552 | 1544 | 1.49 ± 0.02 b | 3.16 ± 1.05 a | - | 1.51 ± 0.15 b | - | 0.37 ± 0.08 c | - | 1.67 ± 2.23 b | - | - | 0.54 ± 0.05 c |
| 41 | cis-Muurol-5-en-4-α-ol | 1558 | 1561 | 0.20 ± 0.06 c | 0.23 ± 0.17 c | - | 0.15 ± 0.04 c | 0.21 ± 0.01 c | 0.13 ± 0.07 c | - | 0.15 ± 0.04 c | 3.01 ± 4.01 a | - | 0.71 ± 0.69 b |
| 42 | trans-Dauca-4(11),7-diene | 1562 | 1557 | - | - | - | - | - | - | - | 0.19 ± 0.05 b | 0.12 ± 0.01 c | 0.33 ± 0.02 a | - |
| 43 | β-Copaen-4-α-ol | 1566 | 1590 | 1.34 ± 0.03 c | 0.39 ± 0.08 e | 0.08 ± 0.01 g | 0.28 ± 0.06 ef | 1.48 ± 0.03 b | 0.65 ± 0.06 d | 0.20 ± 0.02 fg | 0.35 ± 0.18 e | 0.36 ± 0.13 e | 1.85 ± 0.06 a | 0.62 ± 0.61 d |
| 44 | α-Cedrene epoxide | 1574 | 1575 | - | 0.41 ± 0.03 d | 0.15 ± 0.04 ef | - | 1.40 ± 0.03 c | - | 0.27 ± 0.05 de | 1.67 ± 0.35 b | 1.54 ± 0.04 bc | - | 2.61 ± 1.26 a |
| 45 | Spathulenol | 1571 | 1578 | 3.93 ± 0.68 a | 1.90 ± 0.96 b | 0.09 ± 0.01 f | 1.49 ± 0.05 cd | 1.55 ± 0.05 c | 4.10 ± 1.15 a | 1.28 ± 0.05 cde | 1.05 ± 0.70 e | 0.38 ± 0.18 f | 1.95 ± 0.06 b | 1.18 ± 0.98 de |
| 46 | Globulol | 1585 | 1590 | 0.24 ± 0.06 f | 1.70 ± 0.16 a | - | 1.42 ± 0.06 c | 1.61 ± 0.08 ab | 0.26 ± 0.08 f | 1.53 ± 0.07 bc | 0.32 ± 0.19 f | 0.39 ± 0.18 f | 1.23 ± 0.06 d | 0.63 ± 0.68 e |
| 47 | Guaiol | 1595 | 1600 | 0.12 ± 0.04 e | 0.33 ± 0.13 c | 0.09 ± 0.01 e | 0.26 ± 0.04 cd | 0.25 ± 0.01 d | 0.64 ± 0.06 b | 0.12 ± 0.01 e | 0.15 ± 0.05 e | 0.16 ± 0.11 e | 1.54 ± 0.04 a | 0.31 ± 0.24 cd |
| 48 | 9,11-epoxy-Guaia-3,10(14)-diene | 1599 | 1601 | 1.90 ± 0.02 a | - | - | 0.16 ± 0.05 d | - | - | - | 0.28 ± 0.21 c | 0.18 ± 0.04 d | - | 0.37 ± 0.19 b |
| 49 | 10-epi-γ-Eudesmol | 1610 | 1623 | 1.55 ± 0.03 b | 1.90 ± 0.23 a | 0.22 ± 0.05 e | 1.23 ± 0.05 c | 1.83 ± 0.05 a | 0.18 ± 0.03 e | 1.08 ± 0.09 cd | 1.20 ± 0.55 c | 1.83 ± 0.34 a | 1.76 ± 0.04 a | 0.89 ± 0.50 d |
| 50 | Muurola-4,10(14)-dien-1-β-ol | 1618 | 1631 | 1.08 ± 0.03 c | 1.83 ± 0.22 b | 0.30 ± 0.05 e | 1.12 ± 0.02 c | 1.05 ± 0.05 c | 4.71 ± 0.58 a | 1.63 ± 0.07 b | 1.02 ± 0.70 cd | 1.57 ± 0.03 b | 1.01 ± 0.06 cd | 0.75 ± 0.36 d |
| 51 | γ-Eudesmol | 1633 | 1632 | 1.79 ± 0.03 b | 1.35 ± 0.58 e | 1.55 ± 0.07 cde | 1.11 ± 0.01 f | 1.77 ± 0.08 bc | 0.84 ± 0.06 g | 1.48 ± 0.07 de | 1.03 ± 0.36 fg | 1.68 ± 0.28 bcd | 1.82 ± 0.08 ab | 2.01 ± 1.68 a |
| 52 | cis-Cadin-4-en-7-ol | 1636 | 1636 | 0.18 ± 0.06 f | 0.37 ± 0.12 e | 1.75 ± 0.07 ab | 1.43 ± 0.07 c | 1.58 ± 0.05 bc | 0.32 ± 0.08 ef | 1.76 ± 0.07 a | 1.43 ± 0.24 c | 0.40 ± 0.21 e | 1.57 ± 0.04 c | 0.70 ± 0.45 d |
| 53 | epi-α-Cadinol | 1640 | 1640 | 1.09 ± 0.03 c | 1.58 ± 0.46 b | - | - | 1.50 ± 0.03 b | - | 0.18 ± 0.02 f | 0.32 ± 0.09 e | 0.18 ± 0.07 f | 0.49 ± 0.04 d | 1.78 ± 4.05 a |
| 54 | α-Muurolol (=Torreyol) | 1645 | 1646 | 1.14 ± 0.03 c | 2.85 ± 0.71 a | 1.83 ± 0.09 b | 2.85 ± 0.58 a | - | 1.09 ± 0.06 c | 1.72 ± 0.09 b | 1.80 ± 0.59 b | 1.72 ± 1.81 b | 1.97 ± 0.08 b | 1.96 ± 0.80 b |
| 55 | α-Cadinol | 1652 | 1654 | - | - | 1.64 ± 0.07 cd | - | 2.31 ± 0.08 b | - | 1.31 ± 0.09 e | 1.86 ± 1.05 c | 2.83 ± 0.46 a | 1.39 ± 0.08 e | 1.52 ± 1.49 de |
| 56 | Selin-11-en-4-α-ol | 1653 | 1659 | 1.84 ± 0.02 bc | 1.58 ± 0.41 cde | 1.53 ± 0.07 de | 1.58 ± 0.03 cde | 4.25 ± 1.06 a | 1.61 ± 0.09 bcd | 1.30 ± 0.05 ef | 1.88 ± 0.98 b | 1.32 ± 1.78 ef | 1.65 ± 0.04 bcd | 1.06 ± 0.86 f |
| 57 | (Z)-Nerolidyl acetate | 1668 | 1677 | - | - | 0.11 ± 0.01 c | - | - | 0.19 ± 0.03 b | - | 0.09 ± 0.01 c | 0.09 ± 0.01 c | - | 0.66 ± 1.04 a |
| 58 | Eudesm-7(11)-en-4-ol | 1699 | 1700 | 0.15 ± 0.04 c | 0.17 ± 0.08 c | 1.70 ± 0.07 a | 0.18 ± 0.07 c | 0.18 ± 0.01 c | 0.41 ± 0.08 b | - | 0.18 ± 0.06 c | 0.18 ± 0.09 c | 0.14 ± 0.01 c | 0.35 ± 0.18 b |
| 59 | (E)-Nerolidyl acetate | 1709 | 1717 | 1.55 ± 0.02 c | 0.21 ± 0.09 e | 3.36 ± 0.09 a | 0.13 ± 0.03 e | 1.45 ± 0.08 cd | 0.26 ± 0.08 e | 1.24 ± 0.05 d | 1.38 ± 0.22 cd | 1.40 ± 0.24 cd | 1.80 ± 0.06 b | 1.29 ± 1.35 d |
| 60 | (Z)-Nuciferol | 1727 | 1725 | - | - | 1.45 ± 0.05 a | - | 0.26 ± 0.03 bc | - | - | 0.13 ± 0.06 d | - | 0.23 ± 0.01 c | 0.34 ± 0.23 b |
| 61 | γ-Costol | 1744 | 1746 | 0.28 ± 0.06 d | 0.24 ± 0.08 de | 0.48 ± 0.05 c | 0.23 ± 0.05 de | 1.45 ± 0.03 a | - | 1.21 ± 0.05 b | 0.18 ± 0.07 e | 0.31 ± 0.03 d | 0.31 ± 0.02 d | 0.26 ± 0.09 de |
| 62 | n-Hexadecanol | 1855 | 1875 | 2.51 ± 0.13 e | 6.12 ± 0.31 b | 6.02 ± 0.30 b | 5.56 ± 0.28 bc | 2.56 ± 0.13 e | - | 7.25 ± 0.36 a | 5.15 ± 0.26 c | 6.87 ± 0.34 a | 5.50 ± 0.28 bc | 4.18 ± 0.21 d |
| 63 | Manool oxide | 1970 | 1987 | - | - | 0.09 ± 0.01 d | - | - | - | - | 0.12 ± 0.01 c | 0.34 ± 0.04 a | - | 0.19 ± 0.03 b |
| 64 | Methyl linoleate | 2055 | 2085 | 1.38 ± 0.07 f | 3.16 ± 0.16 e | 8.08 ± 0.40 a | 1.89 ± 0.09 f | 3.63 ± 0.18 cde | - | 4.62 ± 0.23 b | 3.99 ± 0.20 c | 4.15 ± 0.21 bc | 3.76 ± 0.19 cd | 3.27 ± 0.16 de |
| 65 | Linoleic acid | 2111 | 2133 | 0.27 ± 0.06 ef | 0.40 ± 0.25 de | 1.88 ± 0.09 a | 0.13 ± 0.04 fg | 1.54 ± 0.05 b | - | 0.36 ± 0.05 c | 1.44 ± 0.24 bc | 0.49 ± 0.12 d | 1.77 ± 0.04 a | 0.55 ± 0.45 d |
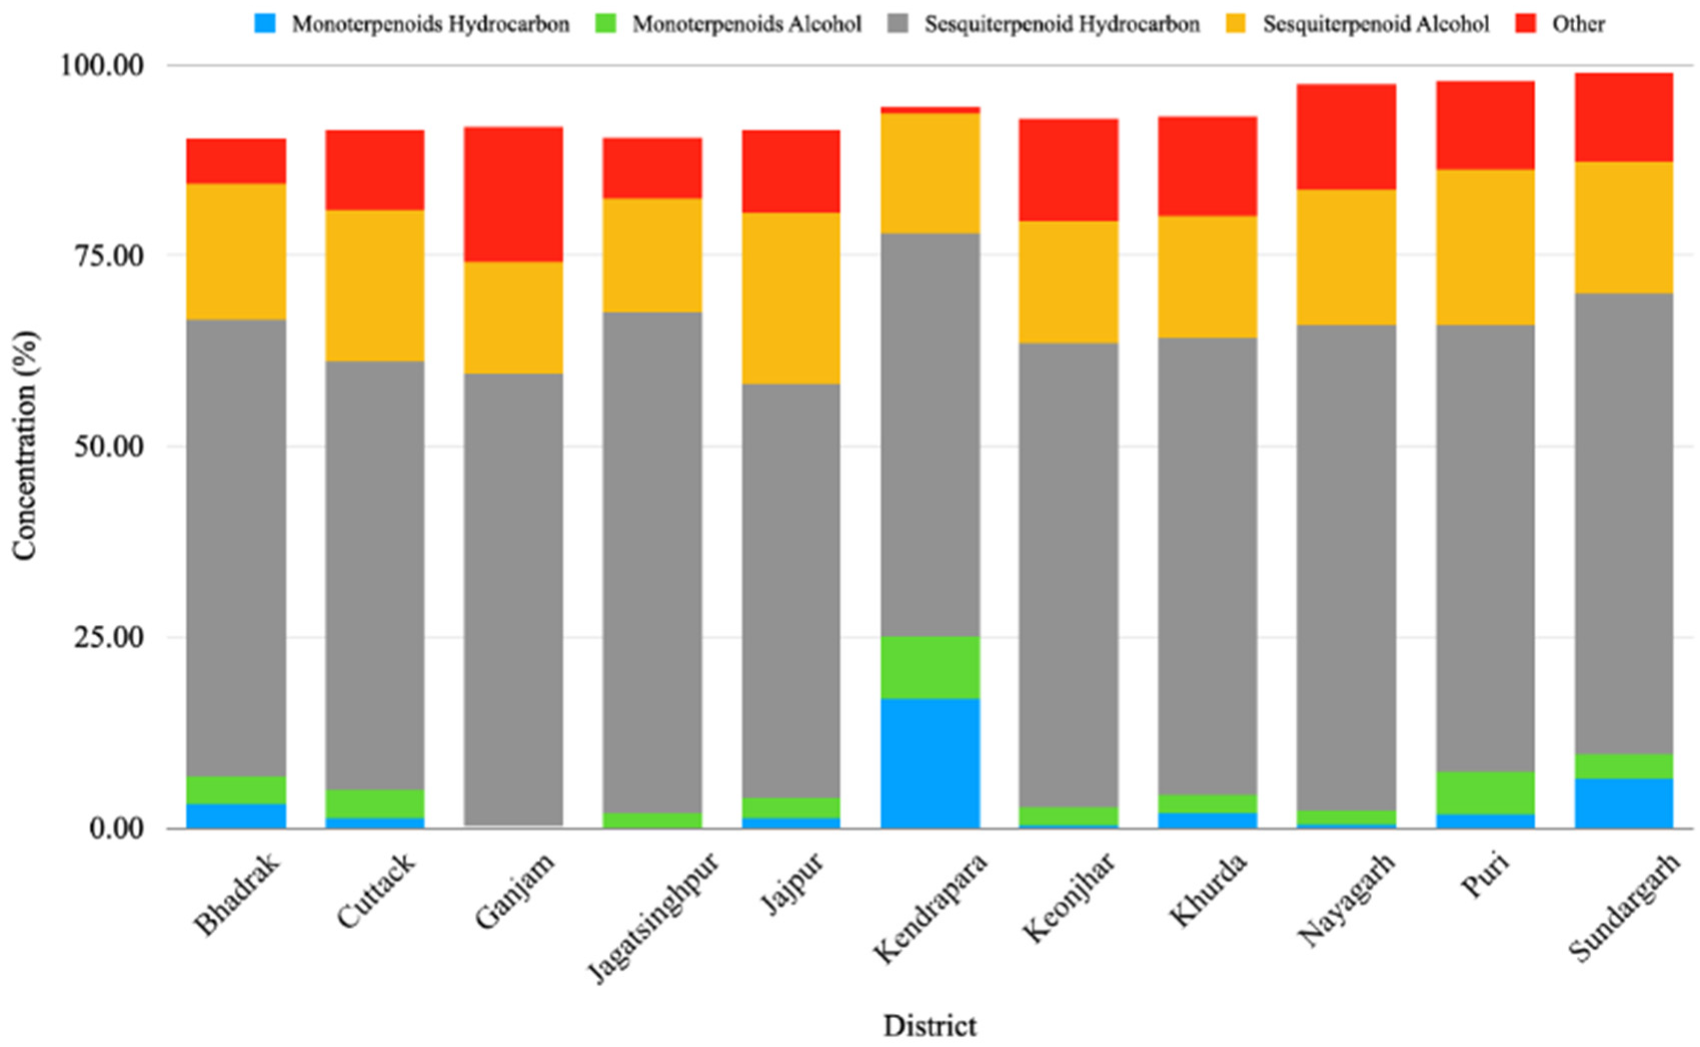
| Monoterpenoids Hydrocarbon | 3.02 ± 0.07 | 1.20 ± 0.02 | - | - | 1.25 ± 0.03 | 16.84 ± 0.29 | 0.28 ± 0.05 | 1.90 ± 0.03 | 0.36 ± 0.13 | 1.81 ± 0.21 | 6.43 ± 0.03 | |||
| Monoterpenoids Alcohol | 3.67 ± 0.04 | 3.70 ± 0.31 | 0.80 ± 0.07 | 1.87 ± 0.64 | 2.56 ± 0.07 | 8.20 ± 0.08 | 2.40 ± 0.23 | 2.42 ± 0.05 | 1.88 ± 0.87 | 5.59 ± 0.32 | 3.14 ± 0.08 | |||
| Sesquiterpenoid Hydrocarbon | 59.81 ± 0.38 | 56.24 ± 0.74 | 59.37 ± 0.03 | 65.63 ± 0.35 | 54.29 ± 0.17 | 52.83 ± 0.47 | 60.73 ± 0.43 | 59.80 ± 0.14 | 63.64 ± 0.80 | 58.41 ± 0.64 | 60.49 ± 0.26 | |||
| Sesquiterpenoid Alcohol | 17.97 ± 0.25 | 19.80 ± 0.15 | 14.71 ± 0.21 | 14.97 ± 0.53 | 22.45 ± 0.25 | 15.75 ± 0.24 | 16.05 ± 0.08 | 16.07 ± 0.08 | 17.79 ± 0.34 | 20.49 ± 0.39 | 17.24 ± 0.29 | |||
| Other | 5.77 ± 0.33 | 10.48 ± 0.25 | 17.68 ± 0.28 | 7.92 ± 0.09 | 10.91 ± 0.09 | 0.78 ± 0.09 | 13.50 ± 0.83 | 13.06 ± 0.23 | 13.76 ± 0.45 | 11.60 ± 0.03 | 11.60 ± 0.59 | |||
| Total | 90.23 ± 2.51 | 91.42 ± 2.57 | 92.56 ± 2.58 | 90.40 ± 1.52 | 91.46 ± 2.48 | 94.40 ± 3.60 | 92.96 ± 1.89 | 93.25 ± 0.76 | 97.44 ± 1.53 | 97.90 ± 1.04 | 98.90 ± 0.30 | |||
| Sl No. | Compounds | Concentration Range (%) | Accession No. with Highest % | Collection Site |
|---|---|---|---|---|
| 1 | β-Elemene | 0.23–38.76 | MCL9 | Ganjam |
| 2 | γ-Muurolene | 0.31–22.48 | MCL48 | Sundargarh |
| 3 | β-Caryophyllene | 0.03–20.70 | MCL16 | Jajpur |
| 4 | Bicyclogermacrene | 1.26–14.54 | MCL42 | Sundargarh |
| 5 | Methyl linoleate | 1.14–10.60 | MCL27 | Khordha |
| 6 | Viridiflorene | 0.16–11.02 | MCL42 | Sundargarh |
| 7 | n-Hexadecanol | 1.43–9.47 | MCL36 | Nayagarh |
| 8 | Linalool | 1.02–9.59 | MCL17 | Kendrapara |
| 9 | Germacrene B | 0.06–9.78 | MCL51 | Sundargarh |
| 10 | α-Humulene | 1.07–8.20 | MCL1 | Bhadrak |
Publisher’s Note: MDPI stays neutral with regard to jurisdictional claims in published maps and institutional affiliations. |
© 2022 by the authors. Licensee MDPI, Basel, Switzerland. This article is an open access article distributed under the terms and conditions of the Creative Commons Attribution (CC BY) license (https://creativecommons.org/licenses/by/4.0/).
Share and Cite
Sahoo, C.; Champati, B.B.; Dash, B.; Jena, S.; Ray, A.; Panda, P.C.; Nayak, S.; Sahoo, A. Volatile Profiling of Magnolia champaca Accessions by Gas Chromatography Mass Spectrometry Coupled with Chemometrics. Molecules 2022, 27, 7302. https://doi.org/10.3390/molecules27217302
Sahoo C, Champati BB, Dash B, Jena S, Ray A, Panda PC, Nayak S, Sahoo A. Volatile Profiling of Magnolia champaca Accessions by Gas Chromatography Mass Spectrometry Coupled with Chemometrics. Molecules. 2022; 27(21):7302. https://doi.org/10.3390/molecules27217302
Chicago/Turabian StyleSahoo, Chiranjibi, Bibhuti Bhusan Champati, Biswabhusan Dash, Sudipta Jena, Asit Ray, Pratap Chandra Panda, Sanghamitra Nayak, and Ambika Sahoo. 2022. "Volatile Profiling of Magnolia champaca Accessions by Gas Chromatography Mass Spectrometry Coupled with Chemometrics" Molecules 27, no. 21: 7302. https://doi.org/10.3390/molecules27217302
APA StyleSahoo, C., Champati, B. B., Dash, B., Jena, S., Ray, A., Panda, P. C., Nayak, S., & Sahoo, A. (2022). Volatile Profiling of Magnolia champaca Accessions by Gas Chromatography Mass Spectrometry Coupled with Chemometrics. Molecules, 27(21), 7302. https://doi.org/10.3390/molecules27217302