
Exploration of Habitat-Related Chemical Markers for Stephania tetrandra Applying Multiple Chromatographic and Chemometric Analysis

 ,
,
Abstract
1. Introduction
2. Results and Discussion
2.1. Method Validation
2.2. Identification of Volatile Components by GC-MS Analysis
2.3. Identification of Nonvolatile Components by UHPLC-Q-TOF-MS/MS Analysis
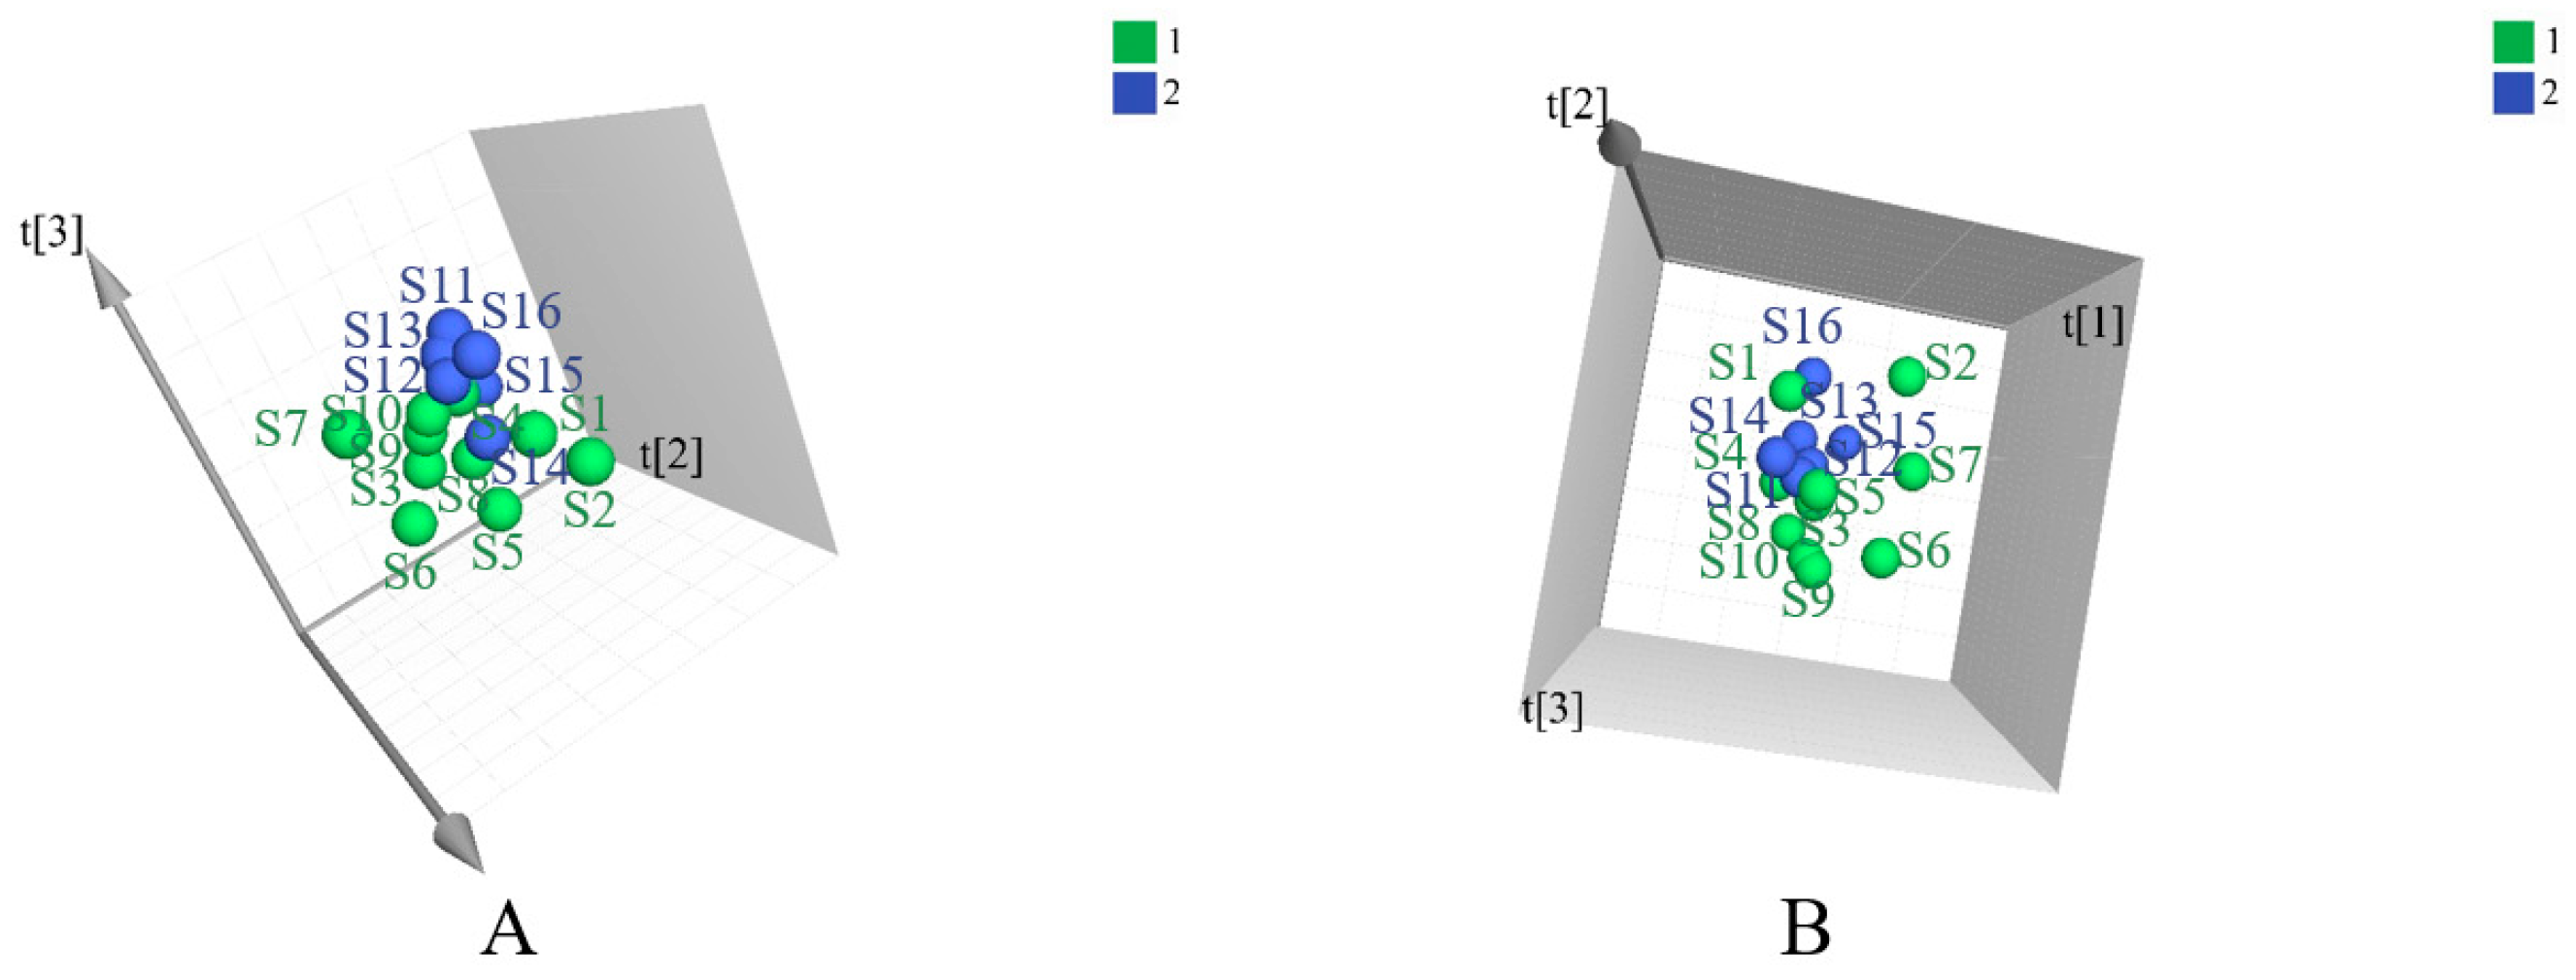
2.4. Exploration of Habitat-Related Chemical Markers Based on Global Components
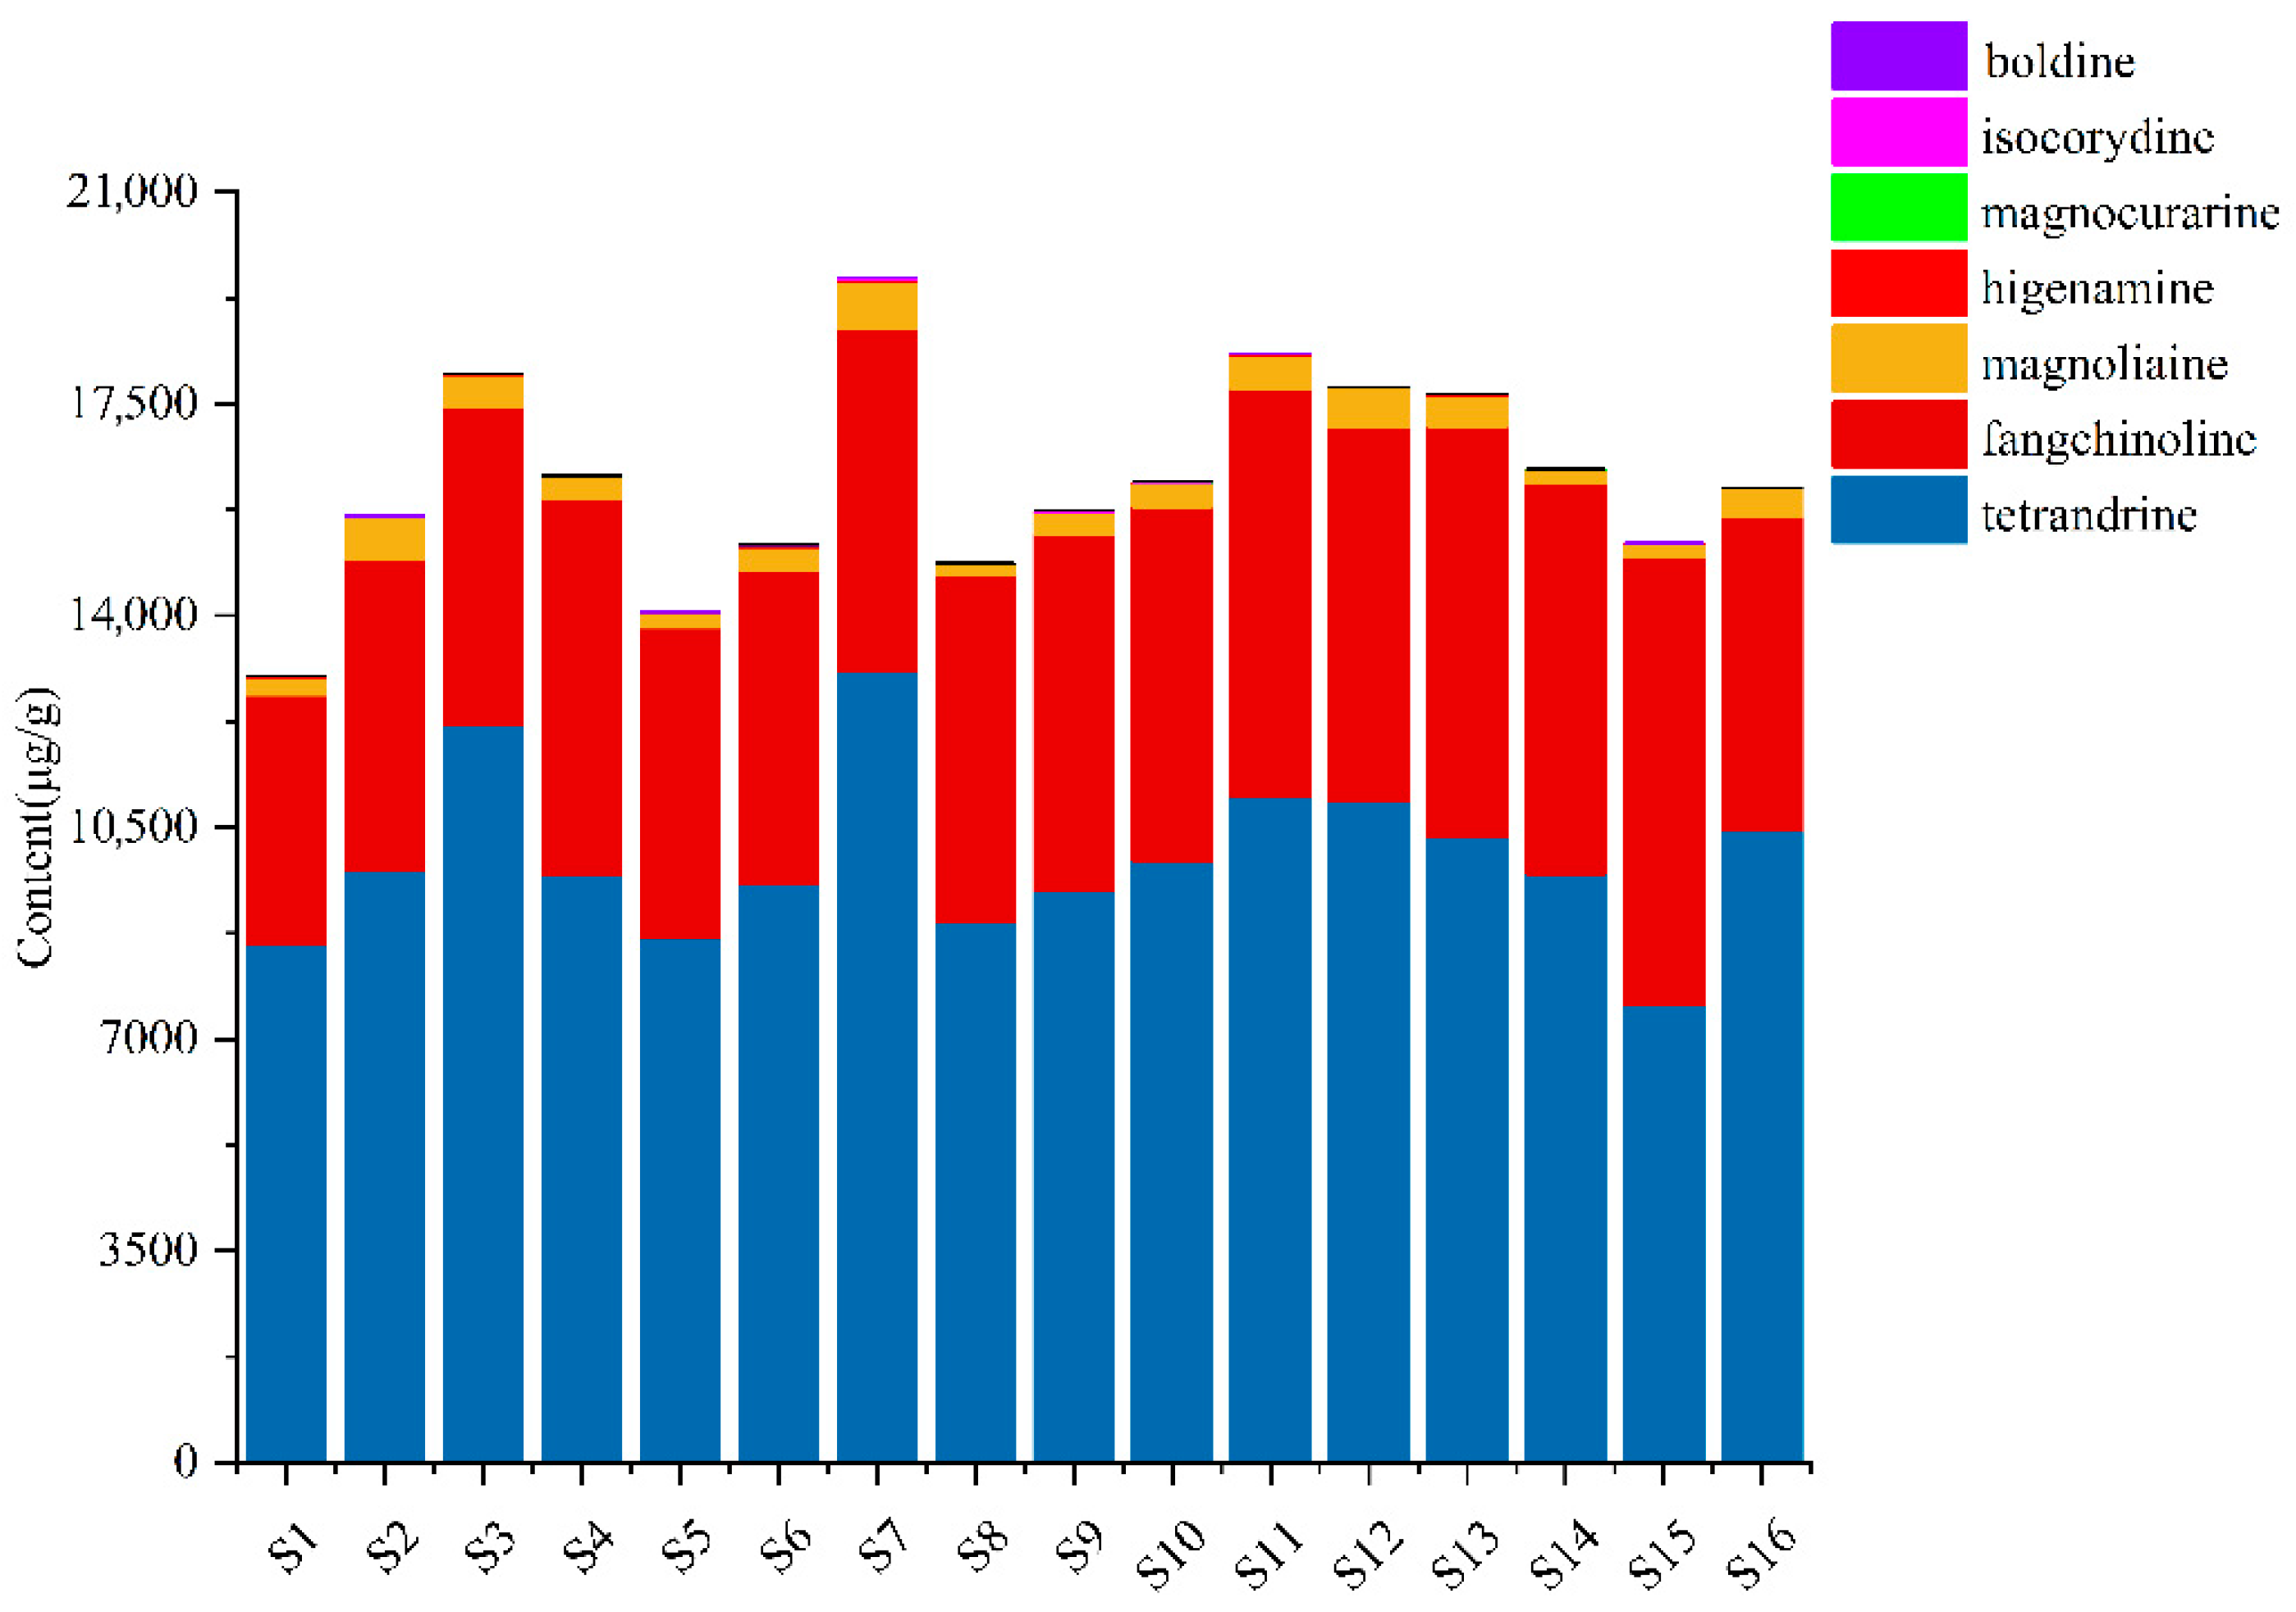
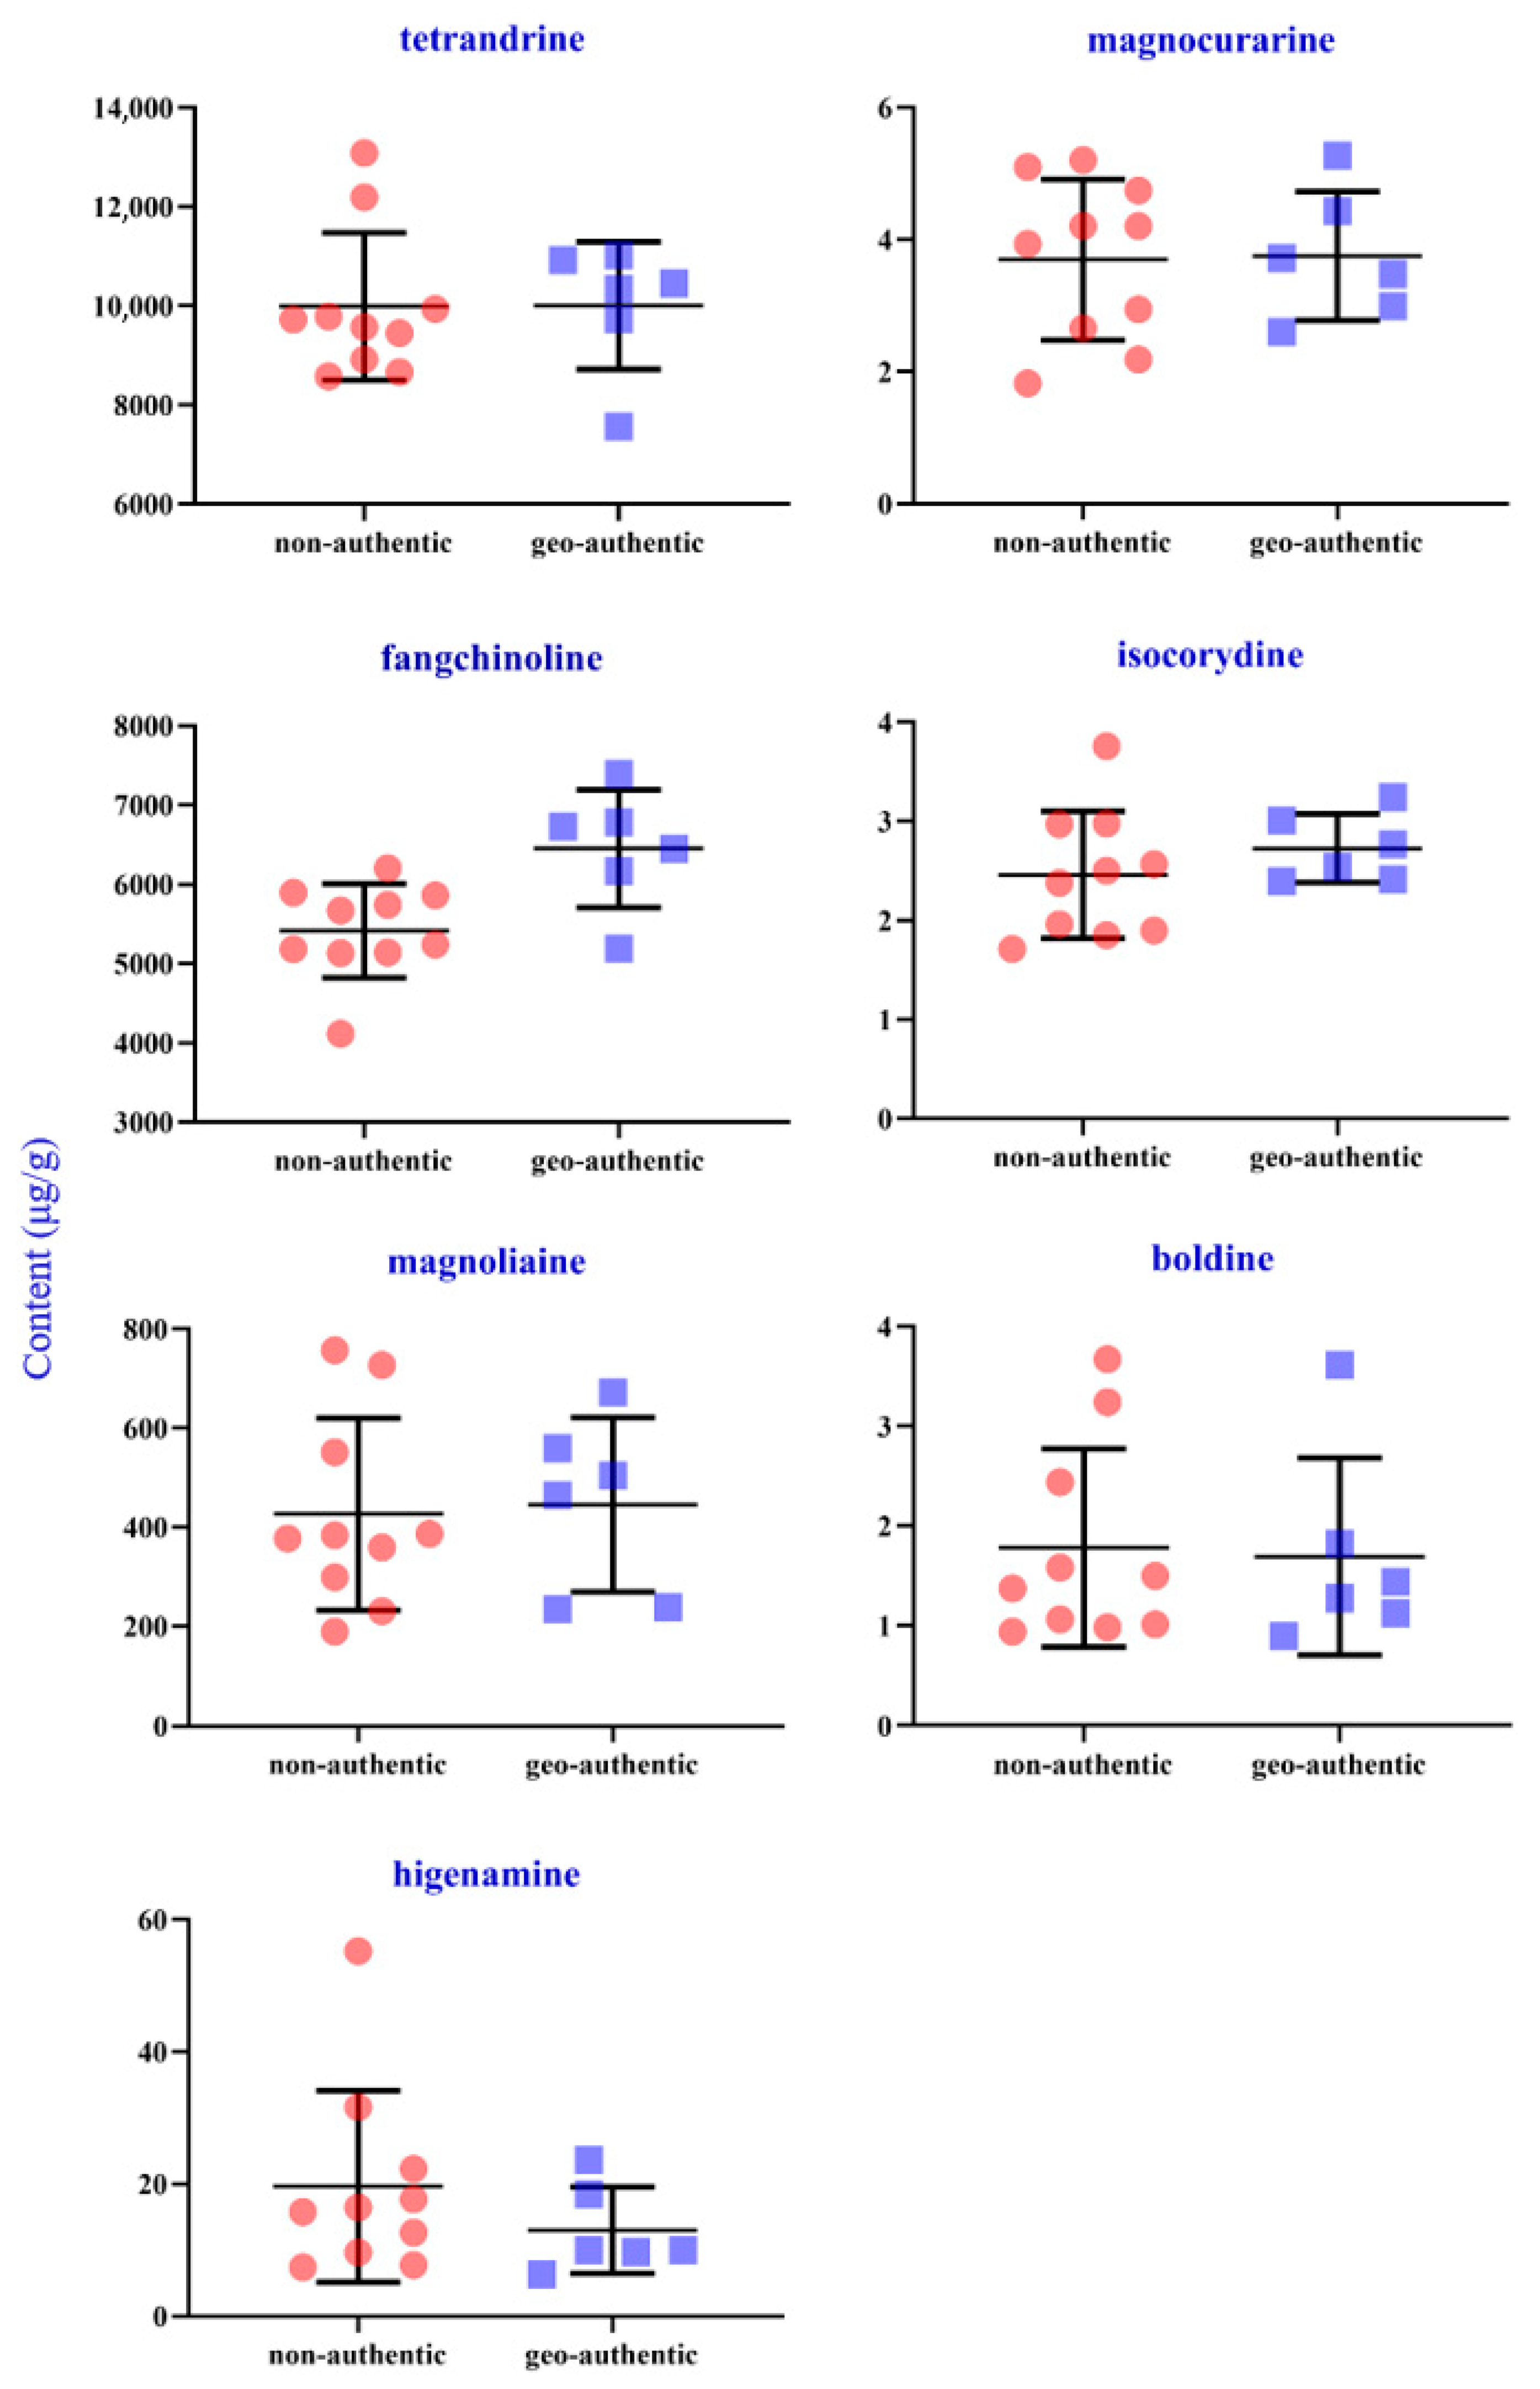
2.5. Quantitative Analysis of Habitat-Related Chemical Markers Based on Nonvolatile Components
2.6. Discriminatory Analysis
3. Materials and Methods
3.1. Chemical Reagents and Materials
3.2. Preparation of Standard and Sample Solutions
3.3. GC-MS Analysis
3.4. UHPLC-Q-TOF-MS/MS Analysis
3.5. UHPLC-MS/MS Analysis
3.6. Method Validation
3.7. Data Preprocessing
4. Conclusions
Supplementary Materials
Author Contributions
Funding
Institutional Review Board Statement
Informed Consent Statement
Data Availability Statement
Conflicts of Interest
Sample Availability
References
- State Pharmacopoeia Commission. Pharmacopoeia of People’s Republic of China; China Medical Science and Technology Press: Beijing, China, 2020; p. 155.
- Jiang, Y.P.; Liu, M.; Liu, H.T.; Liu, S. A critical review: Traditional uses, phytochemistry, pharmacology and toxicology of Stephania tetrandra S. Moore (Fen Fang Ji). Phytochem Rev. 2020, 19, 449–489. [Google Scholar] [CrossRef] [PubMed]
- Jiangsu New Medical College. Dictionary of Traditional Chinese Medicine; Shanghai Science and Technology Publishing House: Shanghai, China, 2006; pp. 1182–1185. [Google Scholar]
- Cao, J.; Yang, Z.W.; Li, F.; Zhao, H.Y.; Zhang, Y.C. Advances on the clinical application of tetrandrine. World Clinical Drugs 2013, 34, 75–79. [Google Scholar]
- Zhang, Y.L.; Qi, D.L.; Gao, Y.Q.; Liang, C.X.; Zhang, Y.K.; Ma, Z.; Liu, Y.T.; Peng, H.; Zhang, Y.; Qin, H.; et al. History of uses, phytochemistry, pharmacological activities, quality control and toxicity of the root of Stephania tetrandra S. Moore: A review. J. Ethnopharmacol. 2020, 260, 112995. [Google Scholar] [CrossRef] [PubMed]
- Wang, L.; Zhou, G.B.; Liu, P.; Song, J.H.; Liang, Y.; Yan, X.J.; Xu, F.; Wang, B.S.; Mao, J.H.; Shen, Z.X.; et al. Dissection of mechanisms of Chinese medicinal formula Realgar-Indigo naturalis as an effective treatment for promyelocytic leukemia. Proc. Natl. Acad. Sci. USA 2008, 105, 4826–4831. [Google Scholar] [CrossRef]
- Liu, X.J.; Wei, F.X.; Liu, H.L.; Zhao, S.J.; Du, G.H.; Qin, X.M. Integrating hippocampal metabolomics and network pharmacology deciphers the antidepressant mechanisms of Xiaoyaosan. J. Ethnopharmacol. 2021, 268, 113549. [Google Scholar] [CrossRef]
- Xu, F.; Kong, M.; Xu, J.D.; Xu, J.; Jiang, Y.; Li, S.L. Effects of sulfur fumigation and heating desulfurization on quality of medicinal herbs evaluated by metabolomics and glycomics: Codonopsis Radix, a pilot study. J. Pharm. Biomed. Anal. 2020, 191, 113581. [Google Scholar] [CrossRef] [PubMed]
- Ziegel, E.R. Statistics and chemometrics for analytical chemistry. Technometrics 2004, 46, 498–499. [Google Scholar] [CrossRef]
- Kumar, N.; Bansal, A.; Sarma, G.S.; Rawal, R.K. Chemometrics tools used in analytical chemistry: An overview. Talanta 2014, 123, 186–199. [Google Scholar] [CrossRef] [PubMed]
- Guo, J.D.; Li, J.; Yang, X.J.; Wang, H.; He, J.; Liu, E.W.; Gao, X.M.; Chang, Y.X. A Metabolomics Coupled With Chemometrics Strategy to Filter Combinatorial Discriminatory Quality Markers of Crude and Salt-Fired Eucommiae Cortex. Front. Pharmacol. 2020, 11, 838. [Google Scholar] [CrossRef]
- Pan, J.X.; Chen, G.; Li, J.J.; Zhu, Q.D.; Li, J.J.; Chen, Z.J.; Yu, Z.P.; Ye, L.Y. Isocorydine suppresses doxorubicin-induced epithelial-mesenchymal transition via inhibition of ERK signaling pathways in hepatocellular carcinoma. Am. J. Cancer. Res. 2018, 8, 154–164. [Google Scholar]
- Arbain, D.; Ahmad, A.; Nelli, Z.; Sargent, M.V. (R)-Magnocurarine from Evodia cf. trichotoma. Planta. Med. 1993, 59, 290. [Google Scholar] [CrossRef] [PubMed]
- Zhao, H.Y.; Xu, H.H.; Qiao, S.Y.; Lu, C.; Wang, G.; Liu, M.J.; Guo, B.S.; Tan, Y.; Ju, D.H.; Xiao, C. Boldine isolated from Litsea cubeba inhibits bone resorption by suppressing the osteoclast differentiation in collagen-induced arthritis. Int. Immunopharmacol. 2017, 51, 114–123. [Google Scholar] [CrossRef] [PubMed]
- Wu, M.P.; Zhang, Y.S.; Zhou, Q.M.; Xiong, J.; Dong, Y.R.; Yan, C. Higenamine protects ischemia/reperfusion induced cardiac injury and myocyte apoptosis through activation of β2-AR/PI3K/AKT signaling pathway. Pharmacol. Res. 2016, 104, 115–123. [Google Scholar] [CrossRef] [PubMed]
- Liu, J.X.; Luo, Y.Y.; Liu, X.H.; Song, J.P.; Hua, Y.J.; Wang, S.N.; Zhao, H.; Yan, Y. Difference of chemical compositions in Xanthii Herba and Xanthii Fructus by UPLC-Triple TOF-MS/MS. Zhong Cao Yao 2016, 47, 3951–3958. [Google Scholar] [CrossRef]
- Kong, J.; Liu, C.X.; Zhang, N.; Li, W.; Zhang, Y.C.; Jiang, W.Q.; Qu, Y.X.; Li, Y.Z.; Huang, J.M. Qualitative analysis of chemical composition of Xiaoxianxiong Decoction based on UPLC-Q-TOF/HRMSE. Drug Eval. Res. 2020, 43, 1273–1282. [Google Scholar] [CrossRef]
- Zhai, X.Y.; Zhang, L.; Li, B.T.; Feng, Y.L.; Xu, G.L.; Ouyang, H.; Yang, S.L.; Chen, J. Discrimination of toxic ingredient between raw and processed Pinellia ternata by UPLC/Q-TOF-MS/MS with principal component analysis and T-test. Chin. Herb. Med. 2019, 11, 200–208. [Google Scholar] [CrossRef]
- Dong, F.; Li, Z.X.; Jia, C.M.; Sun, Y.Z.; Sun, Z.H.; Song, X.Y.; Wang, M.Q. Component analysis of sesame oil based on UPLC/Q-TOF MS/MS. China Oils Fats 2014, 29, 120–124. Available online: https://kns.cnki.net/kcms/detail/61.1099.TS.20211129.1053.008.html (accessed on 3 October 2022).
- Zhao, X.M.; Cheng, Y.X.; Liang, C.X.; Guo, J.; Liu, X.Q.; Feng, W.H.; Zhao, Z.B.; Yan, L.H.; Wang, Z.M. Analysis of Chemical Constituents in Euodiae Fructus by UPLC-Q-TOF-MS/MS. Zhongguo Shi Yan Fang Ji Xue Za Zhi 2021, 27, 113–126. [Google Scholar] [CrossRef]
- Qin, W.H.; Hua, L.; Guo, Y.L.; Wang, Y.H.; Ran, J.C.; Yang, Y. Differentiation of Different Parts of Cordyceps sinensis Based on UPLC-Q-TOF-MS Combined with Metabolomics Methods. Zhongguo Shi Yan Fang Ji Xue Za Zhi 2018, 24, 69–76. [Google Scholar] [CrossRef]
- Deng, G.M.; Xiang, B.; Xiao, X.Q.; Ge, J.W.; Chen, Z.; Yang, L.P.; Wei, F. Study on Chemical Constituents of Lindera aggregate by GC-MS and UPLC-ESI-MS/MS. Zhong Yao Cai 2016, 39, 2229–2236. [Google Scholar] [CrossRef]
- Wei, C.H.; Zeng, J.X.; Shi, Y.F.; Luo, G.M.; Gao, Y.P.; Zhong, G.Y.; Zhu, J.X. Analytical Studies on Corydalis hendersonii Hemsl by UHPLC-Q-TOF-MS. J. JiangxiI Univ. TCM 2020, 26, 131–139. [Google Scholar] [CrossRef]
- Tian, X.M.; Yan, L.H.; Jiang, L.Y.; Xiang, G.F.; He, Y.J. Chemical composition analysis of Schima superba root based on UPLC/Q-TOF-MS metabonomics. Zhongguo Nong Xue Tong Bao 2018, 34, 76–83. [Google Scholar]
- Liu, C.M.; Hua, Z.D.; Bai, Y.P. Determination of Opium Alkaloids and Discrimination of Sample Origins by UPLC/Q-TOF and PLS-DA. Res. Pap. 2014, 30, 65–68. [Google Scholar] [CrossRef]
- Chen, M. Study on the chemical components and metabolism of Fangji Huangqi Tang. Shanxi Univ. 2018. [Google Scholar]
- Ye, J.; Yang, M.J.; Yang, X.Y.; Zhang, H.; Zan, L.F. Analysis of chemical constituents in Ziziphus jujuba var. spinosa folium by UPLC-QTOF-MS. Nat. Prod. Res. Dev. 2019, 31, 1183–1191. [Google Scholar] [CrossRef]
- Xiao, J.; Song, N.N.; Lu, T.; Pan, Y.N.; Song, J.Y.; Chen, G.; Sun, L.; Li, N. Rapid characterization of TCM Qianjinteng by UPLC-QTOF-MS and its application in the evaluation of three species of Stephania. J. Pharm. Biomed. Anal. 2018, 156, 284–296. [Google Scholar] [CrossRef] [PubMed]
- Sim, H.J.; Yoon, S.H.; Kim, M.S.; Kim, B.; Park, H.M.; Hong, J. Identification of alkaloid constituents from Fangchi species using pH control liquid-liquid extraction and liquid chromatography coupled to quadrupole time-of-flight mass spectrometry. Rapid. Commun. Mass. Spectrom. 2015, 29, 837–854. [Google Scholar] [CrossRef]
- Hu, H.L.; Wang, Z.G.; Hua, W.; You, Y.; Zou, L. Effect of Chemical Profiling Change of Processed Magnolia officinalis on the Pharmacokinetic Profiling of Honokiol and Magnolol in Rats. J. Chromatogr. Sci. 2016, 54, 1201–1212. [Google Scholar] [CrossRef]
- Zheng, X.J.; Zheng, W.L.; Zhou, J.J.; Gao, X.; Liu, Z.H.; Han, N.; Yin, J. Study on the discrimination between Corydalis Rhizoma and its adulterants based on HPLC-DAD-Q-TOF-MS associated with chemometric analysis. J. Chromatogr. B. Analyt. Technol. Biomed. Life Sci. 2018, 1090, 110–121. [Google Scholar] [CrossRef]
- Qin, W.H.; Ran, J.C.; Ye, L.H.; Hua, L.; Wang, Y.H.; Guo, Y.L.; Yang, Y. UPLC-Q/TOF method for simultaneous qualitative and quantitative analysis of main chemical constituents in medicinal materials of Sinodielsia yunnanensis. Zhong Cao Yao 2018, 49, 3576–3582. [Google Scholar] [CrossRef]


| No. | Rt (min) | Compound | CAS | Molecular Formula | Molecular Weight | Retention Index | Similarity | Relative Content (%) |
|---|---|---|---|---|---|---|---|---|
| 1 | 3.71 | 2,4-dimethyl-1-heptene | 19549-87-2 | C9H18 | 126 | 819 | 96 | 1.80 |
| 2 | 4.05 | 4-methyloctane | 2216-34-4 | C9H20 | 128 | 852 | 94 | 0.21 |
| 3 | 5.62 | 2-[(2-methylpropan-2-yl) oxy] oxolane | 1927-59-9 | C8H16O2 | 144 | 1024 | 82 | 0.07 |
| 4 | 6.12 | butyl-2,2-dimethylpropanoate | 5129-37-3 | C9H18O2 | 158 | 999 | 87 | 0.07 |
| 5 | 6.26 | 3,3,5-trimethylheptane | 7154-80-5 | C10H22 | 142 | 867 | 94 | 0.67 |
| 6 | 6.33 | 3,3-dimethyloctane | 4110-44-5 | C10H22 | 142 | 931 | 94 | 0.75 |
| 7 | 6.90 | 5-(2-methylpropyl) nonane | 62185-53-9 | C13H28 | 184 | 1185 | 88 | 0.04 |
| 8 | 7.41 | 8-methylnonyl methacrylate | 29964-84-9 | C14H26O2 | 226 | 1483 | 88 | 1.08 |
| 9 | 7.79 | 4-methylundecane | 2980-69-0 | C12H26 | 170 | 1150 | 93 | 0.32 |
| 10 | 7.91 | 2,6,6-trimethyl-octane | 54166-32-4 | C11H24 | 156 | 966 | 93 | 0.31 |
| 11 | 8.18 | (5-methyl-2-propan-2-ylhexyl) acetate | 40853-55-2 | C12H24O2 | 200 | 1189 | 82 | 0.05 |
| 12 | 8.54 | nonadecane | 629-92-5 | C19H40 | 268 | 1910 | 81 | 0.02 |
| 13 | 9.23 | dodecane | 112-40-3 | C12H26 | 170 | 1214 | 93 | 0.03 |
| 14 | 9.54 | 2,4-dimethylbenzaldehyde | 15764-16-6 | C9H10O | 134 | 1208 | 97 | 0.28 |
| 15 | 10.31 | hexadecane | 544-76-3 | C16H34 | 226 | 1612 | 92 | 0.29 |
| 16 | 10.68 | 11-methyldodecan-1-ol | 27458-92-0 | C13H28O | 200 | 1492 | 89 | 1.30 |
| 17 | 10.80 | 2,4-diethylheptan-1-ol | 80192-55-8 | C11H24O | 172 | 1229 | 88 | 1.73 |
| 18 | 10.92 | 2-hexyl-1-decanol | 2425-77-6 | C16H34O | 242 | 1790 | 86 | 1.42 |
| 19 | 10.97 | 4-methyldodecane | 6117-97-1 | C13H28 | 184 | 1249 | 90 | 0.53 |
| 20 | 11.10 | tetramethyl-2,3,6,7 octane | 52670-34-5 | C12H26 | 170 | 958 | 91 | 0.41 |
| 21 | 11.22 | 4,8-dimethylundecane | 17301-33-6 | C13H28 | 184 | 1185 | 90 | 0.58 |
| 22 | 11.55 | 3,3-dimethylhexane | 563-16-6 | C8H18 | 114 | 732 | 83 | 0.03 |
| 23 | 11.63 | 2,3-dimethyldecane | 17312-44-6 | C12H26 | 170 | 1086 | 88 | 0.05 |
| 24 | 12.04 | tetradecane | 629-59-4 | C14H30 | 198 | 1413 | 95 | 0.06 |
| 25 | 12.77 | 2,3-dimethyldodecane | 6117-98-2 | C14H30 | 198 | 1285 | 90 | 0.33 |
| 26 | 12.88 | 2,6,10-trimethyldodecane | 3891-98-3 | C15H32 | 212 | 1320 | 88 | 0.56 |
| 27 | 13.12 | 4-methyltetradecane | 25117-24-2 | C15H32 | 212 | 1448 | 89 | 0.33 |
| 28 | 13.19 | n-heptadecane | 629-78-7 | C17H36 | 240 | 1711 | 91 | 0.34 |
| 29 | 13.34 | heptacosane | 593-49-7 | C27H56 | 380 | 2705 | 87 | 0.05 |
| 30 | 13.43 | 2,4-di-t-butylphenol | 96-76-4 | C14H22O | 206 | 1555 | 95 | 1.51 |
| 31 | 13.66 | 3,7,11,15-tetramethylhexadecan-1-ol | 645-72-7 | C20H42O | 298 | 1996 | 86 | 0.71 |
| 32 | 13.75 | 4,6,8-trimethylnon-1-ene | 54410-98-9 | C12H24 | 168 | 1012 | 89 | 1.33 |
| 33 | 14.00 | pentatriacontane | 630-07-9 | C35H72 | 492 | 3500 | 87 | 0.96 |
| 34 | 14.14 | n-heneicosane | 629-94-7 | C21H44 | 296 | 2109 | 91 | 0.31 |
| 35 | 14.21 | octadecane | 593-45-3 | C18H38 | 254 | 1810 | 90 | 0.15 |
| 36 | 14.84 | isopropyl dodecanoate | 10233-13-3 | C15H30O2 | 242 | 1615 | 90 | 0.13 |
| 37 | 15.35 | phytane | 638-36-8 | C20H42 | 282 | 1753 | 87 | 0.14 |
| 38 | 15.69 | 4-ethylhexadecane | 25117-26-4 | C17H36 | 240 | 1647 | 88 | 0.17 |
| 39 | 15.76 | 8-methylheptadecane | 13287-23-5 | C18H38 | 254 | 1746 | 91 | 0.42 |
| 40 | 16.34 | n-mocosane | 629-97-0 | C22H46 | 310 | 2208 | 89 | 0.71 |
| 41 | 16.47 | nonahexacontanoic acid | 40710-32-5 | C69H138O2 | 998 | 7236 | 88 | 0.39 |
| 42 | 17.12 | 2-methyldodecane | 1560-97-0 | C13H28 | 184 | 1249 | 85 | 0.08 |
| 43 | 17.47 | methyl pentadecanoate | 7132-64-1 | C16H32O2 | 256 | 1779 | 92 | 0.08 |
| 44 | 18.03 | diisobutyl phthalate | 84-69-5 | C16H22O4 | 278 | 1908 | 81 | 0.05 |
| 45 | 19.11 | methyl palmitate | 112-39-0 | C17H34O2 | 270 | 1878 | 95 | 4.50 |
| 46 | 19.41 | tetradecyl ether | 5412-98-6 | C28H58O | 410 | 2880 | 85 | 0.26 |
| 47 | 19.64 | dotriacontane | 544-85-4 | C32H66 | 450 | 3202 | 87 | 0.48 |
| 48 | 19.75 | palmitic acid | 57-10-3 | C16H32O2 | 256 | 1968 | 93 | 2.94 |
| 49 | 19.96 | tetratetracontane | 7098-22-8 | C44H90 | 618 | 4395 | 89 | 0.52 |
| 50 | 20.12 | tetrapentacontane | 5856-66-6 | C54H110 | 758 | 5389 | 87 | 0.36 |
| 51 | 20.22 | hexatriacontane | 630-06-8 | C36H74 | 506 | 3600 | 81 | 0.22 |
| 52 | 22.35 | methyl linoleate | 112-63-0 | C19H34O2 | 294 | 2093 | 96 | 6.50 |
| 53 | 22.51 | methyl (9E)-9-octadecenoate | 1937-62-8 | C19H36O2 | 296 | 2085 | 94 | 11.48 |
| 54 | 22.62 | methyl oleate | 112-62-9 | C19H36O2 | 296 | 2085 | 91 | 0.51 |
| 55 | 22.99 | 3-methylheptadecane | 6418-44-6 | C18H38 | 254 | 1746 | 85 | 0.31 |
| 56 | 22.99 | squalane | 111-01-3 | C30H62 | 422 | 2619 | 84 | 0.31 |
| 57 | 23.11 | methyl stearate | 112-61-8 | C19H38O2 | 298 | 2077 | 93 | 0.49 |
| 58 | 23.21 | linoleic acid | 60-33-3 | C18H32O2 | 280 | 2183 | 92 | 1.51 |
| 59 | 23.39 | oleic acid | 112-80-1 | C18H34O2 | 282 | 2175 | 93 | 4.54 |
| 60 | 23.92 | alkynyl stearic acid | 34450-18-5 | C18H32O2 | 280 | 2165 | 81 | 0.88 |
| 61 | 24.07 | ethyl oleate | 111-62-6 | C20H38O2 | 310 | 2185 | 84 | 1.47 |
| 62 | 24.64 | hexacontane | 7667-80-3 | C60H122 | 842 | 5985 | 85 | 0.69 |
| 63 | 25.19 | palmityl acetate | 629-70-9 | C18H36O2 | 284 | 1978 | 93 | 0.62 |
| 64 | 25.19 | octacosyl acetate | 18206-97-8 | C30H60O2 | 452 | 3171 | 94 | 0.62 |
| 65 | 27.88 | tetracosane | 646-31-1 | C24H50 | 338 | 2407 | 94 | 0.42 |
| 66 | 28.55 | methyl icosanoate | 1120-28-1 | C21H42O2 | 326 | 2276 | 88 | 0.53 |
| 67 | 29.19 | oleamide | 301-02-0 | C18H35NO | 281 | 2228 | 83 | 0.20 |
| 68 | 29.62 | nonacosane | 630-03-5 | C29H60 | 408 | 2904 | 85 | 0.33 |
| 69 | 30.22 | 2,2’-methylenebis (6-tert-butyl-4-methylphenol | 119-47-1 | C23H32O2 | 340 | 2788 | 93 | 3.20 |
| 70 | 30.42 | stearyl acetate | 822-23-1 | C20H40O2 | 312 | 2177 | 84 | 0.26 |
| No. | Rt (min) | Loading Form | Molecular Formula | Precursor Ion | Fragment Ions | Difference (ppm) | Possible Compound | Structure Types | Reference |
|---|---|---|---|---|---|---|---|---|---|
| 1 | 1.14 | [M+H]+ | C6H14N4O2 | 175.1182 | 158.0904, 116.0704 | 4.6 | l-arginine | amino acids | [16] |
| 2 | 1.20 | [M+H]+ | C5H5N5 | 136.0611 | 119.0356 | 5.1 | adenine | purine derivatives | [17] |
| 3 | 1.40 | [M+H]+ | C5H9NO2 | 116.0701 | 70.0659 | 4.3 | proline | amino acids | [16] |
| 4 | 1.43 | [M+H]+ | C5H11NO2 | 118.0861 | 58.0672 | 1.7 | valine | amino acids | [16] |
| 5 | 1.99 | [M+H]+ | C6H13NO2 | 132.1017 | 86.0970, 69.0716 | 1.5 | 2-amino-4-methylpentanoic acid | amino acids | [16] |
| 6 | 2.01 | [M+H]+ | C9H12N2O6 | 245.0778 | 113.0339 | −4.1 | uridine | nucleoside | [17] |
| 7 | 2.14 | [M+H]+ | C5H5N5O | 152.0553 | 135.0292 | 9.2 | guanine | purine derivatives | [17] |
| 8 | 2.29 | [M+H]+ | C5H7NO3 | 130.0493 | 84.0447 | 4.6 | l-pyroglutamic acid | amino acids | [16] |
| 9 | 2.86 | [M+H]+ | C9H11NO2 | 166.0852 | 120.0805, 91.0576 | 6.6 | phenylalanine | amino acids | [16] |
| 10 | 3.34 | [M]+ | C21H26NO4 | 356.1847 | 280.1084 | 4.2 | xanthoplanine | alkaloids | [18] |
| 11 | 3.47 | [M+H]+ | C16H17NO3 | 272.1273 | 255.1017, 107.0441 | 2.9 | higenamine | alkaloids | [19] |
| 12 | 3.61 | [M+H]+ | C23H29NO8 | 448.1957 | 269.1175, 237.0916, 107.0438 | 2.0 | O6-methylhigenamine,7-O-D-glucopyranoside | others | [18] |
| 13 | 3.75 | [M+H]+ | C24H31NO9 | 478.2073 | 316.1557, 192.1000 | −0.2 | laudanosoline,6-mether,12-O-ß-D-glucopyranoside | others | [18] |
| 14 | 4.60 | [M+H]+ | C18H19NO4 | 314.1382 | 297.0970, 282.1241, 265.0262, 177.0320 | 1.6 | norisoboldine | alkaloids | [20] |
| 15 | 4.68 | [M+H]+ | C18H19NO3 | 298.1425 | 269.1156, 254.0966 | 4.4 | n-methylcrotsparine | alkaloids | [21] |
| 16 | 5.23 | [M+H]+ | C19H21NO4 | 328.1541 | 151.0756, 178.0802 | 0.6 | scoulerine | alkaloids | [22] |
| 17 | 5.40 | [M+H]+ | C17H19NO3 | 286.1429 | 269.1167, 179.0821, 164.0664, 107.0448, | 3.1 | coclaurine | alkaloids | [21] |
| 18 | 5.73 | [M+H]+ | C19H23NO4 | 330.1697 | 192.0893, 175.0211, 137.0146 | 0.9 | reticuline | alkaloids | [23] |
| 19 | 5.87 | [M+H]+ | C19H21NO4 | 328.1545 | 237.0906 | −0.6 | boldine | alkaloids | [23] |
| 20 | 6.01 | [M]+ | C20H24NO4+ | 342.1693 | 297.1117, 282.0895, 265.0853 | 3.5 | magnoflorine | alkaloids | [21] |
| 21 | 6.42 | [M+H]+ | C21H23NO5 | 370.1642 | 207.0719, 190.0827, 188.0774 | 1.9 | allocryptopine | alkaloids | [22] |
| 22 | 6.55 | [M+H]+ | C20H25NO4 | 344.1842 | 207.0815, 192.1007 | 4.1 | tembetarine | others | [18] |
| 23 | 6.83 | [M]+ | C19H24NO3 | 314.1751 | 209.0974, 175.0708 | 1.6 | oblongine | alkaloids | [18] |
| 24 | 6.83 | [M+H]+ | C19H23NO3 | 314.1751 | 206.1106 | 0.1 | armepavine | alkaloids | [18] |
| 25 | 6.85 | [M]+ | C19H24NO3 | 314.1751 | 269.1163, 107.0463 | 1.6 | magnocurarine | alkaloids | [24] |
| 26 | 7.43 | [M+H]+ | C22H27NO8 | 434.1806 | 356.1492 | 0.7 | fenfangjine G | alkaloids | [25] |
| 27 | 7.56 | [M+H]+ | C36H38N2O6 | 595.2800 | 227.1051 | 0.5 | 2-northalrugosine | others | [18] |
| 28 | 7.63 | [M+H]+ | C20H23NO4 | 342.1727 | 176.0717, 165.0911 | −7.9 | tetrahydrocolumbamine | alkaloids | [26] |
| 29 | 7.70 | [M+H]+ | C20H23NO4 | 342.1717 | 311.1442 | −5.0 | isocorydine | alkaloids | [26] |
| 30 | 8.58 | [M+H]+ | C37H40N2O6 | 609.2966 | 566.2543, 367.1639 | −1.1 | fangchinoline | alkaloids | [21] |
| 31 | 9.57 | [M+H]+ | C37H38N2O6 | 607.2796 | 564.2370, 227.1038 | 1.2 | cepharanthine | alkaloids | [21] |
| 32 | 10.25 | [M+H]+ | C21H25NO4 | 356.1855 | 251.1071 | 0.3 | glaucine | alkaloids | [17] |
| 33 | 10.69 | [M+H]+ | C38H42N2O6 | 623.3118 | 580.2693 | −0.3 | tetrandrine | alkaloids | [18] |
| 34 | 11.72 | [M+H]+ | C20H21NO4 | 340.1535 | 309.111 | 2.4 | dicentrine | alkaloids | [26] |
| 35 | 13.39 | [M+H]+ | C18H19NO2 | 282.147 | 191.0823, 207.0874 | 6.7 | o-nornuciferine | alkaloids | [27] |
| 36 | 15.32 | [M+H]+ | C19H21NO2 | 296.1641 | 235.0810, 191.0858 | 1.4 | nuciferine | alkaloids | [27] |
| 37 | 15.74 | [M+H]+ | C19H19NO3 | 310.1437 | 235.0759, 247.0758 | 0.3 | fenfangjine F | alkaloids | [25] |
| 38 | 16.12 | [M+H]+ | C18H17NO2 | 280.1319 | 249.0906, 219.0784, 191.0840 | 4.6 | roemerine | alkaloids | [21] |
| 39 | 16.34 | [M+H]+ | C19H19NO2 | 294.1482 | 233.0965 | 2.4 | dehydeonuciferine | others | [27] |
| 40 | 19.57 | [M+H]+ | C18H39NO3 | 318.2997 | 282.2769 | 1.9 | phytosphingosine | phospholipid | [28] |
| 41 | 25.99 | [M+H]+ | C18H33NO | 280.2626 | 263.2352, 135.1150, 109.0908 | 3.2 | linoleamide | amides | [29] |
| 42 | 26.98 | [M+H]+ | C18H30O2 | 279.2306 | 261.2213 | 4.7 | α-linolenic acid | fatty acids | [16] |
| 43 | 27.51 | [M+H]+ | C18H35NO | 282.2784 | 83.0867 | 2.5 | oleamide | amides | [30] |
| 44 | 28.45 | [M+H]+ | C18H32O2 | 281.2464 | 163.1380, 125.0847 | 3.9 | linoleic acid | fatty acids | [30] |
| 45 | 30.61 | [M+H]+ | C18H34O2 | 283.2616 | 171.1336, 265.2517 | 5.6 | oleic acid | fatty acids | [31] |
| 46 | 31.03 | [M+H]+ | C16H33NO | 256.2624 | 102.0933 | 4.3 | palmitamide | amides | [30] |
| 47 | 34.51 | [M+H]+ | C18H37NO | 284.2931 | 102.0924, 88.0722 | 6.0 | stearamide | amides | [30] |
| 48 | 11.78 | [M−H]− | C16H18O9 | 353.0871 | 191.0633 | −3.9 | chlorogenic acid | phenols | [21] |
| 49 | 13.73 | [M−H]− | C10H10O4 | 193.0553 | 134.0312 | 2.4 | ferulic acid | phenols | [32] |
| 50 | 30.54 | [M−H]− | C18H36O2 | 283.2665 | 197.0251 | −7.8 | stearic acid | fatty acids | [21] |
| Statistical Magnitude | Original Classification (Origin) | Discriminant Function Prediction Classification (Origin) | ||
|---|---|---|---|---|
| Non-Authentic Origins | Geo-Authentic Origins | Total | ||
| Number of samples | non-authentic origins | 2 | 1 | 3 |
| geo-authentic origins | 0 | 2 | 2 | |
| Percentage (%) | non-authentic origins | 67 | 33 | 100 |
| geo-authentic origins | 0 | 100 | 100 | |
| Compound | Precursor Ion (m/z) | Product Ion (m/z) | Fragmentor (V) | Collision Energy (V) | Ion Mode |
|---|---|---|---|---|---|
| tetrandrine | 623.2 | 580.1 | 80 | 45 | Positive |
| fangchinoline | 609.3 | 566.2 | 224 | 45 | Positive |
| isocorydine | 342.2 | 279.1 | 80 | 15 | Positive |
| magnoflorine | 342.1 | 297.1 | 80 | 30 | Positive |
| higenamine | 272.1 | 107.0 | 80 | 28 | Positive |
| boldine | 328.2 | 265.0 | 80 | 20 | Positive |
| magnocurarine | 314.2 | 269.1 | 113 | 20 | Positive |
Publisher’s Note: MDPI stays neutral with regard to jurisdictional claims in published maps and institutional affiliations. |
© 2022 by the authors. Licensee MDPI, Basel, Switzerland. This article is an open access article distributed under the terms and conditions of the Creative Commons Attribution (CC BY) license (https://creativecommons.org/licenses/by/4.0/).
Share and Cite
Cao, X.; Miao, X.; Ge, M.; Zhang, M.; Lv, Z.; Wang, W.; Chang, Y.; Ouyang, H.; He, J. Exploration of Habitat-Related Chemical Markers for Stephania tetrandra Applying Multiple Chromatographic and Chemometric Analysis. Molecules 2022, 27, 7224. https://doi.org/10.3390/molecules27217224
Cao X, Miao X, Ge M, Zhang M, Lv Z, Wang W, Chang Y, Ouyang H, He J. Exploration of Habitat-Related Chemical Markers for Stephania tetrandra Applying Multiple Chromatographic and Chemometric Analysis. Molecules. 2022; 27(21):7224. https://doi.org/10.3390/molecules27217224
Chicago/Turabian StyleCao, Xiunan, Xinxin Miao, Minglei Ge, Mengmeng Zhang, Zhenguo Lv, Wei Wang, Yanxu Chang, Huizi Ouyang, and Jun He. 2022. "Exploration of Habitat-Related Chemical Markers for Stephania tetrandra Applying Multiple Chromatographic and Chemometric Analysis" Molecules 27, no. 21: 7224. https://doi.org/10.3390/molecules27217224
APA StyleCao, X., Miao, X., Ge, M., Zhang, M., Lv, Z., Wang, W., Chang, Y., Ouyang, H., & He, J. (2022). Exploration of Habitat-Related Chemical Markers for Stephania tetrandra Applying Multiple Chromatographic and Chemometric Analysis. Molecules, 27(21), 7224. https://doi.org/10.3390/molecules27217224