Article

The Hydrolysis Rate of Paraoxonase-1 Q and R Isoenzymes: An In Silico Study Based on In Vitro Data

by
Sedat Karabulut
1,*,
Basel Mansour
1,
Gerardo M. Casanola-Martin
2,
Bakhtiyor Rasulev
2,* and
James W. Gauld
1
1
Department of Chemistry and Biochemistry, University of Windsor, Windsor, ON N9B 3P4, Canada
2
Department of Coatings and Polymeric Materials, North Dakota State University, 1735 NDSU Research Park Dr, Fargo, ND 58102, USA
*
Authors to whom correspondence should be addressed.
Molecules 2022, 27(20), 6780; https://doi.org/10.3390/molecules27206780
Submission received: 3 September 2022 / Revised: 30 September 2022 / Accepted: 5 October 2022 / Published: 11 October 2022
(This article belongs to the Special Issue QSAR and QSPR: Recent Developments and Applications III)

Abstract

:
Human serum paraoxonase-1 (PON1) is an important hydrolase-type enzyme found in numerous tissues. Notably, it can exist in two isozyme-forms, Q and R, that exhibit different activities. This study presents an in silico (QSAR, Docking, MD and QM/MM) study of a set of compounds on the activity towards the PON1 isoenzymes (QPON1 and RPON1). Different rates of reaction for the Q and R isoenzymes were analyzed by modelling the effect of Q192R mutation on active sites. It was concluded that the Q192R mutation is not even close to the active site, while it is still changing the geometry of it. Using the combined genetic algorithm with multiple linear regression (GA-MLR) technique, several QSAR models were developed and relative activity rates of the isozymes of PON1 explained. From these, two QSAR models were selected, one each for the QPON1 and RPON1. Best selected models are four-variable MLR models for both Q and R isozymes with squared correlation coefficient R2 values of 0.87 and 0.83, respectively. In addition, the applicability domain of the models was analyzed based on the Williams plot. The results were discussed in the light of the main factors that influence the hydrolysis activity of the PON1 isozymes.

1. Introduction

Human serum Paraoxonase-1 (PON1) is a physiologically important Ca2+-dependent hydrolase enzyme. Indeed, it is widely distributed among tissues, such as liver, kidney, intestine and serum, and can hydrolyze a variety of substrates [1,2]. PON1 is biosynthesized mainly in the liver and secreted into the blood where it associates predominantly with high-density lipoprotein (HDL) [3,4,5,6], due to a hydrophobic signal sequence in its N-terminal region [7]. PON1 isoforms are known to have a broad range of roles including being involved in mediating against cardiovascular diseases, drug metabolism and bacterial infections [8,9]. These roles reflect the fact that it can hydrolyze a wide variety of lactones, thiolactones, aryl esters, cyclic carbonates, organophosphorus compounds and estrogen esters [10,11,12]. For instance, one group of potentially important lactone substrates is the statins, which inhibit cellular cholesterol synthesis and are widely used to reduce LDL-cholesterol to prevent cardiovascular diseases [2,7]. Meanwhile, PON1 can also degrade several therapeutic drugs, organophosphorus compound pesticides, as well as nerve gases such as Sarin and Soman [13,14]. Indeed, PON1 was first described in the 1940s when Mazur observed that mammalian tissues exhibited enzymatic activity capable of hydrolyzing organophosphate pesticides [15]. The enzymes were further classified by Norman Aldridge as “A”-esterase if they were capable of hydrolyzing organophosphorus compounds, as opposed to “B”-esterase which are inhibited by organophosphorus compounds [16]. Ultimately, the common use of the organophosphorus compound derivative paraoxon as a substrate for the enzyme led to the universal adoption of the name Paraoxonase [13].
Based on structures obtained as part of X-ray crystallographic studies on PON1, it has been concluded that its active site is accessed via a lidded channel [17]. Furthermore, while the enzyme contains two Ca2+ ions, only one has a catalytically critical role, while the other helps to provide structural stability [17]. One of the clearly proposed catalytic mechanisms involves a Histidine–Histidine (His-His) catalytic dyad as shown in Figure 1 [18,19]. More specifically, it has been proposed that one histidyl (His115) helps in generation of a reactive hydroxyl by acting as a general base to deprotonate a water molecule. Meanwhile, the second histidyl (His134) acts as a proton shuttle to help with increasing the basicity of His115 [11,20]. Unfortunately, the exact mechanism of PON1 remains unclear. For example, it is known that ethyl acetate is not hydrolyzed while γ-butyrolactone, which contains the same number of atoms and ester moiety, is hydrolyzed by PON1 [1,21].
Significantly, however, human PON1 possesses two common polymorphic sites. One occurs at residue 55 and is normally either a leucine or methionine, and results in an increase at Paraoxonase activity and quantitative differences in enzyme concentration [22]. The other site exists at residue 192 and is either a glutamine (Q) or arginine (R), and as a result are commonly referred to as the Q and R isozymes, respectively. Importantly, the two isozymes (QPON1 and RPON1) have marked qualitative differences [21,23,24,25,26]. As noted above, PON1 possesses hydrolytic activity against organophosphorus compounds which includes some therapeutic drugs, and toxins, such as Paraoxon or chemical warfare agents such as Soman, Sarin and Tabun [13,27,28,29]. However, measurement of the Paraoxonase activity of human serum samples produces a bimodal distribution and is due to the Q/R polymorphism [25]. More specifically, the Q-isozymes exhibit lower activity, while the QR heterozygotes and R homozygotes possess higher activity [8,21,30] against most of the substrates. Consequently, it has been suggested that the Q/R polymorphism of PON1 affects an individual person’s response to, for instance, several toxic substrates [21,31]. Thus, PON1 polymorphism is of considerable interest due to its possible association with a number of diseases such as cardiovascular disease [32,33,34,35,36,37], carotid atherosclerosis [38], Parkinson [39,40], panic disorder [41], multiple sclerosis [42] and Alzheimer’s disease [43]. Previously, PON1 esterase and organophosphatase activities have been described in the literature and included data on substrate structure–activity relationship, lipoprotein effects, kinetics, HDL binding and the effects of salts on activities [24,25,26,27,30,44]. In particular, it has been experimentally reported that the different hydrolyze activities observed for QPON1 versus RPON1 are due to the molecular structure of the substrate [18,21,28]. Unfortunately, despite the physiological importance of PON1 and the clear need to develop better ligand and therapeutic agents, the mechanistic-related explanation for the different reaction rates of QPON1 and RPON1 remains unclear.
In this study, we have complementarily applied multi-scale computational chemistry modeling and QSAR to gain insights into the hydrolysis rate of PON1 and its two isozymes. However, to our knowledge, there has not yet been published any study explaining the different rate of activity of the QPON1 and RPON1, especially by means of quantitative structure–activity relationship (QSAR) approach. Despite the physiological importance, the explanation of different reaction rates for QPON1 and RPON1 has never been completed before.
More specifically, two QSAR models have been built and developed for the activity of the QPON1 and RPON1 against 30 substrates. In addition, unbounded (i.e., no substrate) and substrate-bounded QPON1 and RPON1 have been investigated by systematically applying Docking, Molecular Dynamics (MD) and QM/MM methods to gain an understanding of the effect of Q192R mutation on the active site architecture.

2. Materials and Methods

Experimental rates of hydrolysis for QPON1 and RPON1 were reported in the literature by, for example, Billecke et al. [21] and Davies et al. [28]. From the available experimentally studied ligands, a total of 30 compounds (lactones and thiolactones of varying sizes, phenyl acetate and five important organophosphorus compounds) were selected and used for the QSAR studies of QPON1 and RPON1. PON1 is not a Paraoxonase nor an esterase but a lactonase [11], that is why most of the database is composed of lactones. The species selected are shown in Table 1 along with, for convenience, their experimentally measured rates (from ref. [21,28]) of hydrolysis by both QPON1 and RPON1). Phenylacetate is generally accepted as one of the best substrates for experimental studies [45,46,47]. As a result, it was used as the reference compound for experimental studies by, for instance, Billecke et al. [21]. Hence, we have also chosen to relate all of the calculated lactonase and organophosphatase activities to the aryl esterase activity of phenyl acetate.
The Reactant-Complex (RC) model is used in the substrate–enzyme computational models (Docking, MD and QM/MM) (Figure 1). The most reliable and suitable pose was selected from docking results for further MD, QM/MM calculations according to the position and the distance of Ligand, His115 and Ca2+ ion.
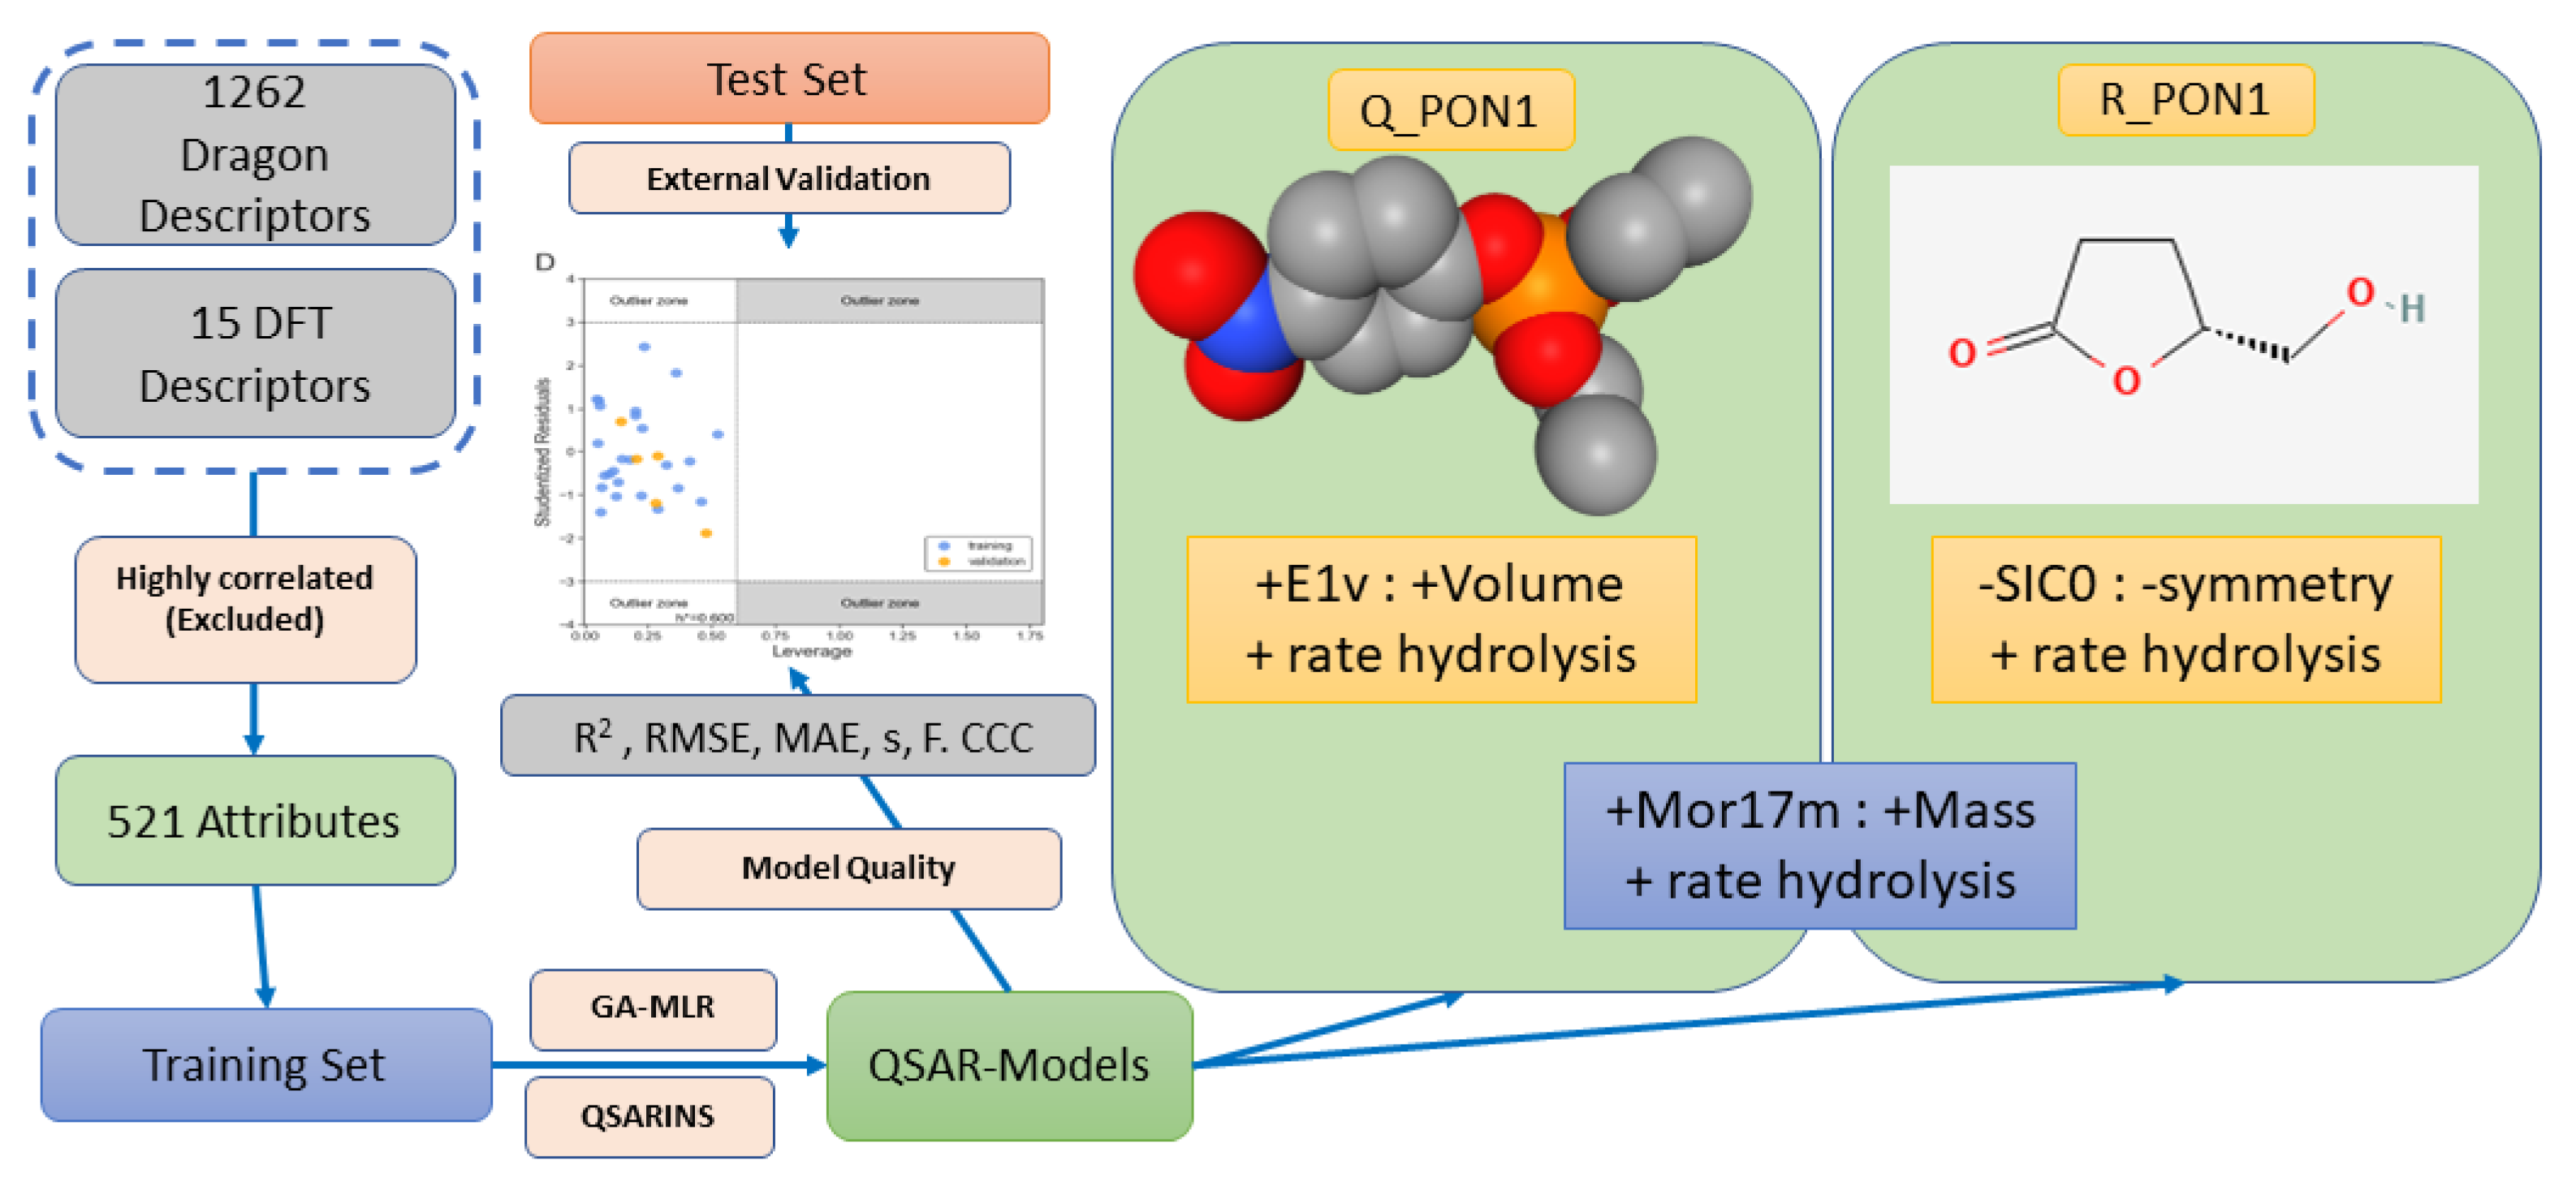
The general computational workflow used is illustrated in Figure S1 (Supplementary Materials), while the steps used to create the QSAR models are summarized in Figure 2.
It is noted that we have used similar approaches to develop QSAR models and studies, including analysis for various biological activity and toxicity [48,49].
Genetic algorithm-multi-linear regression (GA-MLR) was performed to develop robust QSAR models. The statistical quality and internal predictivity of the best MLR models were judged by the following statistical parameters: the coefficient of determination (R2), the leave-one-out cross-validation (Q2LOO) and leave-many-out cross-validation (Q2LMO). In addition, for each model the standard error of estimation was reported. Root Mean Squared Errors (RMSE) for the training (RMSETR) and external prediction sets (RMSEEXT), that summarize the overall error of the model, were calculated as an additional measure of the accuracy for the generated QSAR models.
In the case of good external prediction, the calculated values should be close to the observed activity values. The presence of outliers in any model may change its predictive accuracy. Fortunately, there are many methods to detect outliers including identification of those compounds with significantly higher standard residuals from regression-based techniques [50,51,52]. A compound can be identified as a response outlier in MLR models only if the standardized residual is greater than three standard deviation units. In this present study, those chemicals which were structurally very influential in determining the model statistics parameters (i.e., creating leverage effect), were indicated via a Williams plot. To construct the Williams plot, hat values, hi, were calculated according to the following equation:
hi = Xi(XT X)−1XTi (i = 1,………n)
where Xi is the descriptor vector of the compound ‘i’; X is the descriptor matrix derived from the training set descriptor values; and XT is its transpose matrix. The critical hat value (h*) was determined as:
h* = 3(p + 1)/n
where n is the number of training compounds and p is the number of selected descriptors. Thus, the leverage and the standardized residual were combined for the characterization of the applicability domain (AD). The AD of the models was then verified using the ranges of descriptors that appeared in the model and activity values, and the leverage approach. Compounds in the test set that were predicted due to extrapolation of the model (i.e., fall outside the AD) were detected when their leverage values were greater than the critical hat value (h*) [51,52].
First, the Molecular Operating Environment’s (MOE) [53] MM energy minimization tool was used to allow the substrates to relax and remove any atoms’ interference (Force Field: Amber14: EHT; R-Field 1:80; Cutoff [8,10]) that were then imported into the Dragon 6.0 software [54] to calculate molecular descriptors. A subset of 1276 molecular descriptors were selected from the initial set of more than 4500 calculated descriptors. For the GA-MLR, these Dragon-derived descriptors were then combined with 15 DFT-derived descriptors: total energy (a.u.), RMS (a.u.), dipole moment (debye), zero-point corrected energies, thermal (298.15 K) corrected energies, enthalpy (298.15 K) corrected energies, Gibb’s free energies (298.15 K), HOMO and LUMO energies, hardness and softness, electronegativity, electrophilicity and frequencies and intensities of (P)C=O stretching. It is noted that all compounds in the dataset contain a carbonyl or phosphonyl group (see Table 1), thus, the frequency and intensity of stretching of this groups were included in the descriptors as they are central to the mechanism and possibly the rate of reaction. Hardness, softness, electronegativity and electrophilicity were calculated from HOMO and LUMO energies by standard approaches. Optimized structures and harmonic vibrational frequencies for the dataset compounds were obtained at the M06-2X/6-31G(d,p) level of theory using Gaussian 16 [55]. To perform the analysis, a logarithmic function of experimental rate of reaction values (log(exp)), which were considered as a response variable, and 1291 independent variables were imported into the QSARINS 2.2.1 software [56] to apply a GA–MLR methodology to select the most relevant descriptors. Highly correlated (95%) descriptors (785) were eliminated; finally, 521 descriptors were selected for GA-MLR. The entire data were divided between a training and test set (80:20, respectively) during GA-MLR. Test set compounds were chosen as each fifth by descending order of response. The training and test sets were used to build the QSAR model and for validation, respectively. Finally, the descriptors listed in Table 2 were selected as the most relevant ones for each of QPON1 and RPON1. The density distribution plots of the selected descriptors (violin plots) for both QPON1 and RPON1 models are showed in Figures S5 and S6.
Docking, MD and QM/MM: A suitable X-Ray crystal structure of human serum PON1 was obtained from the protein data bank (PDB ID: 3SRG) and used as a template for further treatment. Lys192 was mutated to Arg and Glu amino acids, using PyMol software [57], to obtain a structure for RPON1 and QPON1. The crystal structure preparation and docking were completed using MOE package. The energy minimization results were achieved by using the energy minimization algorithm in MOE, and Amber14 forcefield was used [58]. Moreover, the best pose, from the docking, was selected for further MD calculation. Two different sets of QM/MM calculations were performed; the first one is substrate unbounded, and the second one is enzyme–substrate (selected substrates) complexes (Table 3).
Holoenzyme (i.e., no bound substrate) forms of both QPON1 and RPON1 were modeled to better understand the effects of the mutation on the active site. The topologies for the substrates were created using AmberTools22 [59] using General Amber Forcefield (GAFF) [60]. The enzymes’ topologies were created using Gromacs2021.2 package [61] and Amberff99SB force field [62]. In particular, the enzymes were solvated by a 5 Å spherical layer of water molecules using the SPCE tool in GROMACS 2021.2, which was also used for all MD simulations. Counter ions were added to reach the neutral state. The energy of each structure was then minimized using GROMACS 2021.2 energy minimization algorithm. The final structure was then allowed to thermally relax at a constant temperature and pressure. In particular, velocity rescaling (V-rescale) [63] and Berendsen [64] thermostats were coupled with the equations of motion for the NVT and NPT equilibration steps, where a 2-fs step time was set for numerical equation. More specifically, the systems were equilibrated at 310 K for 1 ns, after which the system was set to 20 ns of MD production. These time periods were selected to better understand the motion nature of the ligands, and the effect of the mutations on the active site, and to allow the water molecules to diffuse inside the active site. The same protocol was used for all systems. Default cut-offs for columbic electrostatic interactions and Van der Waals effects were used, i.e., they decay over distance with a final cut-off of 10 Å. A suitable structure from the MD calculations was then selected and used for further treatment by QM/MM for γ-Butyrolactone, Phenylacetate, Paraoxon and Sarine.
All QM/MM calculations were performed using the ONIOM formalism in Gaussian 16 [55]. Optimized geometries were obtained at the ONIOM(B3LYP/6-31G(d,p):AMBER96) level of theory. AMBER96 is the default forcefield in Gaussian 16. The high layer (QM layer) included the active site: the selected substrates, the calcium ion, crucial residues, and waters within 4.5 Å of it. The remaining region (MM-layer), which included the residue 192, was described using the AMBER96 force field.

3. Results and Discussion

As noted above, PON1 is a multi-functional antioxidant enzyme that can hydrolyze organophosphorus compounds, aryl and vinyl esters, lactones and thiolactones [45]. Thus, in order to create an inclusive QSAR model [62,63,64,65], each of these functional groups were included in the dataset (see Table 1).
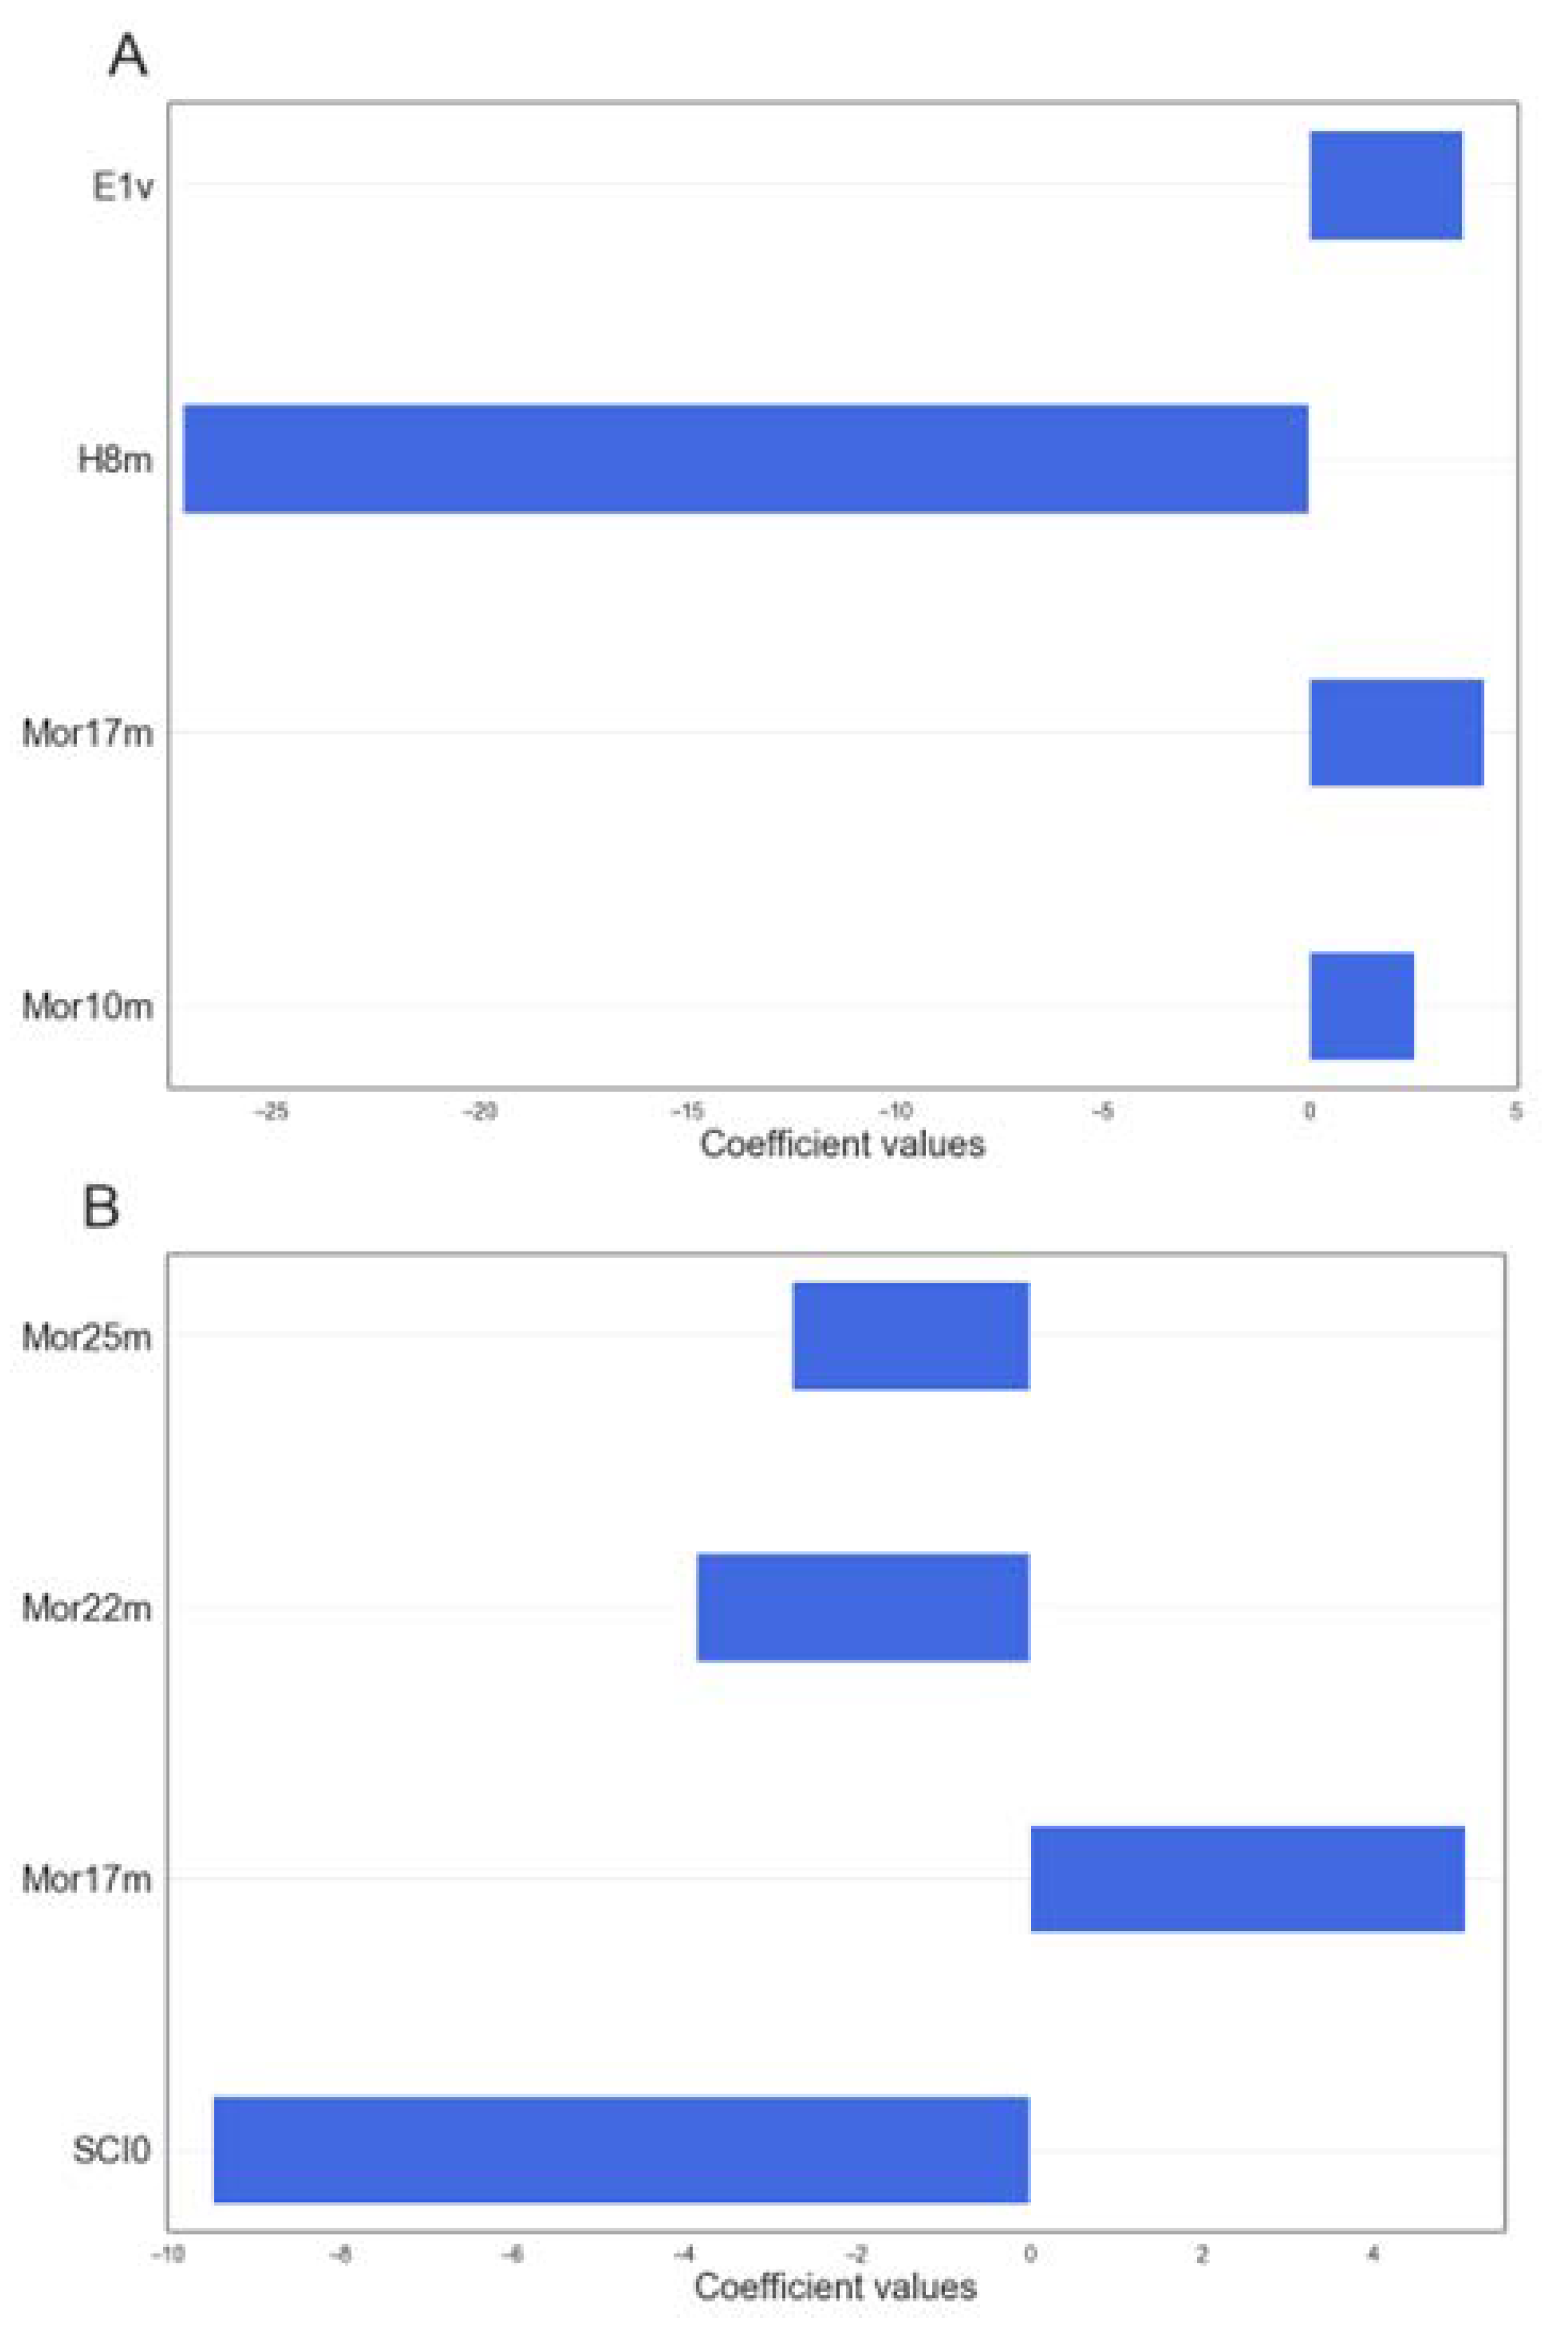
A best model for QPON1 and RPON1 was selected using the multi-criteria decision making (MCDM) tool within QSARINS, and the resulting equations are shown below; Equations (3) and (4), respectively. Meanwhile, the relation between the descriptors and the rate of hydrolysis of the Q and R isoenzymes is summarized in Figure 3. As can be seen, the responses are a logarithmic function of rate of hydrolysis and its distribution across the dataset are depicted in Figures S7 and S8. According to the selected models in Equations (3) and (4), Mor10m, Mor17m and E1v are directly proportional to the QPON1 activity rate and H8m shows a negative effect in the response. For RPON1 (Equation (4)) the only descriptor with a positive contribution to the activity is Mor17m (Figure 3). It should be noted that Mor17m appears in both models and with positive contributions in both cases. Besides the density distribution plots of the descriptors (violin plots) for both QPON1 and RPON1 models are shown in Figures S5 and S6.
Log (A_QPON1) = −0.487 + 2.066*Mor10m + 3.970*Mor17m + 3.319*E1v − 25.907*H8m
Log (A_RPON1) = 4.879 − 9.472*SIC0 + 5.054*Mor17m − 3.861*Mor22m − 2.763Mor25m
As summarized in Figure 3, there are 3D-MoRSE descriptors in both models (two for Q model and three for R model). The 3D-MoRSE indicates the 3D molecular representations of structure-based electron diffraction; additionally, these descriptors are member of Highly Conformational Dependent (HCD) descriptors [66,67]. All four 3D-MoRSE descriptors are weighted by mass, which practically eliminates the role of hydrogen atoms, while significantly increases the effect of phosphorus, sulfur and chlorine and greatly increases the effect of heavy atoms such as bromine and iodine on the values of 3D-MoRSE descriptors [66]. Moreover, in the case of the model for the Q isoyenzyme, we have the E1v molecular descriptor that is a WHIM index weighted by Van der Waals volume, indicating some role related to the conformation of the molecule. So, it can be concluded that the conformation and heavy atom profile of the substrates are very important factors for the rate of reaction, especially for RPON1.
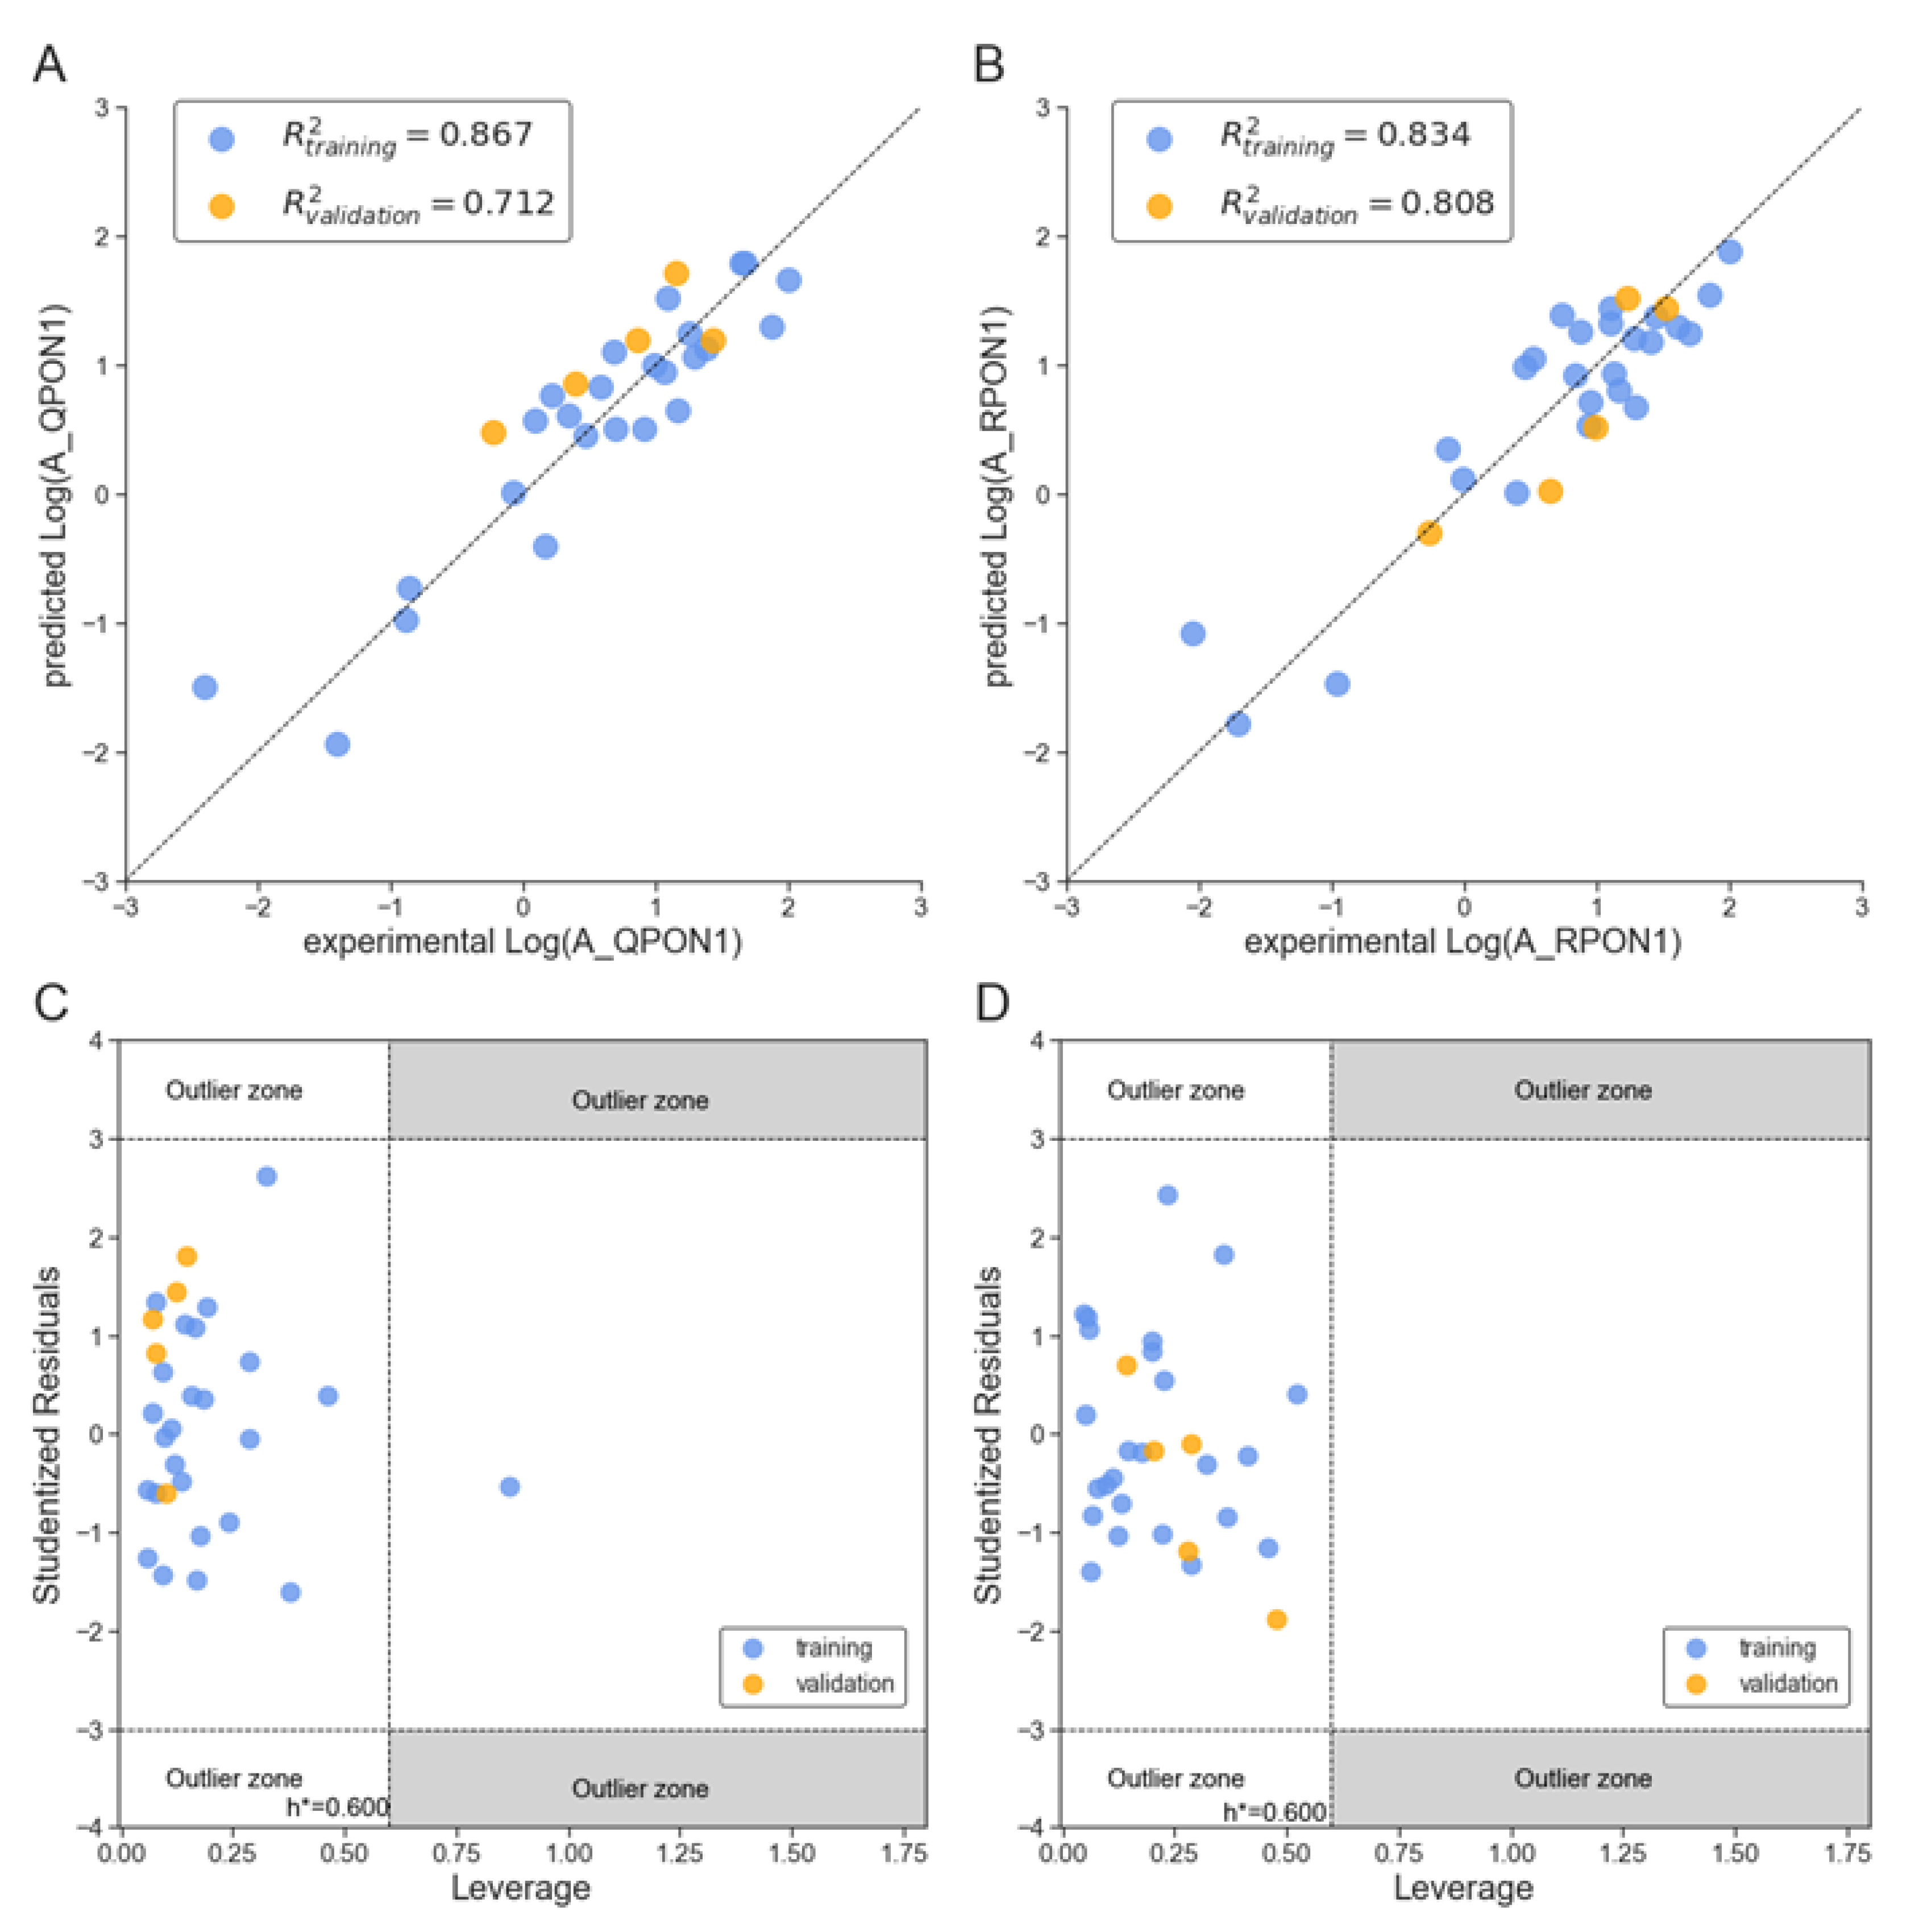
We also compared the experimental endpoint vs. predicted values using the current models (Equations (3) and (4)), as well as Williams plots, and shown in Figure 4. For both QPON1 (Figure 4A,C) and RPON1 (Figure 4B,D). there is generally a good agreement between experimentally obtained and predicted data. The fitting criteria, external and internal validation results are also supporting the agreement (Table 4 and Table 5). The y-scrambling results for both models (QPON1 and RPON1) are provided in Figure S4.
As noted in the introduction, experimentally it has been observed that QPON1 exhibits a higher rate of hydrolysis for some substrates (e.g., diazoxon), while RPON1 exhibits a higher rate of hydrolysis for others (e.g., paraoxon) [6,21,37]. Thus, we then considered a Molecular Dynamics (MD) simulation to examine the interaction between the substrates and the active site vs. time. Moreover, the MD calculation will also give an insight into the effect of the mutants, QPON1 and RPON1, on the active site’s residues. The MD calculation was completed for four different substrates from different substrate classes, i.e., γ-Butyrolactone, Phenylacetate, Paraoxon and Sarine (Table 3). The distances between Hist115 and the selected substrates, Hist115 and the Ca2+, and the Ca2+ and the residue 192 are critical for the mechanism and rate of reaction, for this reason they are graphically (Figure S4) and averagely (Table 6) reported. Additionally, the Root Mean Square Deviation (RMSD) of the backbone, the Gln192/Arg192 and the substrates were obtained based on the enzyme–substrate complex (RC) (Figure 1) are reported in Figure S3.
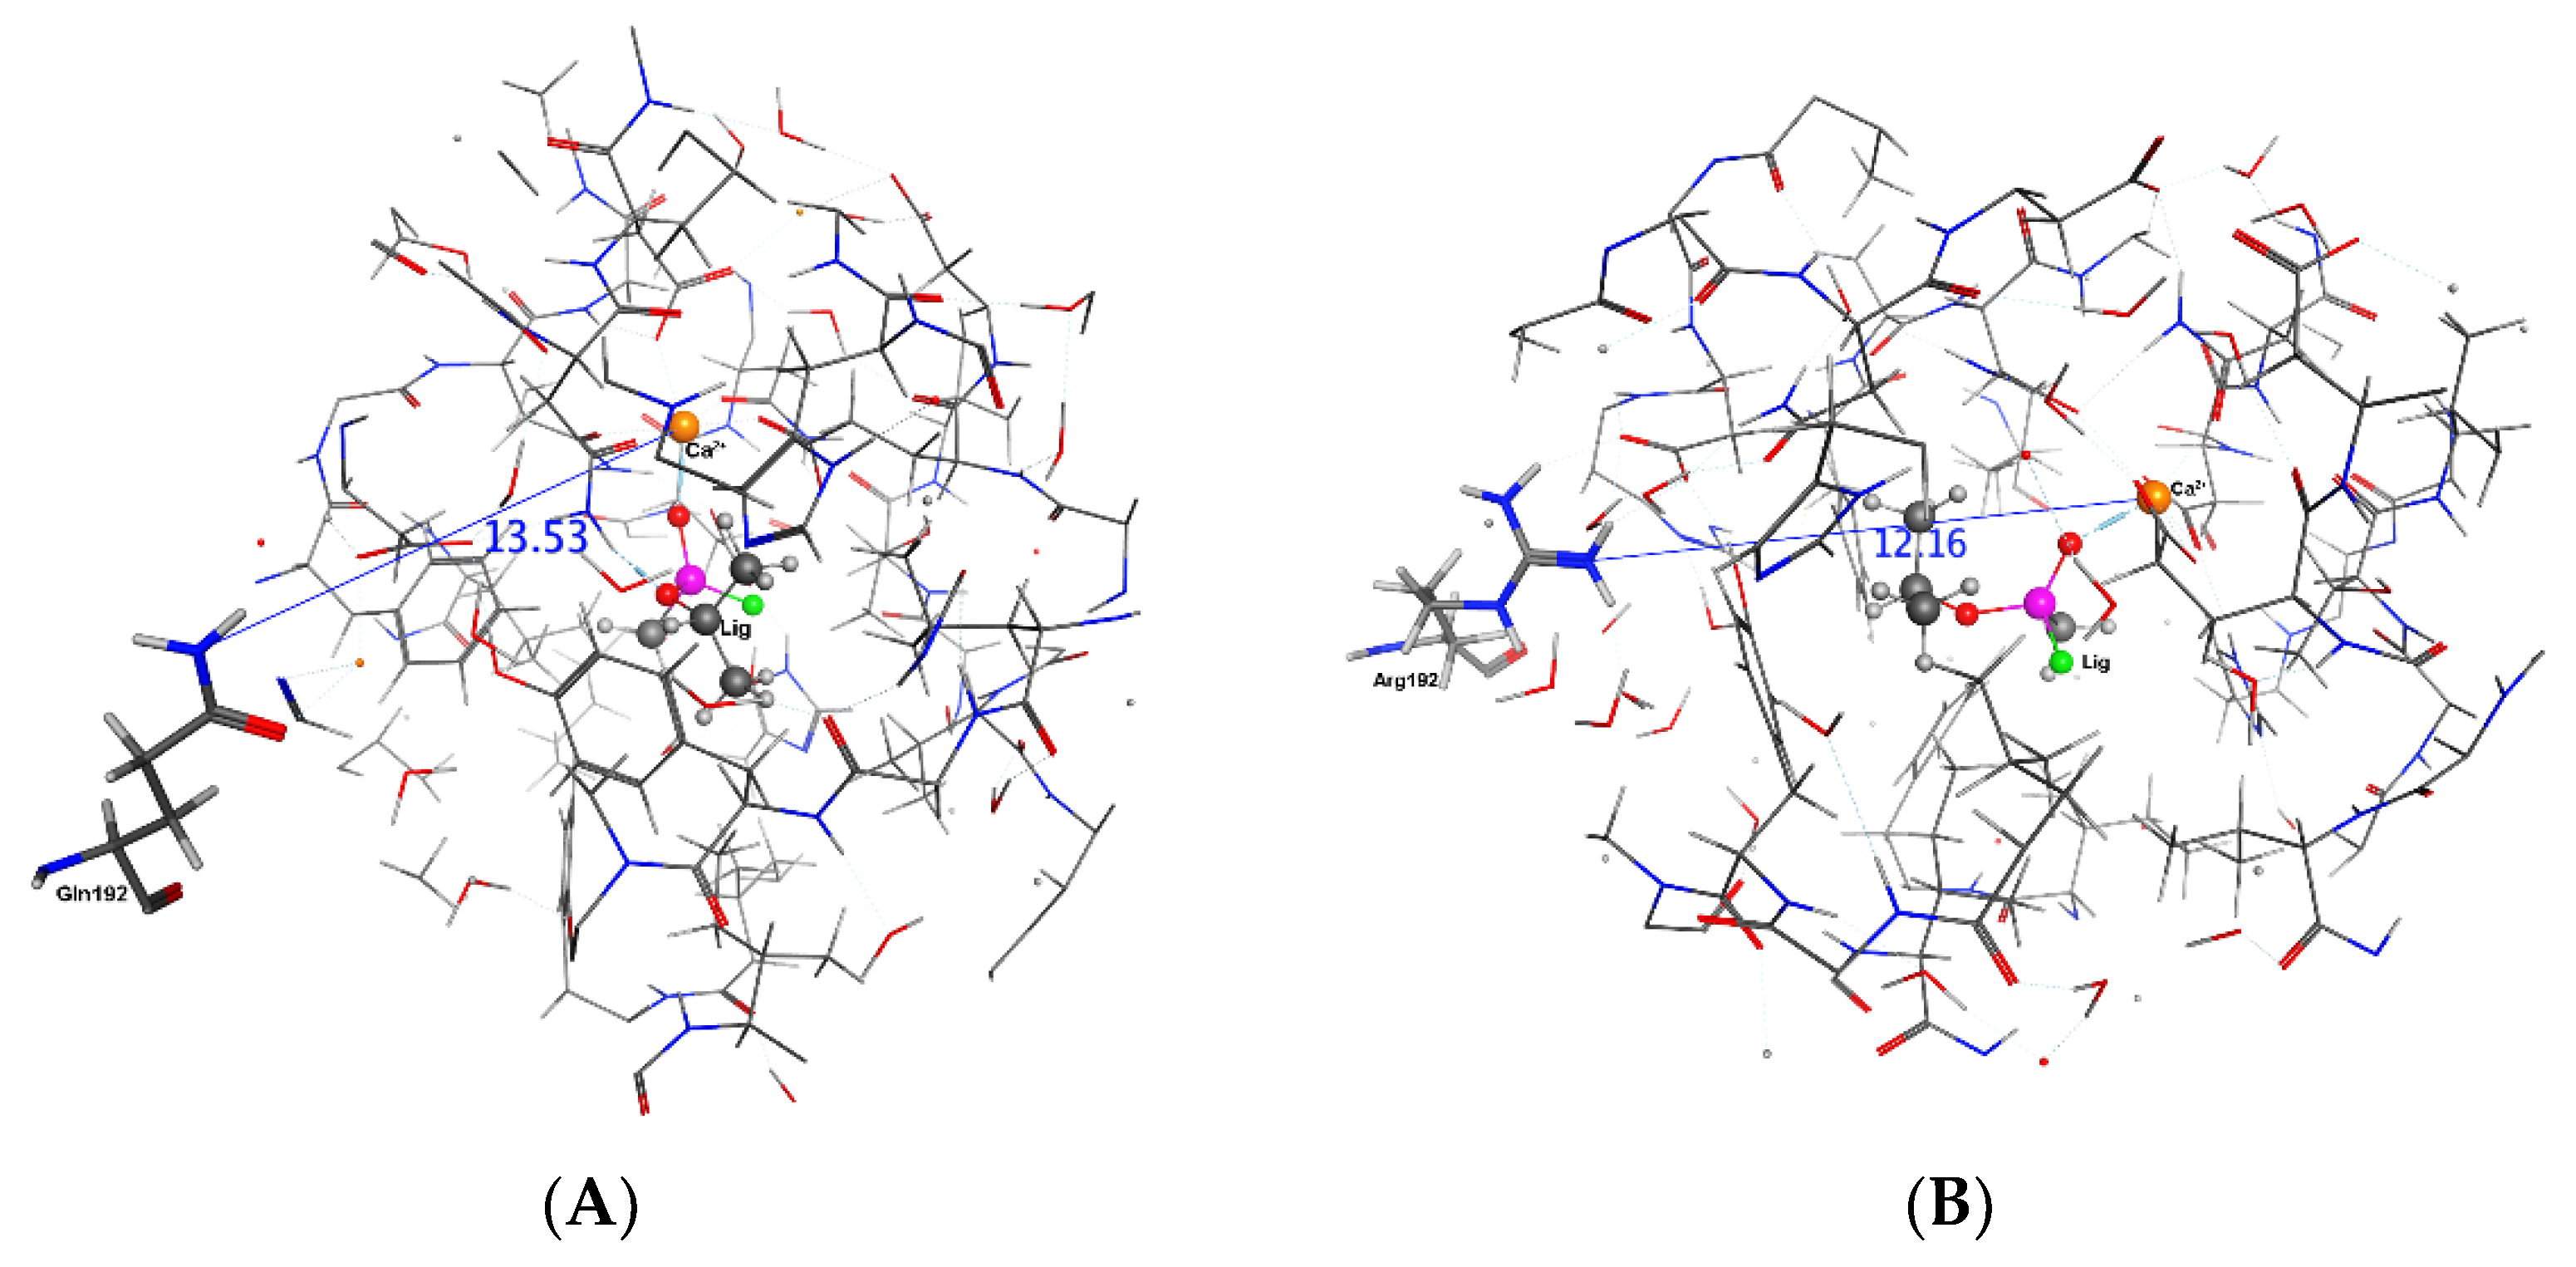
Experimentally, the rate of hydrolysis of phenylacetate for both QPON1 and RPON1 is set as 100 with relative rates for each isozyme then determined with respect to these values. The MD calculations may support these results. In complex 14, the average distances between Arg/Gln192---Ca2+, His115---Ca2+ in QPON1, and RPON1 isoenzymes over 20 ns are mentioned in Table 6. The distances are relatively smaller in RPON1 than that of the QPON1 in all selected complexes except sarin. Thus, the closer the distance between mutation site residue 192 to the active site is, this causes a shortening of the distance between the His115 and Ca2+ ion. This phenomenon is reversed when sarin is a ligand, which may be related to the different orientation of sarin than others in the active site (Figure 5). Interestingly, in the Phenylacetate complex (Figure 6), the distance between Gln192---Ca2+ is almost as the same as Arg192---Ca2+ which means the mutation is not effecting the distance to the active site, yet the distance between His115---Ca2+ is still smaller in the RPON1 Isoenzyme than QPON1 Isoenzyme.
It can be seen in Table 6 that including a ligand in active site is not causing the same effect on reported distances. For example, penetration of sarin (Figure 8) to the active site is increasing the distance between the His115 and Ca2+ ion for both isozymes; however, paraoxon (Figure 7) and phenylacetate are reducing for R and increasing for Q. It can be concluded that the mechanism is highly sensitive to mutation and substrate molecular structure and this conclusion is in harmony with QSAR and experimental literature [11]. However, there is a unique substrate effect on the distances between the mutated residue and Ca2+. All substrates increased the distance between the mutated residue and Ca2+ at QPON1 and reduced at RPON1, except Paraoxon (Table 6, Figure 6, Figure 7 and Figure 8).
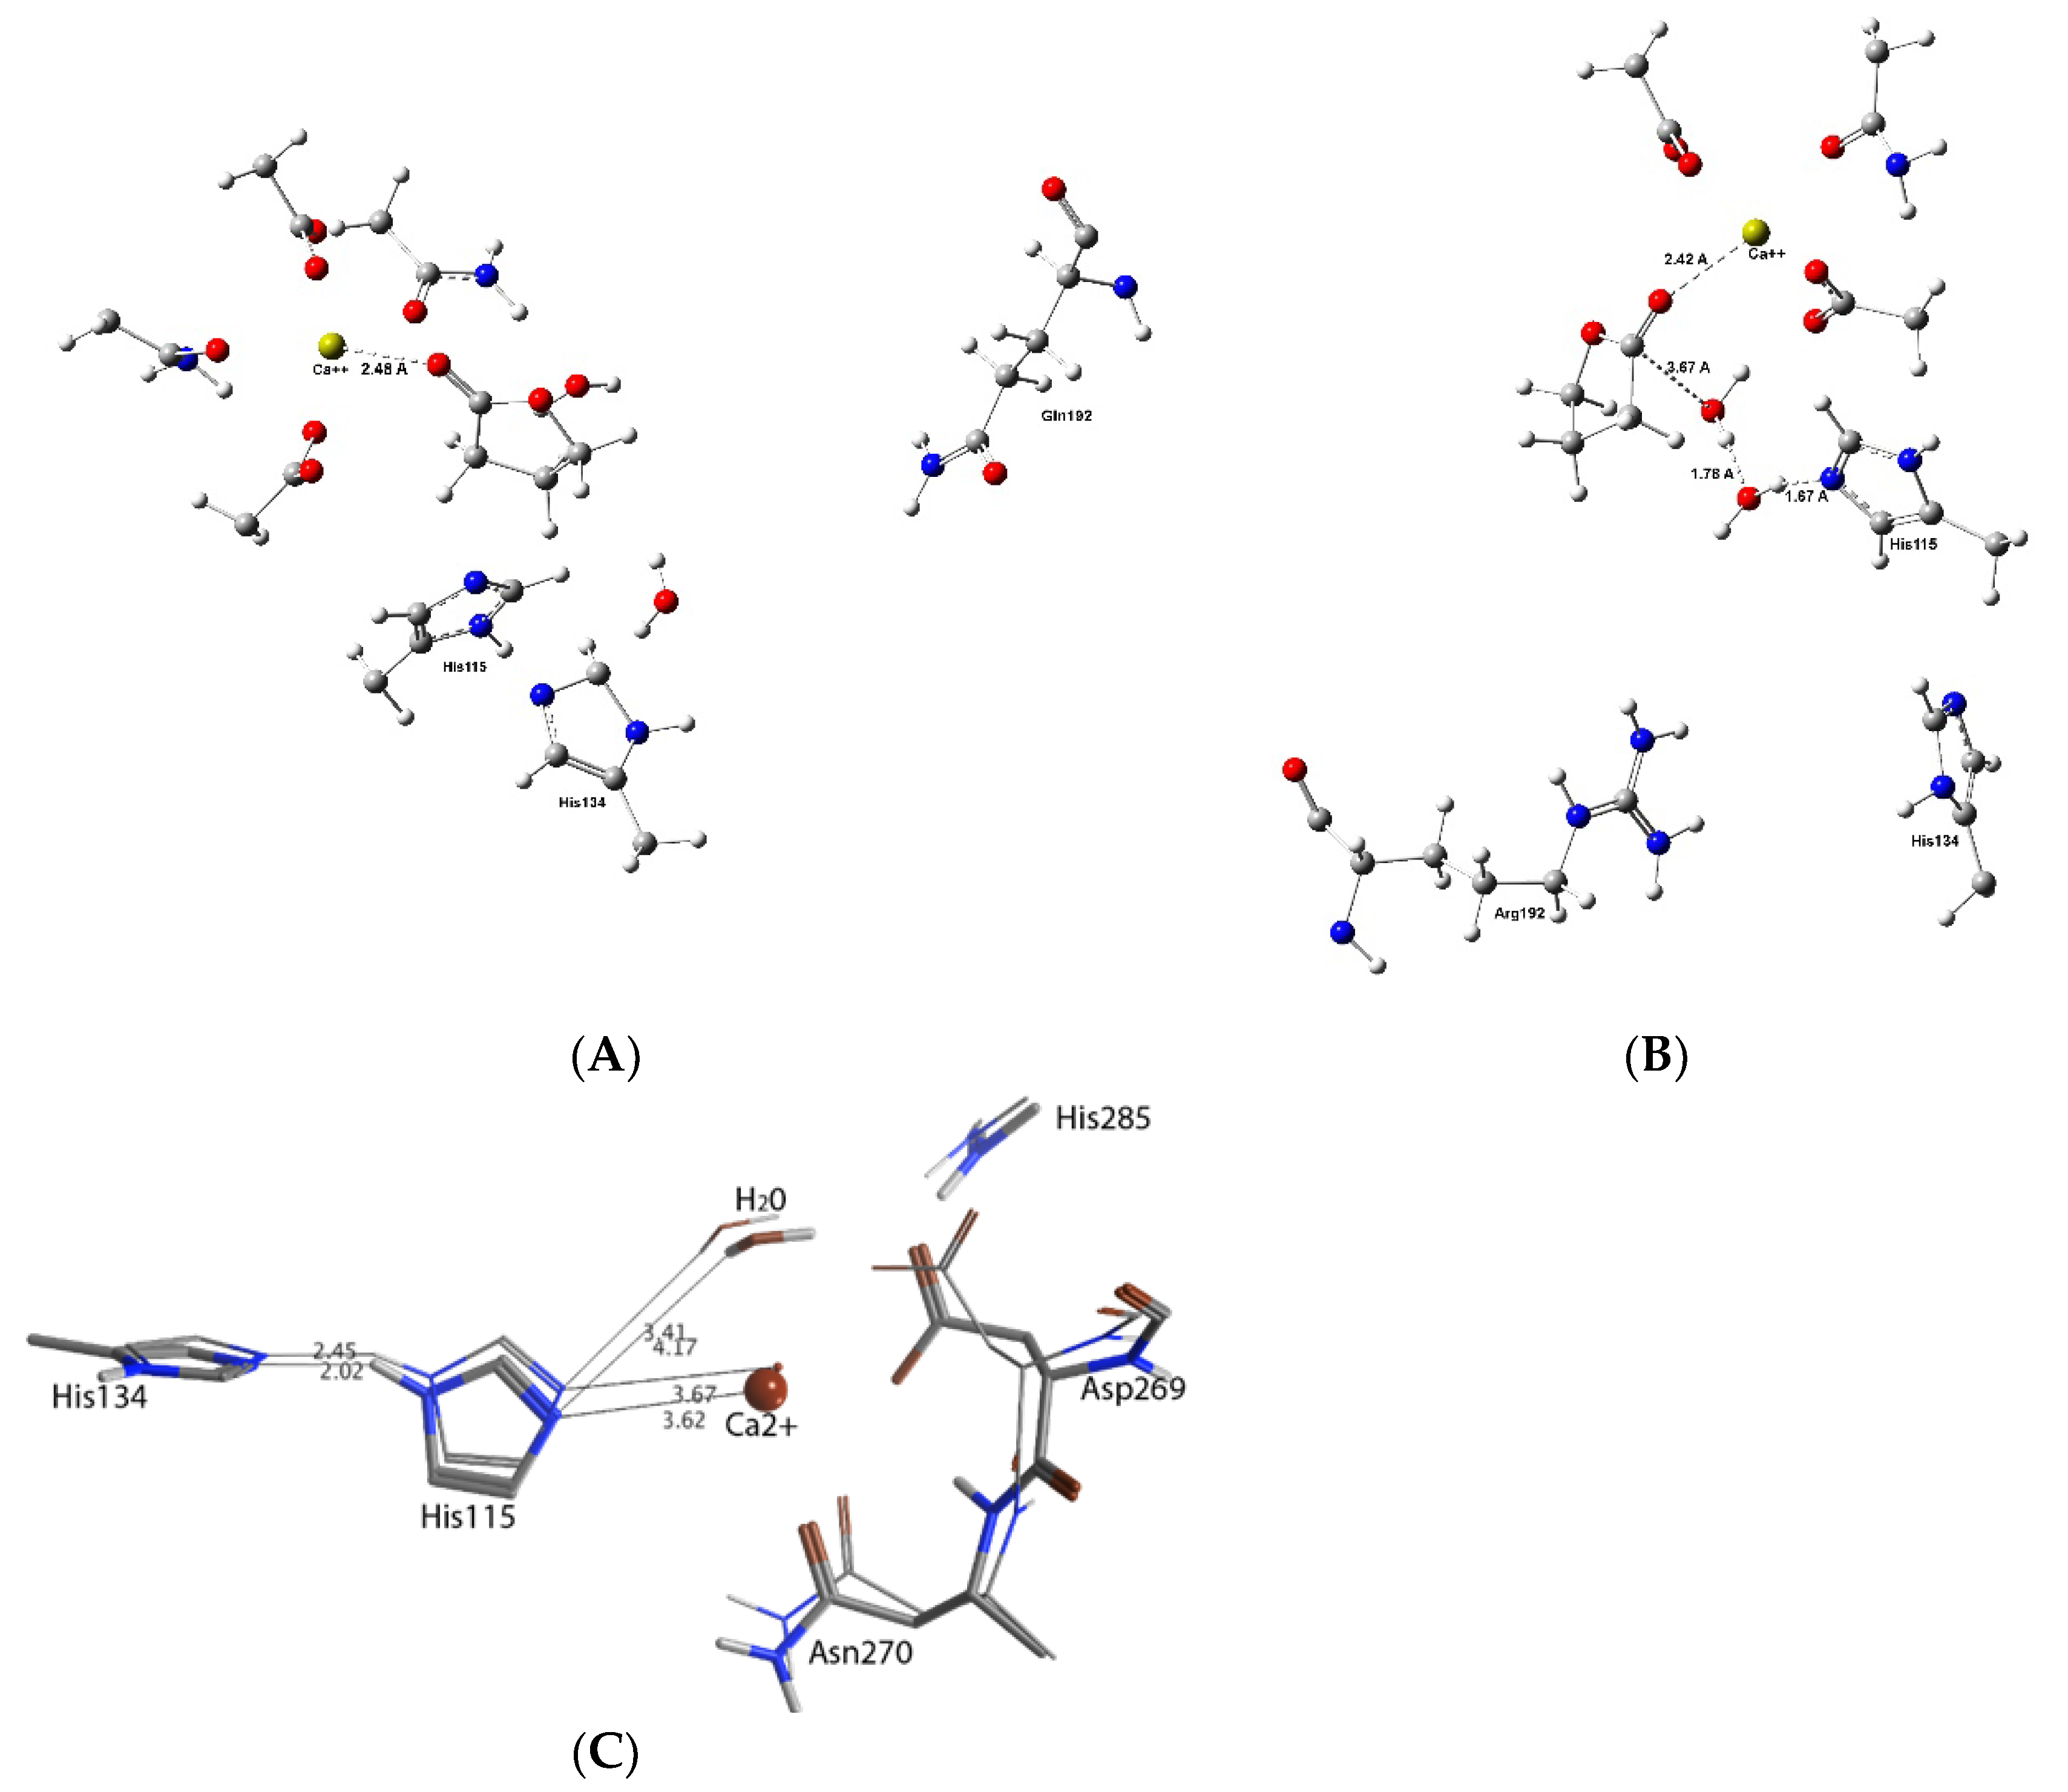
As described in the introduction, the PON1 catalyzed hydrolysis mechanism has been studied experimentally and computationally (using a QM/MM approach [19]) (see Figure 1). It was concluded that His115 plays a key role in, for example, activating the mechanistically important water molecule. In fact, activation of the water molecule was identified as the rate-limiting step in the overall mechanism [18,19]. The above results obtained using MD suggest that the active sites of the isozymes are in a dynamic motion, and they are affected by the mutation even in a substrate unbound state (Figure 9C). Thus, using QM/MM, in which the QM-region was described using DFT methods (see Computational Methods), the structures of the active sites of both QPON1 and RPON1 with γ-butyrolactone were examined. That is, the question of what impacts does the Q192R mutation have on their native (no substrate) active sites was asked. The optimized positions of selected key active site residues, the Ca2+ ion and mechanistic water for QPON1 and RPON1 were then further examined to give an insight into the difference that the two mutants brought to the active site.
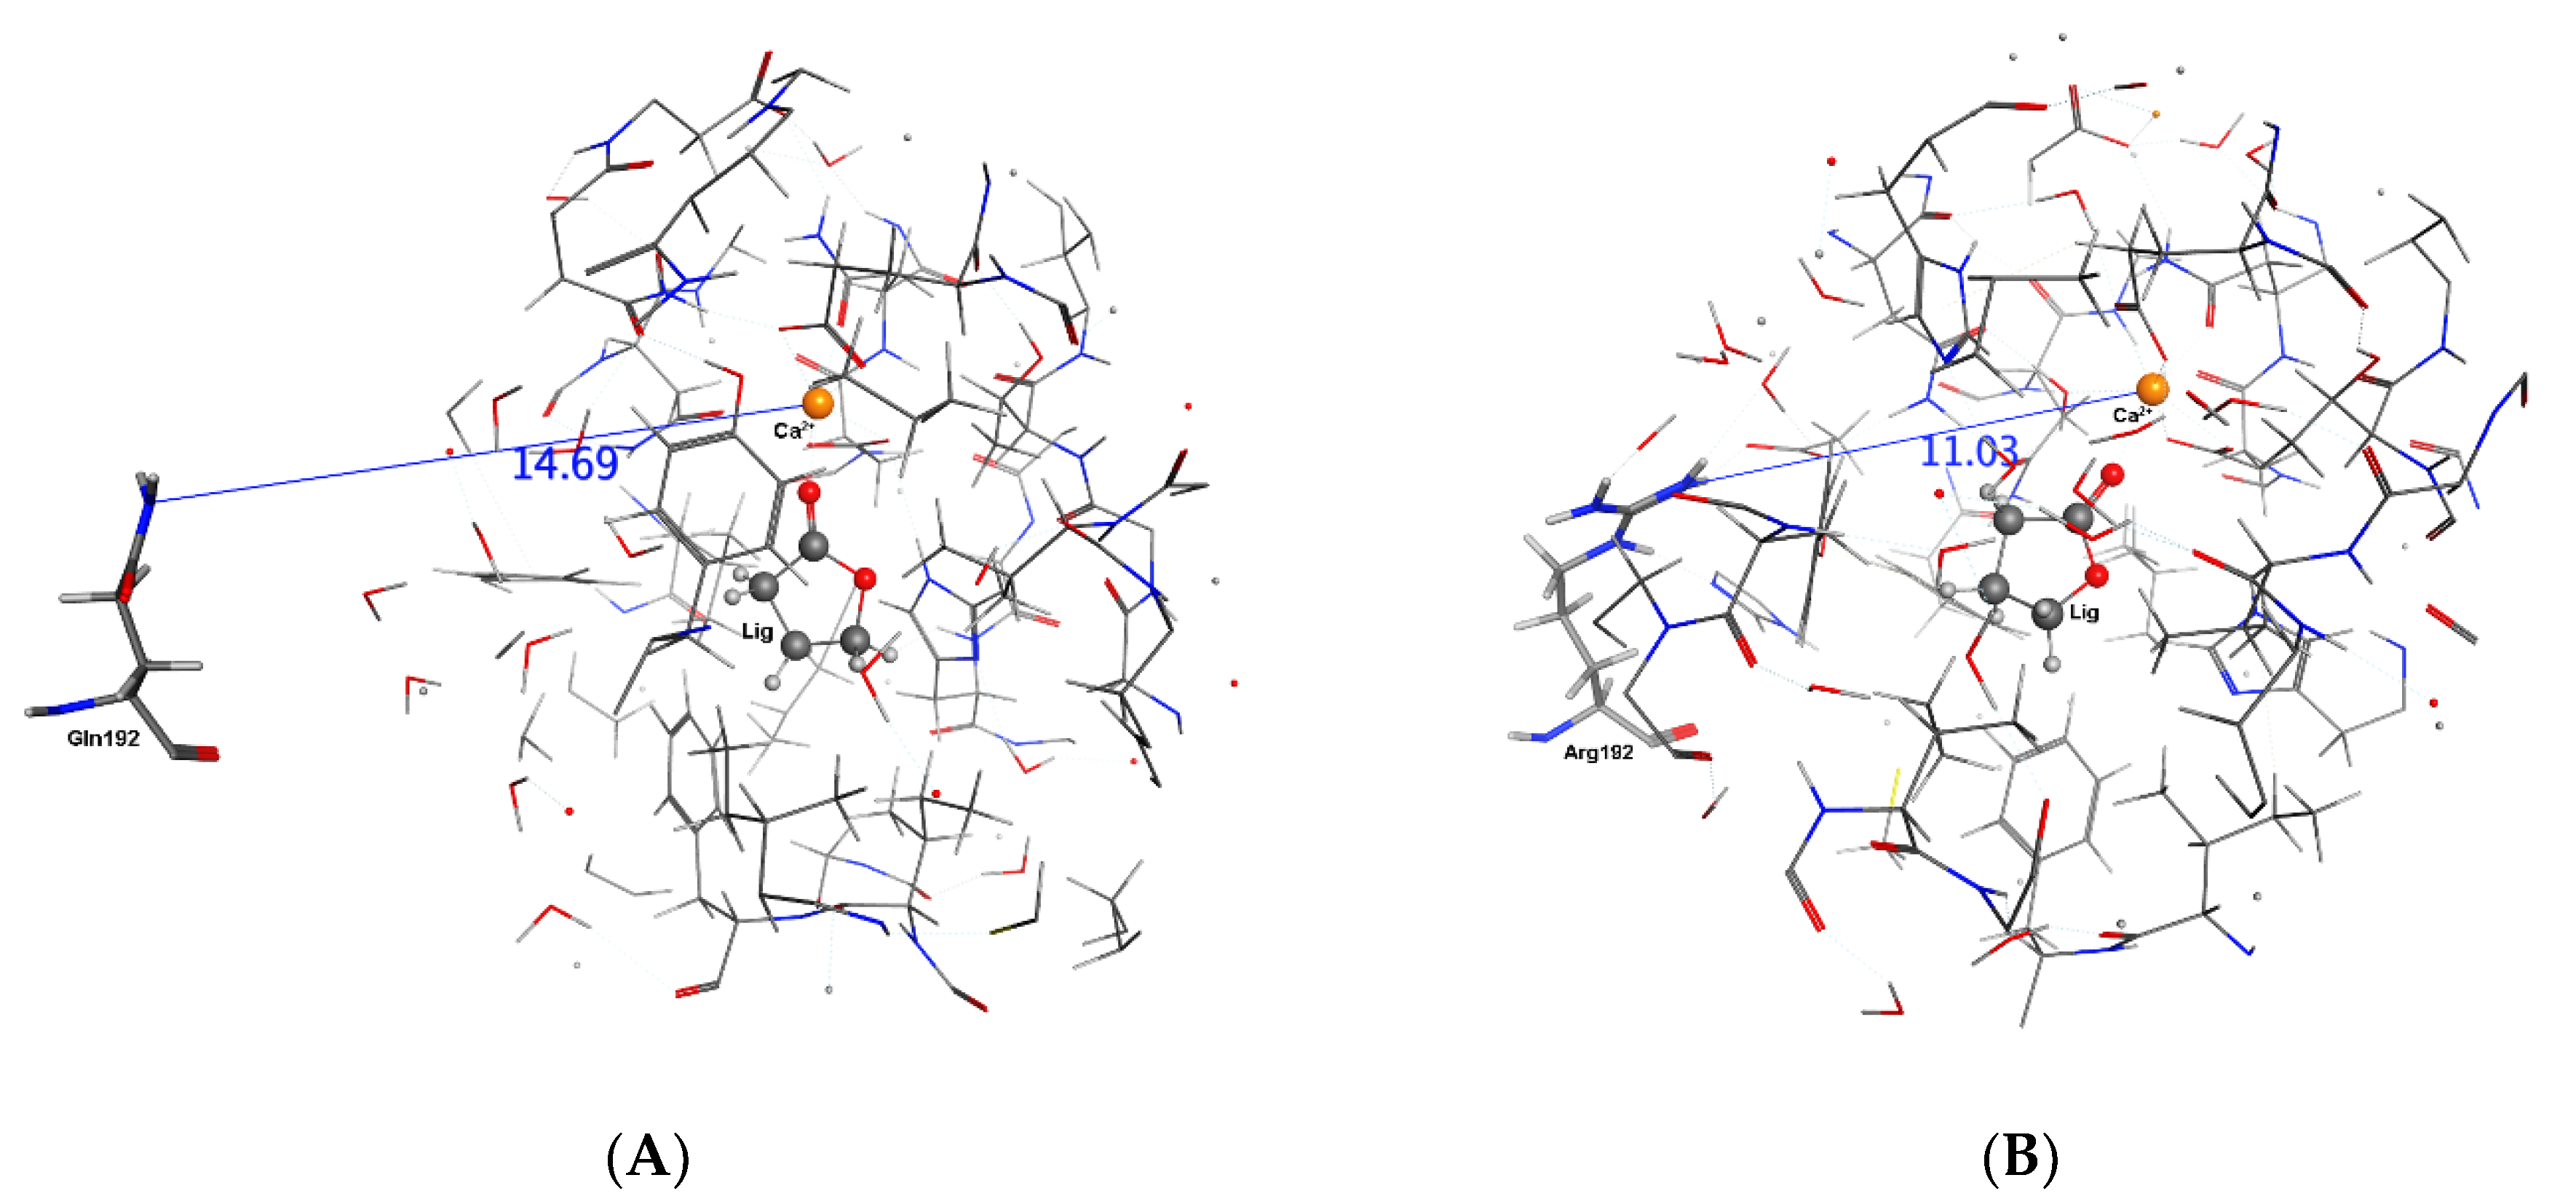
Figure 9 is representing the QM/MM results; the results are quite interesting. First of all, the ligand-free active site was optimized using Quantum Mechanics Techniques. It shows that the Q192R mutation affects the active site’s geometry despite being in the third shell away from the active site, QM region (Figure 9C). Penetration of γ-butyrolactone is massively changing the active site architecture in different magnitudes. For both of the isozymes, one more water molecule is accompanying the substrate, but their orientation is completely different. In R-PON1, both of the water molecules are in an active role and the His115-H2O-H2O-Substrate-Ca2+complex is looking ready to initiate a chemical reaction (Figure 9B). There is no such orientation in Q-PON1, the water molecules are not located between Hys115 and substrate to trigger a reaction (Figure 9A). Not surprisingly, the experimental data are suggesting a four-fold faster hydrolyze for R-PON1. This conclusion is in a harmony with QSAR results which reflects a very important role for substrate 3D-geometry on the rate of reaction. The distance between His115 and water is 3.41 and 4.17 A in R and Q isoenzymes in substrate-free models, respectively, and, in our understanding, the shorter distance between histidine and water may permit a more organized geometry when the substrate and extra water penetrates the active site.

4. Conclusions

In this study, using a computational QSAR approach, the structure–activity model was developed to examine the properties of the substrates of Paraxonase-1 (PON1), in order to help provide insights into substrate properties that may influence the relative rates of reaction (hydrolysis) in the Q- and R-isozymes of PON1. In addition, we have also complementarily used Protein–Ligand Docking, Molecular Dynamics (MD) and QM/MM approaches to examine the effect of the Q versus R mutation at position 192 of PON1 on binding of selected substrates in the active sites, and possible differences in the active site structure.
In addition to analyzed main statistical performance values in the QSAR component of this study, the applicability domain of the models was also analyzed by applying the Williams plot technique. The selected significant descriptors and obtained model performance results revealed the main factors that influence the activity of the PON1 isozymes. For QPON1, it was found that the substrate properties that were most likely to be important for the interactions included molecular mass weighted 3D-MoRSE descriptors (Mor10m, Mor17m) and a Van der Waals-weighted WHIM descriptor (E1v). That is, for QPON1, the most important descriptors of the substrate are related to their three-dimensional molecular structure-dependent conformation. In the case of RPON1, three mass weighted molecular descriptors were included in the QSAR model (Mor17m, Mor22m, Mor25m), all of them in the same type of descriptor family (3D-MoRSE). For instance, it is important to notice that both of the QSAR models share one descriptor in common Mor17m having in both cases a positive effect on the hydrolysis rate for QPON1 and RPON1.
As noted, Protein–Ligand Docking, MD and QM/MM methods were applied to obtain greater insights into the effects of the residue 192 mutation, specifically Q- vs. RPON1, on substrate binding and active site structure as the Q and R polymorphisms have been experimentally observed to hydrolyze almost all substrates at different rates. The present computational results suggest that the Q192R mutation does cause structural changes in the active site that include the positioning of the key Ca2+ ion and the required mechanistic water. Additionally, penetration of the substrate is causing an extra water molecule in the active site which has a mechanistic role in the RPON1/γ-butyrolactone complex. The discussion on the primary role of the PON1 enzyme is still ongoing [11] because PON1 hydrolyzes a broad range of compounds (aryl esters, lactones, organophosphorus compounds, etc.). According to the produced QSAR, MD and QMMM results, the PON1 active site is very sensitive to Q192R mutation (especially when substrate bound) and substrate 3D-geometry. Experimental results are also referring to such a kind of sensitivity; small changes on the substrate molecular structure cause big differences on the rate of reaction (a more than 30-fold difference between the rate of reaction of γ-butyrolactone and δ-valerolactone for QPON1, eight-fold for RPON1). As a result of this sensitivity, different mechanisms may exist according to isozyme or substrate. To the best of our knowledge, the mechanism suggested in this study for RPON1- γ-Butyrolactone system (Figure 8B) has not been reported before.

Supplementary Materials

The following supporting information can be downloaded at: https://www.mdpi.com/article/10.3390/molecules27206780/s1, Figure S1: Schematic illustration of the enzyme–substrate complex modeling strategy used in this study; Figure S2: Schematic illustration of the QSAR modelling steps including descriptor generation, training and test sets created and GA-MLR modelling; MD Graphs. Figure S3A–C: Substrate-free QPON1 and RPON1 MD results including distances between His115-Ca ion, Gln192/Arg192-Ca ion, Gln192/Arg192 RMSD, and the Backbone RMSD. Figure S4: Y-scrambling test resulting graphs for QPON1 model, Equation (3) (A), and RPON1 model, Equation (4) (B); Figure S5: Density distribution of the descriptors values for each variable in a violin plot for the QPON1 model. Figure S6: Density distribution of the descriptors values for each variable in a violin plot for the RPON1 model; Figure S7: Histogram distribution for QPON1 model based on response variable (rate of reaction); Figure S8: Histogram distribution for RPON1 model based on response variable (rate of reaction).

Author Contributions

Conceptualization, S.K. and J.W.G.; methodology, S.K., G.M.C.-M. and B.R.; formal analysis, S.K., G.M.C.-M. and B.M.; data curation, B.R.; writing—original draft preparation, S.K.; writing—review and editing, B.R. and J.W.G.; visualization, S.K. and G.M.C.-M.; supervision, J.W.G. and B.R.; project administration, J.W.G.; funding acquisition, J.W.G. and B.R. All authors have read and agreed to the published version of the manuscript.

Funding

This research was funded by the Natural Science and Engineering Research Council of Canada 452 (NSERC), grant number is 04840-201. This work was supported in part by the National Science Foundation MRI award OAC-2019077, also by NSF through the ND EPSCoR Award #IIA-1355466 and by the State of North Dakota. Additional support from Extreme Science and Engineering Discovery Environment (XSEDE), award allocation (TG-DMR110088).

Institutional Review Board Statement

Not applicable.

Informed Consent Statement

Not applicable.

Data Availability Statement

Not applicable.

Acknowledgments

We acknowledge the Natural Science and Engineering Research Council of Canada 452 (NSERC) for financial support and Compute Canada for an award allocation of computational resources. The grant number for the NSERC grant is: 04840-201. This work was supported in part by the National Science Foundation MRI award OAC-2019077, also by NSF through the ND EPSCoR Award #IIA-1355466 and by the State of North Dakota. Authors thank Paola Gramatica for generously provided a free license for the QSARINS software. B.R. also thanks the NDSU Foundation for the support through the Carl and Jean White Memorial Endowment award FAR0032957. The authors thank the Extreme Science and Engineering Discovery Environment (XSEDE) for the award allocation (TG-DMR110088). Supercomputing support from CCAST HPC System at NDSU is acknowledged. The authors also thank Ahmad Rashid for assistance in DFT calculations.

Conflicts of Interest

The authors declare no conflict of interest.

References

  1. Tripathy, R.K.; Aggarwal, G.; Bajaj, P.; Kathuria, D.; Bharatam, P.V.; Pande, A.H. Towards Understanding the Catalytic Mechanism of Human Paraoxonase 1: Experimental and In Silico Mutagenesis Studies. Appl. Biochem. Biotechnol. 2017, 182, 1642–1662. [Google Scholar] [CrossRef] [PubMed]
  2. Aviram, M.; Rosenblat, M.; Bisgaier, C.L.; Newton, R.S.; Primo-Parmo, S.L.; Du, B.N. La A Possible Role for Paraoxonase Paraoxonase Inhibits High-Density Lipoprotein Oxidation and Preserves Its Functions. A Possible Peroxidative Role for Paraoxonase Paraoxonase. HDL LDL Lipid Peroxidation Apolipoprotein E Deficient Mice. J. Clin. Investig. 1998, 101, 1581–1590. [Google Scholar] [CrossRef] [PubMed] [Green Version]
  3. Deakin, S.; Leviev, I.; Gomaraschi, M.; Calabresi, L.; Franceschini, G.; James, R.W. Enzymatically Active Paraoxonase-1 Is Located at the External Membrane of Producing Cells and Released by a High Affinity, Saturable, Desorption Mechanism. J. Biol. Chem. 2002, 277, 4301–4308. [Google Scholar] [CrossRef] [PubMed] [Green Version]
  4. Blanco-Muñoz, J.; Lacasaña, M.; Gamboa, R.; Huesca-Gómez, C.; Hernández-Mariano, J.Á.; Aguilar-Garduño, C. Interaction between MTHFR 677C > T, PON1 192Q > R and PON1 55L > M Polymorphisms and Its Effect on Non-Recurrent Spontaneous Abortion in Mexican Women. Gene 2019, 689, 69–75. [Google Scholar] [CrossRef]
  5. Davidson, W.S.; Silva, R.A.G.D.; Chantepie, S.; Lagor, W.R.; Chapman, M.J.; Kontush, A. Proteomic Analysis of Defined HDL Subpopulations Reveals Particle-Specific Protein Clusters: Relevance to Antioxidative Function. Arterioscler. Thromb. Vasc. Biol. 2009, 29, 870–876. [Google Scholar] [CrossRef] [Green Version]
  6. Kulka, M. A Review of Paraoxonase 1 Properties and Diagnostic Applications. Pol. J. Vet. Sci. 2016, 19, 225–232. [Google Scholar] [CrossRef] [Green Version]
  7. Mackness, M.; Mackness, B. Human Paraoxonase-1 (PON1): Gene Structure and Expression, Promiscuous Activities and Multiple Physiological Roles. Gene 2015, 567, 12–21. [Google Scholar] [CrossRef] [Green Version]
  8. Costa, L.G.; Cole, T.B.; Jarvik, G.P.; Furlong, C.E. Functional Genomics of the Paraoxonase (PON1) Polymorphisms: Effects on Pesticide Sensitivity, Cardiovascular Disease, and Drug Metabolism. Annu. Rev. Med. 2003, 54, 371–392. [Google Scholar] [CrossRef]
  9. Taler-Verčič, A.; Goličnik, M.; Bavec, A. The Structure and Function of Paraoxonase-1 and Its Comparison to Paraoxonase-2 and -3. Molecules 2020, 25, 5980. [Google Scholar] [CrossRef]
  10. Rajkovic, M.G.; Rumora, L.; Barisic, K. Humana Paraoksonaza 1, 2 i 3. Biochem. Med. 2011, 21, 122–130. [Google Scholar] [CrossRef]
  11. Khersonsky, O.; Tawfik, D.S. Structure-Reactivity Studies of Serum Paraoxonase PON1 Suggest That Its Native Activity Is Lactonase. Biochemistry 2005, 44, 6371–6382. [Google Scholar] [CrossRef]
  12. Draganov, D.I.; Teiber, J.F.; Speelman, A.; Osawa, Y.; Sunahara, R.; La Du, B.N. Human Paraoxonases (PON1, PON2, and PON3) Are Lactonases with Overlapping and Distinct Substrate Specificities. J. Lipid Res. 2005, 46, 1239–1247. [Google Scholar] [CrossRef] [PubMed] [Green Version]
  13. Aldridge, W.N.; Hoskin, F.C.G.; Reiner, E.; Walker, C.H. Suggestions for a Nomenclature and Classification of Enzymes Hydrolysing Organophosphorus Compounds. In Enzymes Hydrolysing Organophosphorus Compounds; Ellis Horwood: Chichester, UK, 1989; pp. 246–253. [Google Scholar]
  14. Purg, M.; Elias, M.; Kamerlin, S.C.L. Similar Active Sites and Mechanisms Do Not Lead to Cross-Promiscuity in Organophosphate Hydrolysis: Implications for Biotherapeutic Engineering. J. Am. Chem. Soc. 2017, 139, 17533–17546. [Google Scholar] [CrossRef] [PubMed]
  15. Mazur, A. An Enzyme in Animal Tissues Capable of Hydrolysing the Phosphorus-Fluorine Bond of Alkyl Fluorophosphates. J. Biol. Chem. 1946, 164, 271–289. [Google Scholar] [CrossRef]
  16. Aldridge, W.N. Serum Esterases. II. An Enzyme Hydrolysing Diethyl p-Nitrophenyl Phosphate (E600) and Its Identity with the A-Esterase of Mammalian Sera. Biochem. J. 1953, 53, 117–124. [Google Scholar] [CrossRef] [PubMed] [Green Version]
  17. Harel, M.; Aharoni, A.; Gaidukov, L.; Brumshtein, B.; Khersonsky, O.; Meged, R.; Dvir, H.; Ravelli, R.B.G.; McCarthy, A.; Toker, L.; et al. Structure and Evolution of the Serum Paraoxonase Family of Detoxifying and Anti-Atherosclerotic Enzymes. Nat. Struct. Mol. Biol. 2004, 11, 412–419. [Google Scholar] [CrossRef]
  18. Khersonsky, O.; Tawfik, D.S. The Histidine 115-Histidine 134 Dyad Mediates the Lactonase Activity of Mammalian Serum Paraoxonases. J. Biol. Chem. 2006, 281, 7649–7656. [Google Scholar] [CrossRef] [Green Version]
  19. Le, Q.A.T.; Kim, S.; Chang, R.; Kim, Y.H. Insights into the Lactonase Mechanism of Serum Paraoxonase 1 (PON1): Experimental and Quantum Mechanics/Molecular Mechanics (QM/MM) Studies. J. Phys. Chem. B 2015, 119, 9571–9585. [Google Scholar] [CrossRef]
  20. Rosenblat, M.; Gaidukov, L.; Khersonsky, O.; Vaya, J.; Oren, R.; Tawfik, D.S.; Aviram, M. The Catalytic Histidine Dyad of High Density Lipoprotein-Associated Serum Paraoxonase-1 (PON1) Is Essential for PON1-Mediated Inhibition of Low Density Lipoprotein Oxidation and Stimulation of Macrophage Cholesterol Efflux. J. Biol. Chem. 2006, 281, 7657–7665. [Google Scholar] [CrossRef] [Green Version]
  21. Billecke, S.; Draganov, D.; Counsell, R.; Stetson, P.; Watson, C.; Hsu, C.; La Du, B.N. Human Serum Paraoxonase (PON1) Isozymes Q and R Hydrolyze Lactones and Cyclic Carbonate Esters. Drug Metab. Dispos. 2000, 28, 1335–1342. [Google Scholar]
  22. Mackness, B.; Mackness, M.I.; Arrol, S.; Turkie, W.; Durrington, P.N. Effect of the Molecular Polymorphisms of Human Paraoxonase (PON1) on the Rate of Hydrolysis of Paraoxon. Br. J. Pharmacol. 1997, 122, 265–268. [Google Scholar] [CrossRef] [PubMed]
  23. Blatter Garin, M.C.; James, R.W.; Dussoix, P.; Blanché, H.; Passa, P.; Froguel, P.; Ruiz, J. Paraoxonase Polymorphism Met-Leu54 Is Associated with Modified Serum Concentrations of the Enzyme. A Possible Link between the Paraoxonase Gene and Increased Risk of Cardiovascular Disease in Diabetes. J. Clin. Investig. 1997, 99, 62–66. [Google Scholar] [CrossRef] [PubMed] [Green Version]
  24. Playfer, J.R.; Eze, L.C.; Bullen, M.F.; Evans, D.A. Genetic Polymorphism and Interethnic Variability of Plasma Paroxonase Activity. J. Med. Genet. 1976, 13, 337–342. [Google Scholar] [CrossRef] [PubMed] [Green Version]
  25. Smolen, A.; Eckerson, H.W.; Gan, K.N.; Hailat, N.; La Du, B.N. Characteristics of the Genetically Determined Allozymic Forms of Human Serum Paraoxonase/Arylesterase. Drug Metab. Dispos. 1991, 19, 107–112. [Google Scholar] [PubMed]
  26. Humbert, R.; Adler, D.A.; Disteche, C.M.; Hassett, C.; Omiecinski, C.J.; Furlong, C.E. The Molecular Basis of the Human Serum Paraoxonase Activity Polymorphism. Nat. Genet. 1993, 3, 73–76. [Google Scholar] [CrossRef]
  27. Baillie, T.A.; Moldeus, P.; Mason, R.P.; Younes, M. Enzymes Interacting with Organophosphorus Compounds; Elsevier Scientific Publishers Ireland Ltd: Shannon, Ireland, 1993; Volume 6. [Google Scholar]
  28. Davies, H.G.; Richter, R.J.; Keifer, M.; Broomfield, C.A.; Sowalla, J.; Furlong, C.E. The Effect of the Human Serum Paraoxonase Polymorphism Is Reversed with Diazoxon, Soman and Sarin. Nat. Genet. 1996, 14, 334–336. [Google Scholar] [CrossRef]
  29. Reiner, E. Third International Meeting on Esterases Reacting with Organophosphorus Compounds; DTIC Document; Institute For Medical Research And Occupational Health: Zagreb, Croatia, 1998. [Google Scholar]
  30. Phuntuwate, W.; Suthisisang, C.; Koanantakul, B.; Chaloeiphap, P.; Mackness, B.; Mackness, M. Effect of Fenofibrate Therapy on Paraoxonase1 Status in Patients with Low HDL-C Levels. Atherosclerosis 2008, 196, 122–128. [Google Scholar] [CrossRef]
  31. Mitra, S.; Kshatriya, G.K. Genetic Variation at Q192R and L55M Polymorphisms in PON1. Environ. Toxicol. Pharmacol. 2016, 45, 251–256. [Google Scholar] [CrossRef]
  32. Ruiz, J.; Blanche, H.; James, R.W.; Garin, M.C.; Vaisse, C.; Charpentier, G.; Cohen, N.; Morabia, A.; Passa, P.; Froguel, P. Gln-Arg192 Polymorphism of Paraoxonase and Coronary Heart Disease in Type 2 Diabetes. Lancet 1995, 346, 869–872. [Google Scholar] [CrossRef]
  33. Serrato, M.; Marian, A.J. A Variant of Human Paraoxonase/Arylesterase (HUMPONA) Gene Is a Risk Factor for Coronary Artery Disease. J. Clin. Investig. 1995, 96, 3005–3008. [Google Scholar] [CrossRef] [Green Version]
  34. Antikainen, M.; Murtomaki, S.; Syvanne, M.; Pahlman, R.; Tahvanainen, E.; Jauhiainen, M.; Frick, M.H.; Ehnholm, C. The Gln-Arg191 Polymorphism of the Human Paraoxonase Gene (HUMPONA) Is Not Associated with the Risk of Coronary Artery Disease in Finns. J. Clin. Investig. 1996, 98, 883–885. [Google Scholar] [CrossRef] [PubMed]
  35. Herrmann, S.M.; Blanc, H.; Poirier, O.; Arveiler, D.; Luc, G.; Evans, A.; Marques-Vidal, P.; Bard, J.M.; Cambien, F. The Gln/Arg Polymorphism of Human Paraoxonase (PON 192) Is Not Related to Myocardial Infarction in the ECTIM Study. Atherosclerosis 1996, 126, 299–303. [Google Scholar] [CrossRef]
  36. Suehiro, T.; Nakauchi, Y.; Yamamoto, M.; Arii, K.; Itoh, H.; Hamashige, N.; Hashimoto, K. Paraoxonase Gene Polymorphism in Japanese Subjects with Coronary Heart Disease. Int. J. Cardiol. 1996, 57, 69–73. [Google Scholar] [CrossRef]
  37. Murillo-González, F.E.; Ponce-Ruiz, N.; Rojas-García, A.E.; Rothenberg, S.J.; Bernal-Hernández, Y.Y.; Cerda-Flores, R.M.; Mackness, M.; Barrón-Vivanco, B.S.; González-Arias, C.A.; Ponce-Gallegos, J.; et al. PON1 Lactonase Activity and Its Association with Cardiovascular Disease. Clin. Chim. Acta 2020, 500, 47–53. [Google Scholar] [CrossRef] [PubMed]
  38. Schmidt, H.; Schmidt, R.; Niederkorn, K.; Gradert, A.; Schumacher, M.; Watzinger, N.; Hartung, H.P.; Kostner, G.M. Paraoxonase PON1 Polymorphism Leu-Met54 Is Associated with Carotid Atherosclerosis: Results of the Austrian Stroke Prevention Study. Stroke 1998, 29, 2043–2048. [Google Scholar] [CrossRef] [Green Version]
  39. Kondo, I.; Yamamoto, M. Genetic Polymorphism of Paraoxonase 1 (PON1) and Susceptibility to Parkinson’s Disease. Brain Res. 1998, 806, 271–273. [Google Scholar] [CrossRef]
  40. Furlong, C.E.; Suzuki, S.M.; Stevens, R.C.; Marsillach, J.; Richter, R.J.; Jarvik, G.P.; Checkoway, H.; Samii, A.; Costa, L.G.; Griffith, A.; et al. Human PON1, a biomarker of risk of disease and exposure. Chem.-Biol. Interac. 2010, 187, 355–361. [Google Scholar] [CrossRef] [Green Version]
  41. Atasoy, H.; Gulec-Yilmaz, S.; Ergen, A.; Gormus, U.; Kucukhuseyin, O.; Dalan, B.; Kusat Ol, K.; Ogut, D.B.; Gulec, H.; Cetin, B.; et al. Paraoxonase1 192 (PON1 192) Gene Polymorphism and Serum Paraoxonase Activity in Panic Disorder Patients. In Vivo 2015, 29, 51–54. [Google Scholar]
  42. Salari, N.; Rasoulpoor, S.; Hosseinian-Far, A.; Razazian, N.; Mansouri, K.; Mohammadi, M.; Vaisi-Raygani, A.; Jalali, R.; Shabani, S. Association between Serum Paraoxonase 1 Activity and Its Polymorphisms with Multiple Sclerosis: A Systematic Review. Neurol. Sci. 2021, 42, 491–500. [Google Scholar] [CrossRef]
  43. Kalman, J.; Kudchodkar, B.J.; Murray, K.; McConathy, W.J.; Juhasz, A.; Janka, Z.; Lacko, A.G. Evaluation of Serum-Lipid-Related Cardiovascular Risk Factors in Alzheimer’s Disease. Dement. Geriatr. Cogn. Disord. 1999, 10, 488–493. [Google Scholar] [CrossRef]
  44. Mogarekar, M.R.; Dhabe, M.G.; Gujrathi, C.C. A Study of Paraoxonase1 (PON1) Activities, HDL Cholesterol and Its Association with Vascular Complication in Type 2 Diabetes Mellitus. Int. J. Diabetes Dev. Ctries. 2016, 36, 457–462. [Google Scholar] [CrossRef]
  45. Ayan, D.; Şeneş, M.; Çaycl, A.B.; Söylemez, S.; Eren, N.; Altuntaş, Y.; Öztürk, F.Y. Evaluation of Paraoxonase, Arylesterase, and Homocysteine Thiolactonase Activities in Patients with Diabetes and Incipient Diabetes Nephropathy. J. Med. Biochem. 2019, 38, 481–488. [Google Scholar] [CrossRef] [PubMed]
  46. Moreira, E.G.; Boll, K.M.; Correia, D.G.; Soares, J.F.; Rigobello, C.; Maes, M. Why Should Psychiatrists and Neuroscientists Worry about Paraoxonase 1? Curr. Neuropharmacol. 2018, 17, 1004–1020. [Google Scholar] [CrossRef] [PubMed]
  47. Bosak, A.; Bavec, A.; Konte, T.; Šinko, G.; Kovarik, Z.; Goličnik, M. Interactions of Paraoxonase-1 with Pharmacologically Relevant Carbamates. Molecules 2020, 25, 211. [Google Scholar] [CrossRef] [Green Version]
  48. Karabulut, S.; Sizochenko, N.; Orhan, A.; Leszczynski, J. A DFT-Based QSAR Study on Inhibition of Human Dihydrofolate Reductase. J. Mol. Graph. Model. 2016, 70, 23–29. [Google Scholar] [CrossRef] [Green Version]
  49. Rasulev, B.; Kušić, H.; Leszczynska, D.; Leszczynski, J.; Koprivanac, N. QSAR Modeling of Acute Toxicity on Mammals Caused by Aromatic Compounds: The Case Study Using Oral LD50 for Rats. J. Environ. Monit. 2010, 12, 1037–1044. [Google Scholar] [CrossRef]
  50. Topliss, J.G.; Edwards, R.P. Chance Factors in Qsar Studies. ACS Symp. Ser. 1979, 22, 131–145. [Google Scholar] [CrossRef]
  51. European Commission Environment Directorate General Guidance. Document on the Validation of (Quantitative) Structure-Activity Relationships [(Q)Sar] Models; OECD: Paris, France, 2014; pp. 1–154. [CrossRef]
  52. Sun, G.; Zhang, Y.; Pei, L.; Lou, Y.; Mu, Y.; Yun, J.; Li, F.; Wang, Y.; Hao, Z.; Xi, S.; et al. Chemometric QSAR Modeling of Acute Oral Toxicity of Polycyclic Aromatic Hydrocarbons (PAHs) to Rat Using Simple 2D Descriptors and Interspecies Toxicity Modeling with Mouse. Ecotoxicol. Environ. Saf. 2021, 222, 112525. [Google Scholar] [CrossRef]
  53. Molecular Operating Environment (MOE); Chemical Computing Group ULC: Montreal, QC, Canada, 2022.
  54. Mauri, A.; Consonni, V.; Pavan, M.; Todeschini, R. DRAGON Software: An Easy Approach to Molecular Descriptor Calculations. Match 2006, 56, 237–248. [Google Scholar]
  55. Frisch, M.J.; Trucks, G.W.; Schlegel, H.B.; Scuseria, G.E.; Robb, M.A.; Cheeseman, J.R.; Scalmani, G.; Barone, V.; Petersson, G.A.; Nakatsuji, H. Gaussian 16 Rev. C.01.; Gaussian, Inc.: Wallingford, UK, 2016. [Google Scholar]
  56. Gramatica, P.; Chirico, N.; Papa, E.; Cassani, S.; Kovarich, S. QSARINS: A New Software for the Development, Analysis, and Validation of QSAR MLR Models. J. Comput. Chem. 2013, 34, 2121–2132. [Google Scholar] [CrossRef]
  57. Schrödinger, L.; DeLano, W. PyMOL. 2020. Available online: http://www.pymol.org/pymol (accessed on 10 January 2022).
  58. Case, W.T.; Babin, V.; Berryman, J.; Betz, R.M.; Cai, Q.; Cerutti, D.S.; Cheatham, T.; Darden, T.; Duke, R.; Gohlke, H.; et al. AMBER 14; Technical Report; University of California: San Francisco, CA, USA, 2014. [Google Scholar] [CrossRef]
  59. Case, D.; Aktulga, H.M.; Belfon, K.; Ben-Shalom, I.; Brozell, S.; Cerutti, D.; Cheatham, T.; Cruzeiro, V.; Darden, T.; Duke, R.; et al. Amber 2021; University of California: San Francisco, CA, USA, 2021. [Google Scholar] [CrossRef]
  60. Wang, J.; Wolf, R.M.; Caldwell, J.W.; Kollman, P.A.; Case, D.A. Development and Testing of a General Amber Force Field. J. Comput. Chem. 2004, 25, 1157–1174. [Google Scholar] [CrossRef] [PubMed]
  61. Abraham, M.J.; Murtola, T.; Schulz, R.; Páll, S.; Smith, J.C.; Hess, B.; Lindah, E. Gromacs: High Performance Molecular Simulations through Multi-Level Parallelism from Laptops to Supercomputers. SoftwareX 2015, 1, 19–25. [Google Scholar] [CrossRef] [Green Version]
  62. Yamagishi, J.; Okimoto, N.; Morimoto, G.; Taiji, M. A New Set of Atomic Radii for Accurate Estimation of Solvation Free Energy by Poisson-Boltzmann Solvent Model. J. Comput. Chem. 2014, 35, 2132–2139. [Google Scholar] [CrossRef] [Green Version]
  63. Bussi, G.; Donadio, D.; Parrinello, M. Canonical Sampling through Velocity Rescaling. J. Chem. Phys. 2007, 126, 014101. [Google Scholar] [CrossRef] [PubMed] [Green Version]
  64. Berendsen, H.J.C.; Postma, J.P.M.; Van Gunsteren, W.F.; Dinola, A.; Haak, J.R. Molecular Dynamics with Coupling to an External Bath. J. Chem. Phys. 1984, 81, 3684–3690. [Google Scholar] [CrossRef] [Green Version]
  65. Devinyak, O.; Havrylyuk, D.; Lesyk, R. 3D-MoRSE Descriptors Explained. J. Mol. Graph. Model. 2014, 54, 194–203. [Google Scholar] [CrossRef]
  66. Todeschini, R.; Consonni, V. Handbook of Molecular Descriptors. Wiley-VCH 2000, 11, 688. [Google Scholar]
  67. Gramatica, P.; Sangion, A. A Historical Excursus on the Statistical Validation Parameters for QSAR Models: A Clarification Concerning Metrics and Terminology. J. Chem. Inf. Model. 2016, 56, 1127–1131. [Google Scholar] [CrossRef]
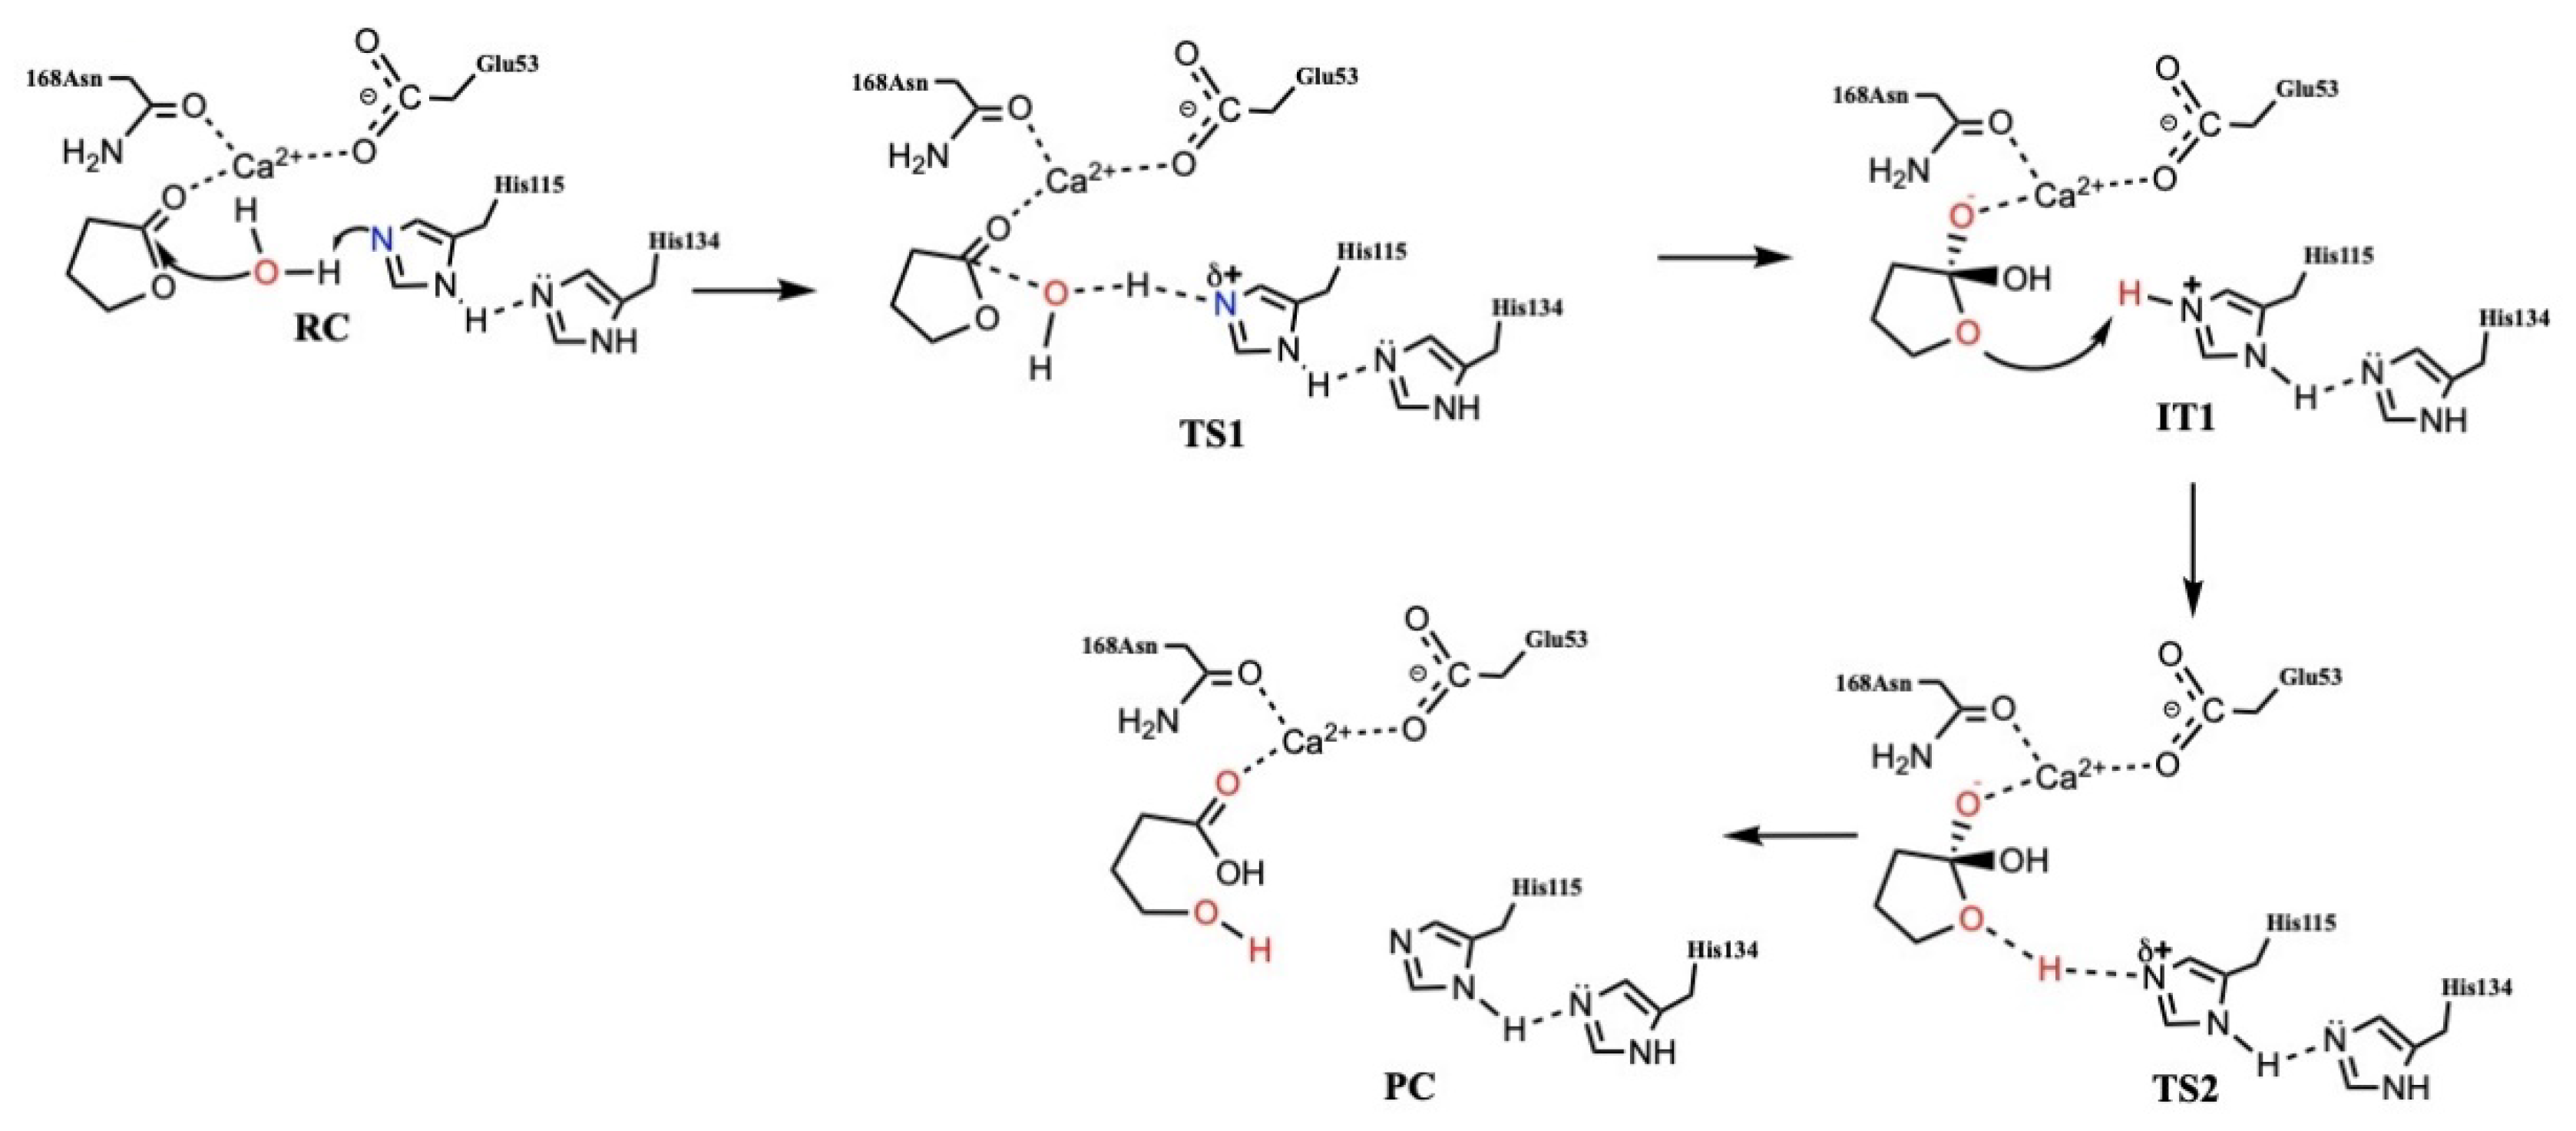
Figure 1. One of the proposed [18,19] catalytic mechanisms of PON1 (RC = Reactant complex; TS = Transition State; IT = Intermediate; and PC = Product Complex).
Molecules 27 06780 g001
Figure 2. Schematic illustration of the QSAR modelling steps including descriptor generation, training and test sets created and GA-MLR modelling.
Molecules 27 06780 g002
Figure 3. The relation between the descriptors and the rate of hydrolysis for (A) QPON1 by Equation (3) and (B) RPON1 by Equation (4).
Molecules 27 06780 g003
Figure 4. Plots of the experimental endpoint vs. predicted for (A) QPON1 by Equation (3) and (B) RPON1 by Equation (4), and the corresponding Williams plots for (C) QPON1 and (D) RPON1. Molecules in the training set are indicated by blue dots, while those in the validation set are indicated by orange dots.
Molecules 27 06780 g004
Figure 5. The distance between Glu192/Arg192 and Ca2+ in the γ-Butyrolactone complexes after 20 ns. (A) QPON1. (B) RPON1.
Molecules 27 06780 g005
Figure 6. The distance between residue192 and Ca2+ ion in the active site of the Phenylacetate complex after 20 ns. (A) is the QPON1. (B) is the RPON1.
Molecules 27 06780 g006
Figure 7. The distance between Glu192/Arg192 and Ca2+ ion in the active site in the Paraoxon system after 20 ns. (A) is the QPON1. (B) is the RPON1.
Molecules 27 06780 g007
Figure 8. The distance between Glu192/Arg192 and Ca2+ ion in the active site in the Sarine–Enzyme complex after 20 ns. (A) QPON1. (B) RPON1.
Molecules 27 06780 g008
Figure 9. the QM/MM results of the QPON1 and RPON1 of the γ-Butyrolactone system. (A) is the QPON1, (B) is the RPON1, (C) superimposition of the optimized structures of selected key active site residues, the Ca2+ ion and mechanistic water for QPON1 and RPON1.
Molecules 27 06780 g009
Table 1. The substrates used in the present study and their experimentally measured rate of hydrolysis [21,28] by QPON1 and RPON1 at [substrate] = 1mM.
NoStructureNameHuman Q192 PON1
Rate of Hydrolysis
Human R192 PON1 Rate of Hydrolysis Reference
1Molecules 27 06780 i001Phenyl acetate100100[21]
2Molecules 27 06780 i002Paraoxon0.130.99[21,28]
3Molecules 27 06780 i0032-Coumaranone18.313.5[21]
4Molecules 27 06780 i004Dihydrocoumarin14.3 *17.0 *[21]
5Molecules 27 06780 i005Homogentisic acid lactone44.049.7[21]
6Molecules 27 06780 i006γ-Butyrolactone2.46 *9.05[21]
7Molecules 27 06780 i007α-Bromo- γ -butyrolactone47.240.8[21]
8Molecules 27 06780 i008S-α-Hydroxy-γ-butyrolactone8.1419.6[21]
9Molecules 27 06780 i009S-β-Hydroxy-γ-butyrolactone0.60 *0.76[21]
10Molecules 27 06780 i010γ-Valerolactone7.28 *6.97[21]
11Molecules 27 06780 i011R-Dihydro-5- hydroxymethyl)-2(3H)-furanone1.233.29[21]
12Molecules 27 06780 i012γ-Decanolactone12.419.0[21]
13Molecules 27 06780 i013Undecano-γ-lactone11.812.7[21]
14Molecules 27 06780 i014α-Angelicolactone19.914.8[21]
15Molecules 27 06780 i015β-Butyrolactone3.837.53[21]
16Molecules 27 06780 i016δ-Valerolactone75.471.0[21]
17Molecules 27 06780 i017δ-Decanolactone23.828.2[21]
18Molecules 27 06780 i018Undecanoic-δ-lactone27.5 *32.8 *[21]
19Molecules 27 06780 i019δ-Dodecanolactone9.6512.8[21]
20Molecules 27 06780 i020ε-Caprolactone14.825.7[21]
21Molecules 27 06780 i021Oxabicyclooctenone1.672.92[21]
22Molecules 27 06780 i022γ-Thiobutyrolactone0.040.11[21]
23Molecules 27 06780 i023HTL; homocysteine thiolactone0.0040.009[21]
24Molecules 27 06780 i024Propylene carbonate5.02 *8.80[21]
25Molecules 27 06780 i0254-(1-Propenyloxymethyl)-1,3- dioxolan-2-one2.232.52[21]
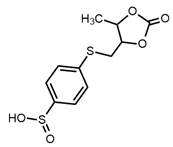
26Molecules 27 06780 i0264-[(5-methyl2-oxo-1,3-dioxol-4-yl)methylthio] benzenesulfonate1.469.65 *[21]
27Molecules 27 06780 i027Sarin0.140.02[28]
28Molecules 27 06780 i028Soman0.850.55 *[28]
29Molecules 27 06780 i029Diazoxon4.884.45 *[28]
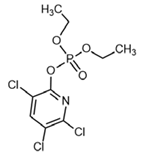
30Molecules 27 06780 i030Chlorpyrifos oxon2.975.40[28]
* Test set compounds.
Table 2. Selected molecular descriptors by GA-MLR technique involved in the best models for QPON1 and RPON1.
QPON1RPON1
AbbreviationDescriptorAbbreviationDescriptor
Mor10msignal 10/weighted by mass 3D-MoRSE descriptorsSIC0Spectral moment 05 from edge adj. matrix weighted by dipole moments
Mor17msignal 17/weighted by mass 3D-MoRSE descriptorsMor17msignal 17/weighted by mass 3D-MoRSE descriptors
E1vFirst component accessibility directional WHIM index/weighted by van der Waals volumeMor22msignal 22/weighted by mass 3D-MoRSE descriptors
H8mH autocorrelation of lag 8/weighted by massMor25msignal 25/weighted by mass 3D-MoRSE descriptors
Table 3. Selected substrates and nomenclature of enzyme substrate complexes.
CompoundQPON1 IsoenzymeRPON1 Isoenzyme
γ-ButyrolactoneComplex1QComplex1R
PhenylacetateComplex2QComplex2R
ParaoxonComplex3QComplex3R
Sarine gasComplex4QComplex4R
Table 4. Fitting, internal validation, and external validation criteria [67] for Q isozyme model.
Fitting criteria
R2 tr = 0.867, R2adj = 0.841, RMSE = 0.378 MAE tr = 0.305,
CCC tr = 0.929, s = 0.422, F = 32.613
Internal validation criteria
Q2LOO = 0.766, RMSE cv = 0.501, MAE cv = 0.401,
Q2LMO = 0.712, CCC cv = 0.881
External validation criteria
R2ext. = 0.712, RMSE ext. = 0.491, MAE ext. = 0.463, CCC ext. = 0.628
Table 5. Fitting, internal validation, and external validation criteria for R isozyme model.
Fitting criteria
R2 tr = 0.834, R2adj = 0.080, RMSE = 0.407 MAE tr = 0.346,
CCC tr = 0.909, s = 0.455, F = 25.081
Internal validation criteria
Q2lLOO = 0.726, RMSE cv = 0.522, MAE cv = 0.439,
Q2LMO = 0.683, CCC cv = 0.854
External validation criteria
R2ext. = 0.808, RMSE ext. = 0.372, MAE ext. = 0.297, CCC ext. = 0.854
Table 6. The average distances (A) between Arg/Gln192---Ca2+, His115---Ca2+ in QPON1, and RPON1 Isoenzymes over 20 ns.
CompoundArg192---Ca2+ DistanceGln192---Ca2+ DistanceHis115---Ca2+ Distance RPON1His115---Ca2+ Distance QPON1
γ-Butyrolactone (Figure 5)1.1071.3620.5250.944
Phenylacetate (Figure 6)1.4171.4040.4680.865
Paraoxon (Figure 7)1.2261.6690.2330.879
Sarine gas (Figure 8)1.4571.2530.9210.846
Substrate-free0.9701.4310.5410.688
Publisher’s Note: MDPI stays neutral with regard to jurisdictional claims in published maps and institutional affiliations.