Abstract
PI3Kα is one of the potential targets for novel anticancer drugs. In this study, a series of 2-difluoromethylbenzimidazole derivatives were studied based on the combination of molecular modeling techniques 3D-QSAR, molecular docking, and molecular dynamics. The results showed that the best comparative molecular field analysis (CoMFA) model had q2 = 0.797 and r2 = 0.996 and the best comparative molecular similarity indices analysis (CoMSIA) model had q2 = 0.567 and r2 = 0.960. It was indicated that these 3D-QSAR models have good verification and excellent prediction capabilities. The binding mode of the compound 29 and 4YKN was explored using molecular docking and a molecular dynamics simulation. Ultimately, five new PI3Kα inhibitors were designed and screened by these models. Then, two of them (86, 87) were selected to be synthesized and biologically evaluated, with a satisfying result (22.8 nM for 86 and 33.6 nM for 87).
1. Introduction
PI3K/AKT/mTOR signaling is a therapeutic targeting pathway for the development of cancer treatment, which is activated aberrantly in many human cancers [1,2,3].
Phosphoinositide 3-kinase (PI3K) is a kind of signal transducing enzyme that mediates key cellular functions in cancer and immunity and could be categorized into three classes (class I, class II, and class III) based on sequence homology [4,5,6,7]. Class I PI3Ks are further classified into class IA (PI3Kα, β, and δ) and class IB (PI3Kγ), which have been extensively studied [1,8,9]. Their main function is to catalyze the 3-hydroxyl phosphorylation of the phosphatidylinositol 4,5-diphosphate (PIP2) inositol ring to phosphatidylinositol 3,4,5-triphosphate (PIP3), which facilitates the activation of its downstream effectors [10,11,12].
Class II PI3Ks are composed of PI3KC2α PI3KC2β, and PI3KC2γ, which modulate intracellular membrane dynamics and membrane traffic [13]. Class III PI3Ks have as the only member VPS34, which participates in vesicle trafficking and autophagy [13].
Among the subtypes of PI3K, PI3Kα is most often associated with cancer and controls a variety of physiological processes as an important regulator of intracellular signaling pathways [8,14]. The aberrant activation of PI3Kα and its downstream effectors is related to tumor initiation and maintenance [15]. The selective targeting of the PI3Kα isoform has special pharmacological significance, which makes PI3Kα an attractive target in anticancer drug development [10,16]. However, although great efforts have been made to explore PI3Kα inhibitors, there are few reports on PI3Kα inhibitors that possess the ability to differentiate between PI3Kα and its isoforms [17].
Many potent PI3K inhibitors have been disclosed since the discovery of the first-generation inhibitors, for example, Wortmannin and LY294002 [18]. Five of them (Idelalisib, Copanlisib, Duvelisib, Alpelisib, and Umbralisib) have been approved by the FDA, and the corresponding structures are depicted in Figure 1. It is worth noting that Alpelisib is a PI3Kα-specific inhibitor and was approved by the Food and Drug Administration (FDA) in 2019. It is used in combination with fulvestrant to treat HR+/HER2− advanced breast cancer patients [19]. It is assumed that the selective PI3Kα inhibitors could protect the patients from the side effects associated with a broader inhibition, which allows greater suppression of the signaling pathway and durable antitumor efficacy [7].
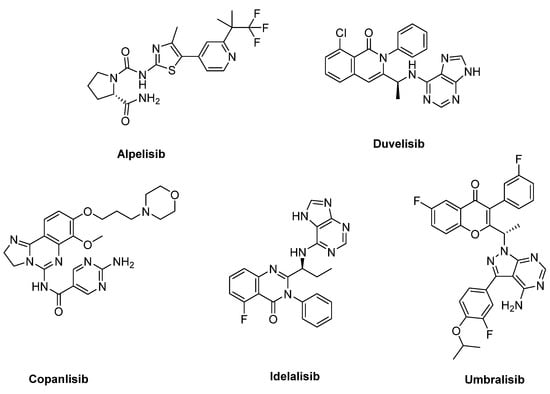
Figure 1.
Structures of the PI3K inhibitors approved by the FDA.
In this study, 3D-QSAR models were developed using CoMFA [20] and CoMSIA [21] technology based on 85 2-difluoromethylbenzimidazole derivatives [22,23,24]. The relationships between the key structural and pharmacodynamic information were obtained from the 3D-QSAR model, which were helpful for further drug research [25,26,27,28,29,30]. The binding mode of the compound 29 with 4YKN was explored through molecular docking and molecular dynamics simulation. Ultimately, five new PI3Kα inhibitors were designed and evaluated. Two of them were selected to be synthesized and biologically evaluated. Compound 86 (IC50 = 22.8 nM) and compound 87 (IC50 = 33.6 nM) showed potent inhibitory activity against PI3Kα.
2. Results and Discussion
2.1. CoMFA and CoMSIA Statistical Results
To verify the predictive ability of the model, all key statistical parameters were analyzed. The statistical parameters of standard CoMFA and CoMSIA models are given in Table 1. For CoMFA analysis, Partial Least Square (PLS) analysis showed cross-validated correlation coefficient (q2) value of 0.797, non-cross-validated correlation coefficient (r2) of 0.996, and the optimal number of components (ONC) of 10 in the training set. The contribution of the electrostatic field (50.4%) to the binding affinity was close to that of the steric field (49.6%). For CoMSIA analysis, PLS analysis showed q2 value of 0.567, r2 of 0.960, Fisher test (F) = 230.278, and Standard Error of Estimate (SEE) of 0.099, with 6 components in the training set.

Table 1.
The best results of the CoMFA and CoMSIA PLS statistical results.
2.2. 3D-QSAR Contour Map Results and Analysis
In the optimized CoMFA and CoMSIA models, the most active compound, 29, was used as a template molecule in all subsequent contour maps (Figure 2 and Figure 3). Contour maps are important for designing new drug candidates because they show areas where changes in the molecular field energy are closely related to changes in biological activity.
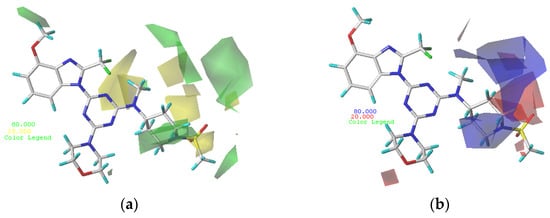
Figure 2.
Contour maps of compound 29. (a) Steric contour maps of CoMFA: favored (green) and disfavored (yellow); (b) electrostatic contour maps of CoMFA: electrostatic (blue) and electronegative (red).
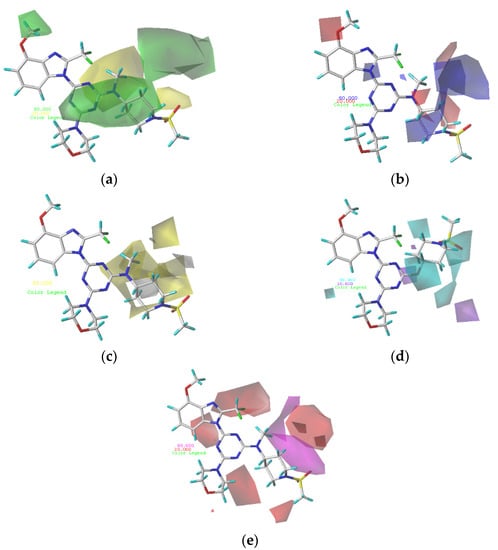
Figure 3.
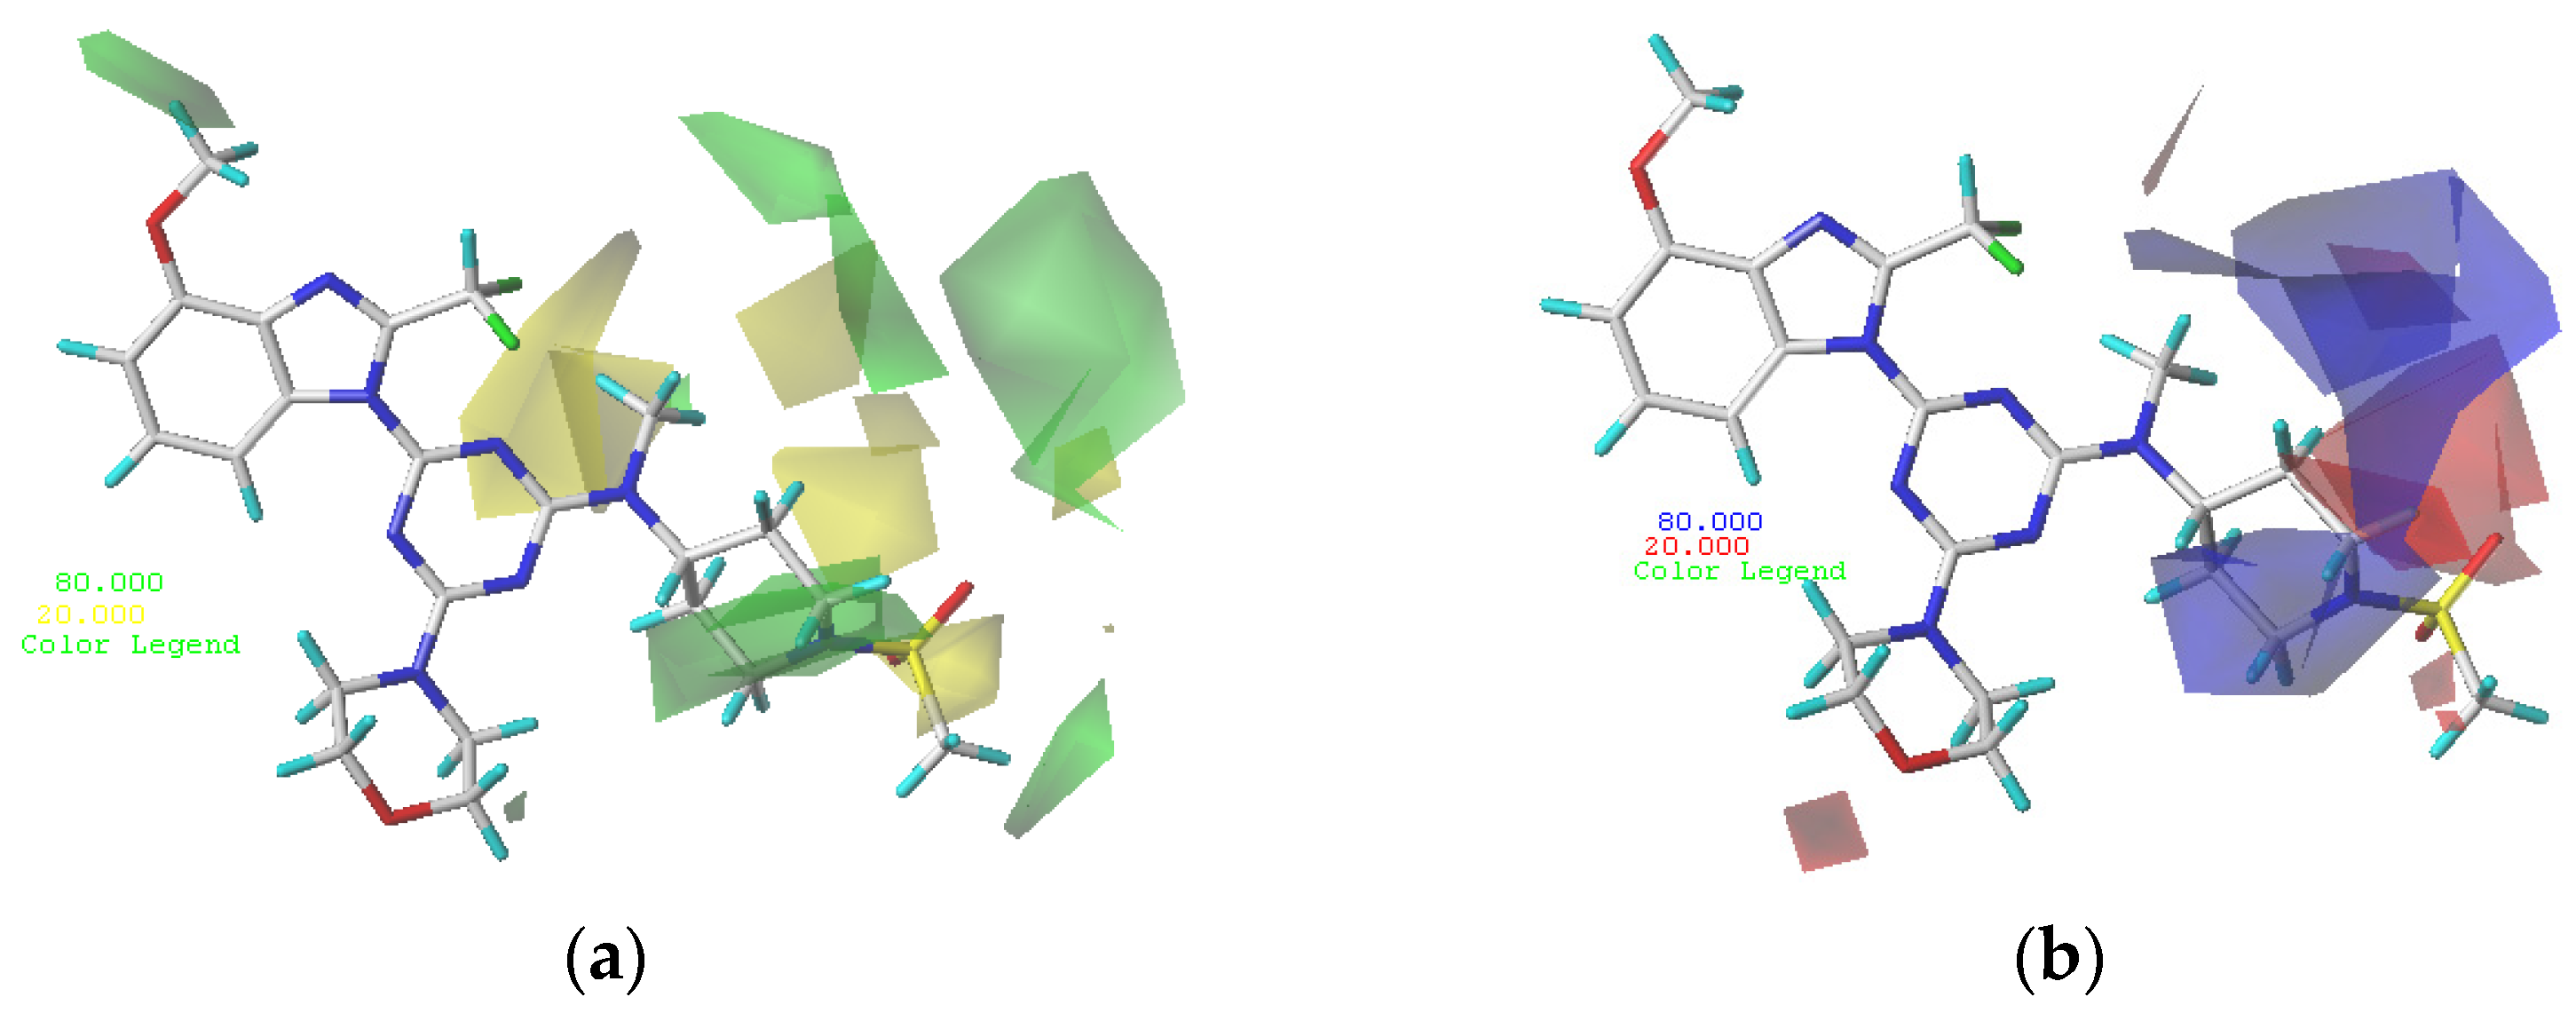
(a) Steric contour maps of CoMSIA; (b) electrostatic contour maps of CoMSIA; (c) hydrophobic contour maps of CoMSIA: favored (yellow) and disfavored (gray); (d) hydrogen bond donor contour maps of CoMSIA: favored (cyan) and disfavored (purple); (e) hydrogen bond acceptor contour maps of CoMSIA: favored (magenta) and disfavored (red).
The steric and electrostatic fields from the optimal CoMFA model are shown in Figure 2. As shown in the steric map (Figure 2a), areas where steric bulk substituents increased the potency are represented by green polyhedrons, while areas where steric bulk substituents decreased the potency are represented by yellow polyhedrons. The medium green contour occurring at R2 of compound 29 indicates that compounds with bulk substituents at this site would have better biological activity. Compound 2 (pIC50 = 8.4), with a methoxy group at R2, possesses better biological activity than compound 1 (pIC50 = 8.05), without methoxy substitution. The medium-yellow contour in the near-methylsulfonyl group at R1 of compound 29 indicates that compounds with small substitutions would have better biological activity. Compound 5 (pIC50 = 8.22), with the methylsulfonyl group, possesses better biological activity than compound 6 (pIC50 = 7.68), with the ethylsulfonyl group. A large green contour occurring in the piperidine ring at R1 of compound 29 indicates that compounds with bulk substituents at this site would have better biological activity. Compound 17 (pIC50 = 8.29), with a 6-membered ring, possesses better biological activity than the corresponding compound 21 (pIC50 = 8.12), with a 5-membered ring, and compound 25 (pIC50 = 7.49), with a 4-membered ring.
As shown in the electrostatic map (Figure 2b), the blue area indicates that the electropositive group is beneficial to biological activity and the red area indicates that the electronegative group is beneficial to biological activity. A large blue contour occurring near the 2′-site of the piperidine ring at R1 of compound 29 indicates that compounds with electropositive substituents at this site would have better biological activity. Compound 29 (pIC50 = 8.64), with -N at the 1′-site of the piperidine ring, possesses better biological activity than the corresponding compound 31 (pIC50 = 7.7), with -N at the 2′-site of the piperidine ring. A small red contour occurring above the aminomethyl group of R1 of compound 29 indicates that compounds with electronegative substituents at this site would have better biological activity. Compound 29 (pIC50 = 8.64), with the aminomethyl group, possesses better biological activity than compound 28 (pIC50 = 7.85), with the imino group.
Figure 3a depicts the CoMSIA steric contour map of the optimal model with compound 29 overlaid. In this map, the green contours (sterically beneficial) and yellow contours (sterically unbeneficial) contours represent 80% and 20% level contributions, respectively. A small green contour occurring above R2 of compound 29 indicates that compounds with bulk substituents at this site would have better biological activity. Compound 5 (pIC50 = 8.22), with the methoxy group at R2, possesses better biological activity than compound 4 (pIC50 = 7.68), without the methoxy group. A medium-yellow contour occurring near the sulfonamide group indicates that compounds with small substituents at this site would have better biological activity. Compound 47 (pIC50 = 7.11), with -NH2 not in the yellow contour, possesses slightly better biological activity than the corresponding compound 48 (pIC50 = 6.97), with -NH2 in the yellow contour.
The electrostatic contour map of the CoMSIA model is displayed in Figure 3b. The blue (electropositive group favorable) and red (electronegative group favorable) contours represent 80% and 20% level contributions, respectively. A medium-red contour occurring near the oxygen atom of R1 of compound 29 indicates that compounds with electronegative substituents at this site would have better biological activity. Compound 2 (pIC50 = 8.64) with -OCH3 possess better biological activity than compound 1 (pIC50 = 7.85), with -H. A medium-blue contour was observed on the piperidine ring of R1, which revealed that an improvement in the electropositivity of this site would improve the biological activity.
The CoMSIA contour map of hydrophobic contribution is described in Figure 3c. In this figure, the yellow (hydrophobic favorable) and white (hydrophobic unfavorable) contours represent 80% and 20% level contributions, respectively. Small yellow contours occurring near the 2′-site of piperidin at R1 of compound 29 indicates that the hydrophobic group at this site would improve the biological activity. Compound 10 (pIC50 = 8.49), with -CH2 at the 4′-site of piperidin, possesses better biological activity than compound 9 (pIC50 = 8.13), without -CH2. Small white contours covering the 2′,3′-site of piperidin at R1 of compound 29 indicates that a hydrophobic group at this site would reduce the biological activity.
In Figure 3d, the cyan and purple contour maps indicate favorable and unfavorable H-bond donor groups, representing 80% and 20% level contributions, respectively. A medium cyan contour occurring at R1 illustrates that compounds with an H-bond donor substituent at this site were preferred to have higher PI3Kα inhibitory activity. Compound 3 (pIC50 = 8.51), with -NH2, possesses slightly better biological activity than compound 2 (pIC50 = 8.40), with -H. A medium purple contour is located blew the piperidine ring at R1 of compound 29, indicating the H-bond donor substituents that had bad biological activity.
As shown in Figure 3e, the hydrogen bond acceptor field of the CoMSIA model is represented by magenta (hydrogen bond acceptor favorable) and red (hydrogen bond acceptor unfavorable), representing 80% and 20% level contributions, respectively. Small red contours of the methylsulfonyl group suggest that the introduction of hydrogen bond acceptor substituents to these regions would decrease biological activity. A medium magenta contour near the piperidin ring at R1 of compound 29 shows that hydrogen bond acceptor substituents would have better biological activity. Compound 7 (pIC50 = 8.12), with -N(CH3)2, possesses better biological activity than compound 6 (pIC50 = 7.68), with -CH2CH3 in the yellow contour.
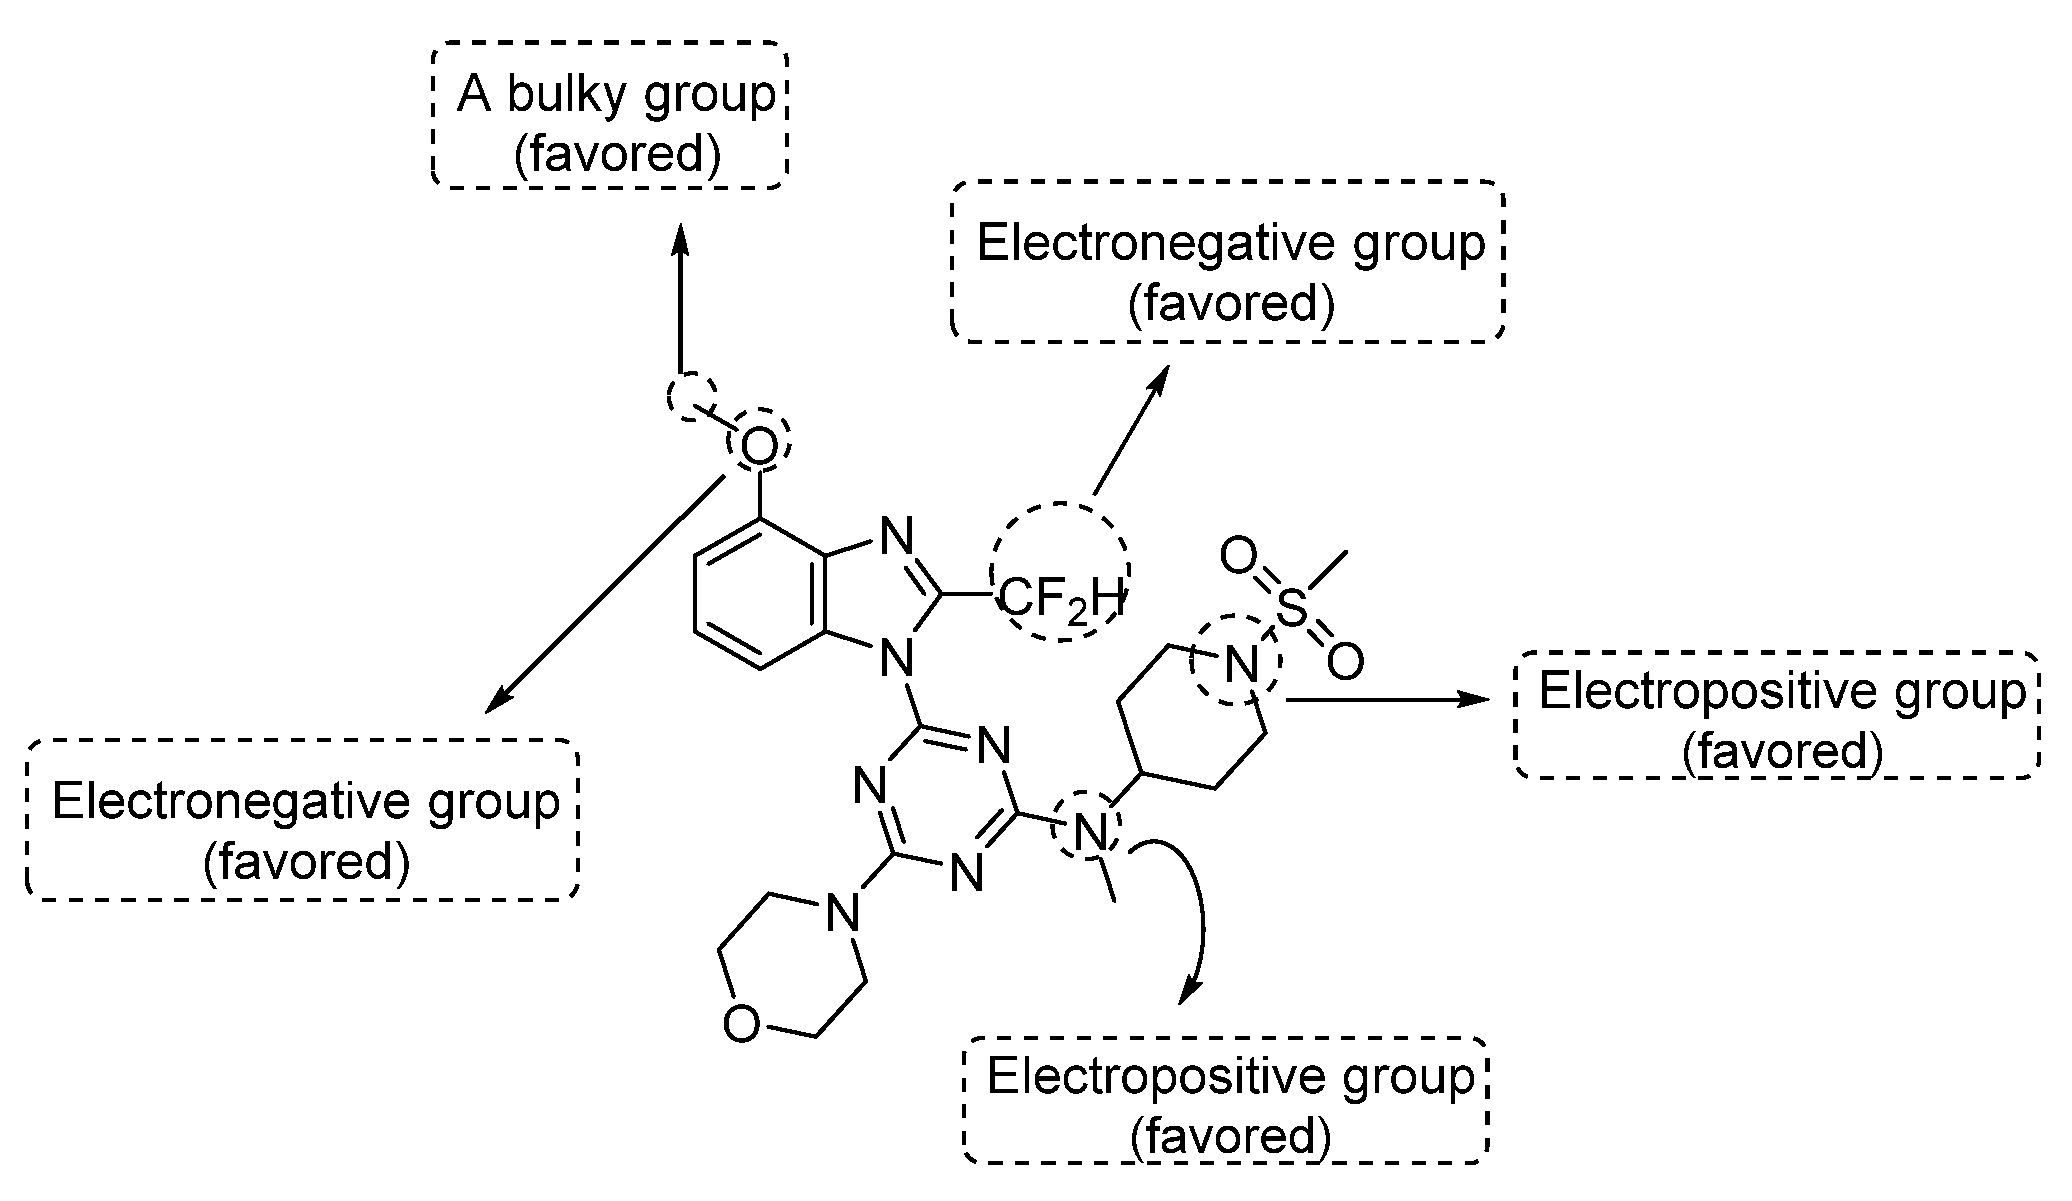
The above-mentioned contour analyses of CoMFA and CoMSIA are summarized in Figure 4, which provides effective help for the future design of new PI3Kα inhibitors.

Figure 4.
Structural modification tips derived from 3D-QSAR studies.
2.3. Molecular Docking Results and Analysis
Docking studies were performed on compound 29 as the template. As shown in Figure 5, template compound 29 was docked in the binding cavity of the 4ykn with three non-classical H-bonds. An intramolecular H-bond (-H…N-, 2.62 Å) was built between -H of the methoxy group at R2 and the -N group at the 2′-site of the nuclear structure. Two hydrogen atoms of -NCH3 at R1 interacted through H-bonding with -O=C of Ser1078 (-H…O=C-, 2.60 Å, -H…O=C-, 2.65 Å), which increased the affinity between compound 29 and the protein.
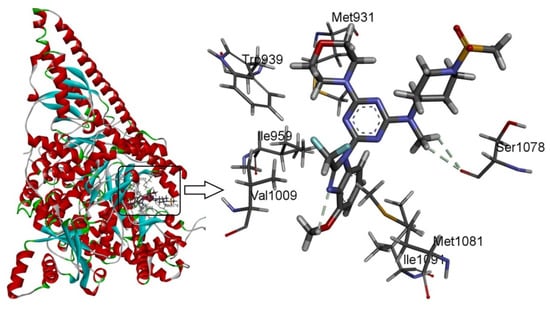
Figure 5.
Docking of the representative ligand compound 29 into the binding site of PI3Kα. Ligands and the important residues of the binding interaction are depicted by stick-and-line models.
2.4. Molecular Dynamics Simulation Results and Analysis
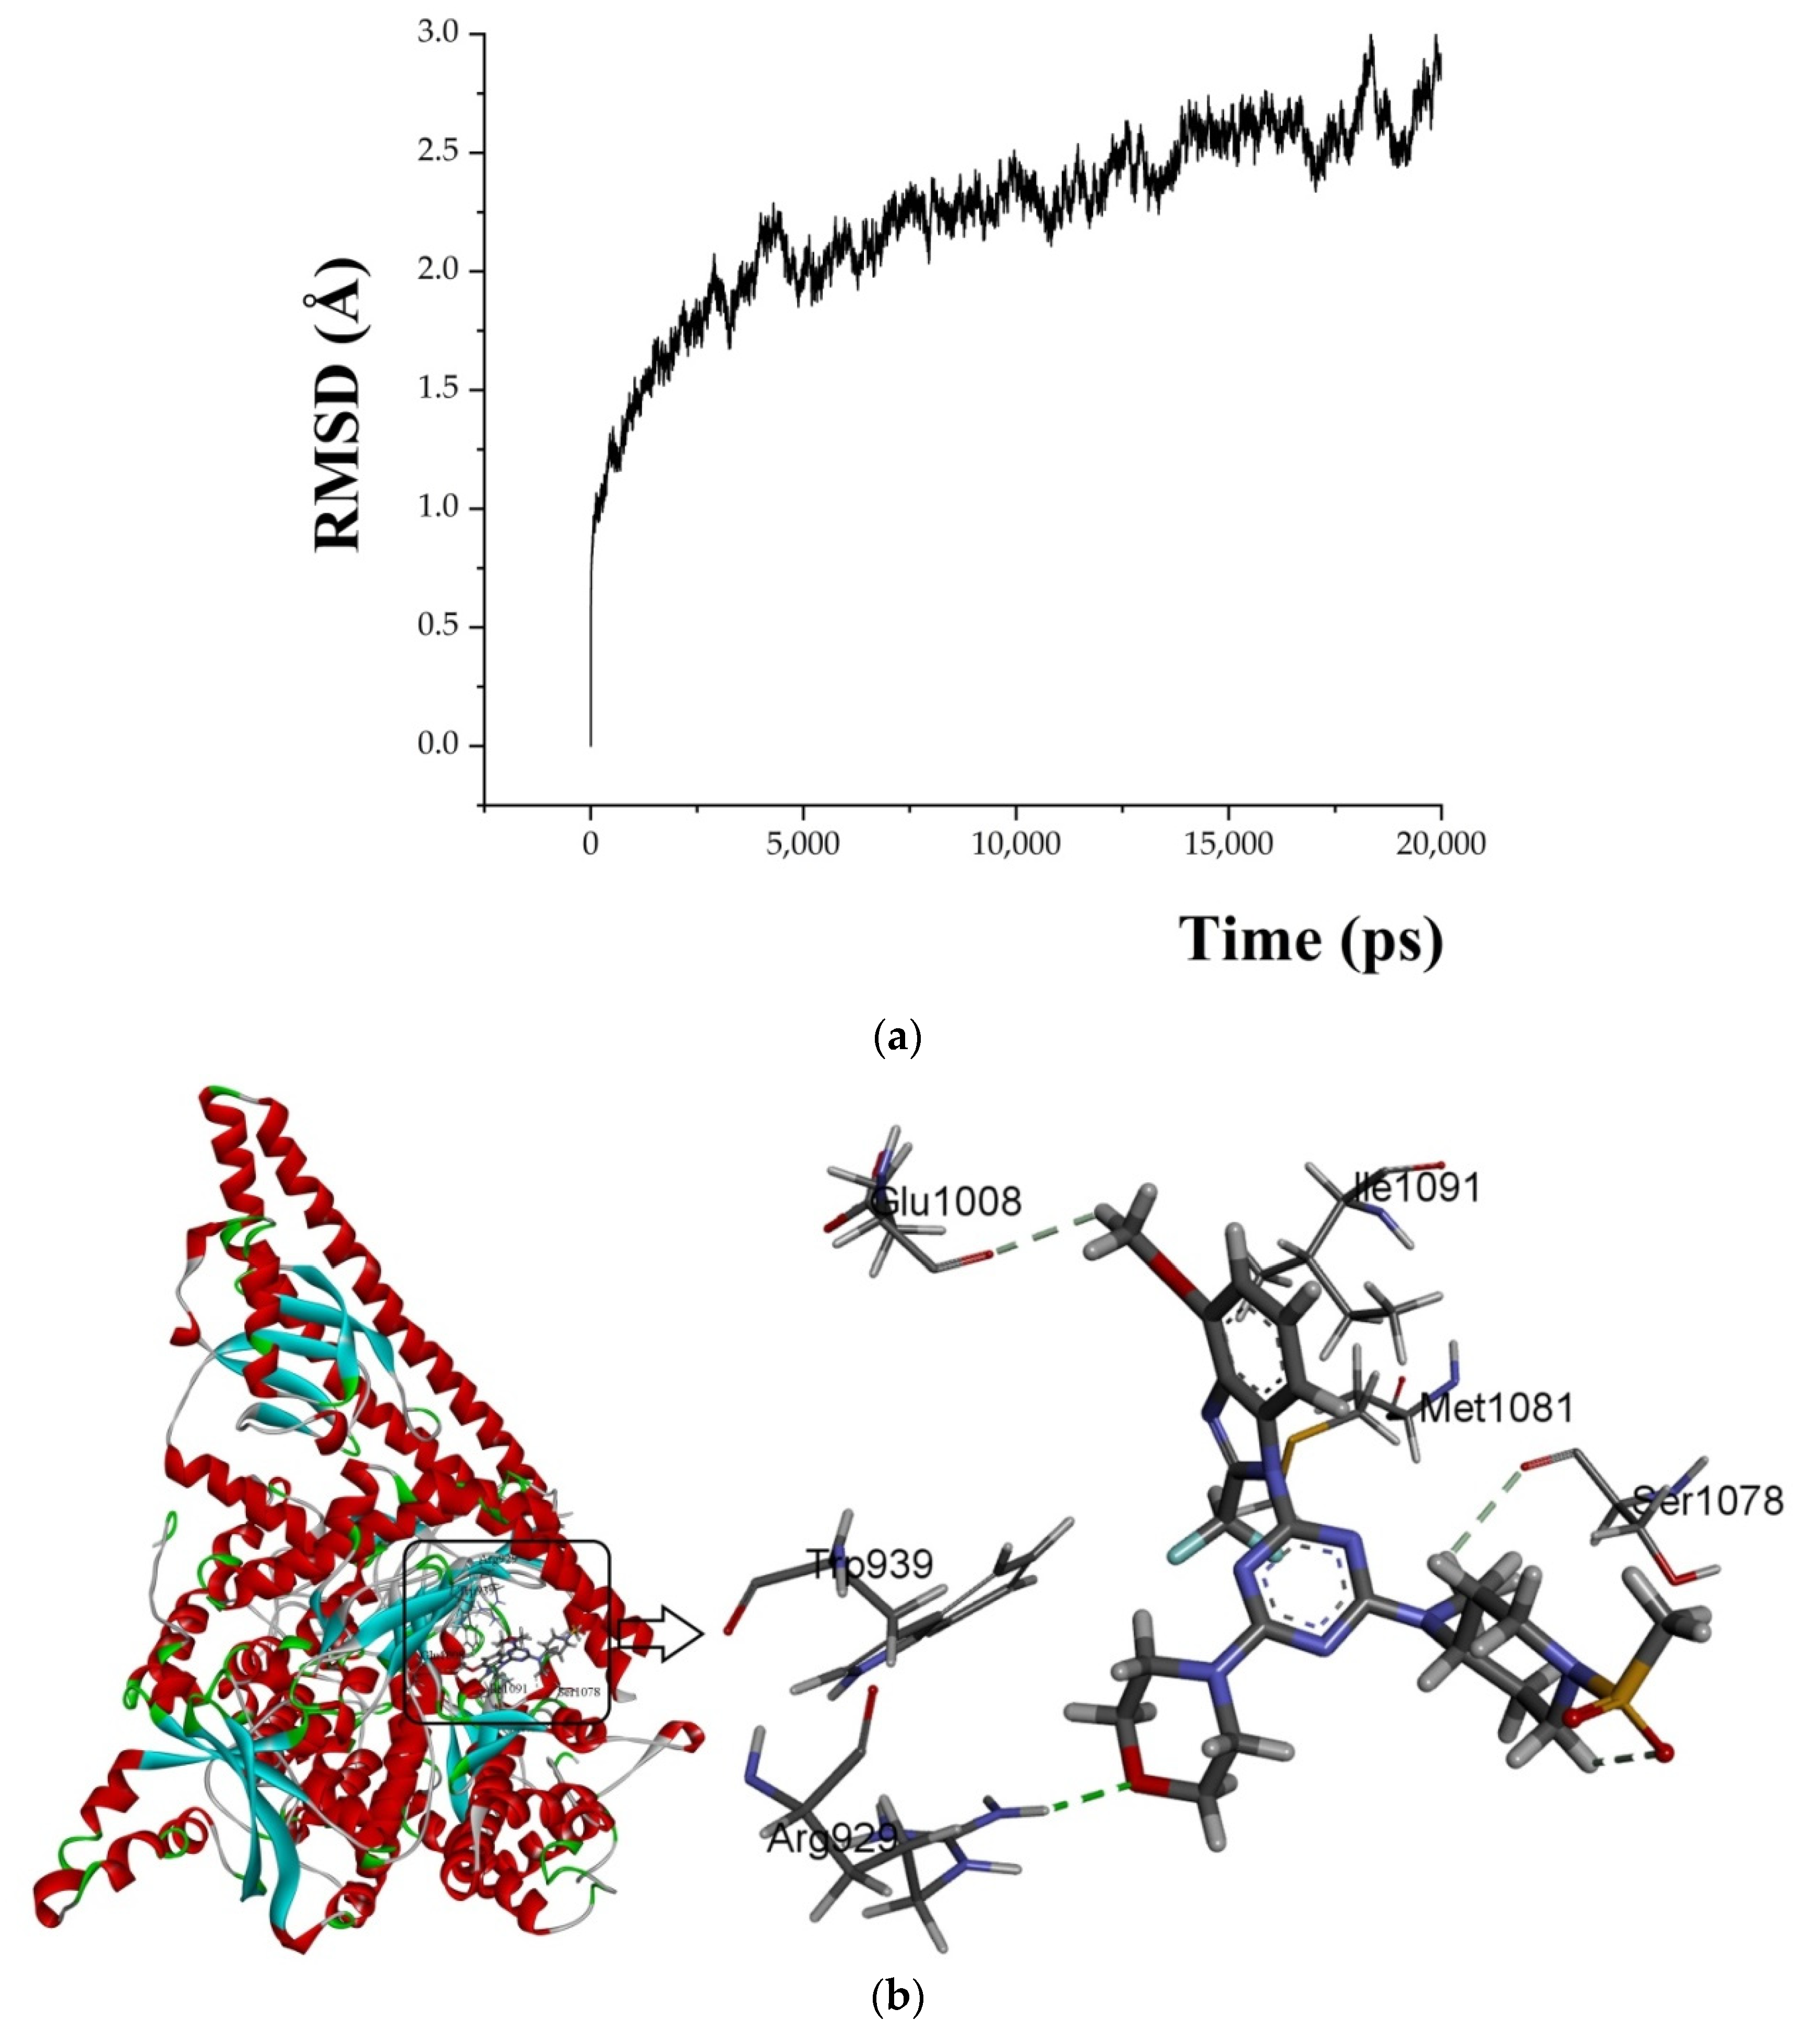
A 20 ns molecular dynamics (MD) simulation was carried out using the above-mentioned docking complexes (PI3Kα with ligand 29). The main purpose of the simulation was to optimize the binding pocket and the correlation between PI3Kα and compound 29. The root-mean-square deviation (RMSD) plots are shown in Figure 6a for the receptor (4YKN) and the ligand (compound 29) to explore conformational variations. After 10 ns, the RMSD of the complex was about 2.5 Å, and it retained this value throughout the simulation. A superposition of the most stable structure in all MD simulations and the initial docked structure is shown in Figure 6b,c. After MD simulation, the interactions between compound 29 and the receptor were analyzed here in order to explore the similarity and difference between the results of docking and MD simulation. From the most stable structure extracted from the MD simulation, the model also revealed that one classical hydrogen bond and three non-classical hydrogen bonds are formed between the ligand and the receptor (shown in Figure 6a). The oxygen atom of the morpholine group at R1 interacts through classical H-bonding with -NH of Arg929 (-O…H-, 2.53 Å). The oxygen atom of methanesulfonyl at R1 interacts through intramolecular H-bonding with -H of the piperidine ring (-O…H-, 2.51 Å). The methoxy group at R2 forms a non-classical H-bond with Glu1008 (-C=O…H-, 2.76 Å). The hydrogen atom of -NCH3 at R1 interacts through a non-classical H-bond with -O=C of Ser1078 (-H…O=C-, 3.07 Å). The number of hydrogen bonds in this MD simulation result was more than that in the docking model, and a classic hydrogen bond was formed between the protein and the receptor. Therefore, the conformation obtained after MD simulation was more stable than the docked conformation. MD simulation is performed in a more realistic environment and much closer to physiological conditions.

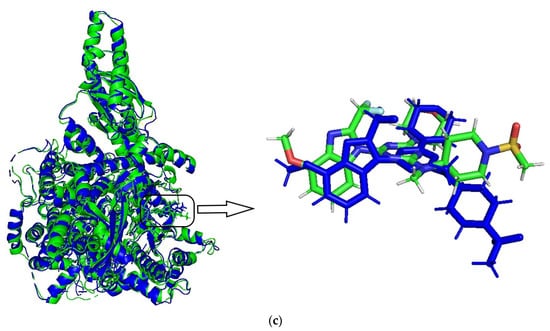
Figure 6.
MD simulation results. (a) plot of the RMSD of the docked complex versus the MD simulation time in the MD-simulated structures; (b) Plot of the MD-simulated structure of the binding site with the ligand. Compound 29 was in the active site of PI3Kα. H-bonds are shown as dotted green lines; active site amino acid residues are represented as sticks; the inhibitors are shown as sticks; (c) view of superimposed backbone atoms of the lowest energy structure of the MD simulation (blue) and the initial structure (green) for the compound 29–PI3Kα complex. Compound 29 is represented as a carbon chain in green for the initial complex and a carbon chain in blue for the lowest energy complex.
2.5. Design and Prediction
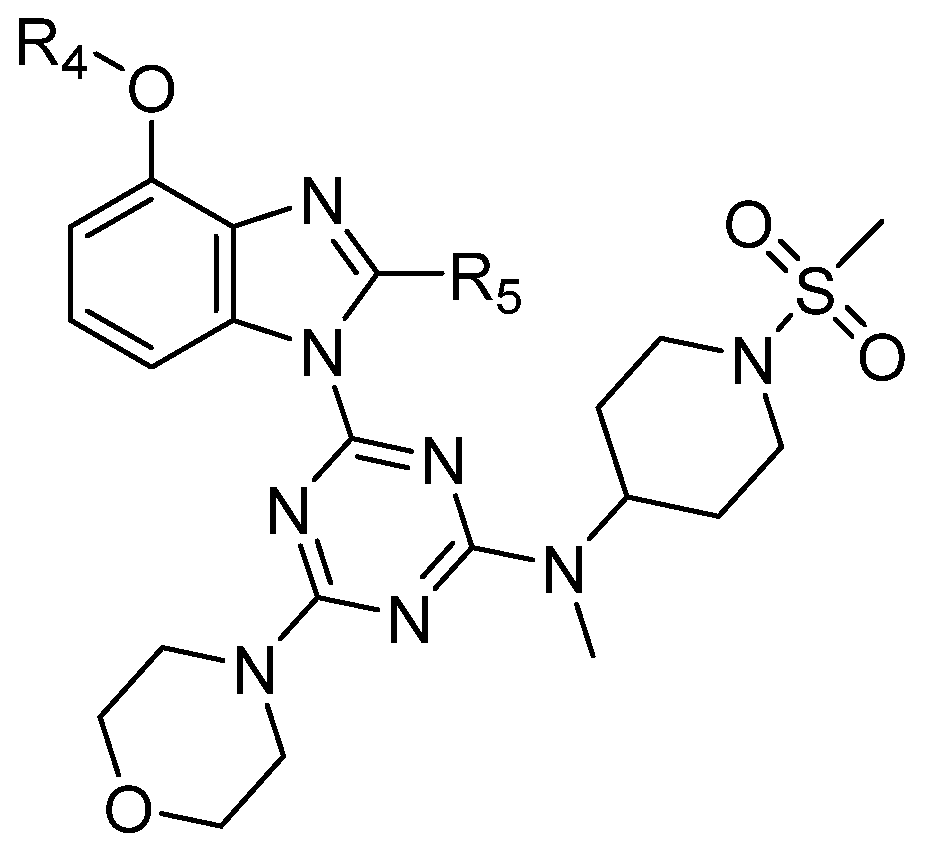
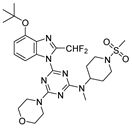
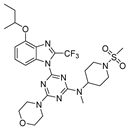
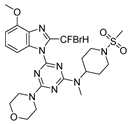
On the basis of the above-mentioned analysis, five novel structures (compounds 86–90), with -CH3/-CH2CH3/-C(CH3)3/CH2CH (CH3)CH3 for R4 and -CF3/-CHF2/-CHFBr for R5, were designed based on the template compound 29 (Figure 7). The predicted values are shown in Table 2. Compounds 86–90 might have higher activities than the template compound 29 in the 3D-QSAR models; it was indicated that these new designed compounds might become potential candidates as PI3Kα inhibitors. Compounds 86 and 87 were synthesized to validate the reliability of this 3D-QSAR model.

Figure 7.
The structure of the designed compounds based on the template compound 29.
Table 2.
Structures of the compounds with predicted activity.
Based on the MD simulations, the binding free energy calculations for compounds 29, 86, and 87 of the last 2 ns trajectory were carried out. The binding free energy values for the compounds 29, 86, and 87 via MM/GBSA were calculated to be −23.83, −29.79, and −41.29 kcal/mol. This further shows that 86 and 87 would have better activity. Their synthesis route is shown in Scheme 1.
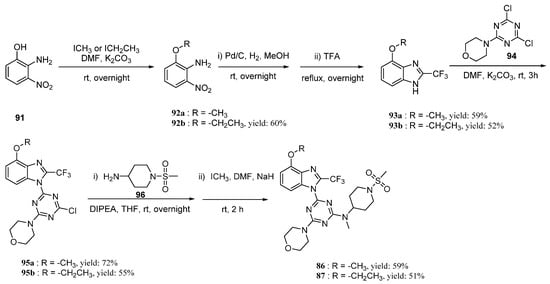
Scheme 1.
Synthesis of compounds 86 and 87.
2.6. The Synthesis of Compounds 86 and 87
Two novel 2-difluoromethylbenzimidazole derivatives (86, 87) were synthesized according to Scheme 1. The compounds 91, 92a, 94, and 96 are commercially available and were used without further purification. The compounds 86b and 87a were synthesized with reference to previous literature [31,32,33]. Compounds 93a or 93b were synthesized by Pd/C hydrogenation and subsequent dehydration cyclization with trifluoroacetic acid, with moderate yields of 59% and 60%, respectively. Then, under the action of potassium carbonate in DMF, 95a and 95b were obtained via the first SNAr reaction and the yields were 59% and 52%, respectively. Finally, after the second SNAr reaction at the residual chlorine atom in 95a and 95b under slightly stronger reaction conditions, and subsequent methylation by methyl iodide, the desired compounds 86 and 87 were achieved with 59% and 51% yields, respectively.
2.7. Biological Evaluation
IC50 values of the compound 86, 87, PIK-90, and ZSTK474 against PI3Kα are listed in Table 3 and Figure 8. ZSTK474 and PIK-90 were used as the reference drug. The results showed that compound 86 and 87 both have potent inhibitory activity against PI3Kα, close to that of ZSTK474.
Table 3.
IC50 values of compounds 86, 87, PIK-90, and ZSTK474 against PI3Kα.
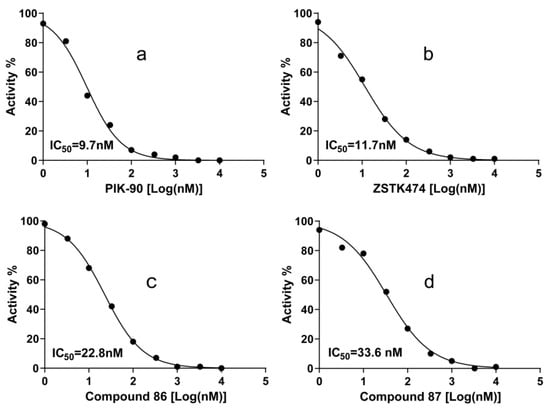
Figure 8.
Dose response curves of PI3Kα inhibitors PIK-90 (a), ZSTK474 (b), compound 86 (c) and Compound 87 (d). IC50 values were measured with ATP as the PI3Kα substrate. Each experiment was carried out in duplicate and repeated three times.
3. Materials and Methods
3.1. Datasets and Biological Activity
In 3D-QSAR studies, a set of 85 2-difluoromethylbenzimidazole derivatives had good biological activity against PI3Kα, and these derivatives were collected from the literature [22,23,24]. All derivatives were allocated to the training set and the test set: the training set, containing 65 compounds (76%), would generate a 3D-QSAR model, and the test set, containing 20 compounds (24%), would confirm the reliability of the models. The test set was selected randomly so that the data set would show high structural diversity and a wide range of activities.
The CoMFA and CoMSIA models were created using the Sybyl X 2.0 software package, in which Gasteiger–Hückel [34] charge was added to all compounds, and its energy was minimized at the Tripos force field [35] using the Powell gradient algorithm. To obtain the most stable conformation, the convergence criterion is 0.005 kcal/mol·Å, and the maximum number of iterations was set to 10,000. Their chemical structures and active values against PI3Kα are listed in Supplementary Information (Table S1).
3.2. Molecular Modeling and Alignment
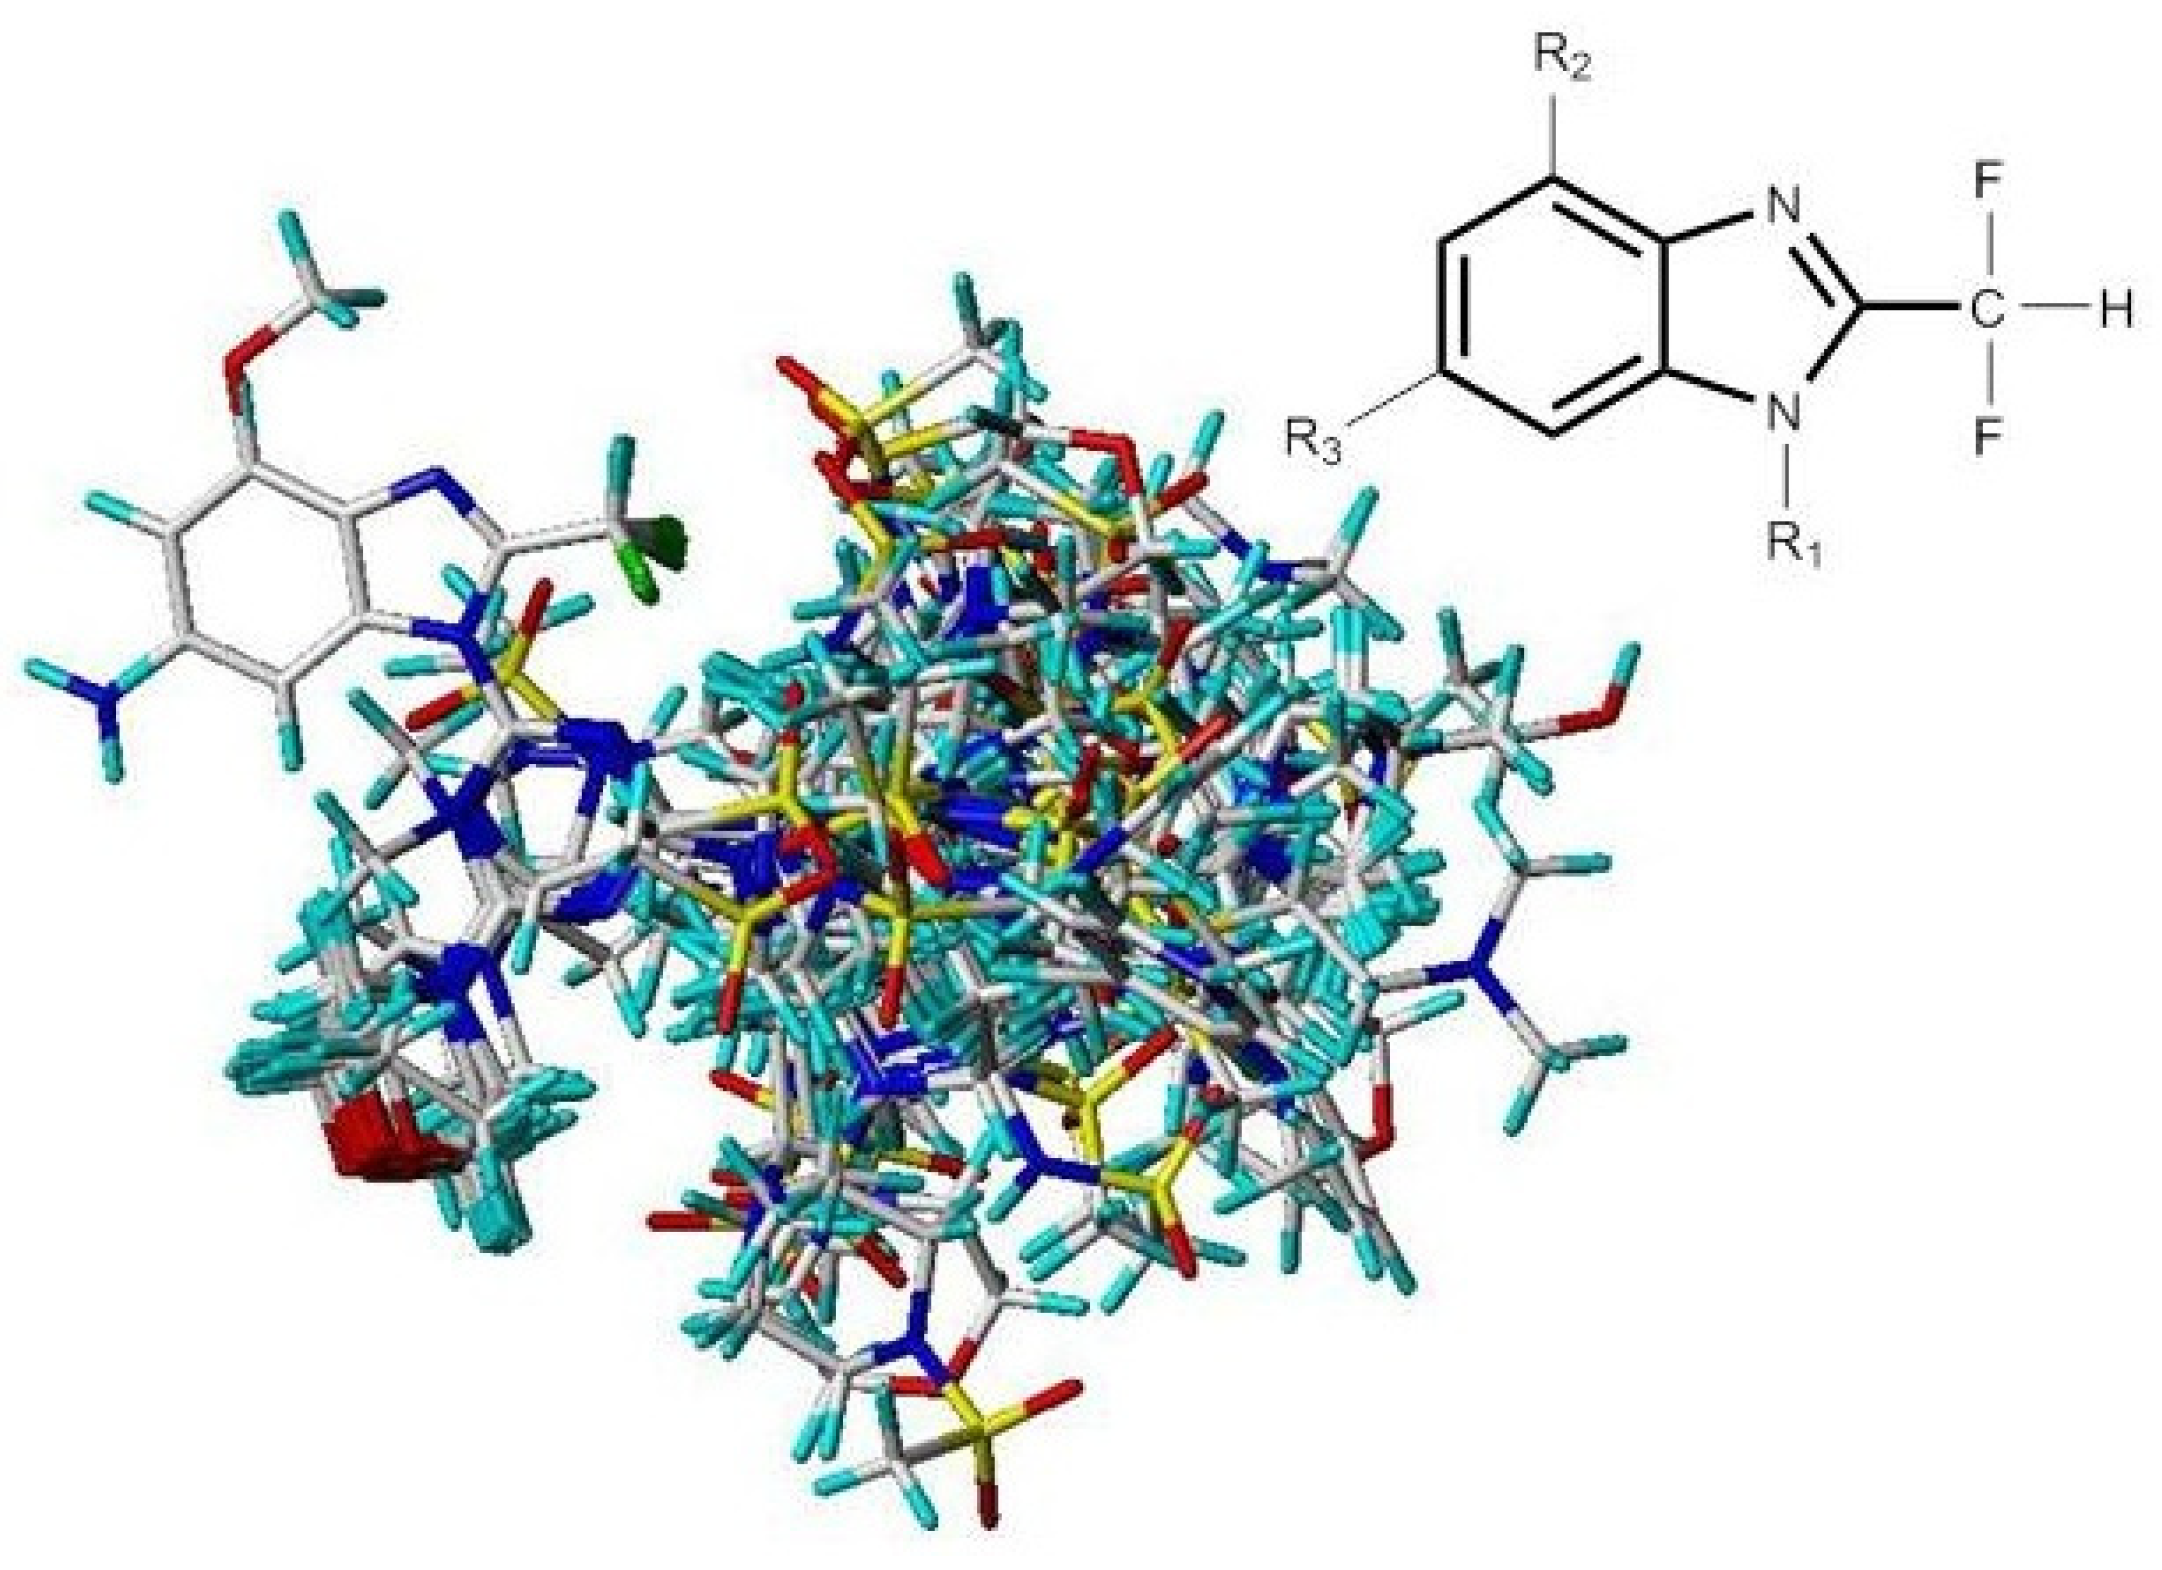
Molecules of the training sets were aligned onto the molecules that had the most potent inhibitor (compound 29). Compound 29 was employed as the template molecule because of its highest PI3Kα inhibitory activity amongst training sets, and the corresponding results are shown in Figure 9. The common substructure is depicted in bold.

Figure 9.
Molecular alignments of all compounds in the data set.
3.3. 3D-QSAR Models Studies
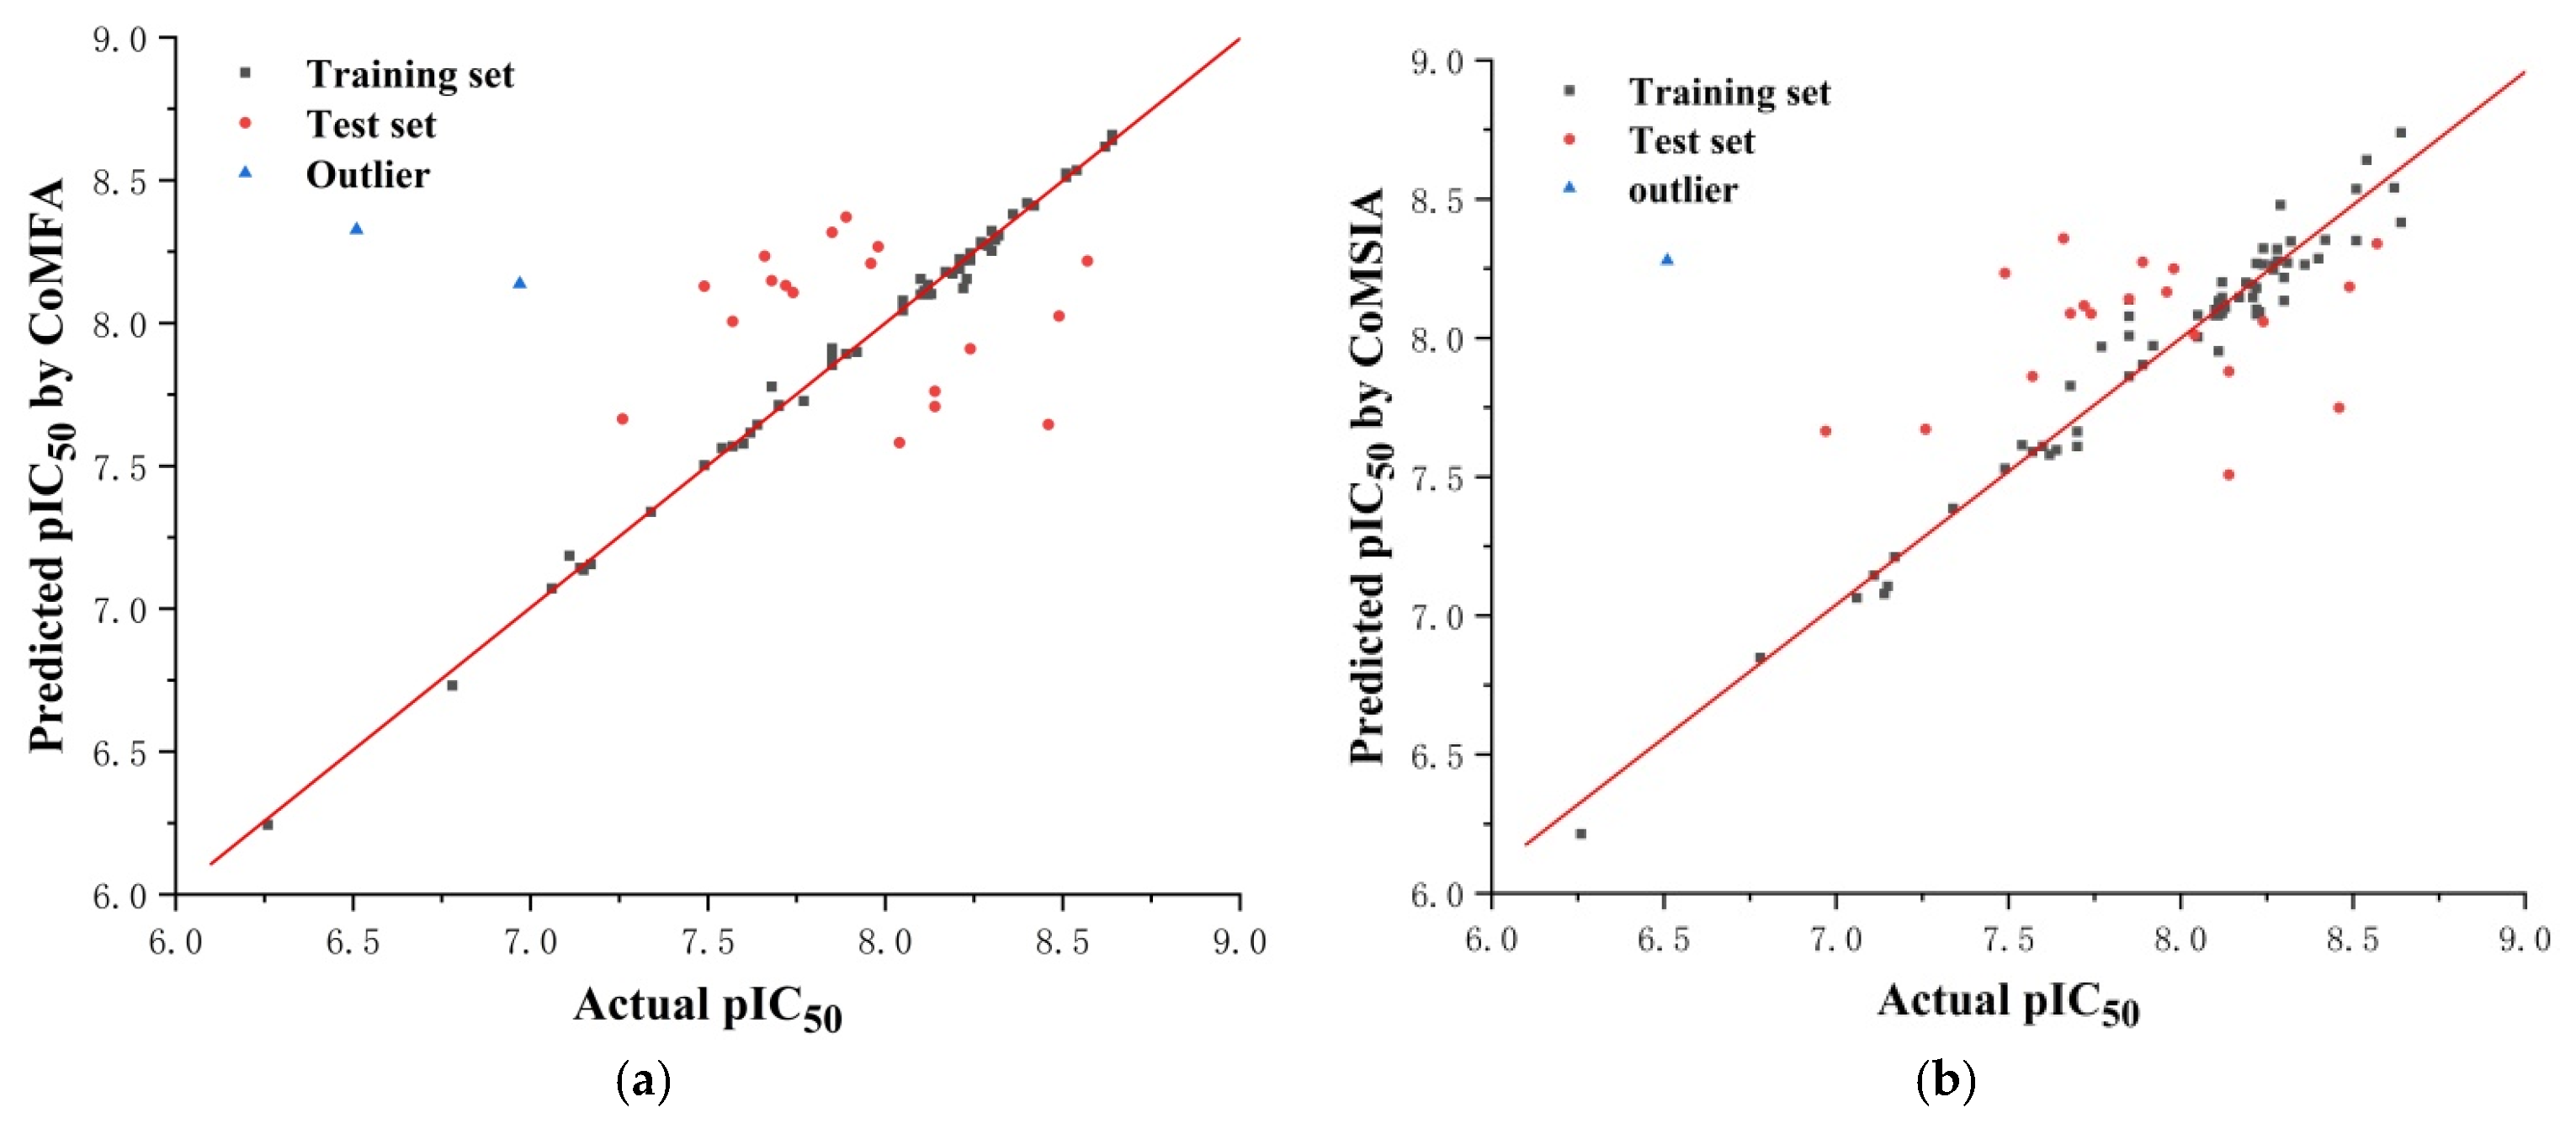
The reliability and predictive ability of the 3D-QSAR models were evaluated through internal and external validation. In the partial least squares (PLS) analysis, the leave-one-out (LOO) method was used to determine the optimum number of components (NOC). In the 3D-QSAR model validation, non-cross-validated correlation coefficient (r2ncv), standard error estimate (SEE), and F-statistic values (F) were obtained. Each molecule’s predicted value and actual value are in a linear relationship and, respectively, shown in Figure 10. The predicted pIC50 values via CoMFA and CoMSIA models are listed in Supplementary Information (Table S2).
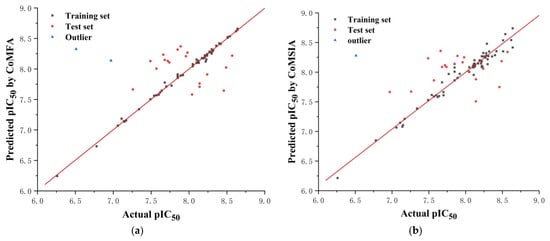
Figure 10.
The correlation plots of the predicted pIC50 values versus the actual pIC50 values using the training set and the test set based on the CoMFA (a) model and the CoMSIA (b) model, respectively.
Five fields (steric, electrostatic, donor, acceptor, and hydrophobic) were considered during PLS analysis. The relationship between actual and predicted pIC50 values of the training and test set molecules is illustrated in Figure 10.
Before this validation, an initial inspection of the predicted activities revealed poor predictions for compounds 14 and 48, which were considered outliers in our work for both the ligand-based and receptor-based models. The steric hindrance of the morpholine ring of compound 14 was increased by two methylene bridges. The structure was different from that of other compounds, which was inconsistent with the model, and it led to abnormal activity values. The terminal methyl group of compound 48 was surrounded by a blue area in the electrostatic map, which was inconsistent with the model, and it resulted in abnormal activity values.
3.4. Molecular Docking
Molecular docking studies were carried out using the Surflex-Dock module in Sybyl-x 2.0, which aimed to analyze the detailed binding mode of small molecules and PI3Kα and to validate the 3D-QSAR models. The 3D structures of PI3Kα (PDB code: 4ykn) were downloaded from the RCSB protein database. The protein ligands and water were removed, and the pocket used to combine with molecules was exposed before docking.
3.5. Molecular Dynamics Simulation
A 20 ns molecular dynamics simulation was carried out on the docking complex to assess the reliability of the docking results and further explore the 29—PI3Kα interactions. Amber 12.0 software [36] was used for molecular dynamics studies. The general AMBER force field (GAFF) and the Amber ff12SB were employed on the ligands and the proteins, respectively. Na+ was included to neutralize the system within a cubic water box. The entire molecular dynamics simulation followed the procedures for minimization, heating, density balance, and production. The steepest descent and the conjugate gradient method were used to minimize the energy of the whole system. The minimized system was heated to 300 K gradually over 20 ps under the NVT ensemble. Then 20 ns unrestrained MD simulations were performed in the NPT ensemble at 1 atm and a temperature of 300 K. All hydrogen atoms were constrained by SHAKE algorithm [37]. After the MD simulation, the root-mean-square deviation (RMSD) was calculated to evaluate the stability of the complex system.
3.6. Chemistry
3.6.1. 2-Ethoxy-6-nitroaniline 92b
To a stirred solution of 2-amino-3-nitrophenol (5.000 g, 32.44 mmol) in DMF (25 mL) was added powdered K2CO3 (4.930 g, 35.69 mmol) and iodoethane (5.570 g, 35.69 mmol). The mixture was stirred at room temperature overnight and then diluted with NH4Cl (saturated) and extracted with EtOAc (×3). Organic layers were washed with water and brine, dried over Na2SO4, filtered, and concentrated. Purification by column chromatography (PE/EA = 4:1) through silica gel afforded the intermediate 92b (3.560 g; 60%), a brown solid; the yield was: 60%. 1H-NMR (501 MHz, chloroform-d) δ 7.70 (dd, J = 8.9, 1.3 Hz, 1H), 6.85 (dd, J = 7.8, 1.4 Hz, 1H), 6.57 (dd, J = 8.9, 7.7 Hz, 1H), 6.44 (s, 2H), 4.10 (q, J = 7.0 Hz, 2H), 1.48 (t, J = 7.0 Hz, 3H).
3.6.2. 4-Methoxy-2-(trifluoromethyl)-1H-benzo[d]imidazole 93a
To a stirred solution of 92a (3.000 g, 17.84 mmol) in MeOH (40 mL) was added 10% Pd-C (0.869 g). After stirring at room temperature overnight under a hydrogen atmosphere, the reaction mixture was filtered through a pad of Celite. The filtrate was concentrated in vacuo to give the intermediate diamine, which was then dissolved in TFA (75 mL) initially at 0 °C. The resulting mixture was subsequently stirred overnight under reflux conditions before concentration to a residue in vacuo. The residue was dissolved in EtOAc, and the resulting solution was poured into saturated NaHCO3 aq. The organic layer was separated, dried over Na2SO4, and concentrated in vacuo to give 93a (2.291 g), a white solid; the yield was: 59%. 1H-NMR (501 MHz, DMSO-d6) δ 14.05 (d, J = 126.4 Hz, 1H), 7.27 (d, J = 7.7 Hz, 2H), 6.97–6.65 (m, 1H), 3.94 (s, 3H).
3.6.3. 4-Ethoxy-2-(trifluoromethyl)-1H-benzo[d]imidazole 93b
To a stirred solution of 92b (3.560 g, 19.54 mmol) in MeOH was added 10% Pd-C (0.775 g). After stirring at room temperature overnight under a hydrogen atmosphere, the reaction mixture was filtered through a pad of Celite. The filtrate was concentrated in vacuo to give the intermediate diamine (3.260 g, 24.42 mmol), which was then dissolved in TFA (75 mL) initially at 0 °C. The resulting mixture was subsequently stirred overnight under reflux conditions before concentration to a residue in vacuo. The residue was dissolved in EtOAc and the resulting solution was poured into saturated NaHCO3 aq. The organic layer was separated, dried over Na2SO4, and concentrated in vacuo to give 93b (2.300 g, 52% yield), a light-yellow liquid; the yield was: 52%. mp 198.3–198.4 °C. 1H-NMR (400 MHz, DMSO-d6) δ 13.99 (d, J = 91.1 Hz, 1H), 7.46–7.07 (m, 2H), 6.96–6.66 (m, 1H), 4.21 (q, J = 7.0 Hz, 2H), 1.39 (t, J = 7.0 Hz, 3H). 13C-NMR (101 MHz, DMSO-d6) δ 151.62, 136.09, 133.01, 126.42, 119.59 (q, J = 270.2 Hz), 105.19 (d, J = 27.1 Hz), 64.27, 15.06.19F-NMR (376 MHz, DMSO-d6) δ −62.56 (d, J = 82.1 Hz). HRMS (EI-TOF) calculated for C10H9F3N2O [M + H]+: 231.0739; found: 231.0739.
3.6.4. 4-(4-Chloro-6-(4-methoxy-2-(trifluoromethyl)-1H-benzo[d]imidazol-1-yl)-1,3,5-triazin-2-yl)morpholine 95a
A mixture of 93a (0.500 g, 2.31 mmol), 4-(4,6-dichloro-1,3,5-triazin-2-yl)morpholine (94) (2.170 g, 9.25 mmol), and powdered K2CO3 (2.560 g, 18.50 mmol) in DMF (20 mL) was stirred rapidly for 3 h and then diluted with water. The resulting precipitate was collected by filtration, washed with water and then with EtOH, and oven-dried to give 95a (0.700 g), a white solid; the yield was: 72%. 1H-NMR (501 MHz, chloroform-d) δ 7.90 (d, J = 8.4 Hz, 1H), 7.42 (t, J = 8.3 Hz, 1H), 6.84 (d, J = 8.1 Hz, 1H), 4.04 (s, 3H), 3.94 (dt, J = 14.1, 4.9 Hz, 4H), 3.81–3.75 (m, 4H). 13C-NMR (126 MHz, chloroform-d) δ 171.04, 164.37, 161.75, 152.34, 139.80–138.57 (m), 135.19, 131.33, 128.42, 118.66 (q, J = 270.8 Hz), 108.33, 105.68, 66.46, 66.42, 55.99, 44.59, 44.48. 19F-NMR (376 MHz, chloroform-d) δ −60.12. HRMS (EI-TOF) calculated for C16H14ClF3N6O2 [M + H]+: 415.0891; found: 415.0892.
3.6.5. 4-(4-Chloro-6-(4-ethoxy-2-(trifluoromethyl)-1H-benzo[d]imidazol-1-yl)-1,3,5-triazin-2-yl)morpholine 95b
A mixture of 93b (1.000 g, 4.34 mmol), 4-(4,6-dichloro-1,3,5-triazin-2-yl)morpholine (94) (4.080 g, 17.38 mmol), and powdered K2CO3 (4.800 g, 34.75 mmol) in DMF (30 mL) was stirred rapidly for 3 h and then diluted with water. The resulting precipitate was collected by filtration, washed with water and then with EtOH, and oven-dried to give 95b (1.026 g), a light-yellow liquid; the yield was: 55%. mp 230.1–230.5 °C. 1H-NMR (400 MHz, chloroform-d) δ 7.90 (d, J = 8.4 Hz, 1H), 7.41 (t, J = 8.3 Hz, 1H), 6.85 (d, J = 8.1 Hz, 1H), 4.33 (q, J = 7.0 Hz, 2H), 3.95 (dt, J = 10.2, 4.8 Hz, 4H), 3.83–3.75 (m, 4H), 1.55 (t, J = 7.0 Hz, 3H). 13C-NMR (101 MHz, chloroform-d) δ 171.13, 164.49, 161.88, 151.80, 135.42, 131.56, 128.43, 122.31–115.39 (m), 108.09, 106.83, 66.52, 66.48, 64.65, 44.65, 44.54, 14.74. 19F-NMR (376 MHz, chloroform-d) δ −60.00. (s, 3F) HRMS (EI-TOF) calculated for C17H16ClF3N6O2 [M + H]+: 429.1048; found: 429.1053.
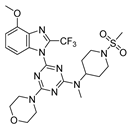
3.6.6. 4-(4-Methoxy-2-(trifluoromethyl)-1H-benzo[d]imidazol-1-yl)-N-methyl-N-(1-(methylsulfonyl)piperidin-4-yl)-6-morpholino-1,3,5-triazin-2-amine 86
A mixture of 95a (0.050 g, 120.55 μmol), 1-(methylsulfonyl)piperidin-4-amine (0.085 g, 482.19 μmol), and DIPEA (0.023 g, 182.82 μmol) in THF (6 mL) was stirred at room temperature overnight. Dilution with water and extraction with CH2Cl2 gave an intermediate. A solution of the intermediate (0.036 g, 5.4 mmol) in DMF (10 mL) was treated sequentially with excess NaH (0.006 g, 258.73 μmol) and iodomethane (0.036 g, 258.73 μmol) at room temperature for 2 h. Dilution with water and workup in CH2Cl2, followed by chromatography on silica eluting with CH2Cl2/EtOAc (4:1), gave 86 (0.022 g), a light-yellow liquid; the yield was: 59%. 1H-NMR (400 MHz, DMSO-d6) δ 7.75 (dd, J = 34.1, 8.4 Hz, 1H), 7.48 (q, J = 8.5 Hz, 1H), 6.98 (d, J = 8.1 Hz, 1H), 4.64 (q, J = 11.8, 10.6 Hz, 1H), 3.98 (s, 3H), 3.87–3.64 (m, 10H), 3.06 (d, J = 5.9 Hz, 3H), 2.92 (d, J = 2.2 Hz, 3H), 2.90–2.69 (m, 2H), 1.93–1.68 (m, 4H). 13C-NMR (101 MHz, DMSO-d6) δ 165.19, 164.89, 161.28, 152.47, 135.73, 131.22, 128.51, 107.78, 106.06, 66.34, 56.36, 52.25, 45.72, 44.09, 35.11, 29.03, 28.46. 19F-NMR (376 MHz, DMSO-d6) δ −59.03 (d, J = 20.0 Hz). HRMS (EI-TOF) calculated for C23H29F3N8O4S [M + Na]+: 593.1876; found: 593.1880.
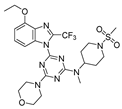
3.6.7. 4-(4-Ethoxy-2-(trifluoromethyl)-1H-benzo[d]imidazol-1-yl)-N-methyl-N-(1-(methylsulfonyl)piperidin-4-yl)-6-morpholino-1,3,5-triazin-2-amine 87
A mixture of 95b (0.200 g, 466.42 μmol), 1-(methylsulfonyl)piperidin-4-amine (0.332 g, 1.87 mmol), and DIPEA (0.090 g, 699.63 μmol) in THF (13 mL) was stirred at room temperature overnight. Dilution with water and extraction with CH2Cl2, followed by chromatography on silica eluting with CH2Cl2/EtOAc (4:1), gave an intermediate (0.198 g, 74% yield): 1H-NMR (CDCl3). A solution of the intermediate (0.198 g, 347.01 μmol) in DMF (10 mL) was treated sequentially with excess NaH (0.033g, 1.39 mmol) and iodomethane (0.197 g, 1.39 mmol) at room temperature for 2 h. Dilution with water and workup in CH2Cl2, followed by chromatography on silica eluting with CH2Cl2/EtOAc (4:1), gave 87 (0.102 g, 51% yield), a light-yellow liquid; the yield was: 51%. 1H-NMR (400 MHz, DMSO-d6) δ 7.72 (dd, J = 34.0, 8.4 Hz, 1H), 7.42 (dt, J = 10.9, 8.2 Hz, 1H), 6.92 (dd, J = 8.2, 2.8 Hz, 1H), 4.64 (tq, J = 16.7, 7.3, 5.6 Hz, 1H), 4.25 (qd, J = 7.0, 2.5 Hz, 2H), 3.88–3.59 (m, 10H), 3.03 (d, J = 7.2 Hz, 3H), 2.91 (s, 3H), 2.89–2.65 (m, 2H), 1.95–1.67 (m, 4H), 1.43 (t, J = 6.9 Hz, 3H). 13C-NMR (101 MHz, DMSO-d6) δ 165.19, 164.89, 161.35, 151.69, 135.81, 131.30, 128.44, 119.30, 107.62, 106.81, 66.35, 64.57, 55.39, 52.45, 52.02, 45.71, 44.08, 35.11, 29.03, 28.46, 15.11. 19F-NMR (376 MHz, DMSO-d6) δ −59.04 (s, 3F). HRMS (EI-TOF) calculated for C24H31F3N8O4S [M + Na]+: 607.2033; found: 607.2028.
3.7. Enzyme Assays
These assays were carried out as described previously [38]. All of the enzymatic reactions were conducted at 30 °C for 40 min. The 50 µL reaction mixture contained 40 mM Tris, pH 7.4, 10 mM MgCl2, 0.1 mg/mL BSA, 1 mM DTT, 10 µM ATP, kinase, and the enzyme substrate. The compounds were diluted in 10% DMSO, and 5 µL of the dilution was added to a 50 µL reaction so that the final concentration of DMSO is 1% in all of reactions. The assay was performed using the Kinase-Glo Plus luminescence kinase assay kit. It measured the kinase activity by quantitating the amount of ATP remaining in solution following a kinase reaction. The luminescent signal from the assay was correlated with the amount of ATP present and was inversely correlated with the amount of kinase activity. The IC50 values were calculated using nonlinear regression with normalized dose–response fit using Scikit-learn 1.0.2 [39].
4. Conclusions
In this work, the binding models between 2-difluoromethylbenzimidazole derivatives and PI3Kα were studied by a combination of 3D-QSAR, molecular docking, and molecular dynamics simulations. The contour maps explained the relationship between chemical structures and bioactivities. The molecular docking and molecular dynamics results implied that relevant hydrogen bonds are important for ligand–receptor binding. The results from the 3D-QSAR models, molecular docking, and MD simulation illustrated the chemical structure characteristics of 2-difluoromethylbenzimidazole derivatives. Ultimately, two designed compounds (86 and 87) were selected to be synthesized and biologically evaluated. Compound 86 (IC50 = 22.8 nM) and compound 87 (IC50 = 33.6 nM) show potent inhibitory activity against PI3Kα. This study provides guidance for the further development of potent PI3Kα inhibitors with improved biological activity.
Supplementary Materials
The following supporting information can be downloaded online, Table S1: Structures and activity value of every molecule used in the study, Table S2: The actual and predicted pIC50 values of all compounds, Figures S1–S22 1H-NMR, 19F-NMR, 13C-NMR and HRMS spectra for the new drug.
Author Contributions
Investigation, methodology, and writing–original draft, X.W.; software, M.Z., R.Z., and Z.W. (Zhongshan Wu); conceptualization and writing—review and editing, Z.W. (Zhonghua Wang); supervision, Y.Y.; funding acquisition, F.W. All authors have read and agreed to the published version of the manuscript.
Funding
This work was financially supported by the National Natural Science Foundation of China (Nos. 21672151 and 21602136).
Institutional Review Board Statement
Not applicable.
Informed Consent Statement
Not applicable.
Data Availability Statement
Data are contained within the article or the supplementary data file.
Acknowledgments
The authors are thankful to the Jinan Huawei Pharmaceutical Com, Ltd., for the kindest help in conducting the PI3Kα inhibitory assay.
Conflicts of Interest
The authors declare no conflict of interest.
Sample Availability
Samples of the compounds are available from the authors.
References
- Yu, Y.N.; Han, Y.; Zhang, F.; Gao, Z.; Zhu, T.; Dong, S.; Ma, M. Design, Synthesis, and Biological Evaluation of Imidazo[1,2-a]pyridine Derivatives as Novel PI3K/mTOR Dual Inhibitors. J. Med. Chem. 2020, 63, 3028–3046. [Google Scholar] [CrossRef] [PubMed]
- Hu, C.; Yang, J.; He, Q.; Luo, Y.; Chen, Z.; Yang, L.; Yi, H.; Li, H.; Xia, H.; Ran, D.; et al. CysLTR1 Blockage Ameliorates Liver Injury Caused by Aluminum-Overload via PI3K/AKT/mTOR-Mediated Autophagy Activation in Vivo and in Vitro. Mol. Pharm. 2018, 15, 1996–2006. [Google Scholar] [CrossRef]
- Van Dort, M.E.; Hong, H.; Wang, H.; Nino, C.A.; Lombardi, R.L.; Blanks, A.E.; Galbán, S.; Ross, B.D. Discovery of Bifunctional Oncogenic Target Inhibitors against Allosteric Mitogen-Activated Protein Kinase (MEK1) and Phosphatidylinositol 3-Kinase (PI3K). J. Med. Chem. 2016, 59, 2512–2522. [Google Scholar] [CrossRef] [Green Version]
- Saurat, T.; Buron, F.; Rodrigues, N.; de Tauzia, M.L.; Colliandre, L.; Bourg, S.; Bonnet, P.; Guillaumet, G.; Akssira, M.; Corlu, A.; et al. Design, Synthesis, and Biological Activity of Pyridopyrimidine Scaffolds as Novel PI3K/mTOR Dual Inhibitors. J. Med. Chem. 2014, 57, 613–631. [Google Scholar] [CrossRef]
- Yang, C.; Zhang, X.; Wang, Y.; Yang, Y.; Liu, X.; Deng, M.; Jia, Y.; Ling, Y.; Meng, L.H.; Zhou, Y. Discovery of a Novel Series of 7-Azaindole Scaffold Derivatives as PI3K Inhibitors with Potent Activity. ACS Med. Chem. Lett. 2017, 8, 875–880. [Google Scholar] [CrossRef]
- Soler, A.; Angulo-Urarte, A.; Graupera, M. PI3K at the crossroads of tumor angiogenesis signaling pathways. Mol. Cell. Oncol. 2015, 2, e975624. [Google Scholar] [CrossRef] [Green Version]
- Cheng, H.; Orr, S.T.M.; Bailey, S.; Brooun, A.; Chen, P.; Deal, J.G.; Deng, Y.L.; Edwards, M.P.; Gallego, G.M.; Grodsky, N.; et al. Structure-Based Drug Design and Synthesis of PI3Kα-Selective Inhibitor (PF-06843195). J. Med. Chem. 2021, 64, 644–661. [Google Scholar] [CrossRef]
- Heffron, T.P.; Heald, R.A.; Ndubaku, C.; Wei, B.; Augistin, M.; Do, S.; Edgar, K.; Eigenbrot, C.; Friedman, L.; Gancia, E.; et al. The Rational Design of Selective Benzoxazepin Inhibitors of the α-Isoform of Phosphoinositide 3-Kinase Culminating in the Identification of (S)-2-((2-(1-Isopropyl-1H-1,2,4-triazol-5-yl)-5,6-dihydrobenzo[f]imidazo[1,2-d][1,4]oxazepin-9-yl)oxy)propan- amide (GDC-0326). J. Med. Chem. 2016, 59, 985–1002. [Google Scholar]
- Garces, A.E.; Stocks, M.J. Class 1 PI3K Clinical Candidates and Recent Inhibitor Design Strategies: A Medicinal Chemistry Perspective. J. Med. Chem. 2019, 62, 4815–4850. [Google Scholar] [CrossRef]
- Chen, Z.; Venkatesan, A.M.; Dehnhardt, C.M.; Ayral-Kaloustian, S.; Brooijmans, N.; Mallon, R.; Feldberg, L.; Hollander, I.; Lucas, J.; Yu, K.; et al. Synthesis and SAR of Novel 4-Morpholinopyrrolopyrimidine Derivatives as Potent Phosphatidylinositol 3-Kinase Inhibitors. J. Med. Chem. 2010, 53, 3169–3182. [Google Scholar] [CrossRef]
- Singh, P.; Kumar, V.; Gupta, S.K.; Kumari, G.; Verma, M. Combating TKI resistance in CML by inhibiting the PI3K/Akt/mTOR pathway in combination with TKIs: A review. Med. Oncol. 2021, 38, 10. [Google Scholar] [CrossRef] [PubMed]
- Sun, P.; Zhang, X.; Wang, R.J.; Ma, Q.Y.; Xu, L.; Wang, Y.; Liao, H.P.; Wang, H.L.; Hu, L.D.; Kong, X.; et al. PI3Kα inhibitor CYH33 triggers antitumor immunity in murine breast cancer by activating CD8(+) T cells and promoting fatty acid metabolism. J. Immunother. Cancer 2021, 9, e003093. [Google Scholar] [CrossRef]
- Miricescu, D.; Totan, A.; Stanescu-Spinu, I.I.; Badoiu, S.C.; Stefani, C.; Greabu, M. PI3K/AKT/mTOR Signaling Pathway in Breast Cancer: From Molecular Landscape to Clinical Aspects. Int. J. Mol. Sci. 2021, 22, 173. [Google Scholar] [CrossRef]
- Kim, O.; Jeong, Y.; Lee, H.; Hong, S.-S.; Hong, S. Design and Synthesis of Imidazopyridine Analogues as Inhibitors of Phosphoinositide 3-Kinase Signaling and Angiogenesis. J. Med. Chem. 2011, 54, 2455–2466. [Google Scholar] [CrossRef]
- Mahajan, D.; Sen, S.; Kuila, B.; Sharma, A.; Arora, R.; Sagar, M.; Mahapatra, A.R.; Gawade, L.B.; Dugar, S. Discovery and Development of SPR519 as a Potent, Selective, and Orally Bioavailable Inhibitor of PI3Kα and mTOR Kinases for the Treatment of Solid Tumors. J. Med. Chem. 2020, 63, 11121–11130. [Google Scholar] [CrossRef] [PubMed]
- Gkeka, P.; Papafotika, A.; Christoforidis, S.; Cournia, Z. Exploring a Non-ATP Pocket for Potential Allosteric Modulation of PI3Kα. J. Phys. Chem. B 2015, 119, 1002–1016. [Google Scholar] [CrossRef]
- Heffron, T.P.; Wei, B.; Olivero, A.; Staben, S.T.; Tsui, V.; Do, S.; Dotson, J.; Folkes, A.J.; Goldsmith, P.; Goldsmith, R.; et al. Rational Design of Phosphoinositide 3-Kinase α Inhibitors That Exhibit Selectivity over the Phosphoinositide 3-Kinase β Isoform. J. Med. Chem. 2011, 54, 7815–7833. [Google Scholar] [CrossRef]
- Singh, P.; Dar, M.S.; Dar, M.J. p110α and p110β isoforms of PI3K signaling: Are they two sides of the same coin? FEBS Lett. 2016, 590, 3071–3082. [Google Scholar] [CrossRef] [Green Version]
- Furet, P.; Guagnano, V.; Fairhurst, R.A.; Imbach-Weese, P.; Bruce, I.; Knapp, M.; Fritsch, C.; Blasco, F.; Blanz, J.; Aichholz, R.; et al. Discovery of NVP-BYL719 a potent and selective phosphatidylinositol-3 kinase alpha inhibitor selected for clinical evaluation. Bioorg. Med. Chem. Lett. 2013, 23, 3741–3748. [Google Scholar] [CrossRef]
- Cramer, R.D.; Patterson, D.E.; Bunce, J.D. Comparative molecular field analysis (CoMFA). 1. Effect of shape on binding of steroids to carrier proteins. J. Am. Chem. Soc. 1988, 110, 5959–5967. [Google Scholar] [CrossRef]
- Klebe, G.; Abraham, U.; Mietzner, T. Molecular Similarity Indices in a Comparative Analysis (CoMSIA) of Drug Molecules to Correlate and Predict Their Biological Activity. J. Med. Chem. 1994, 37, 4130–4146. [Google Scholar] [CrossRef]
- Gamage, S.A.; Spicer, J.A.; Tsang, K.Y.; O’Connor, P.D.; Flanagan, J.U.; Lee, W.-J.; Dickson, J.M.J.; Shepherd, P.R.; Denny, W.A.; Rewcastle, G.W. Synthesis and Evaluation of Imidazo[1,2-a]pyridine Analogues of the ZSTK474 Class of Phosphatidylinositol 3-Kinase Inhibitors. Chem.-Asian J. 2019, 14, 1249–1261. [Google Scholar] [CrossRef]
- Gamage, S.A.; Giddens, A.C.; Tsang, K.Y.; Flanagan, J.U.; Kendall, J.D.; Lee, W.J.; Baguley, B.C.; Buchanan, C.M.; Jamieson, S.M.F.; Shepherd, P.R.; et al. Synthesis and biological evaluation of sulfonamide analogues of the phosphatidylinositol 3-kinase inhibitor ZSTK474. Bioorg. Med. Chem. 2017, 25, 5859–5874. [Google Scholar] [CrossRef]
- Giddens, A.C.; Gamage, S.A.; Kendall, J.D.; Lee, W.J.; Baguley, B.C.; Buchanan, C.M.; Jamieson, S.M.F.; Dickson, J.M.J.; Shepherd, P.R.; Denny, W.A.; et al. Synthesis and biological evaluation of solubilized sulfonamide analogues of the phosphatidylinositol 3-kinase inhibitor ZSTK474. Bioorg. Med. Chem. 2019, 27, 1529–1545. [Google Scholar] [CrossRef]
- Ran, T.; Lu, T.; Yuan, H.; Liu, H.; Wang, J.; Zhang, W.; Leng, Y.; Lin, G.; Zhuang, S.; Chen, Y. A selectivity study on mTOR/PI3Kα inhibitors by homology modeling and 3D-QSAR. J. Mol. Model. 2012, 18, 171–186. [Google Scholar] [CrossRef] [PubMed]
- Yuan, H.; Tai, W.; Hu, S.; Liu, H.; Zhang, Y.; Yao, S.; Ran, T.; Lu, S.; Ke, Z.; Xiong, X.; et al. Fragment-based strategy for structural optimization in combination with 3D-QSAR. J. Comput. Aided Mol. Des. 2013, 27, 897–915. [Google Scholar] [CrossRef] [PubMed]
- Yuan, H.; Liu, H.; Tai, W.; Wang, F.; Zhang, Y.; Yao, S.; Ran, T.; Lu, S.; Ke, Z.; Xiong, X.; et al. Molecular modelling on small molecular CDK2 inhibitors: An integrated approach using a combination of molecular docking, 3D-QSAR and pharmacophore modelling. SAR QSAR Environ. Res. 2013, 24, 795–817. [Google Scholar] [CrossRef]
- Leng, Y.; Lu, T.; Yuan, H.L.; Liu, H.C.; Lu, S.; Zhang, W.W.; Jiang, Y.L.; Chen, Y.D. QSAR studies on imidazopyrazine derivatives as Aurora A kinase inhibitors. SAR QSAR Environ. Res. 2012, 23, 705–730. [Google Scholar] [CrossRef]
- Lu, S.; Liu, H.C.; Chen, Y.-D.; Yuan, H.L.; Sun, S.L.; Gao, Y.P.; Yang, P.; Zhang, L.; Lu, T. Combined Pharmacophore Modeling, Docking, and 3D-QSAR Studies of PLK1 Inhibitors. Int. J. Mol. Sci. 2011, 12, 8713–8739. [Google Scholar] [CrossRef]
- Zhang, Y.; Liu, H.; Jiao, Y.; Yuan, H.; Wang, F.; Lu, S.; Yao, S.; Ke, Z.; Tai, W.; Jiang, Y.; et al. De novo design of N-(pyridin-4-ylmethyl)aniline derivatives as KDR inhibitors: 3D-QSAR, molecular fragment replacement, protein-ligand interaction fingerprint, and ADMET prediction. Mol. Divers. 2012, 16, 787–802. [Google Scholar] [CrossRef]
- René, O.; Souverneva, A.; Magnuson, S.R.; Fauber, B.P. Efficient syntheses of 2-fluoroalkylbenzimidazoles and -benzothiazoles. Tetrahedron Lett. 2013, 54, 201–204. [Google Scholar] [CrossRef]
- Mo, C.; Zhang, Z.; Guise, C.P.; Li, X.; Luo, J.; Tu, Z.; Xu, Y.; Patterson, A.V.; Smaill, J.B.; Ren, X.; et al. 2-Aminopyrimidine Derivatives as New Selective Fibroblast Growth Factor Receptor 4 (FGFR4) Inhibitors. ACS Med. Chem. Lett. 2017, 8, 543–548. [Google Scholar] [CrossRef] [Green Version]
- Wang, J.; Li, H.; He, G.; Chu, Z.; Peng, K.; Ge, Y.; Zhu, Q.; Xu, Y. Discovery of Novel Dual Poly(ADP-ribose)polymerase and Phosphoinositide 3-Kinase Inhibitors as a Promising Strategy for Cancer Therapy. J. Med. Chem. 2020, 63, 122–139. [Google Scholar] [CrossRef]
- Clark, M.; Cramer Iii, R.D.; Van Opdenbosch, N. Validation of the general purpose tripos 5.2 force field. J. Comput. Chem. 1989, 10, 982–1012. [Google Scholar] [CrossRef]
- Gasteiger, J.; Marsili, M. Iterative partial equalization of orbital electronegativity—A rapid access to atomic charges. Tetrahedron 1980, 36, 3219–3228. [Google Scholar] [CrossRef]
- Pearlman, D.A.; Case, D.A.; Caldwell, J.W.; Ross, W.S.; Cheatham, T.E.; DeBolt, S.; Ferguson, D.; Seibel, G.; Kollman, P. AMBER, a package of computer programs for applying molecular mechanics, normal mode analysis, molecular dynamics and free energy calculations to simulate the structural and energetic properties of molecules. Comput. Phys. Commun. 1995, 91, 1–41. [Google Scholar] [CrossRef]
- Miyamoto, S.; Kollman, P.A. Settle: An analytical version of the SHAKE and RATTLE algorithm for rigid water models. J. Comput. Chem. 1992, 13, 952–962. [Google Scholar] [CrossRef]
- Kashem, M.A.; Nelson, R.M.; Yingling, J.D.; Pullen, S.S.; Prokopowicz, A.S.; Jones, J.W.; Wolak, J.P.; Rogers, G.R.; Morelock, M.M.; Snow, R.J.; et al. Three Mechanistically Distinct Kinase Assays Compared: Measurement of Intrinsic ATPase Activity Identified the Most Comprehensive Set of ITK Inhibitors. J. Biomol. Screen. 2006, 12, 70–83. [Google Scholar] [CrossRef] [Green Version]
- Pedregosa, F.; Varoquaux, G.; Gramfort, A.; Michel, V.; Thirion, B.; Grisel, O.; Blondel, M.; Prettenhofer, P.; Weiss, R.; Dubourg, V.; et al. Scikit-learn: Machine Learning in Python. J. Mach. Learn. Res. 2011, 12, 2825–2830. [Google Scholar]


Publisher’s Note: MDPI stays neutral with regard to jurisdictional claims in published maps and institutional affiliations. |
© 2022 by the authors. Licensee MDPI, Basel, Switzerland. This article is an open access article distributed under the terms and conditions of the Creative Commons Attribution (CC BY) license (https://creativecommons.org/licenses/by/4.0/).