Author Contributions
The manuscript was written through the contributions of all authors. Conceptualization, A.M. and P.L.; methodology, A.M.; software, P.L.; validation, Y.C., Y.D. and A.Y.; formal analysis, A.M.; investigation, Y.M.; resources, Y.M.; data curation, A.M.; writing—original draft preparation, P.L.; writing—review and editing, K.Y., Y.Y., Y.W. and Z.L.; visualization, Z.L.; supervision, P.L.; project administration, Y.M.; funding acquisition, Y.M. All authors have read and agreed to the published version of the manuscript.
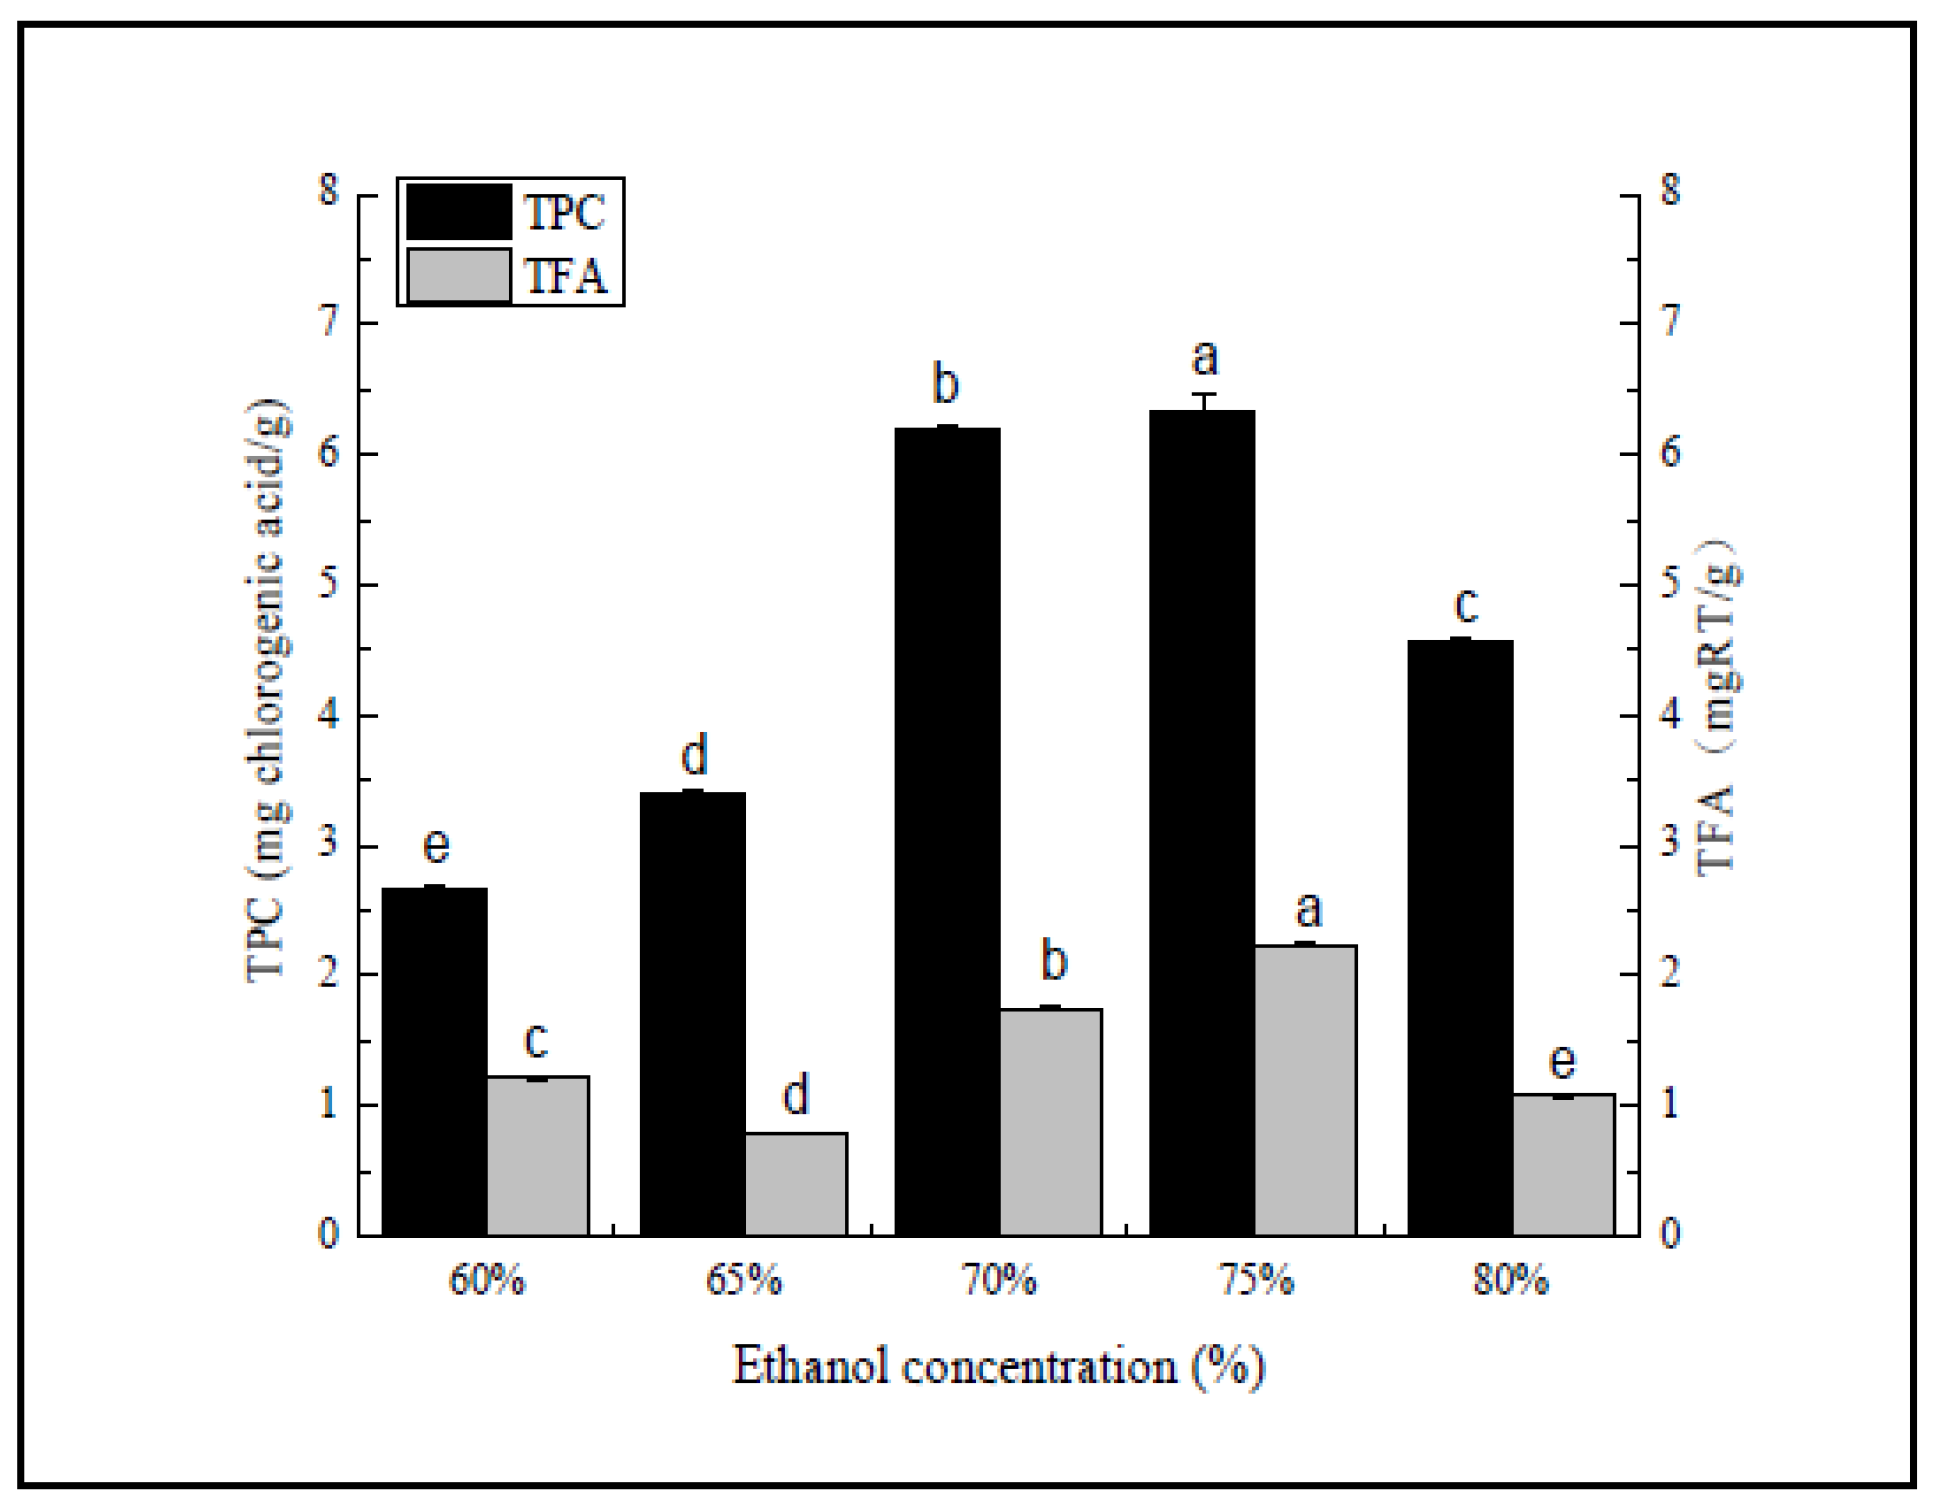
Figure 1.
Ethanol concentration (%). Three independent experiments were carried out for each analysis. Result is expressed as a mean ± SD (n = 3). Values with the different letters in the column are significantly different by Duncan’s multiple range test (p < 0.05).
Figure 1.
Ethanol concentration (%). Three independent experiments were carried out for each analysis. Result is expressed as a mean ± SD (n = 3). Values with the different letters in the column are significantly different by Duncan’s multiple range test (p < 0.05).
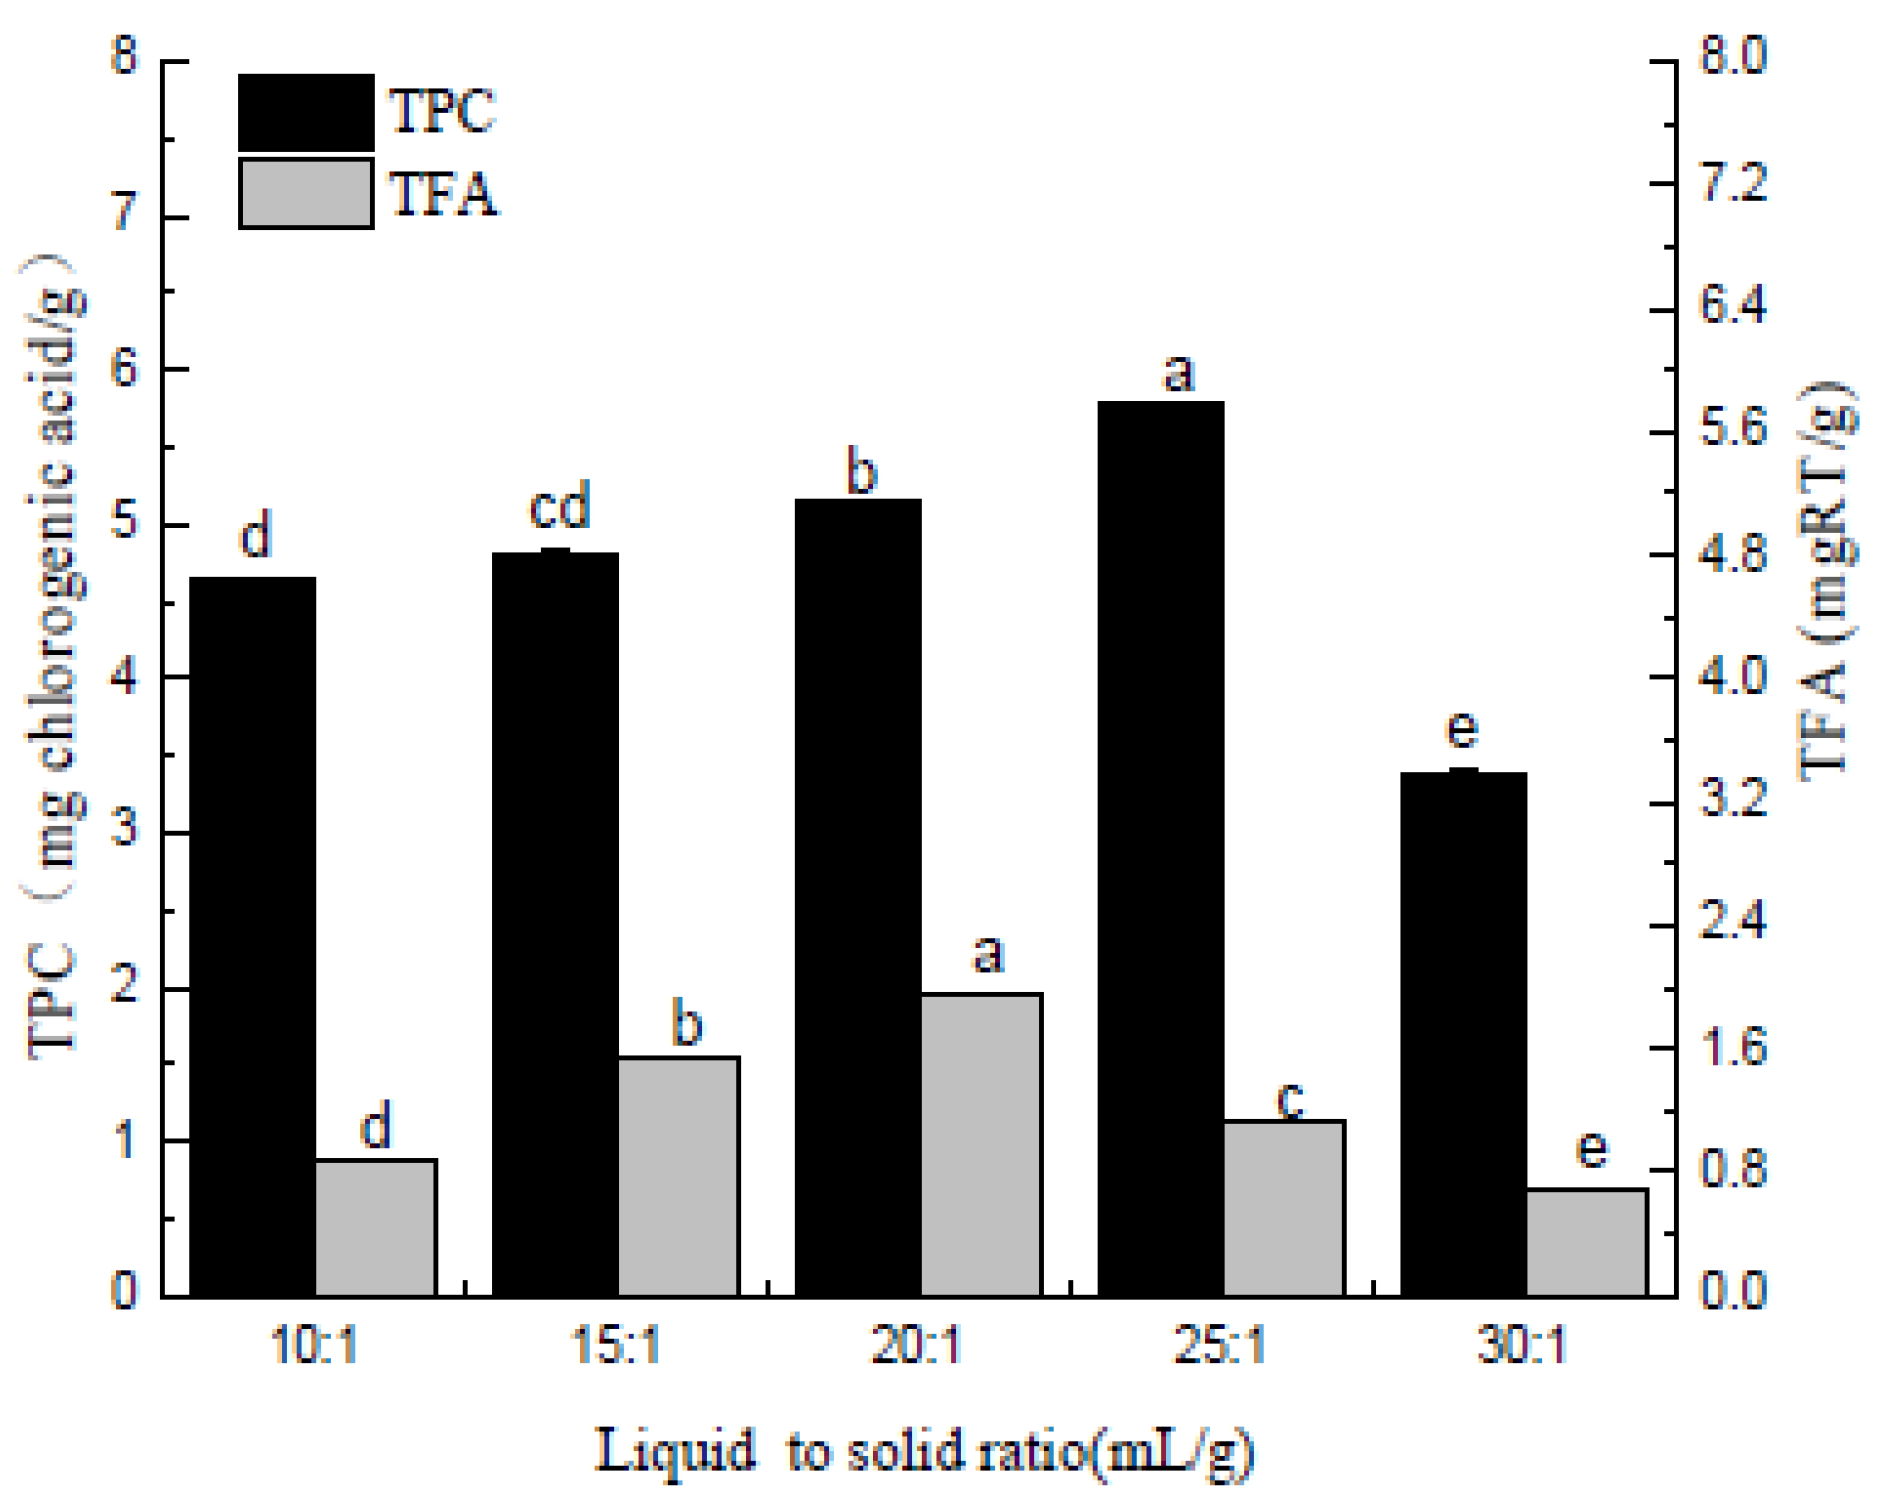
Figure 2.
Liquid to solid ratio (mL/g). Three independent experiments were carried out for each analysis. Result is expressed as a mean ± SD (n = 3). Values with the different letters in the column are significantly different by Duncan’s multiple range test (p < 0.05).
Figure 2.
Liquid to solid ratio (mL/g). Three independent experiments were carried out for each analysis. Result is expressed as a mean ± SD (n = 3). Values with the different letters in the column are significantly different by Duncan’s multiple range test (p < 0.05).
Figure 3.
Extraction temperature (°C). Three independent experiments were carried out for each analysis. Result is expressed as a mean ± SD (n = 3). Values with the different letters in the column are significantly different by Duncan’s multiple range test (p < 0.05).
Figure 3.
Extraction temperature (°C). Three independent experiments were carried out for each analysis. Result is expressed as a mean ± SD (n = 3). Values with the different letters in the column are significantly different by Duncan’s multiple range test (p < 0.05).
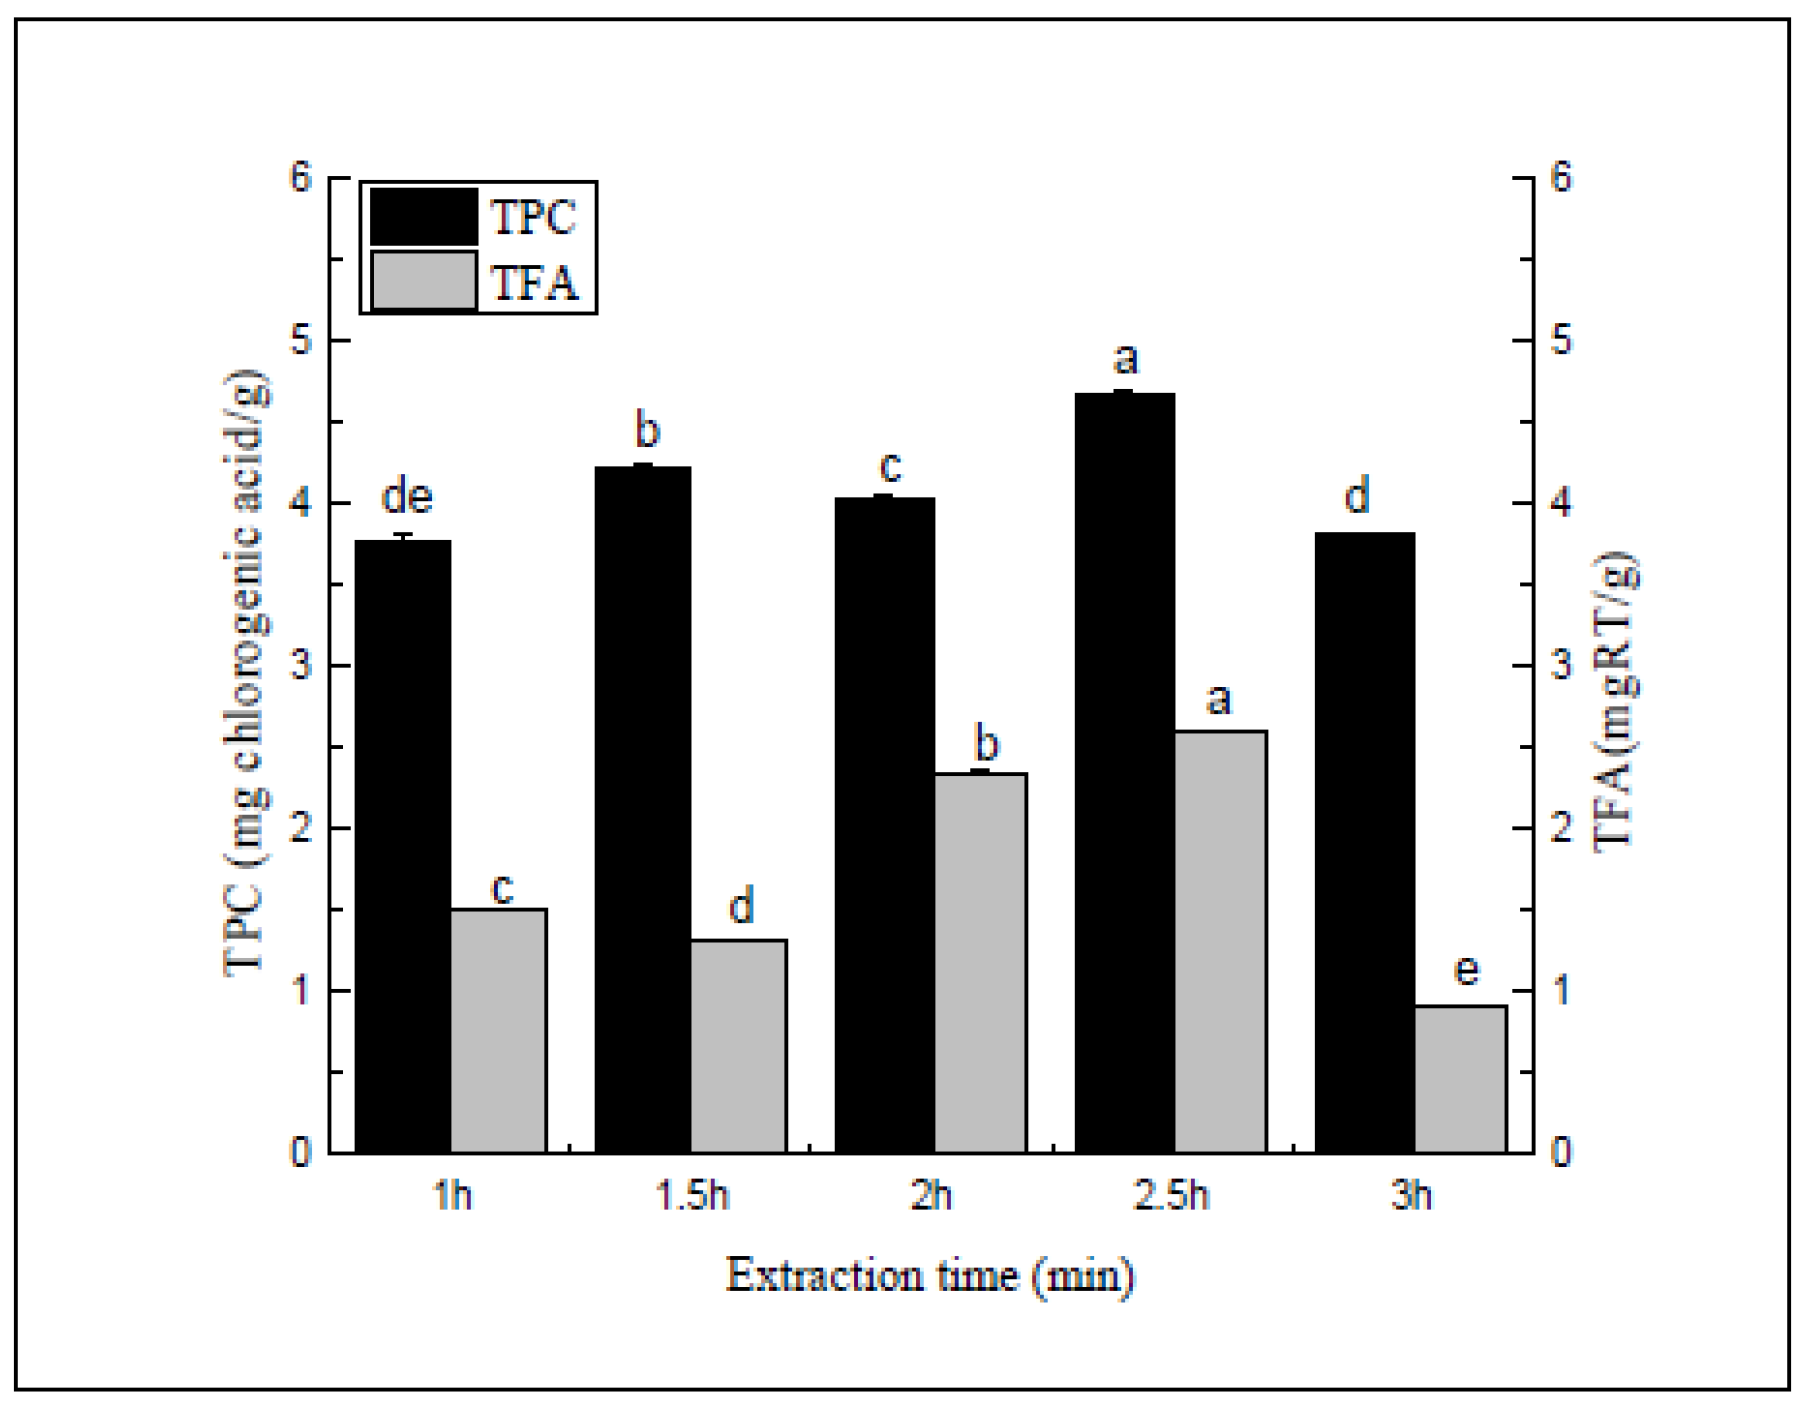
Figure 4.
Extraction time (min). Three independent experiments were carried out for each analysis. Result is expressed as a mean ± SD (n = 3). Values with the different letters in the column are significantly different by Duncan’s multiple range test (p < 0.05).
Figure 4.
Extraction time (min). Three independent experiments were carried out for each analysis. Result is expressed as a mean ± SD (n = 3). Values with the different letters in the column are significantly different by Duncan’s multiple range test (p < 0.05).
Figure 5.
Refluxing times. Three independent experiments were carried out for each analysis. Result is expressed as a mean ± SD (n = 3). Values with the different letters in the column are significantly different by Duncan’s multiple range test (p < 0.05).
Figure 5.
Refluxing times. Three independent experiments were carried out for each analysis. Result is expressed as a mean ± SD (n = 3). Values with the different letters in the column are significantly different by Duncan’s multiple range test (p < 0.05).
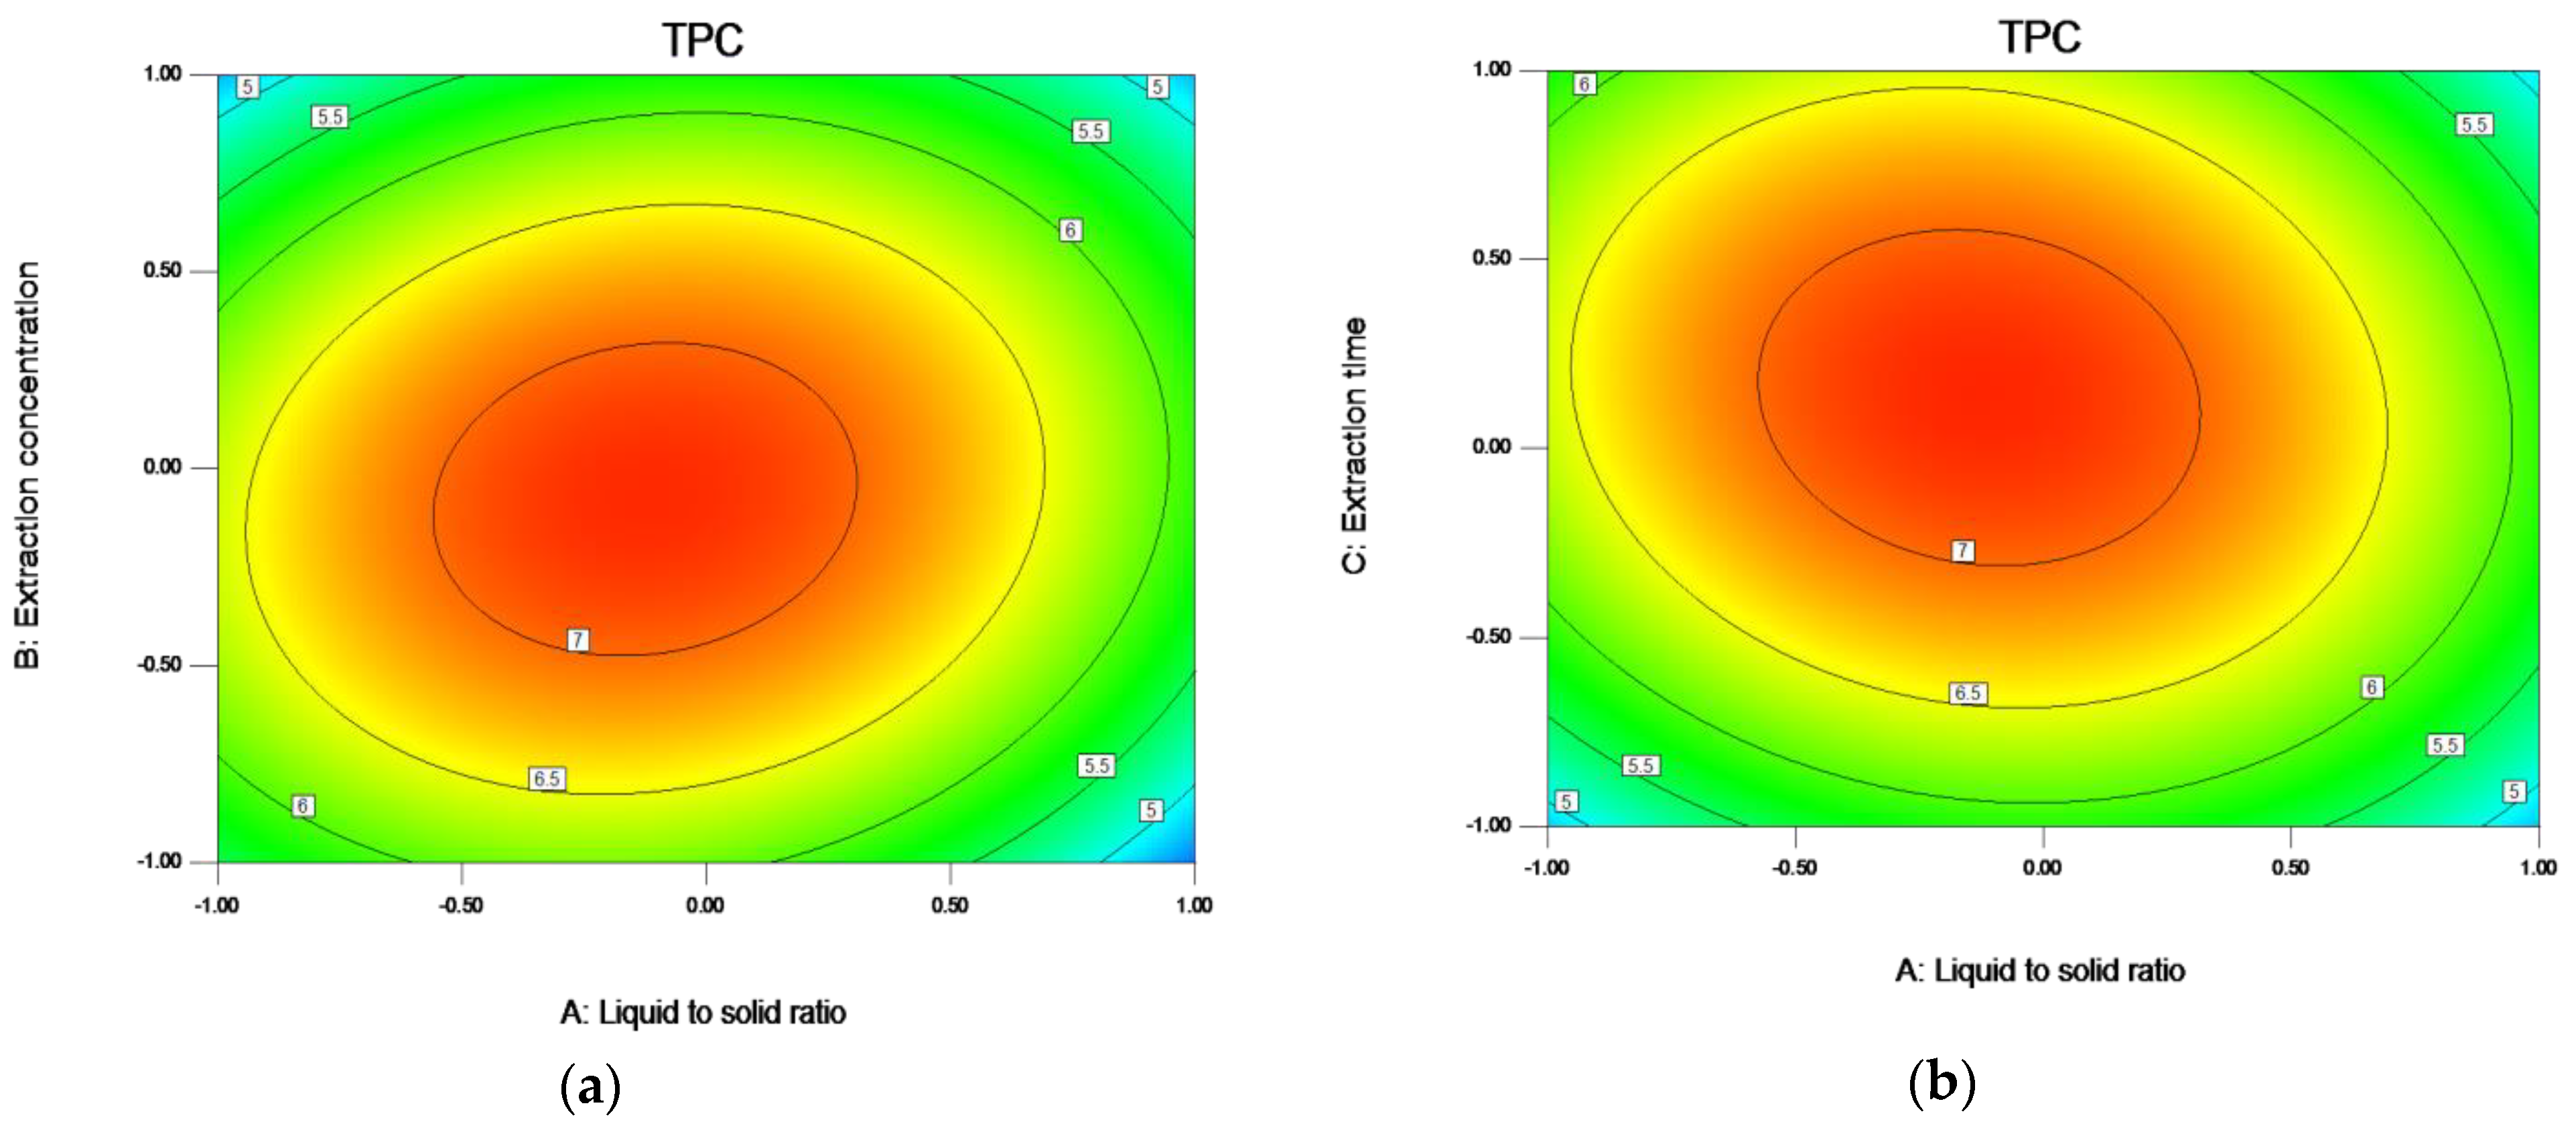
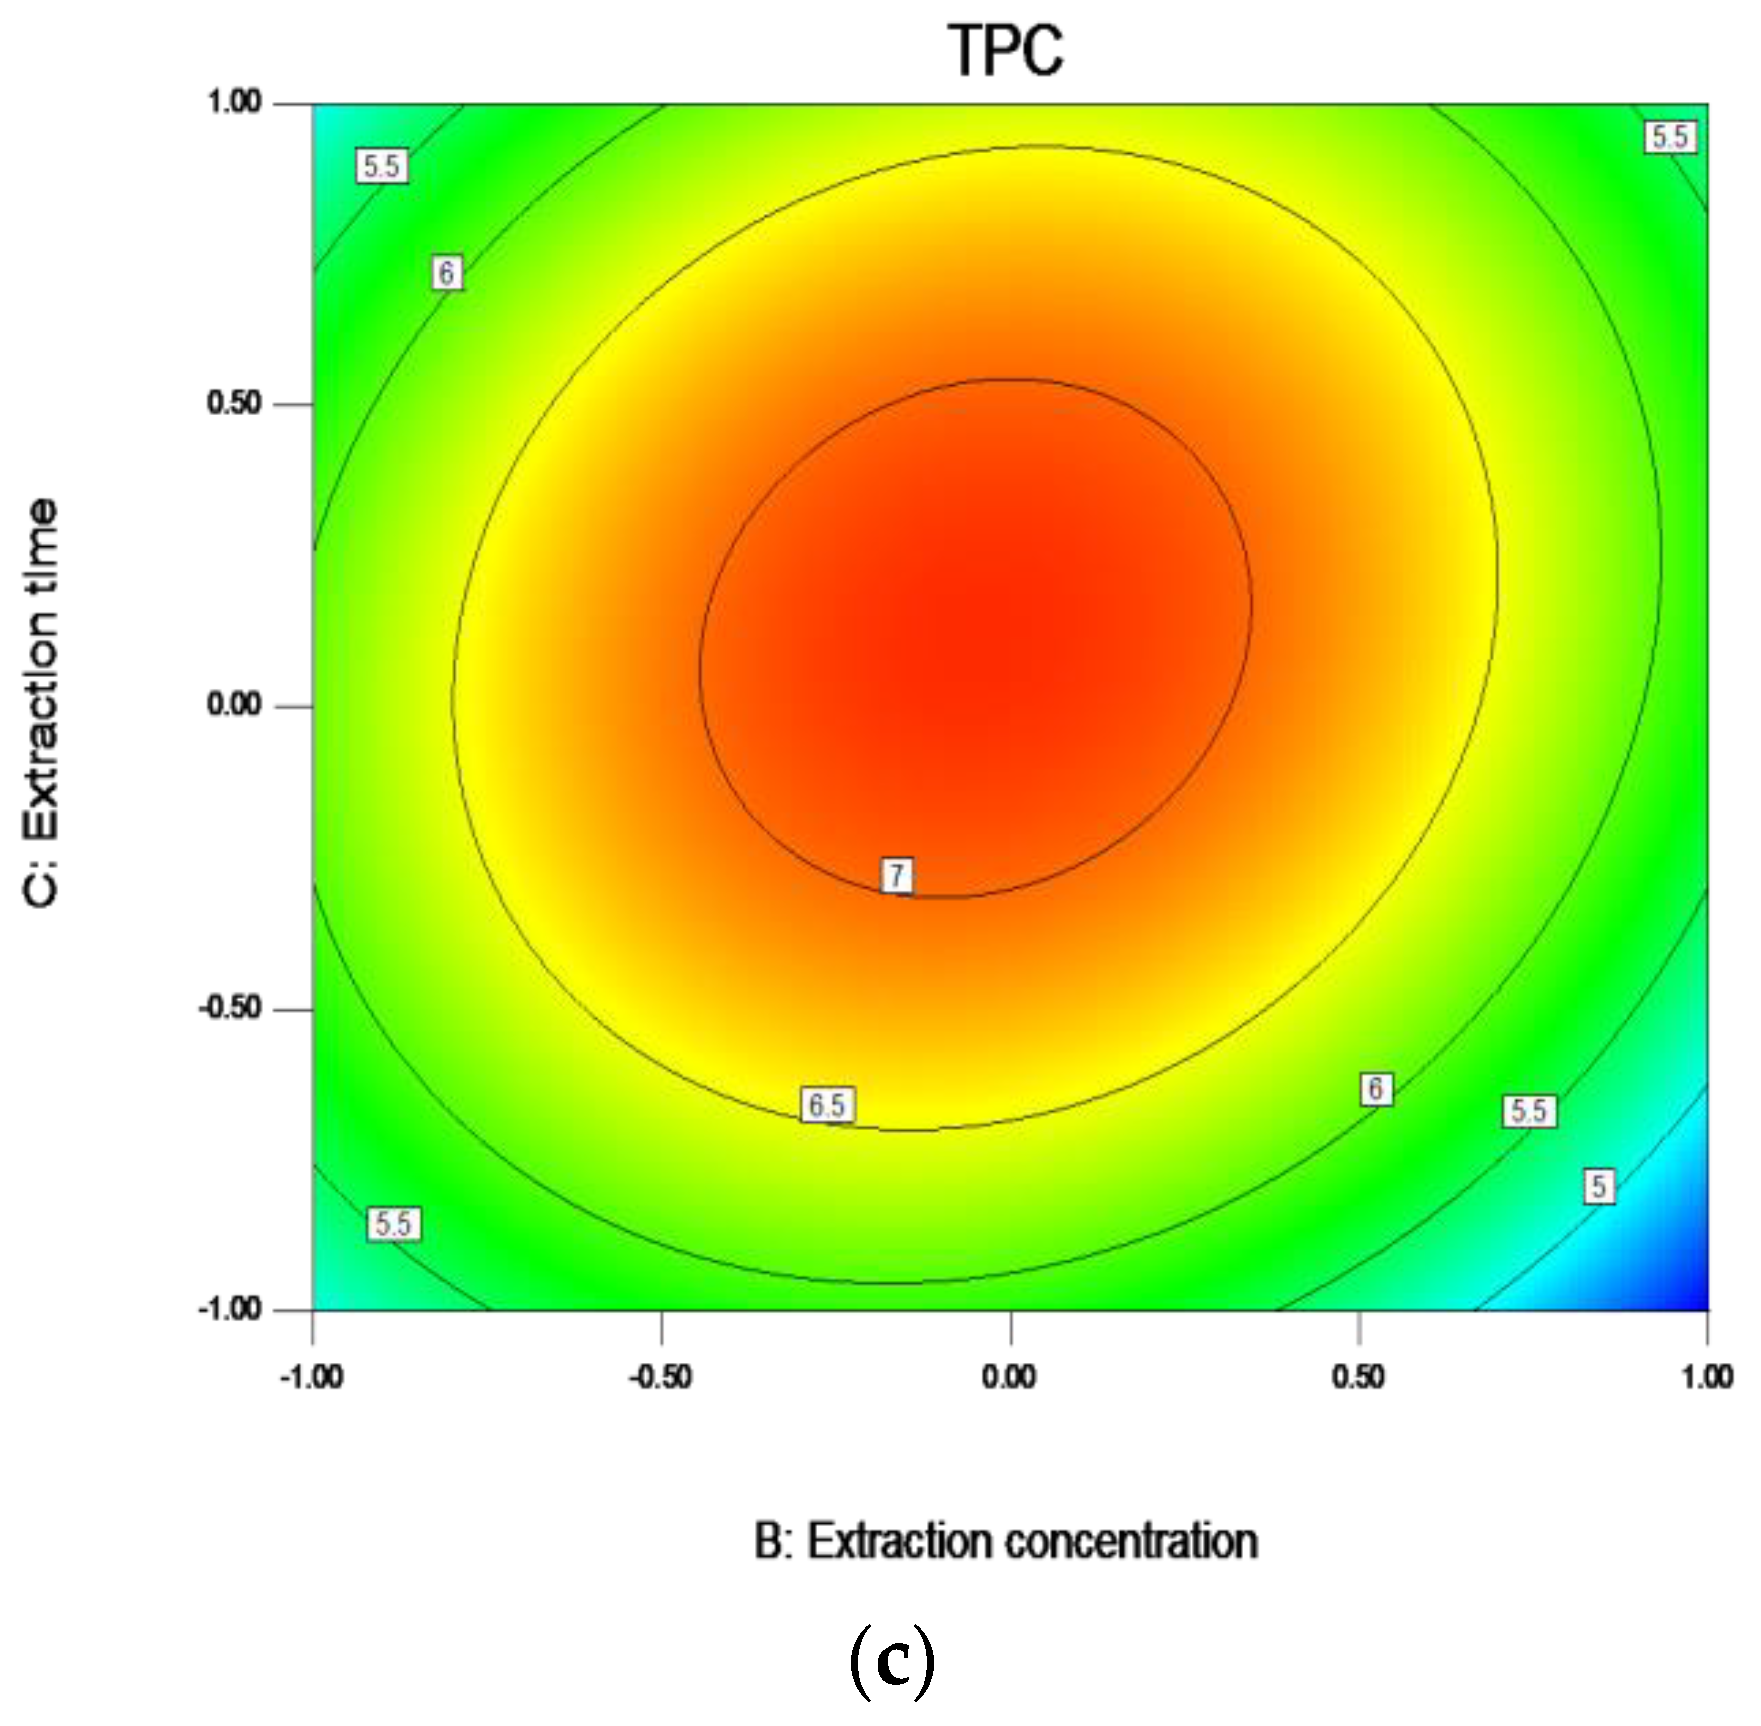
Figure 6.
Response contour plots (a–c) showing liquid to solid ratio (A), ethanol concentration (B), and extraction time (C) on the extraction yield of TPC. Note: The ratio of liquid to solid (A) −1.0, 0.5, 0.0, 0.5, and 1.0, respectively, represent 15:1, 17.5:1, 20:1, 22.5:1, and 25:1; The Ethanol concentration (B) −1.0, 0.5, 0.0, 0.5, and 1.00, respectively, represent 70, 72.5, 75, 77.5, and 80; The Extraction time (C) −1.0, 0.5, 0.0, 0.5, and 1.0, respectively, represent 1.5, 1.75, 2, 2.25, and 2.5.
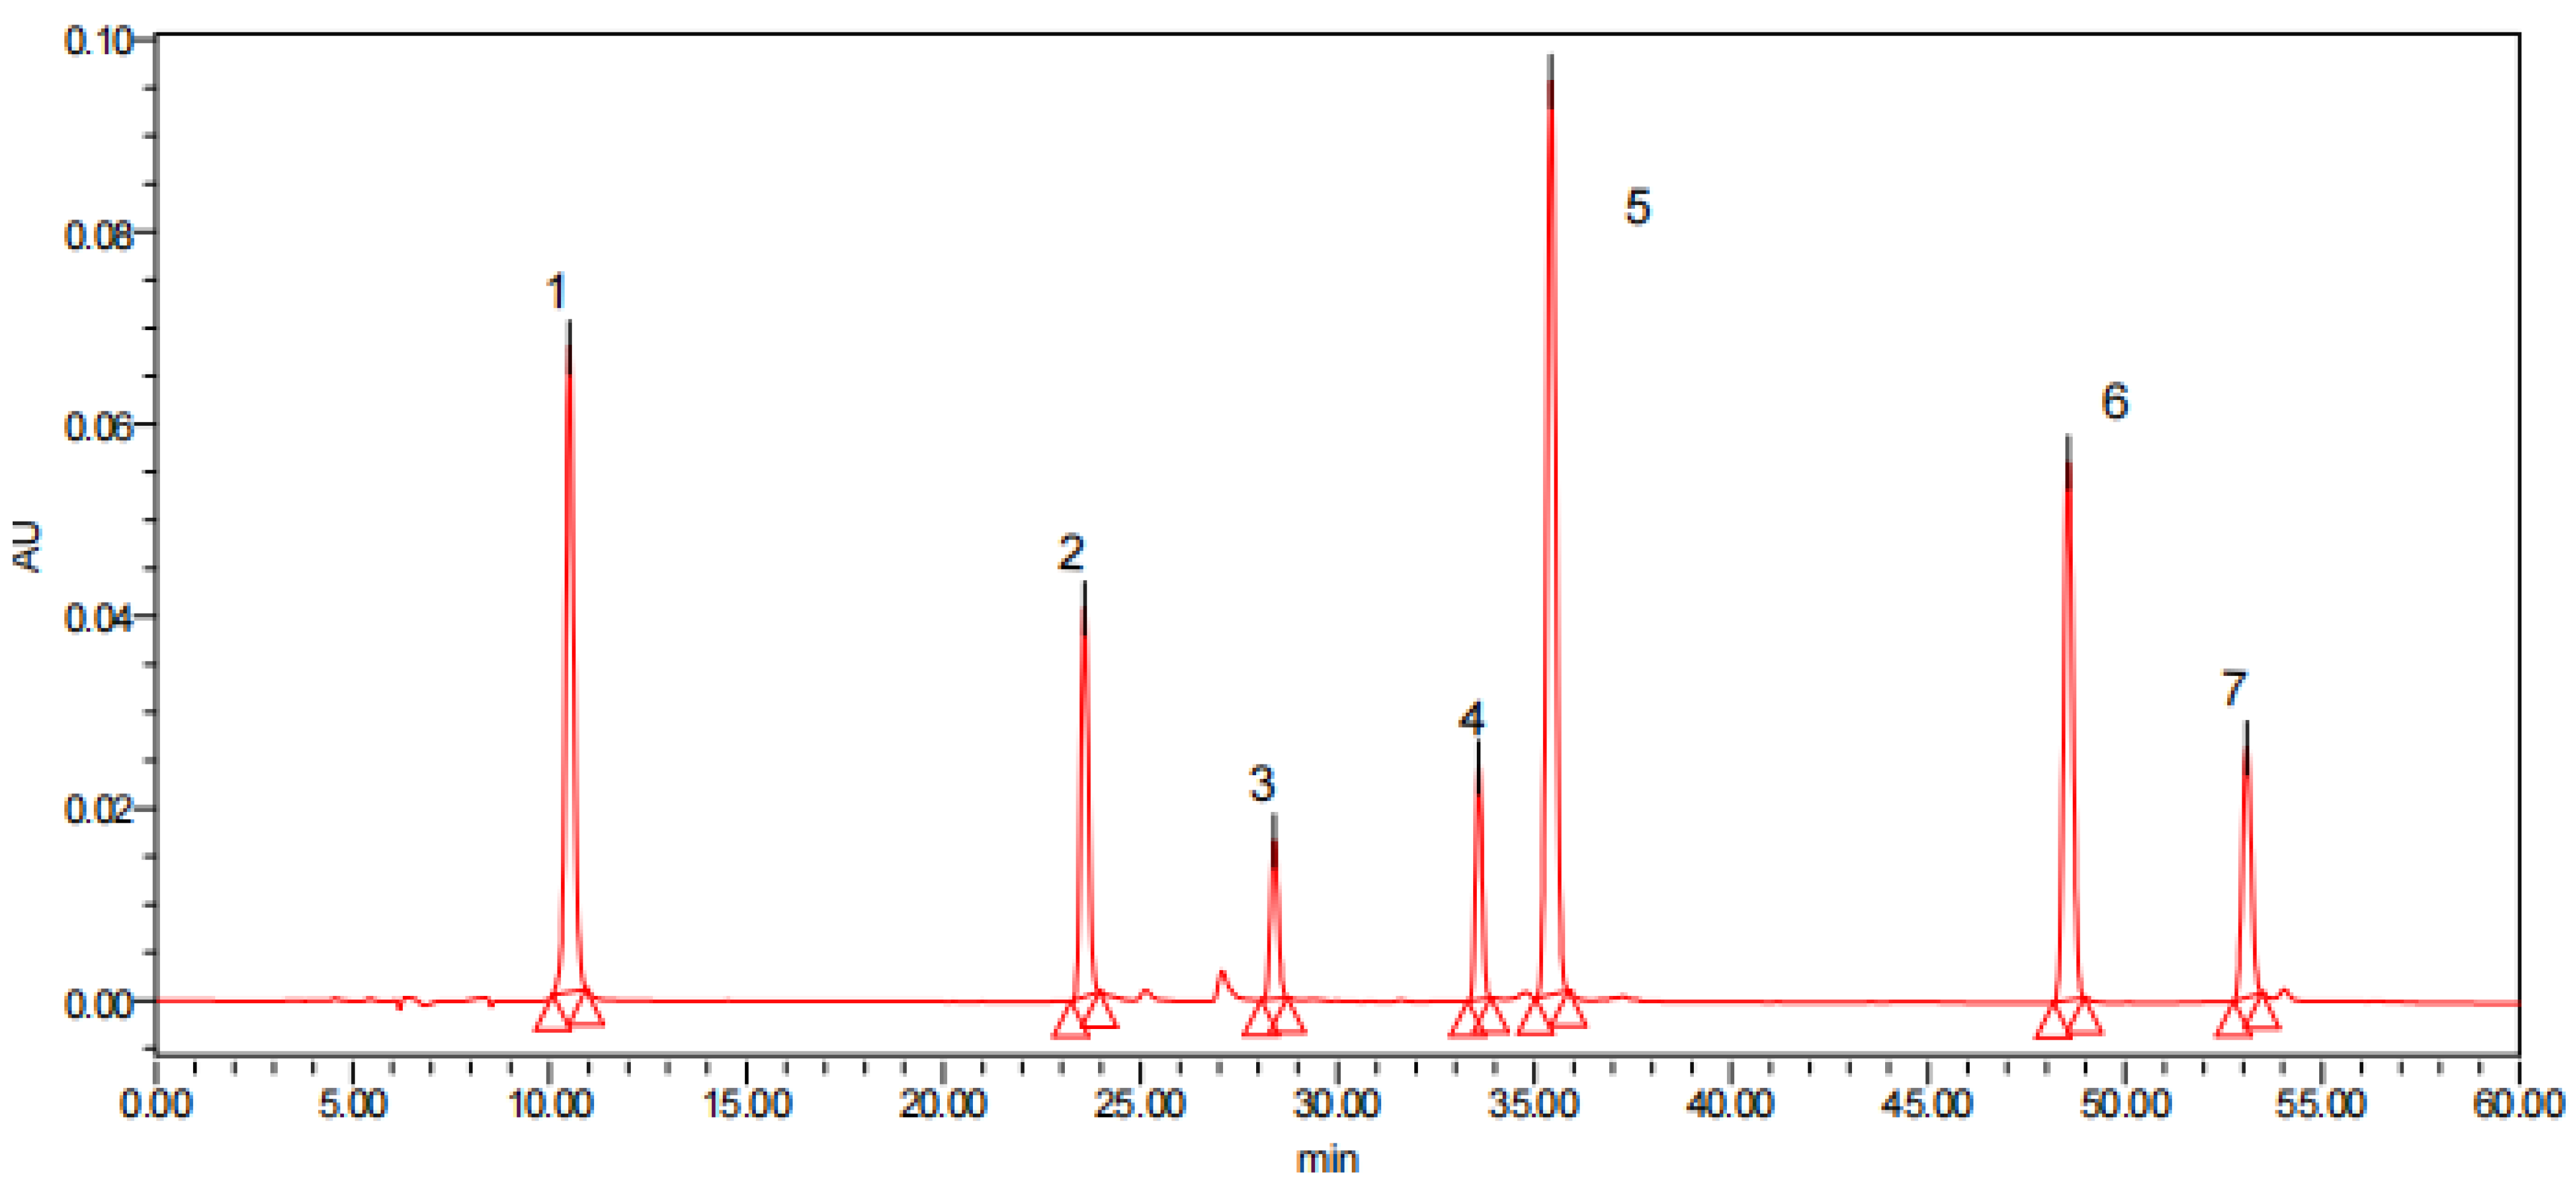
Figure 7.
HPLC pictures of 7 polyphenol standards and polyphenol compounds in different parts of Pleioblastus amarus (Keng) shell: 1. Gallic acid, 2. Chlorogenic, 3. Catechin, 4. Rutin, 5. P-Coumaric acid, 6. Resveratrol, and 7. Quercetin.
Figure 7.
HPLC pictures of 7 polyphenol standards and polyphenol compounds in different parts of Pleioblastus amarus (Keng) shell: 1. Gallic acid, 2. Chlorogenic, 3. Catechin, 4. Rutin, 5. P-Coumaric acid, 6. Resveratrol, and 7. Quercetin.
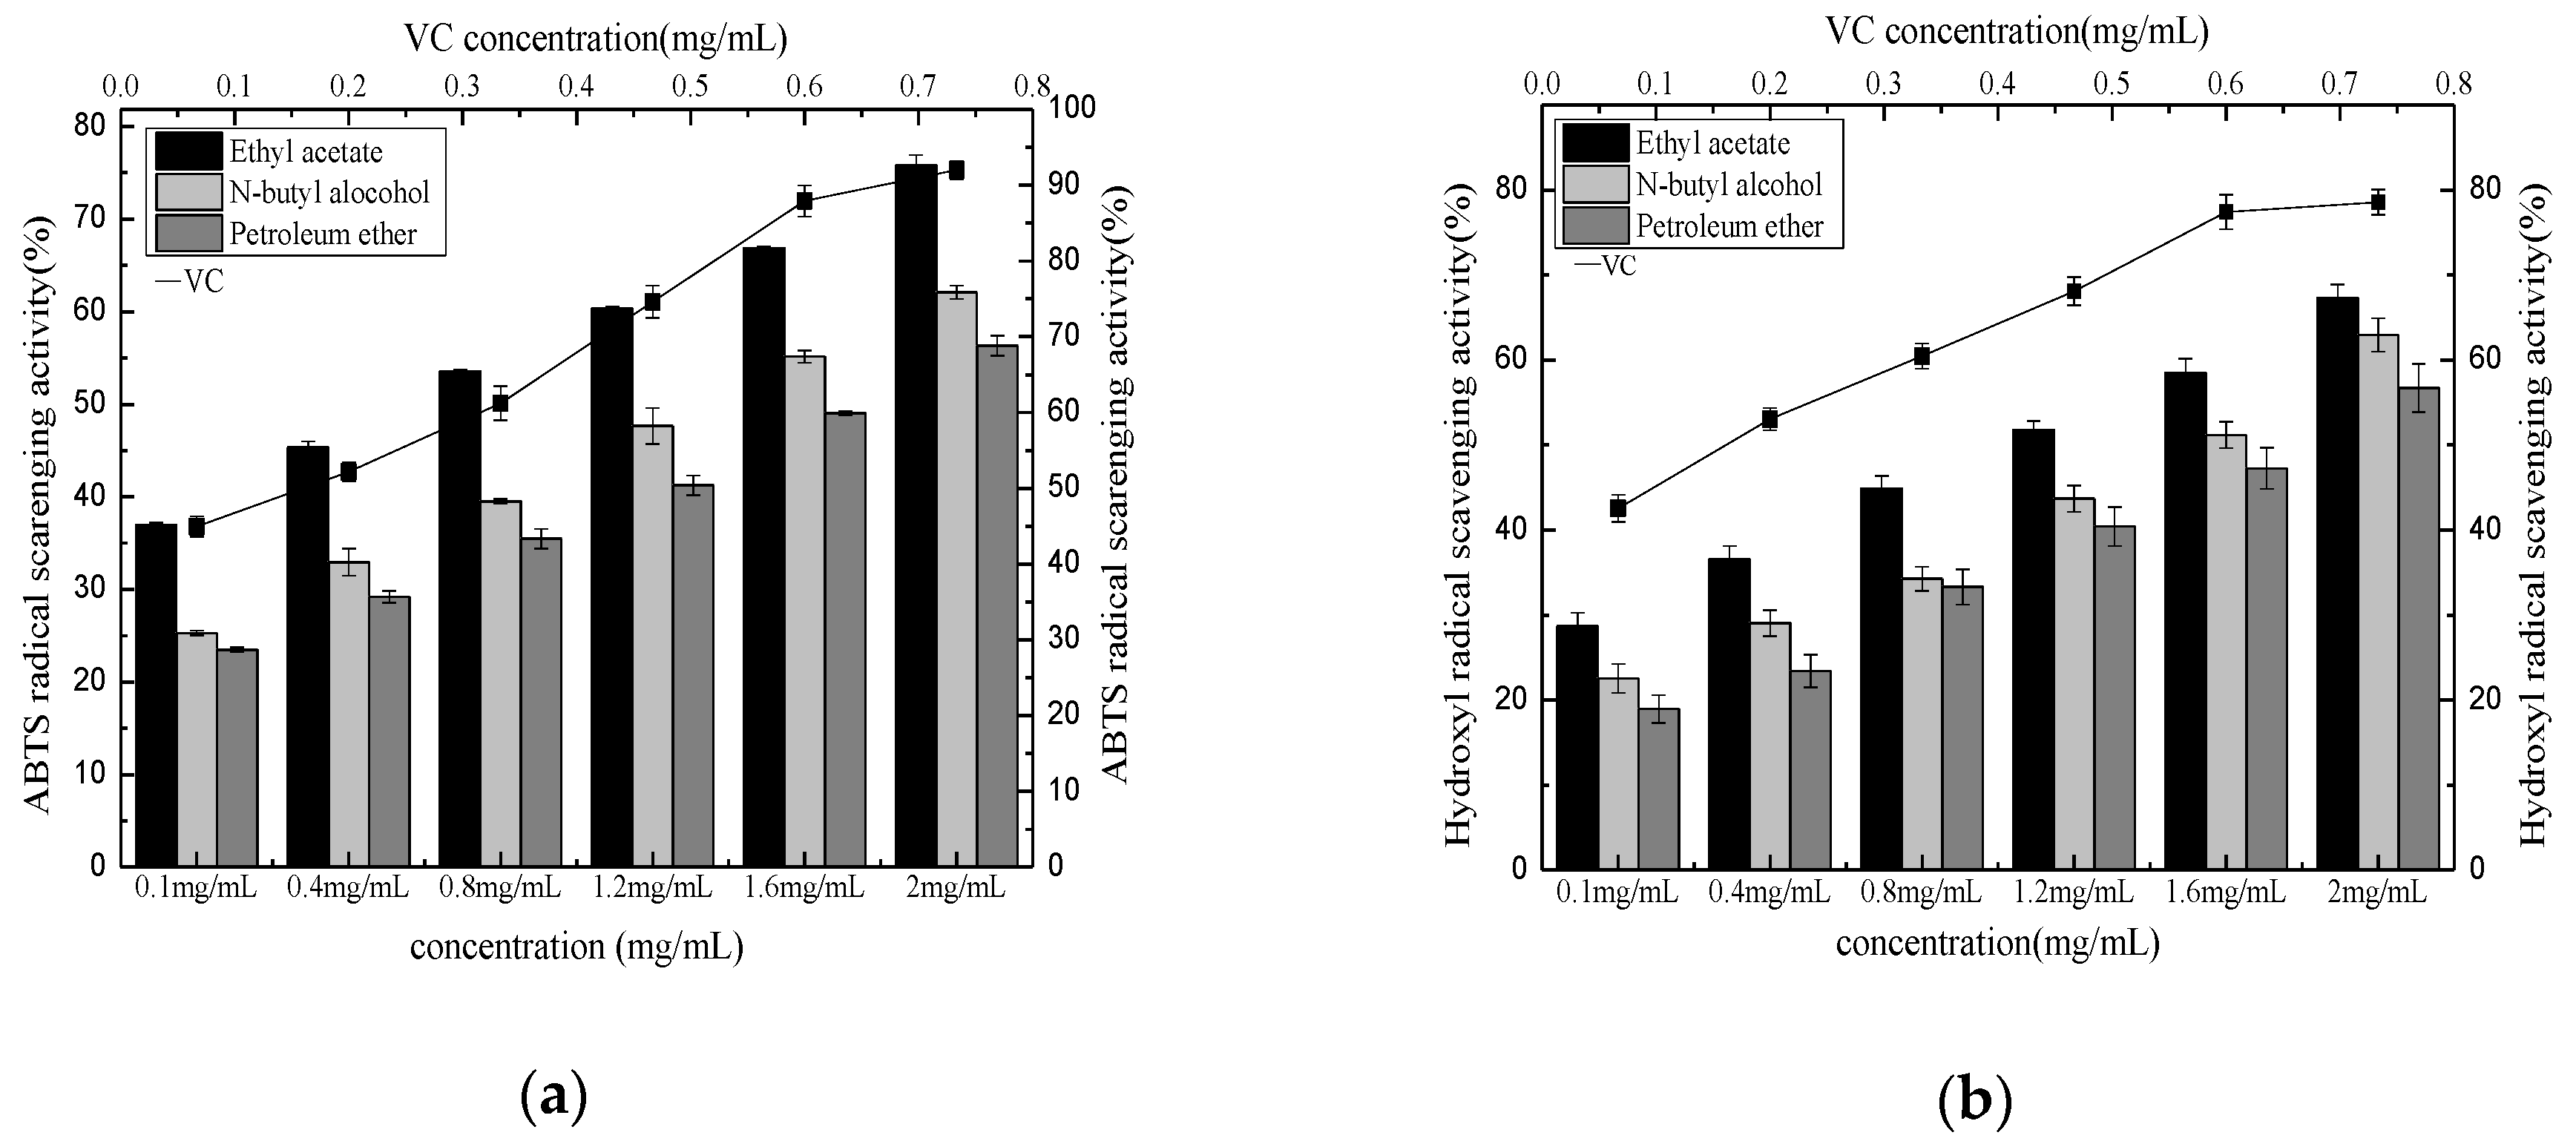
Figure 8.
ABTS+ free radical scavenging of different extraction phase (a) and hydroxyl radical scavenging activity of different extraction phase (b).
Figure 8.
ABTS+ free radical scavenging of different extraction phase (a) and hydroxyl radical scavenging activity of different extraction phase (b).
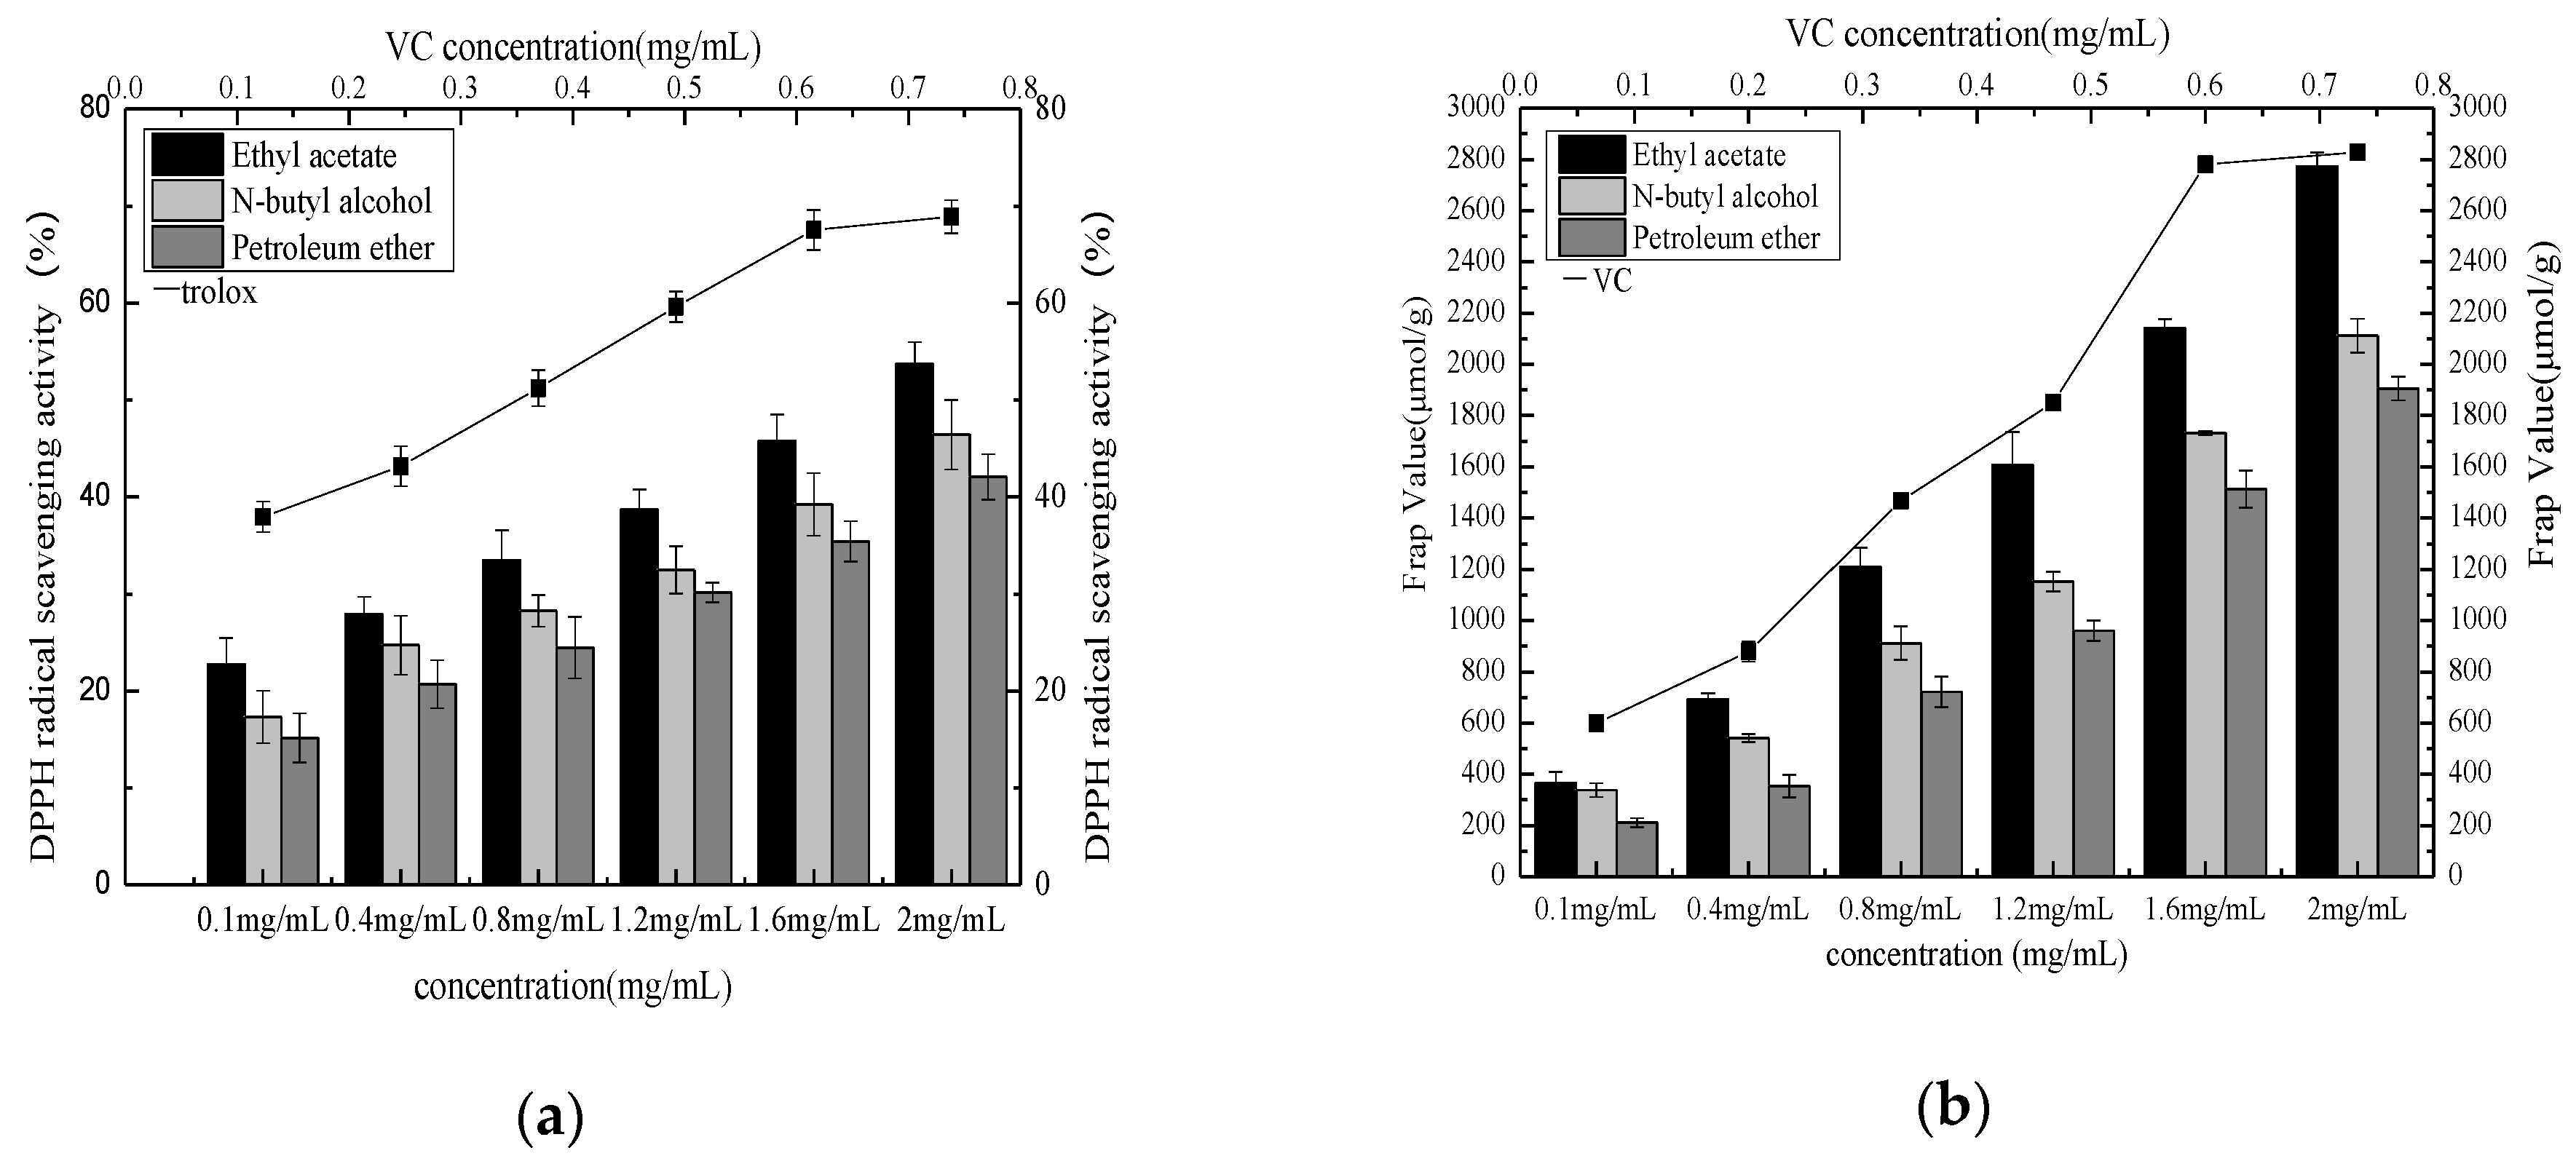
Figure 9.
DPPH radical scavenging activity of different extraction phases (a) and FRAP value of different extraction phase (b).
Figure 9.
DPPH radical scavenging activity of different extraction phases (a) and FRAP value of different extraction phase (b).
Table 1.
The coded values and corresponding actual values of the extraction parameters used in Plackett–Burman design (Ethanol solution).
Table 1.
The coded values and corresponding actual values of the extraction parameters used in Plackett–Burman design (Ethanol solution).
| Variable Code | Variable | Value |
|---|
| | | −1 | +1 |
| X1 | Ethanol concentration (/%) | 60 | 80 |
| X2 | Liquid to solid ratio (mL/g) | 10:1 | 30:1 |
| X3 | Extraction temperature (/°C) | 50 | 70 |
| X4 | Extraction time (/h) | 1 | 3 |
| X5 | Refluxing times | 1 | 5 |
Table 2.
Plackett–Burman experimental design matrix and results.
Table 2.
Plackett–Burman experimental design matrix and results.
| Experiment No. | Solid/
Solvent | Ethanol Concentration | Extraction
Time | Number of Reflows | Extraction Temperature | Total Phenolic
Compound |
|---|
| | | /% | /h | | /°C | /mg/g |
| 1 | 1 | 1 | −1 | 1 | 1 | 4.26 ± 0.007 |
| 2 | −1 | 1 | 1 | −1 | 1 | 2.77 ± 0.005 |
| 3 | 1 | −1 | 1 | 1 | −1 | 4.9 ± 0.004 |
| 4 | −1 | 1 | −1 | 1 | 1 | 3.52 ± 0.006 |
| 5 | −1 | −1 | 1 | −1 | 1 | 4.01 ± 0.007 |
| 6 | −1 | −1 | −1 | 1 | −1 | 4.84 ± 0.006 |
| 7 | 1 | −1 | −1 | −1 | 1 | 5.87 ± 0.007 |
| 8 | 1 | 1 | −1 | −1 | −1 | 5.29 ± 0.006 |
| 9 | 1 | 1 | 1 | −1 | −1 | 3.15 ± 0.005 |
| 10 | −1 | 1 | 1 | 1 | −1 | 3.06 ± 0.006 |
| 11 | 1 | −1 | 1 | 1 | 1 | 4.82 ± 0.005 |
| 12 | −1 | −1 | −1 | −1 | −1 | 4.99 ± 0.006 |
Table 3.
Regression coefficients and statistical significance in the fitted regression model based on Plackett–Burman design.
Table 3.
Regression coefficients and statistical significance in the fitted regression model based on Plackett–Burman design.
| Item | Coefficient Estimate | Sum of Squares | Mean Square | F-Value | p-Value | Significant |
|---|
| Model | 4.08 | 8.05 | 1.61 | 6.41 | 0.0213 | * |
| X1 | −0.43 | 2.26 | 2.26 | 9.02 | 0.0239 | * |
| X2 | 0.56 | 3.71 | 3.71 | 14.78 | 0.0085 | ** |
| X3 | −8.333 × 10−0.04 | 8.33 × 10−0.06 | 8.33 × 10−0.06 | 3.321 × 10−0.05 | 0.9956 | |
| X4 | −0.78 | 1.83 | 1.83 | 7.31 | 0.0354 | * |
| X5 | −0.14 | 0.24 | 0.24 | 0.97 | 0.3624 | |
Table 4.
Independent variables and their levels used for BBD.
Table 4.
Independent variables and their levels used for BBD.
| Factors | Coded Symbols | Levels |
|---|
| | | −1 | 0 | 1 |
| Liquid to solid ratio (mL/g) | A | 20:1 | 25:1 | 30:1 |
| Ethanol concentration (/%) | B | 70 | 75 | 80 |
| Extraction time (/h) | C | 1.5 | 2 | 2.5 |
Table 5.
Box–Behnken design (BBD) with the observed responses for yield of total phenolic.
Table 5.
Box–Behnken design (BBD) with the observed responses for yield of total phenolic.
| Experiment No. | Liquid to Solid Ratio | Extraction Concentration | Extraction Time | Total Phenolic Compound |
|---|
| | /mL/g | /% | /h | /mg/g |
|---|
| 1 | 20:1 | 80 | 2.5 | 5.30 |
| 2 | 25:1 | 75 | 1.5 | 4.80 |
| 3 | 20:1 | 80 | 1.5 | 4.16 |
| 4 | 20:1 | 75 | 2 | 7.22 |
| 5 | 20:1 | 70 | 1.5 | 5.01 |
| 6 | 15:1 | 70 | 2 | 5.58 |
| 7 | 20:1 | 75 | 2 | 7.01 |
| 8 | 25:1 | 80 | 2 | 4.65 |
| 9 | 20:1 | 75 | 2 | 7.02 |
| 10 | 20:1 | 70 | 2.5 | 4.96 |
| 11 | 20:1 | 75 | 2 | 7.35 |
| 12 | 15:1 | 75 | 2.5 | 5.74 |
| 13 | 25:1 | 70 | 2 | 4.55 |
| 14 | 25:1 | 75 | 2.5 | 4.86 |
| 15 | 15:1 | 80 | 2 | 4.68 |
| 16 | 15:1 | 75 | 1.5 | 4.83 |
| 17 | 20:1 | 75 | 2 | 7.30 |
| X5 | −0.14 | 0.24 | 0.24 | 0.97 | 0.3624 |
Table 6.
Analysis of variance (ANOVA) for the experimental results obtained by Box–Behken response surface design.
Table 6.
Analysis of variance (ANOVA) for the experimental results obtained by Box–Behken response surface design.
| Source | Sum of Squares | Df | Mean Square | F-Value | p-Value | Significant |
|---|
| Model | 20.05 | 9 | 2.23 | 137.99 | <0.0001 | ** |
| A Liquid to solid ratio | 0.48 | 1 | 0.48 | 29.94 | 0.0009 | ** |
| B Ethanol concentration | 0.22 | 1 | 0.22 | 13.49 | 0.0079 | ** |
| C Extraction temperature | 0.53 | 1 | 0.53 | 32.52 | 0.0007 | ** |
| AB | 0.25 | 1 | 0.25 | 15.76 | 0.0054 | ** |
| AC | 0.19 | 1 | 0.19 | 11.46 | 0.0117 | ** |
| BC | 0.34 | 1 | 0.34 | 21.29 | 0.0024 | ** |
| A2 | 4.70 | 1 | 4.70 | 290.84 | <0.0001 | ** |
| B2 | 6.68 | 1 | 6.68 | 413.84 | <0.0001 | ** |
| C2 | 4.78 | 1 | 4.78 | 296.20 | <0.0001 | ** |
| Error | 0.11 | 7 | 0.016 | | | |
| Lack of fit | 0.015 | 3 | 0.0049 | 0.20 | 0.8913 | Not Significant |
| Pur error | 0.098 | 4 | 0.025 | | | |
| Cor total | 20.17 | 16 | | | | |
| R2 | 0.9944 | R2Adj | 0.9872 | | | |
Table 7.
Repeat verification experiment results.
Table 7.
Repeat verification experiment results.
| No. | Total Phenolic Compounds | Relative Error |
| 1 | 7.184 | 0.15% |
| 2 | 7.208 | 0.13% |
| 3 | 7.204 | 0.16% |
Table 8.
HPLC profile information of 7 phenolic substances.
Table 8.
HPLC profile information of 7 phenolic substances.
| Proof Sample | Standard Curve | Correlation Coefficient
/(R2) | Range of Linearity/(g/L) | Retention Time
/min |
|---|
| Gallic acid | y = 5 × 10⁷x + 639,963 | 0.9991 | 0.05~1.0 | 10.505 |
| Chlorogenic acid | y = 6 × 10⁶x + 87,892 | 0.9987 | 0.05~1.0 | 23.581 |
| Catechin | y = 9 × 10⁶x – 101,397 | 0.9987 | 0.05~0.5 | 28.400 |
| p-Coumaric acid | y = 8 × 10⁷x + 85,175 | 0.9992 | 0.05~0.5 | 33.420 |
| qQuercetin | y = 3 × 10⁷x – 169,274 | 0.9999 | 0.05~1.0 | 53.087 |
| Rutin | y = 1 × 10⁷x − 175,176 | 0.9994 | 0.05~0.5 | 33.594 |
| Resveratrol | y = 1 × 10⁷x + 141,003 | 0.9995 | 0.05~1.0 | 48.559 |
Table 9.
Scavenging effect of Pleioblastus amarus (Keng) shell with different extraction phases on ABTS+ free radical.
Table 9.
Scavenging effect of Pleioblastus amarus (Keng) shell with different extraction phases on ABTS+ free radical.
| Extract Phases | Equation of Linear Regression | R2 | IC50 |
|---|
| Ethyl acetate | y = 19.595x + 36.543 | R² = 0.9939 | 0.169 ± 0.001 c |
| N-butyl alcohol | y = 19.132x + 24.327 | R² = 0.9976 | 0.350 ± 0.003 a |
| Petroleum ether | y = 16.99x + 21.86 | R² = 0.998 | 0.370 ± 0.002 a |
| VC | y = 26.378x + 42.007 | R² = 0.9858 | 0.150 ± 0.002 b |
Table 10.
Hydroxyl radical scavenging activity of Pleioblastus amarus (Keng) shell with different extraction phases on hydroxyl radical.
Table 10.
Hydroxyl radical scavenging activity of Pleioblastus amarus (Keng) shell with different extraction phases on hydroxyl radical.
| Extract Phases | Equation of Linear Regression | R2 | IC50 |
|---|
| Ethyl acetate | y = 19.644x + 27.979 | R² = 0.9956 | 0.289 ± 0.001 c |
| N-butyl alcohol | y = 20.618x + 19.66 | R² = 0.9889 | 0.573 ± 0.002 b |
| Petroleum ether | y = 19.823x + 16.531 | R² = 0.9966 | 0.597 ± 0.003 a |
| VC | y = 21.834x + 42.328 | R² = 0.9931 | 0.021 ± 0.002 d |
Table 11.
Scavenging effect of Pleioblastus amarus (Keng) shell with different extraction phases on DPPH free radical.
Table 11.
Scavenging effect of Pleioblastus amarus (Keng) shell with different extraction phases on DPPH free radical.
| Extract Phases | Equation of Linear Regression | R2 | IC50 |
|---|
| Ethyl acetate | y = 15.829x + 20.968 | R² = 0.9948 | 0.372 ± 0.002 c |
| N-butyl alcohol | y = 14.287x + 16.89 | R² = 0.9832 | 0.443 ± 0.004 b |
| Petroleum ether | y = 13.644x + 14.135 | R² = 0.9948 | 0.506 ± 0.002 a |
| Trolox | y = 21.241x + 34.813 | R² = 0.9949 | 0.219 ± 0.003 d |
Table 12.
FRAP values of Pleioblastus amarus (Keng) shell with different extraction phases.
Table 12.
FRAP values of Pleioblastus amarus (Keng) shell with different extraction phases.
| Extract Phases | Equation of Linear Regression | R2 | IC50 |
|---|
| Ethyl acetate | y = 942.09x + 173.71 | R² = 0.9856 | 1.029 ± 0.003 c |
| N-butyl alcohol | y =1243.5x + 200.79 | R² = 0.9954 | 1.034 ± 0.002 b |
| Petroleum ether | y = 906.61x + 22.764 | R² = 0.9816 | 1.038 ± 0.001 a |
| VC | y = 1277.6x + 435.3 | R² = 0.9688 | 0.937 ± 0.002 d |


